

CryptoJargon69
1.9k 貼文

CryptoJargon69
 達人認證
舉報
封鎖用戶
6 關注
1.6K+ 粉絲
652 點讚數
貼文
全部
影片
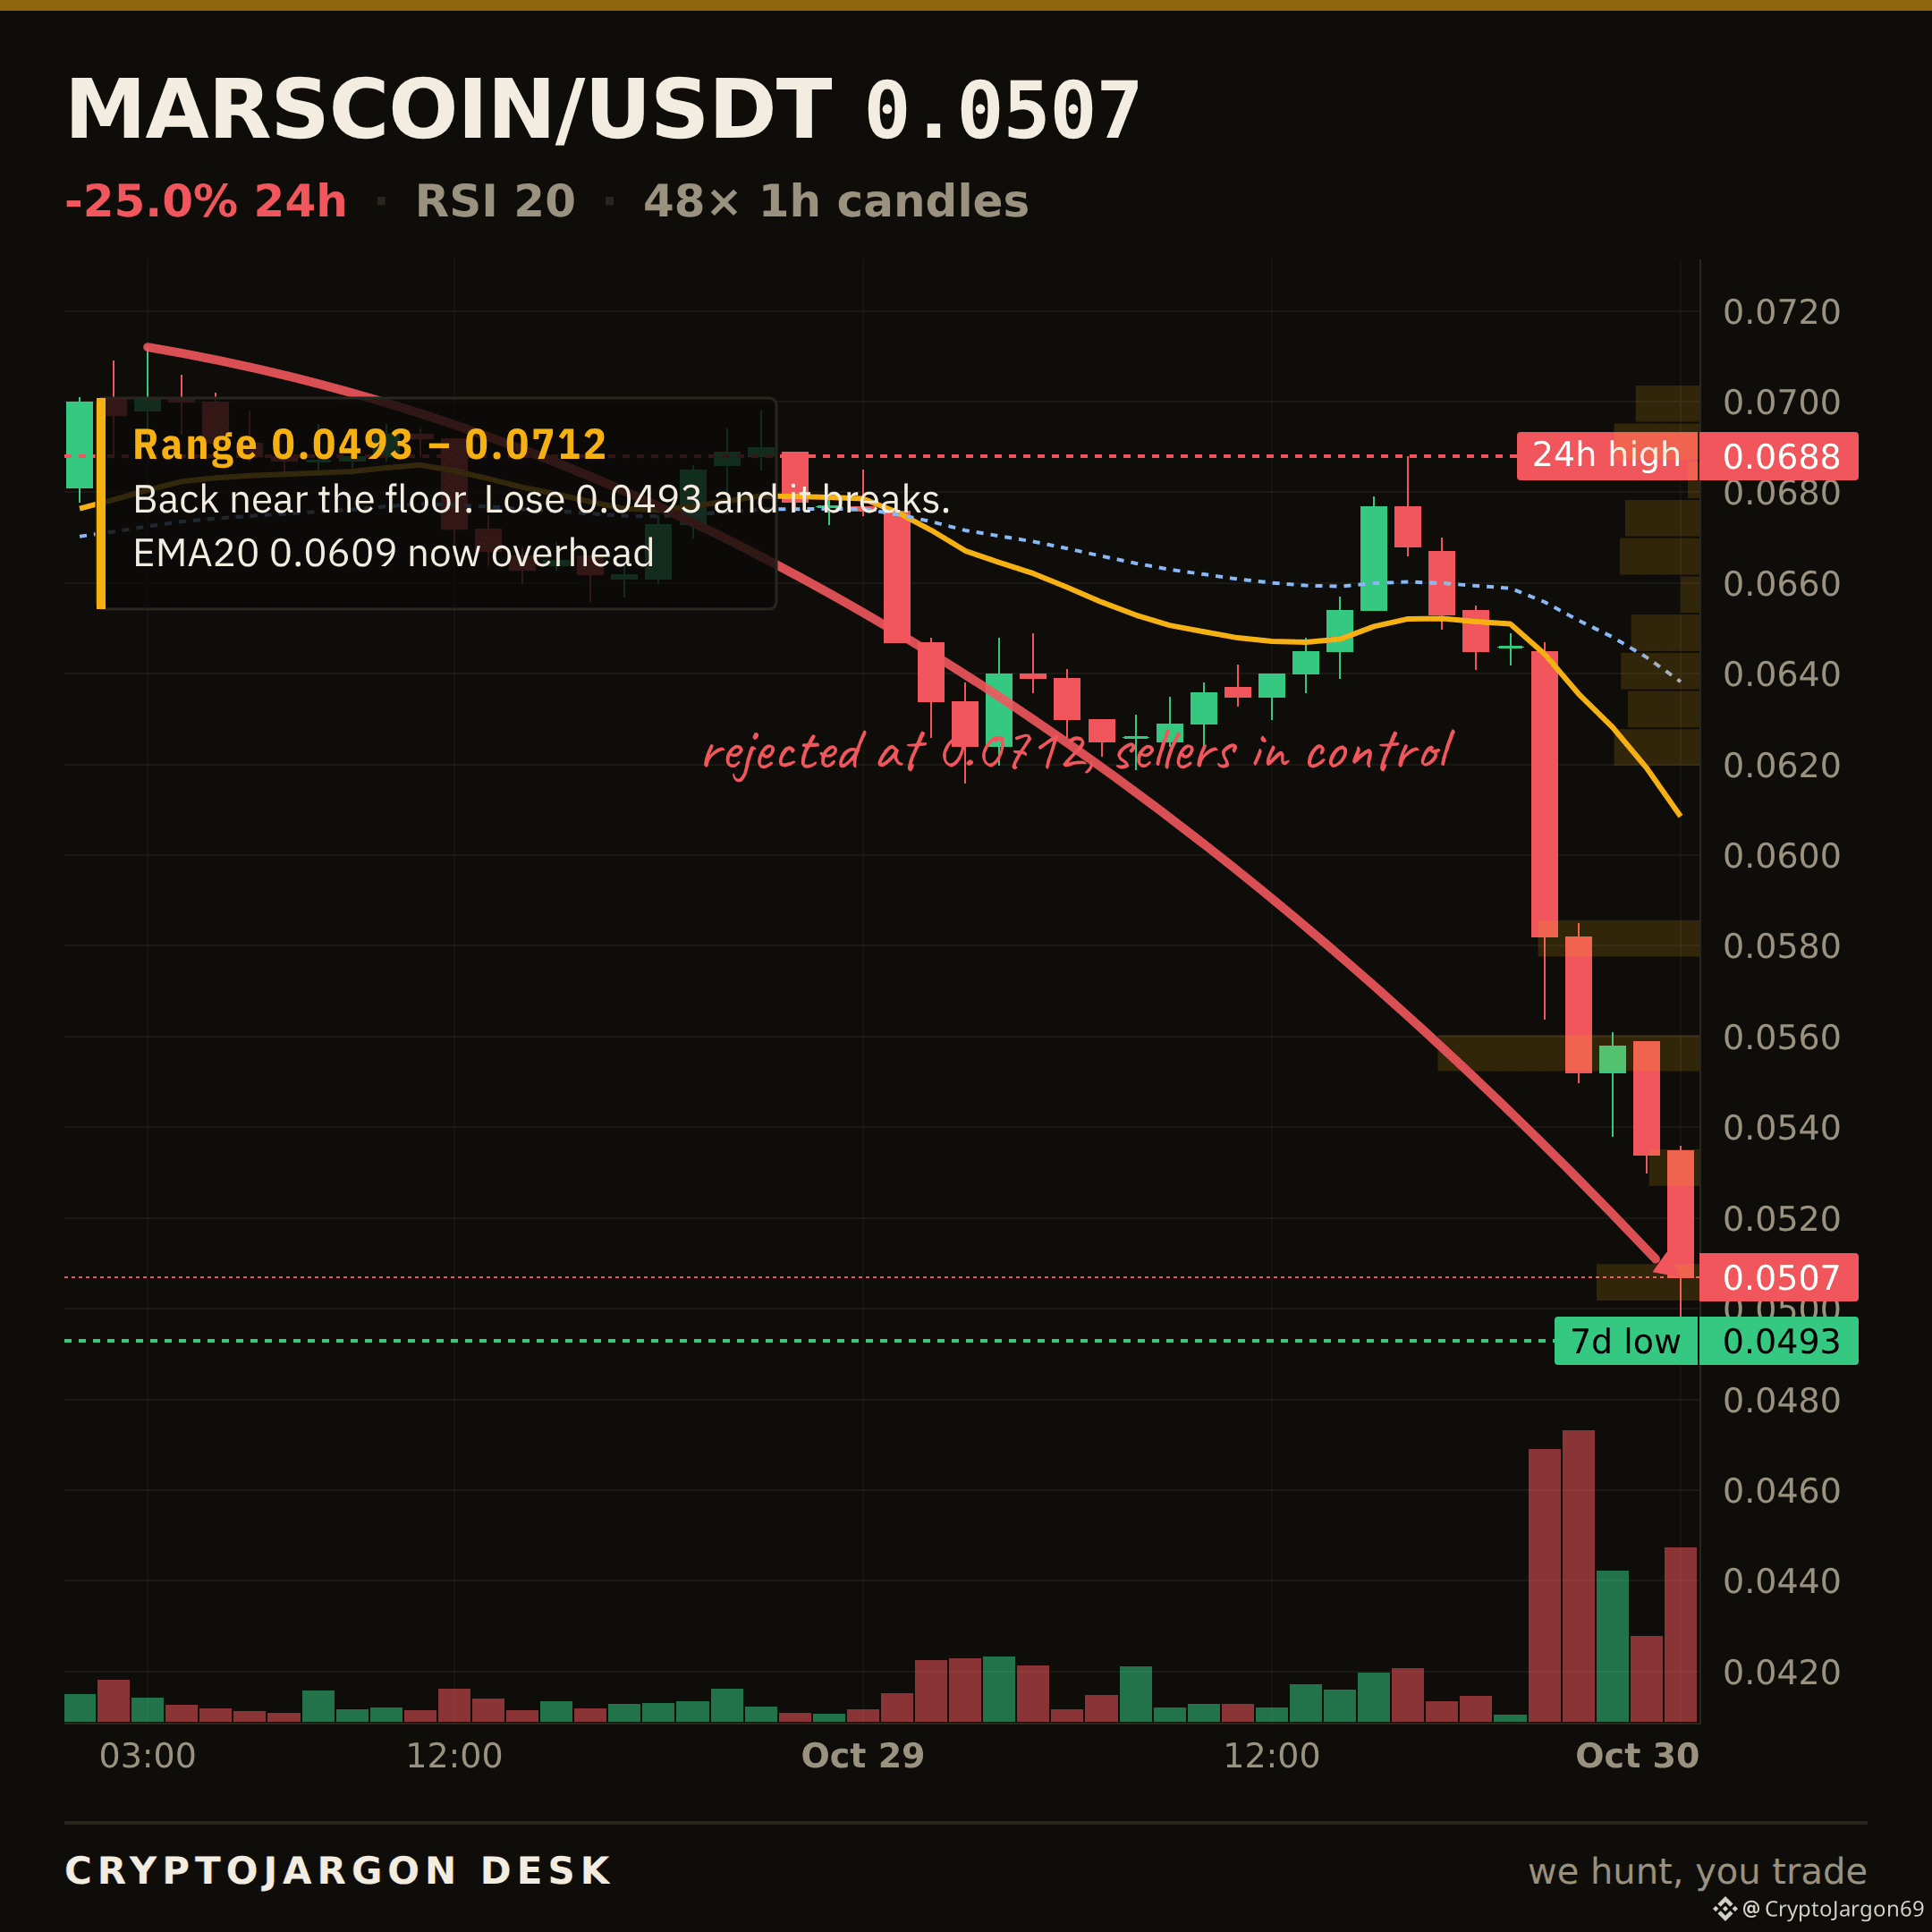
MARSCOIN下跌25.1%,成交量達1200萬美元,跌破了整個7日區間。
價格目前正處於絕對低點0.0493。14日RSI爲20,從技術面來看已深度超賣,但趨勢顯然已經走壞,價格遠低於0.0609的20日移動平均線。
RSI說買入,盤面卻說賣出。到底誰在說謊?
$MARSCOIN
本賬號全天持續發佈動態。關注我,及時瞭解最新消息。
MARSCOIN下跌25.1%,成交量達1200萬美元,跌破了整個7日區間。
價格目前正處於絕對低點0.0493。14日RSI爲20,從技術面來看已深度超賣,但趨勢顯然已經走壞,價格遠低於0.0609的20日移動平均線。
RSI說買入,盤面卻說賣出。到底誰在說謊?
$MARSCOIN
本賬號全天持續發佈動態。關注我,及時瞭解最新消息。
價格目前正處於絕對低點0.0493。14日RSI爲20,從技術面來看已深度超賣,但趨勢顯然已經走壞,價格遠低於0.0609的20日移動平均線。
RSI說買入,盤面卻說賣出。到底誰在說謊?
$MARSCOIN
本賬號全天持續發佈動態。關注我,及時瞭解最新消息。
12
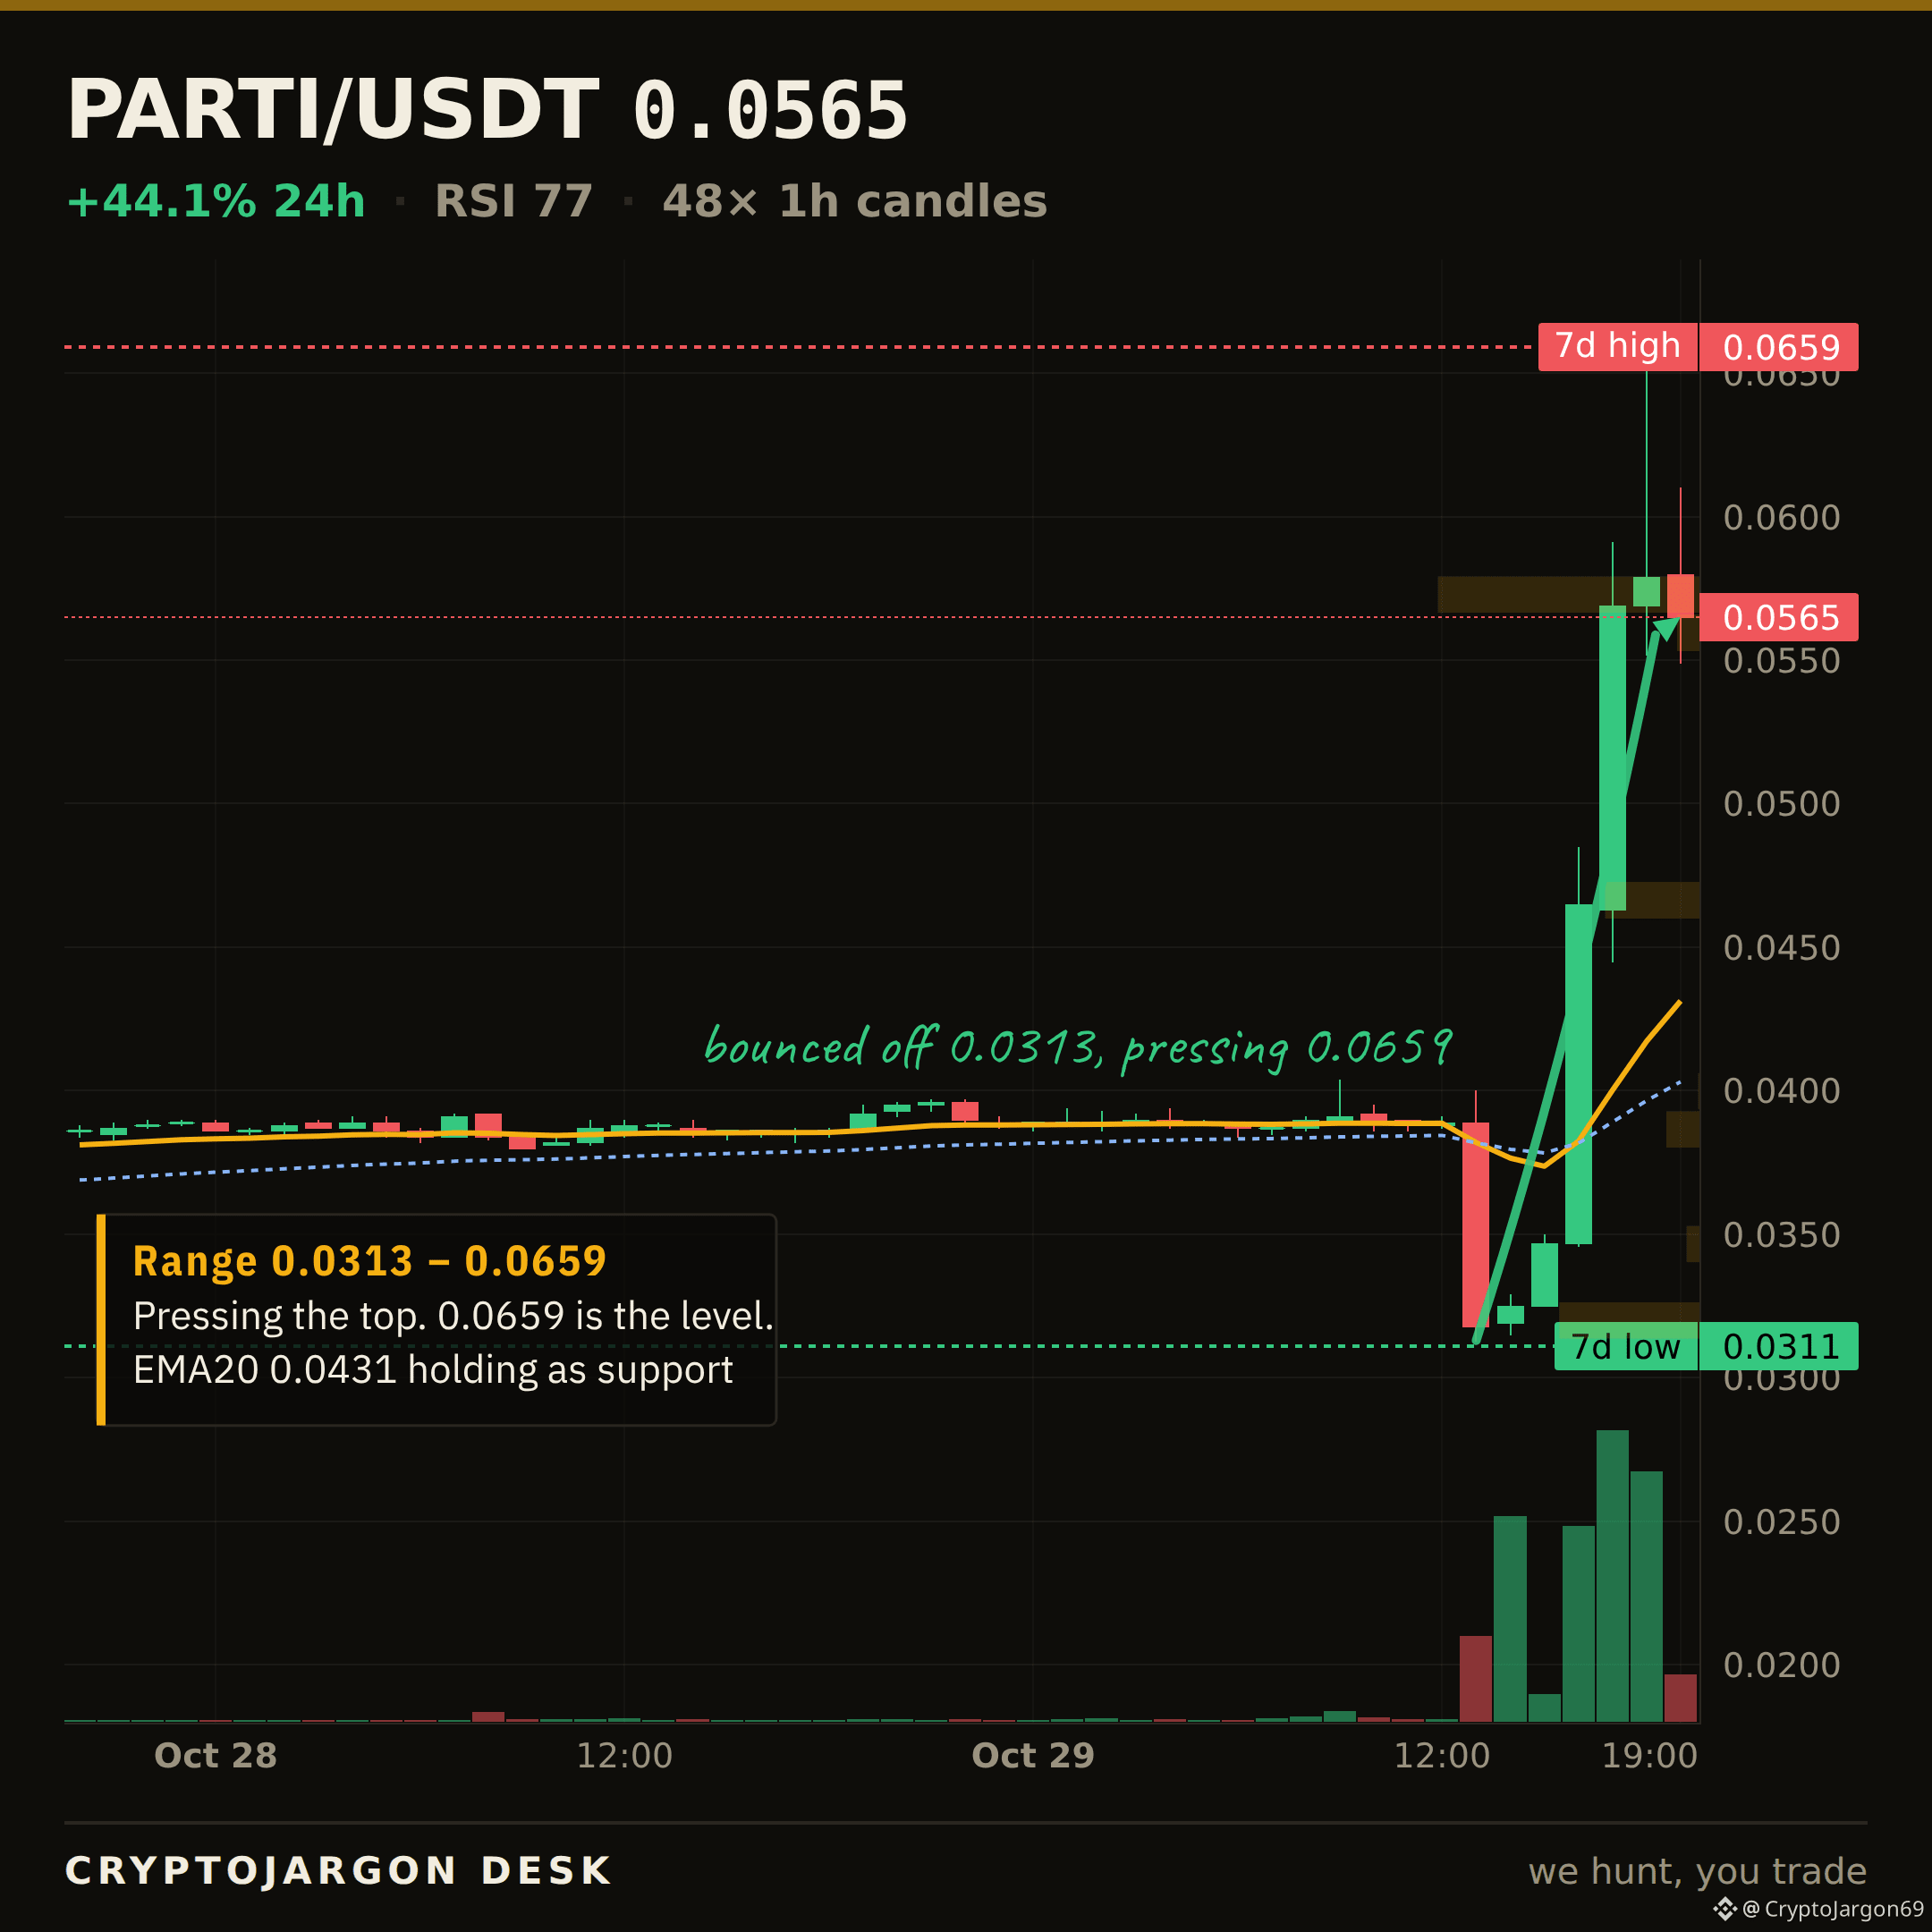
PARTI 上漲 48.8% 後,RSI(14) 達到 81。
過去 7 天的全部波動都發生在最近 24 小時內,價格從 0.0313 漲至 0.0659 的高點,成交量達 2900 萬美元。這是一波垂直拉昇。典型的超買行情,但價格穩穩地站在 0.0433 的 EMA20 上方,這正是短期強勢的定義。
你會逆着 81 的 RSI 做空,還是相信趨勢爲友,直到最後?
$PARTI
關注我,獲取下一次解讀——行情一動,我就發佈。
PARTI 上漲 48.8% 後,RSI(14) 達到 81。
過去 7 天的全部波動都發生在最近 24 小時內,價格從 0.0313 漲至 0.0659 的高點,成交量達 2900 萬美元。這是一波垂直拉昇。典型的超買行情,但價格穩穩地站在 0.0433 的 EMA20 上方,這正是短期強勢的定義。
你會逆着 81 的 RSI 做空,還是相信趨勢爲友,直到最後?
$PARTI
關注我,獲取下一次解讀——行情一動,我就發佈。
過去 7 天的全部波動都發生在最近 24 小時內,價格從 0.0313 漲至 0.0659 的高點,成交量達 2900 萬美元。這是一波垂直拉昇。典型的超買行情,但價格穩穩地站在 0.0433 的 EMA20 上方,這正是短期強勢的定義。
你會逆着 81 的 RSI 做空,還是相信趨勢爲友,直到最後?
$PARTI
關注我,獲取下一次解讀——行情一動,我就發佈。
57
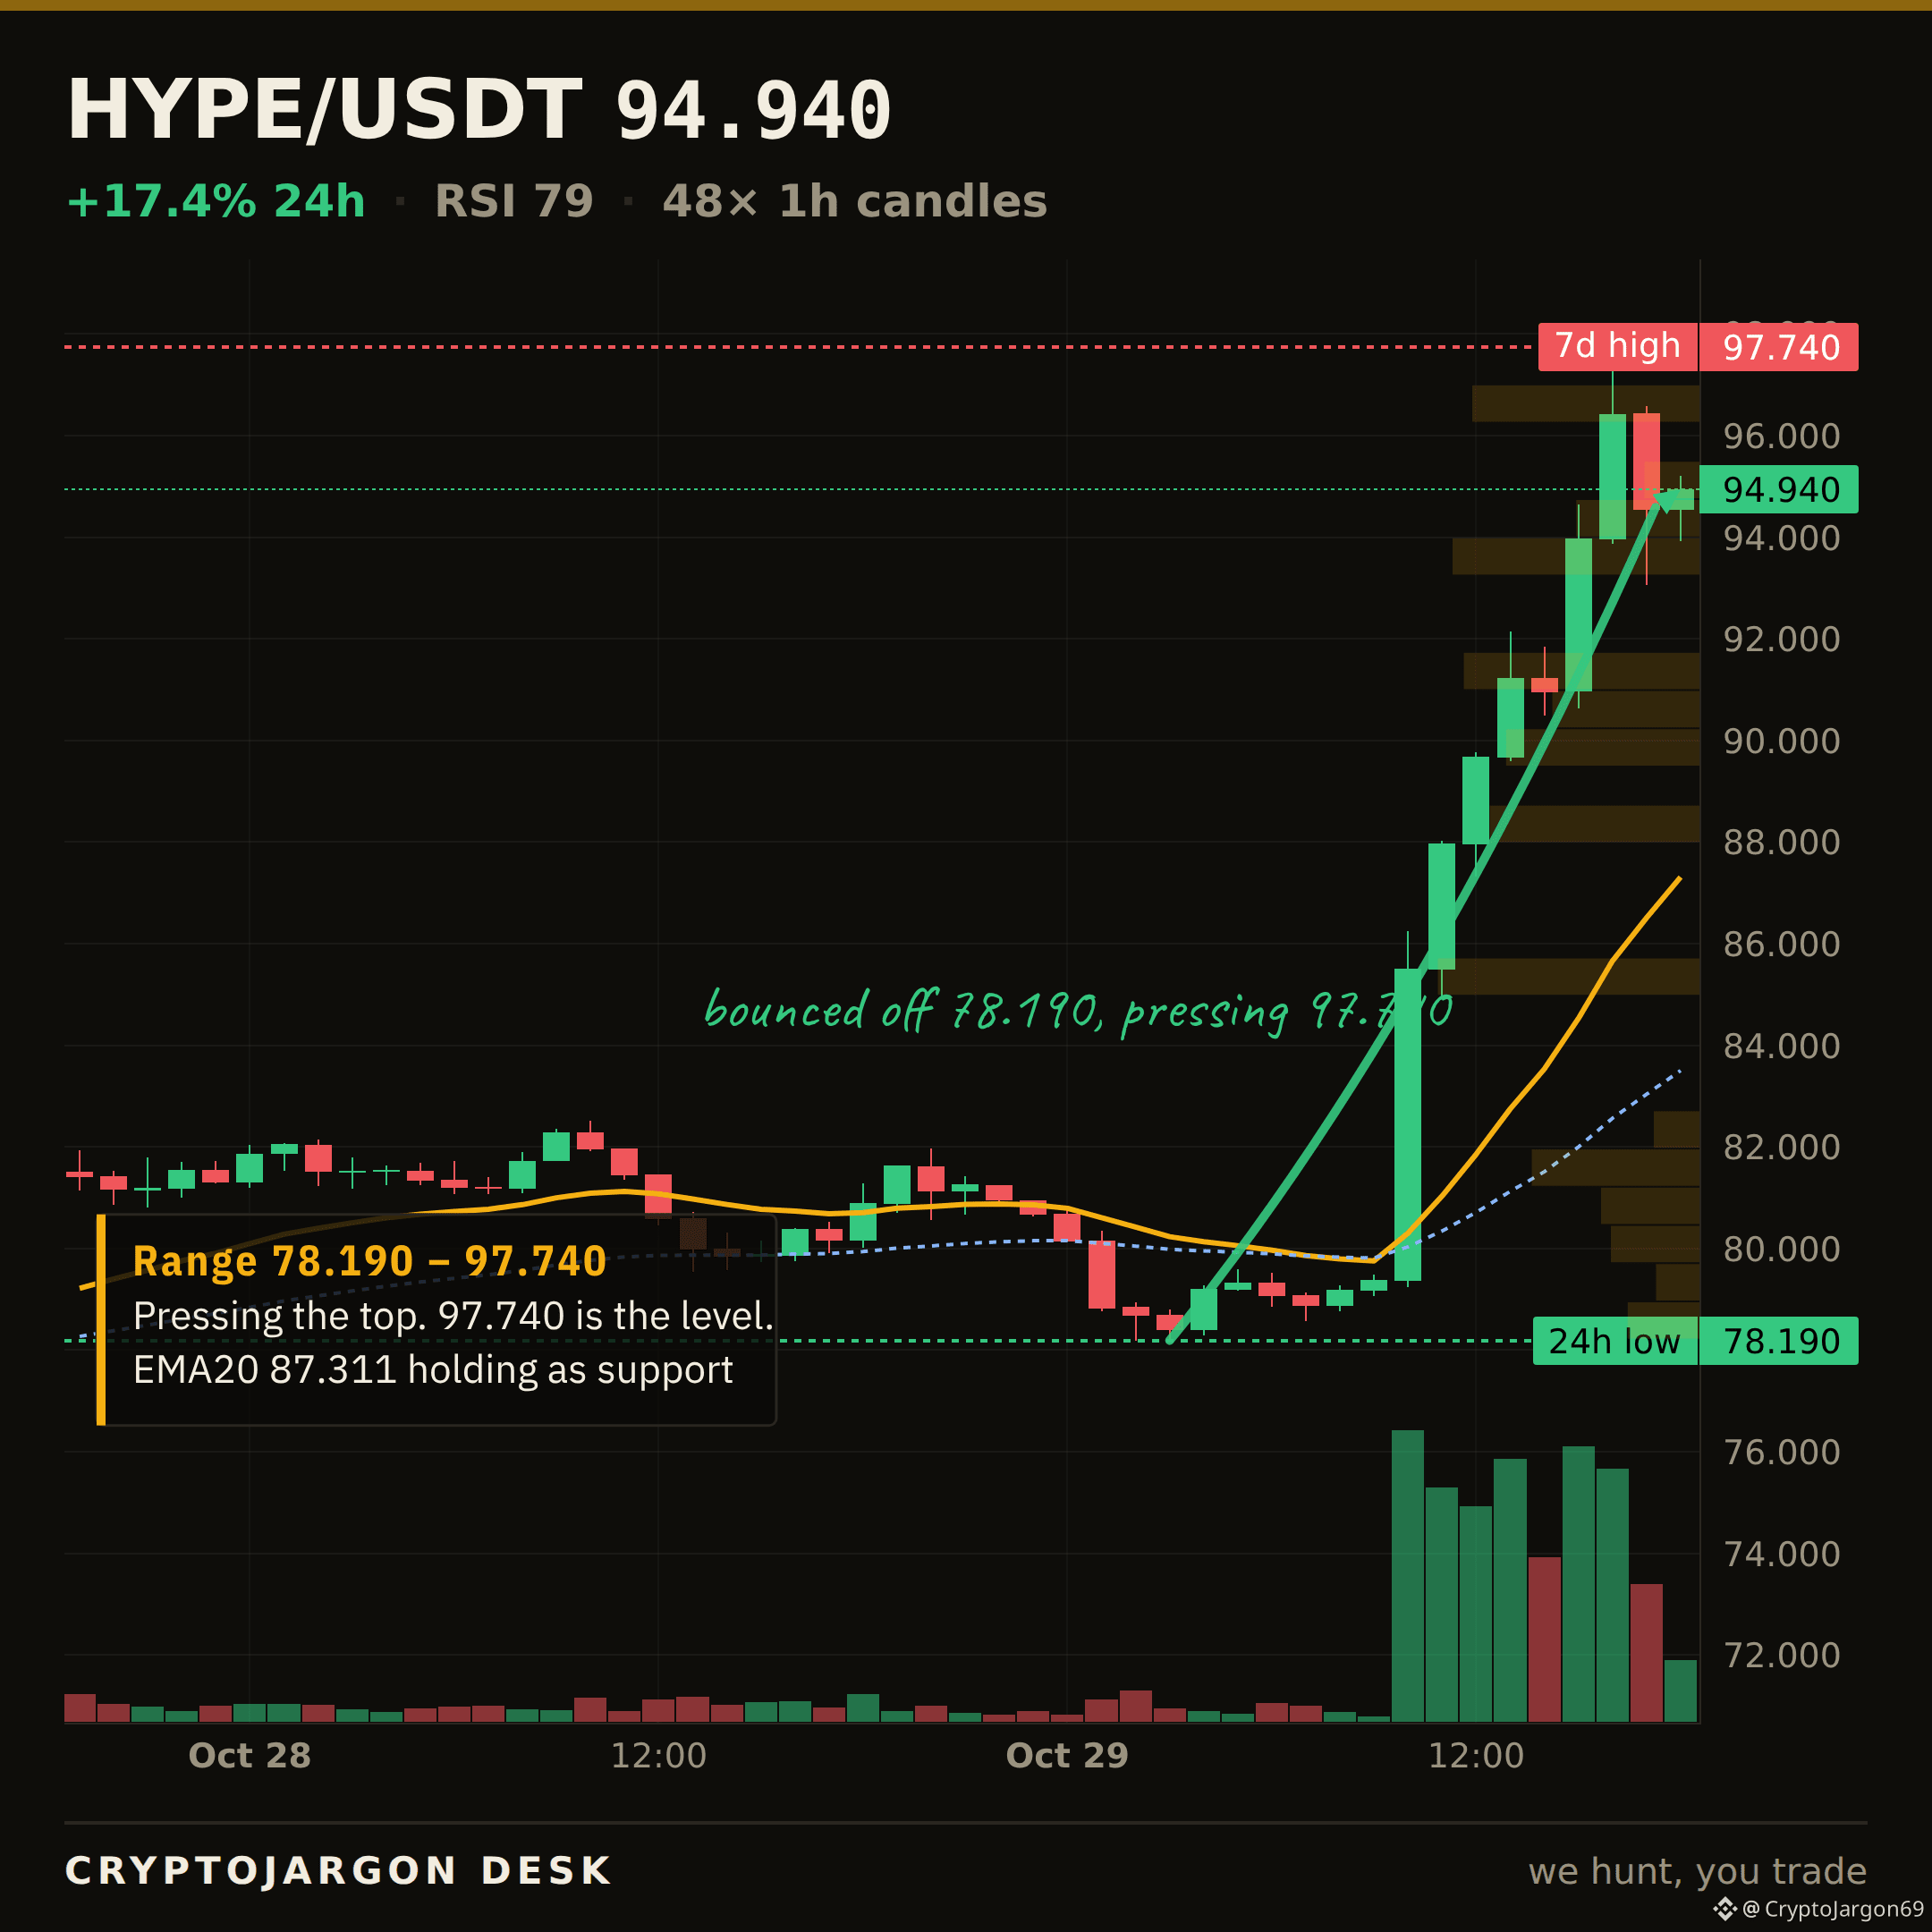
紐交所的所有者正與 Hyperliquid 探討在美國推出永續合約。
消息傳出後,HYPE 立即飆漲 17.5%,報 95.05 美元,成交額達 1.22 億美元,一舉突破本週高點。
這幾乎就是機構認可的最有力證明了。然而,14 日 RSI 已升至 80,嚴重超買。消息面看漲,圖表卻提示逢高賣出。
到底哪邊在說謊?
$HYPE
我們每天都會持續發帖。如果覺得有用,歡迎關注。
紐交所的所有者正與 Hyperliquid 探討在美國推出永續合約。
消息傳出後,HYPE 立即飆漲 17.5%,報 95.05 美元,成交額達 1.22 億美元,一舉突破本週高點。
這幾乎就是機構認可的最有力證明了。然而,14 日 RSI 已升至 80,嚴重超買。消息面看漲,圖表卻提示逢高賣出。
到底哪邊在說謊?
$HYPE
我們每天都會持續發帖。如果覺得有用,歡迎關注。
消息傳出後,HYPE 立即飆漲 17.5%,報 95.05 美元,成交額達 1.22 億美元,一舉突破本週高點。
這幾乎就是機構認可的最有力證明了。然而,14 日 RSI 已升至 80,嚴重超買。消息面看漲,圖表卻提示逢高賣出。
到底哪邊在說謊?
$HYPE
我們每天都會持續發帖。如果覺得有用,歡迎關注。
30
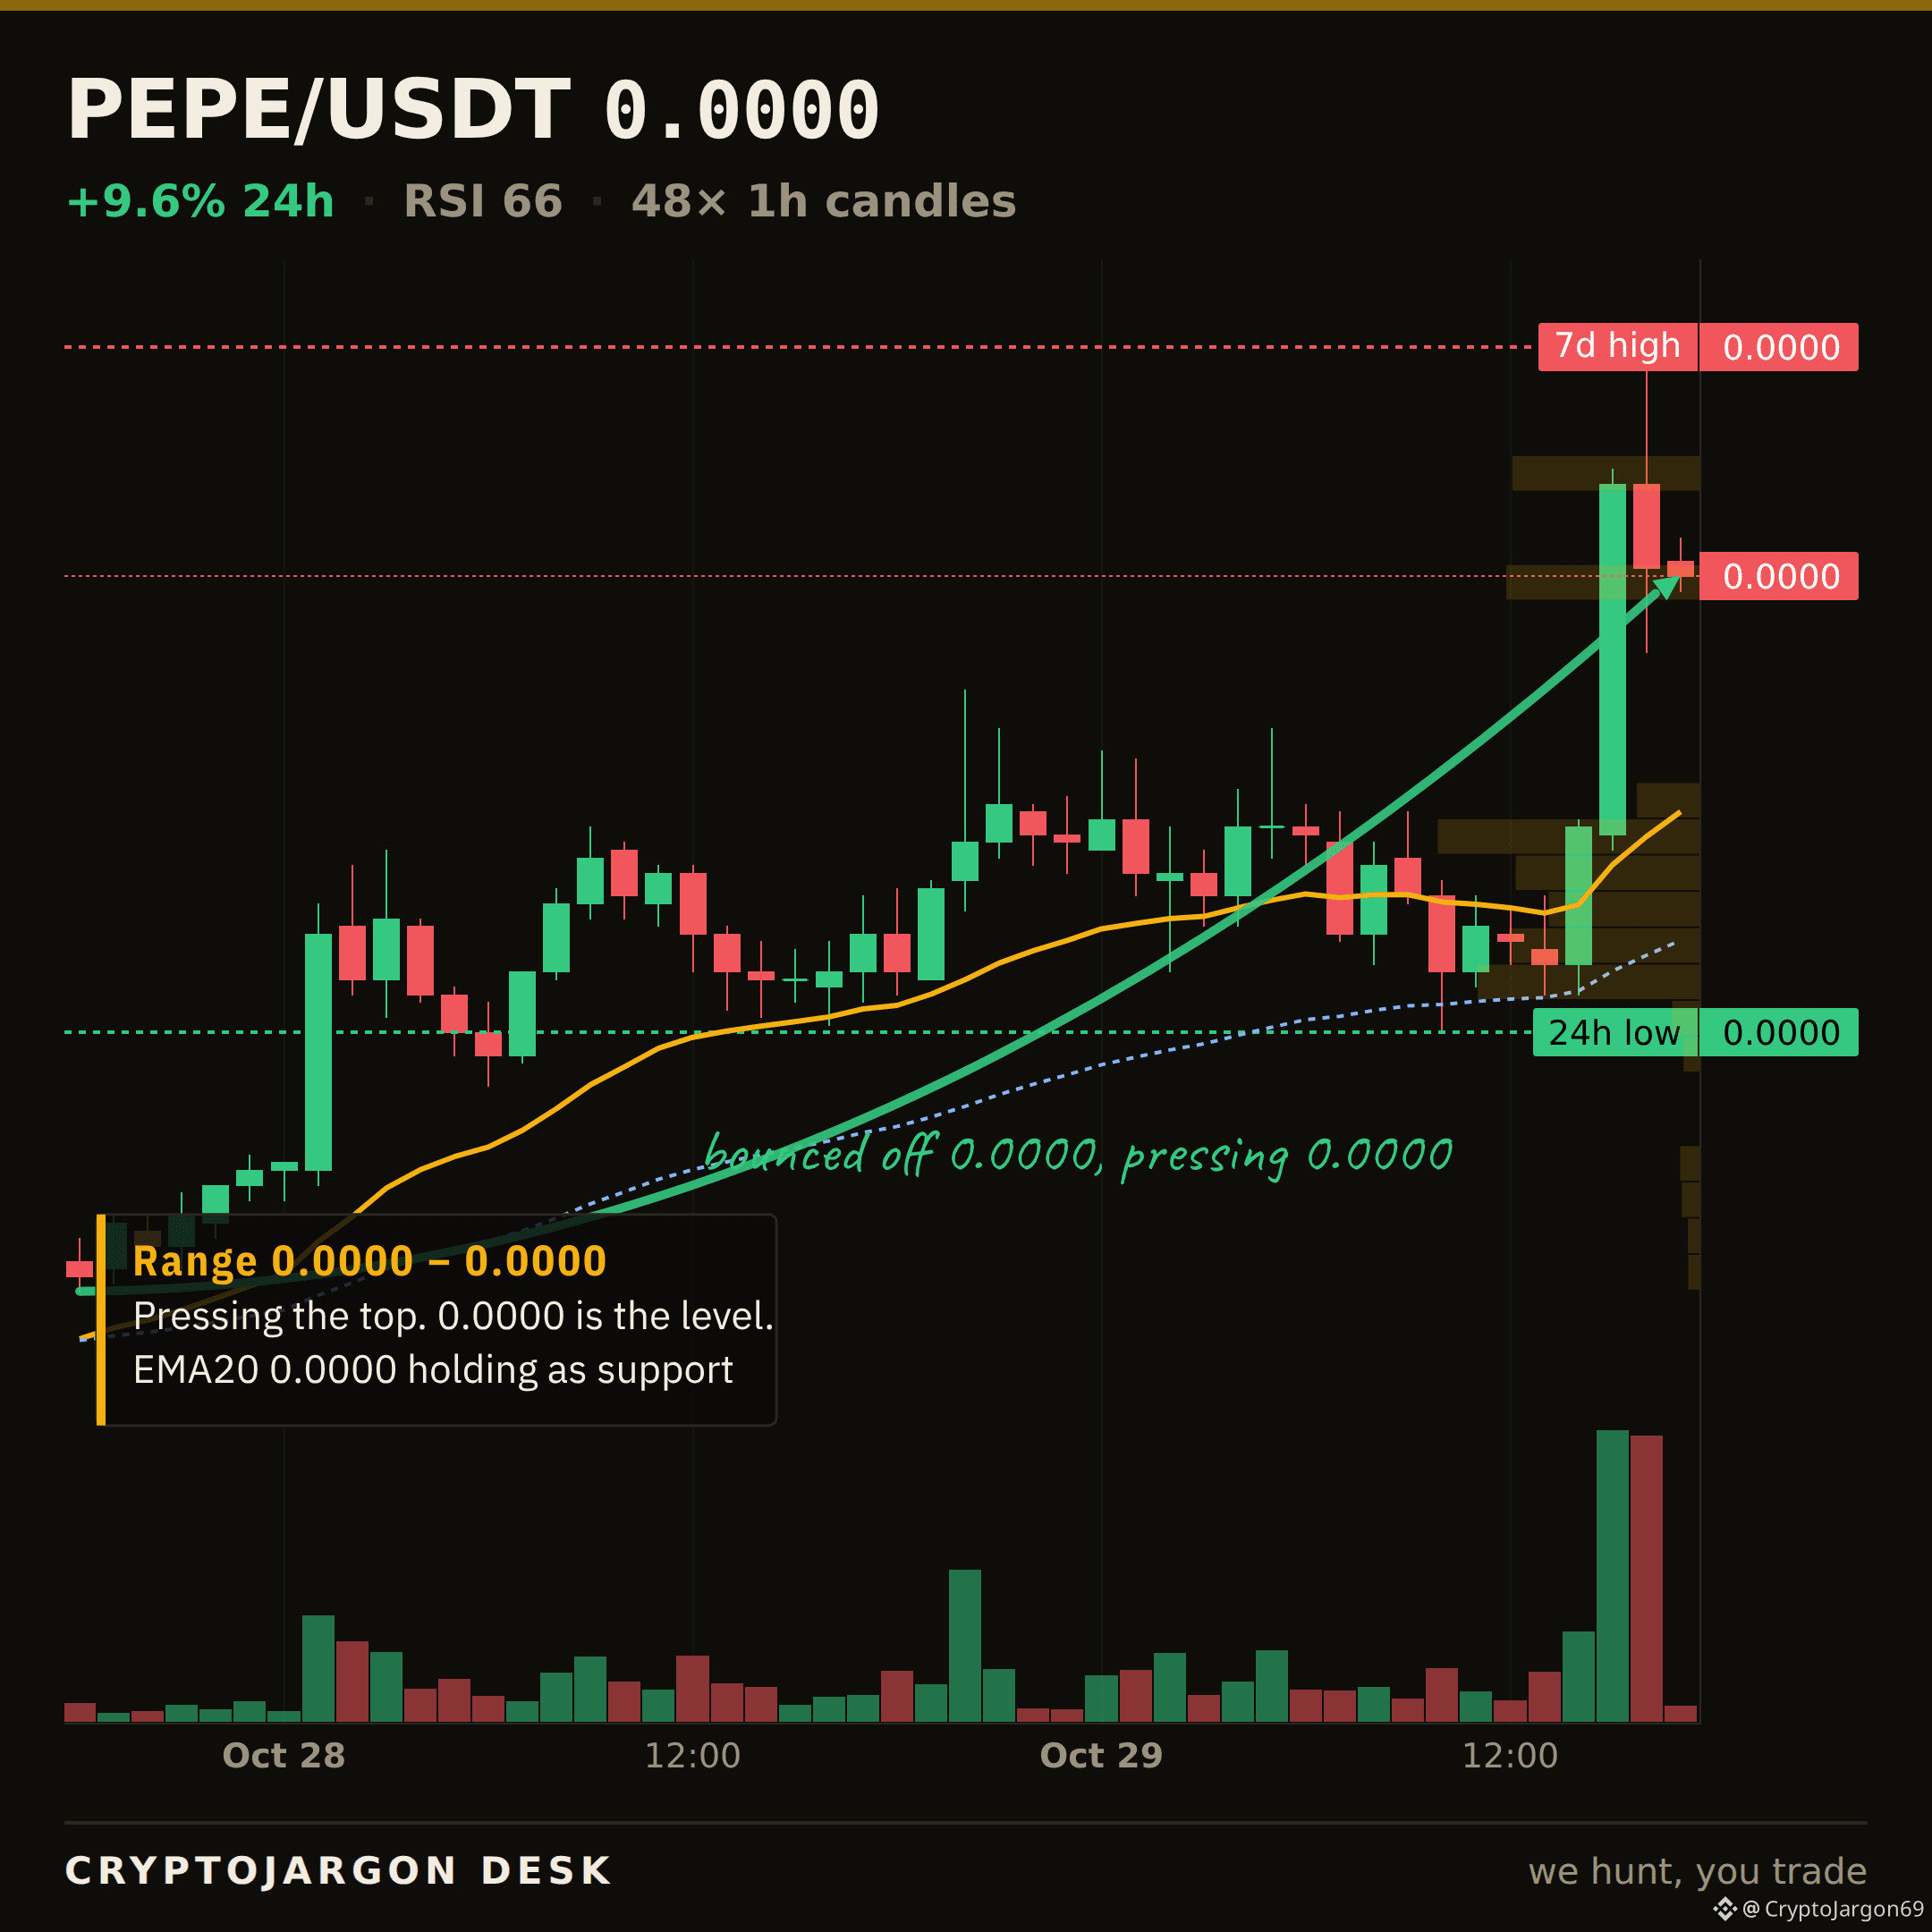
PEPE 今日上漲 +11.4%,直衝周內區間高點 0.00000568。
盤面走勢乾淨利落。價格守在短期 EMA 上方,RSI 爲 67——走勢強勁,但還沒有過熱。成交量爲 1.72 億美元。
這就是考驗。中性市場日(恐懼與貪婪指數爲 51)出現這樣的漲勢,說明它有自己的動能。但如果無法突破本週高點,動能就毫無意義。
這是真正的買盤突破,還是你正在箱體頂部賣出?
$PEPE #PEPE
全天都會發布新的分析。記得關注,別錯過下一篇。
PEPE 今日上漲 +11.4%,直衝周內區間高點 0.00000568。
盤面走勢乾淨利落。價格守在短期 EMA 上方,RSI 爲 67——走勢強勁,但還沒有過熱。成交量爲 1.72 億美元。
這就是考驗。中性市場日(恐懼與貪婪指數爲 51)出現這樣的漲勢,說明它有自己的動能。但如果無法突破本週高點,動能就毫無意義。
這是真正的買盤突破,還是你正在箱體頂部賣出?
$PEPE #PEPE
全天都會發布新的分析。記得關注,別錯過下一篇。
盤面走勢乾淨利落。價格守在短期 EMA 上方,RSI 爲 67——走勢強勁,但還沒有過熱。成交量爲 1.72 億美元。
這就是考驗。中性市場日(恐懼與貪婪指數爲 51)出現這樣的漲勢,說明它有自己的動能。但如果無法突破本週高點,動能就毫無意義。
這是真正的買盤突破,還是你正在箱體頂部賣出?
$PEPE #PEPE
全天都會發布新的分析。記得關注,別錯過下一篇。
54
$BLUR · 關鍵位失守
沒能守住。
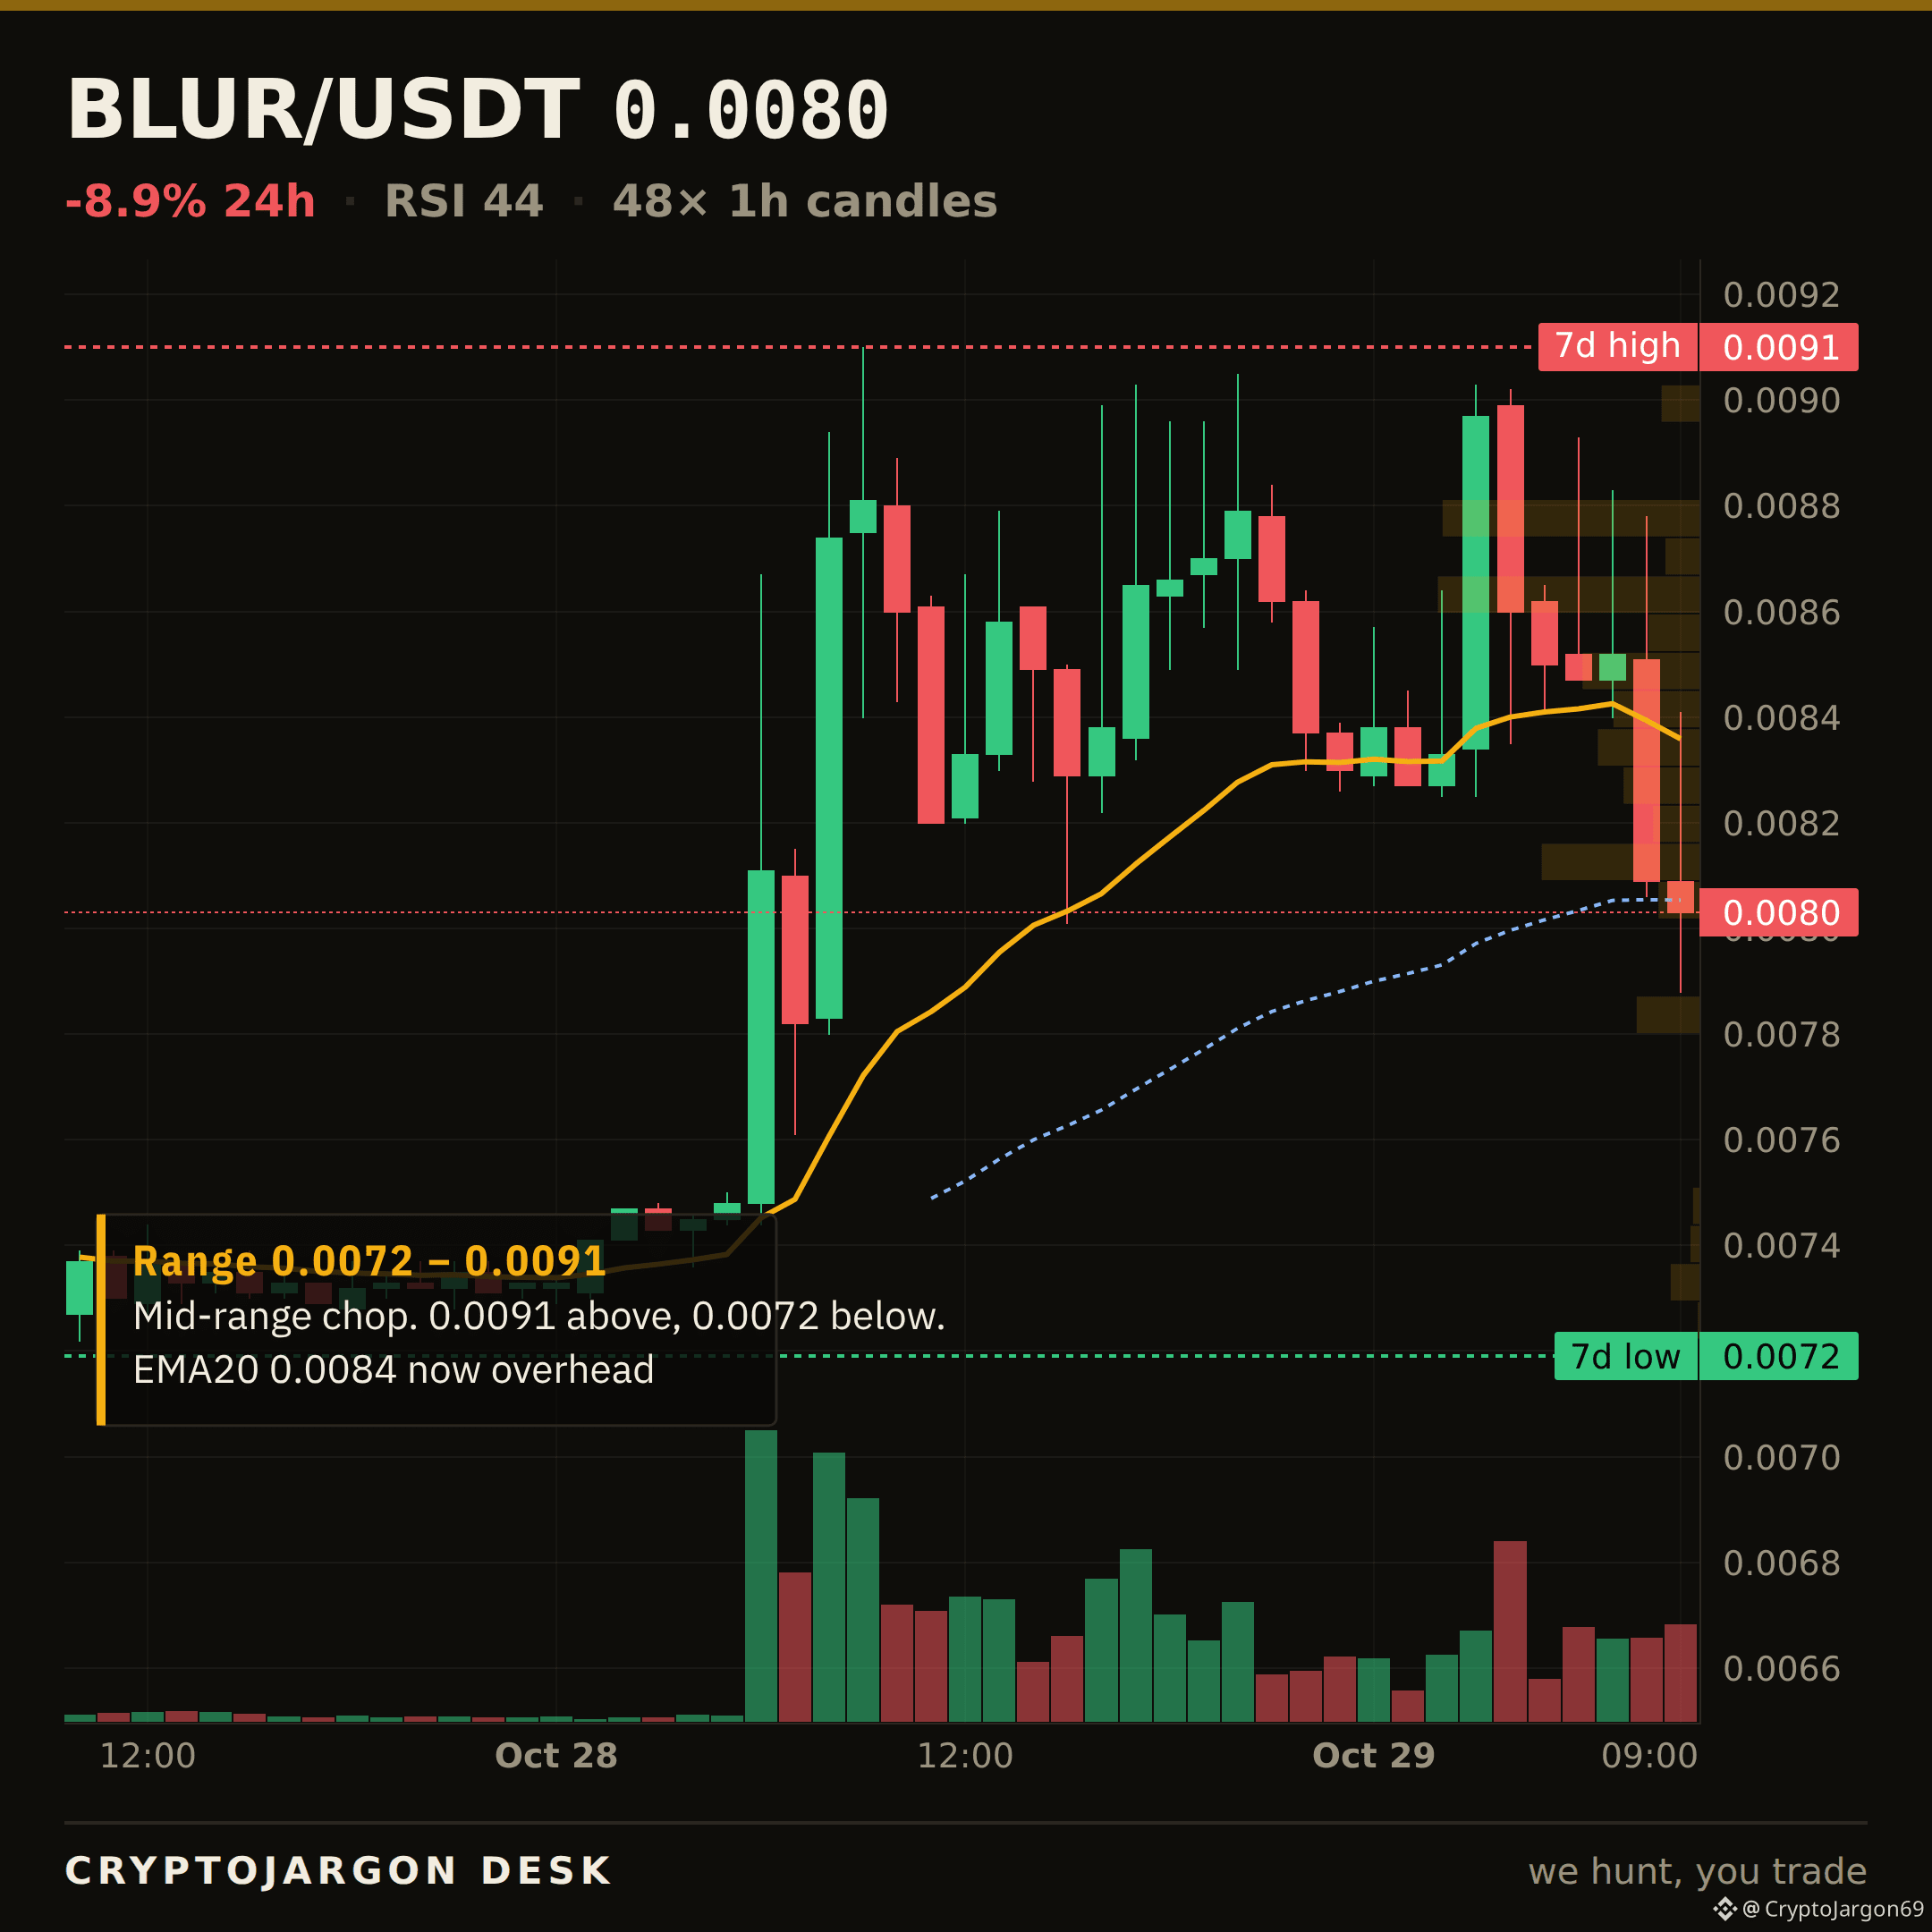
我們標記的 $BLUR 支撐位是 $0.0084。價格收盤跌破該位——目前爲 $0.00803。下方空間就此打開,而這條線也變成了它必須重新奪回的阻力位。
從這裏反彈收復,還是說下一輪下跌纔剛剛開始?
$BLUR
$BLUR · 關鍵位失守
沒能守住。
我們標記的 $BLUR 支撐位是 $0.0084。價格收盤跌破該位——目前爲 $0.00803。下方空間就此打開,而這條線也變成了它必須重新奪回的阻力位。
從這裏反彈收復,還是說下一輪下跌纔剛剛開始?
$BLUR
沒能守住。
我們標記的 $BLUR 支撐位是 $0.0084。價格收盤跌破該位——目前爲 $0.00803。下方空間就此打開,而這條線也變成了它必須重新奪回的阻力位。
從這裏反彈收復,還是說下一輪下跌纔剛剛開始?
$BLUR
85
查看翻譯
$BCH · THE LEVEL BROKE
It didn't hold.
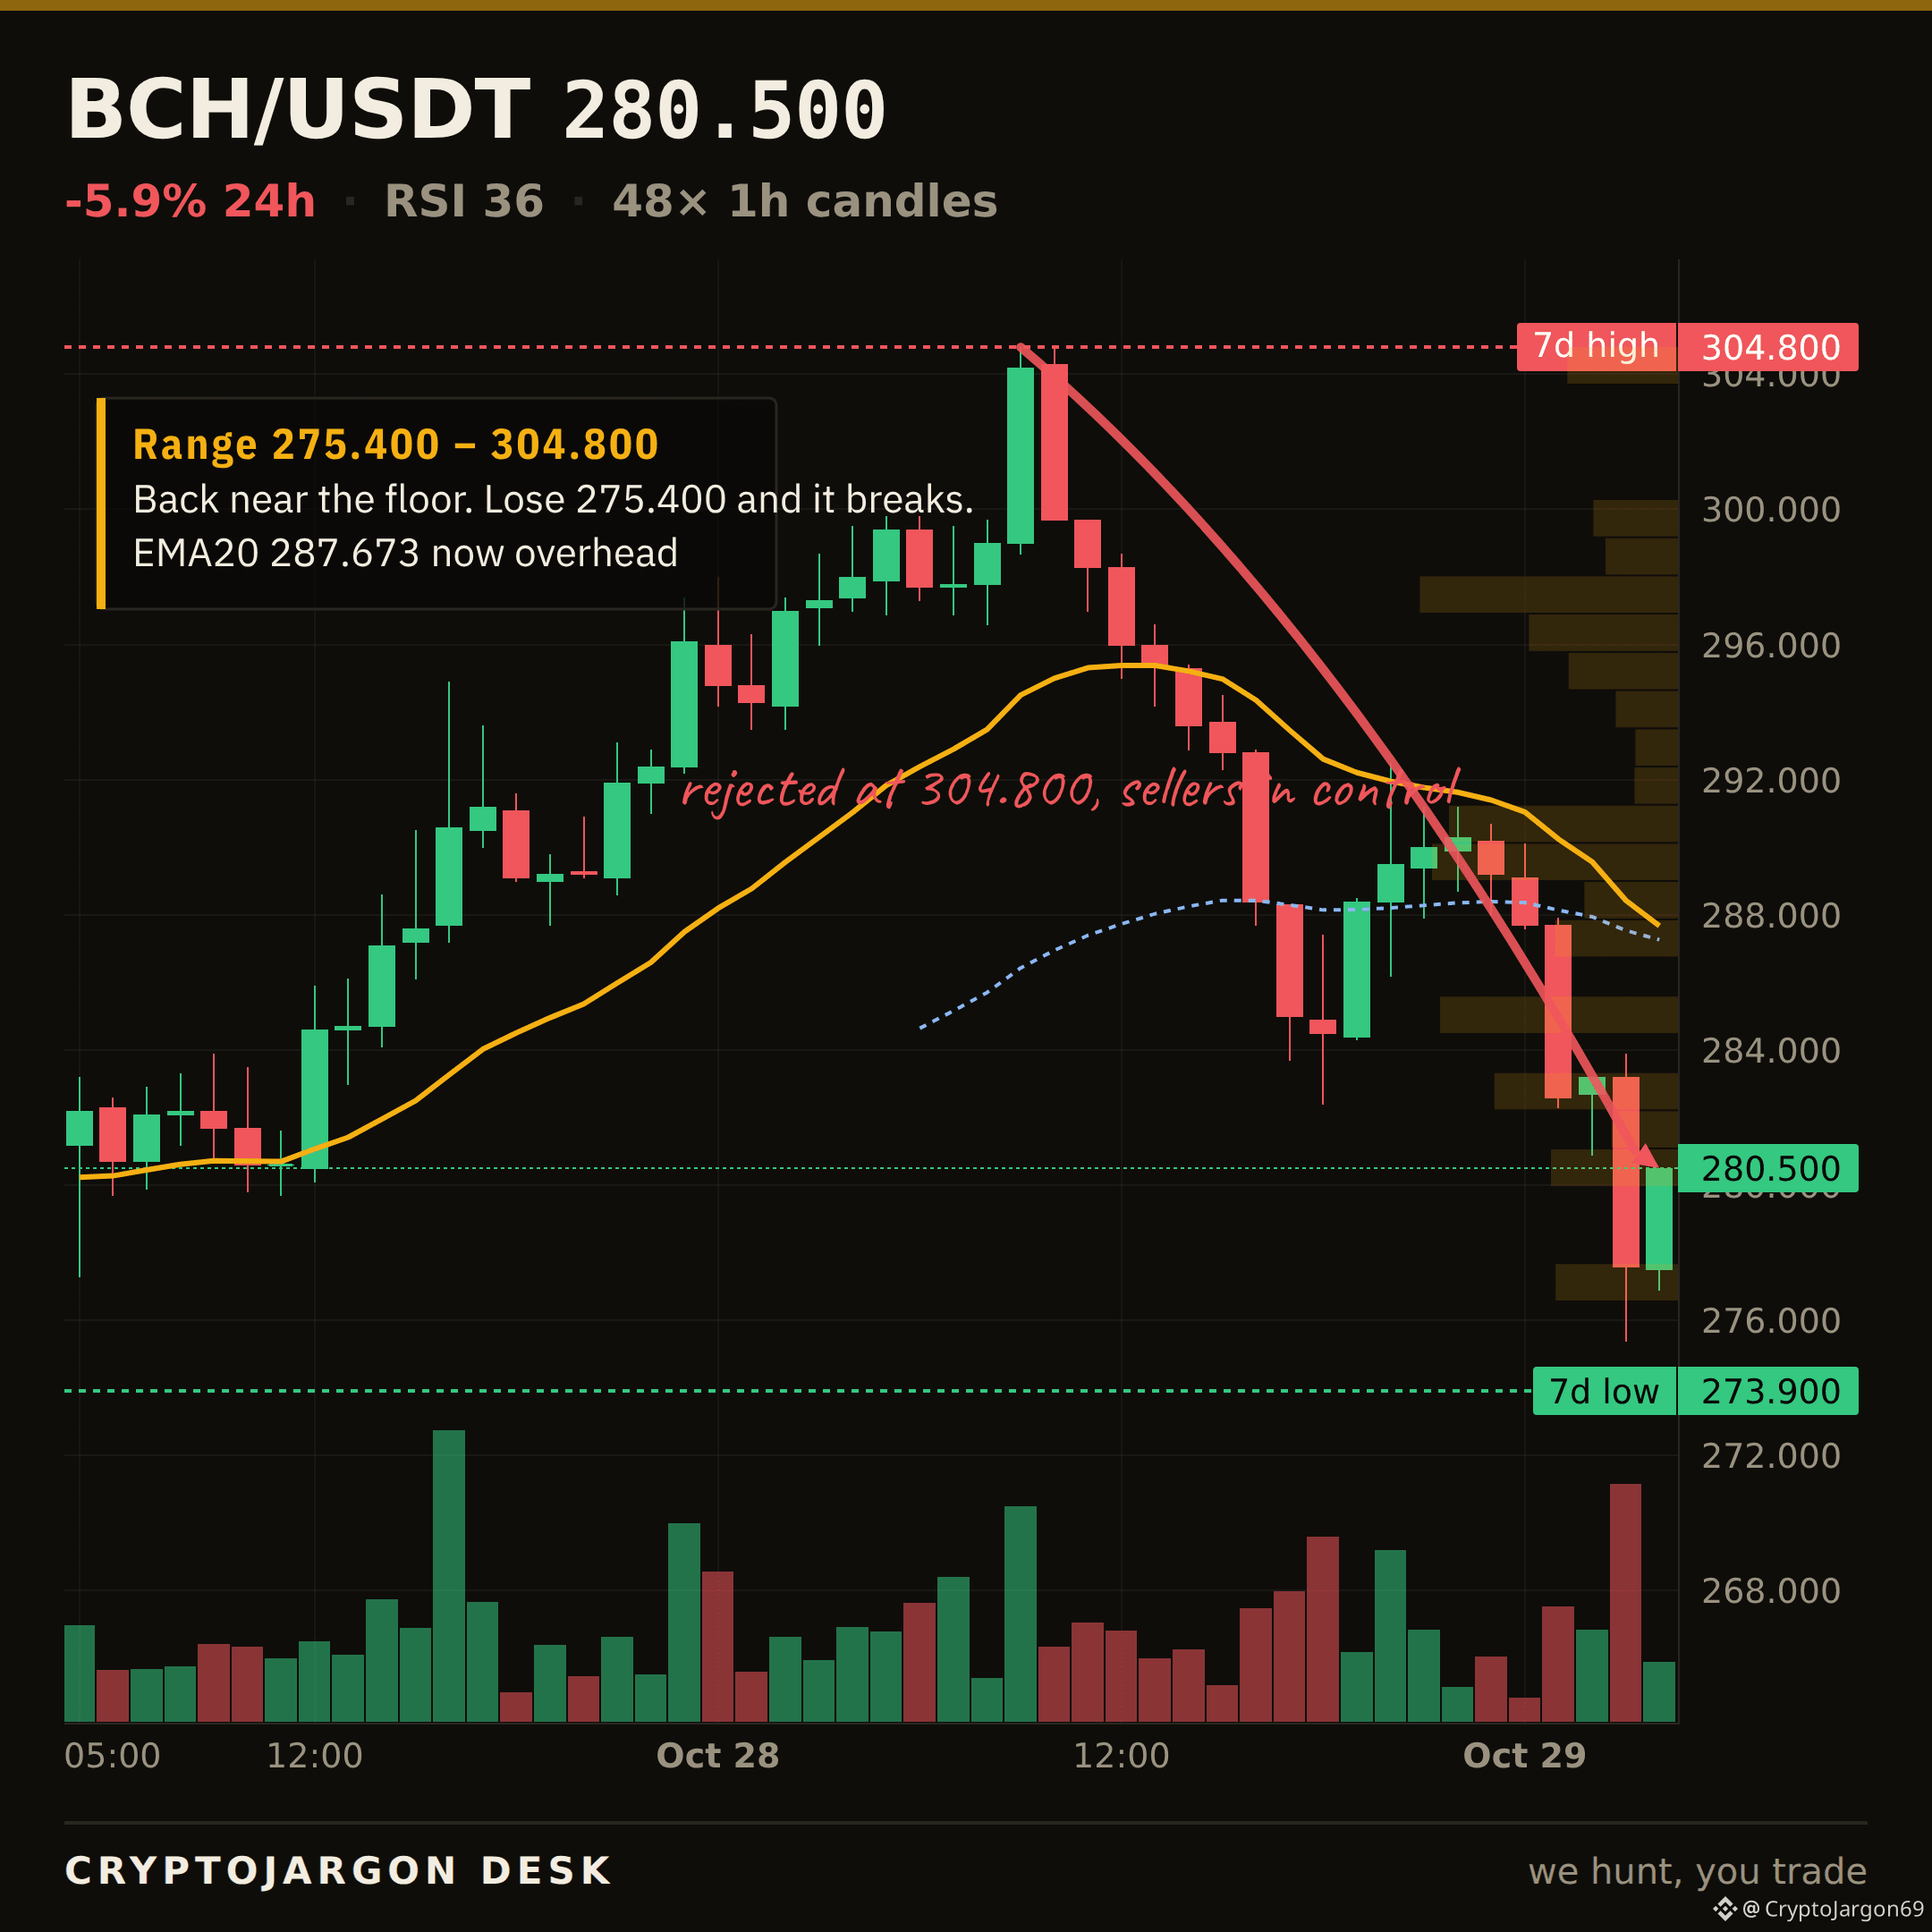
$282.40 was the floor we flagged on $BCH. Price closed below it — $280.50 now. The range beneath opens up, and that line flips into the ceiling it has to win back.
Does it reclaim $282.40, or is that the ceiling now?
$BCH
$BCH · THE LEVEL BROKE
It didn't hold.
$282.40 was the floor we flagged on $BCH . Price closed below it — $280.50 now. The range beneath opens up, and that line flips into the ceiling it has to win back.
Does it reclaim $282.40, or is that the ceiling now?
$BCH
It didn't hold.
$282.40 was the floor we flagged on $BCH . Price closed below it — $280.50 now. The range beneath opens up, and that line flips into the ceiling it has to win back.
Does it reclaim $282.40, or is that the ceiling now?
$BCH
33
查看翻譯
$CHIP · MARKET STRUCTURE
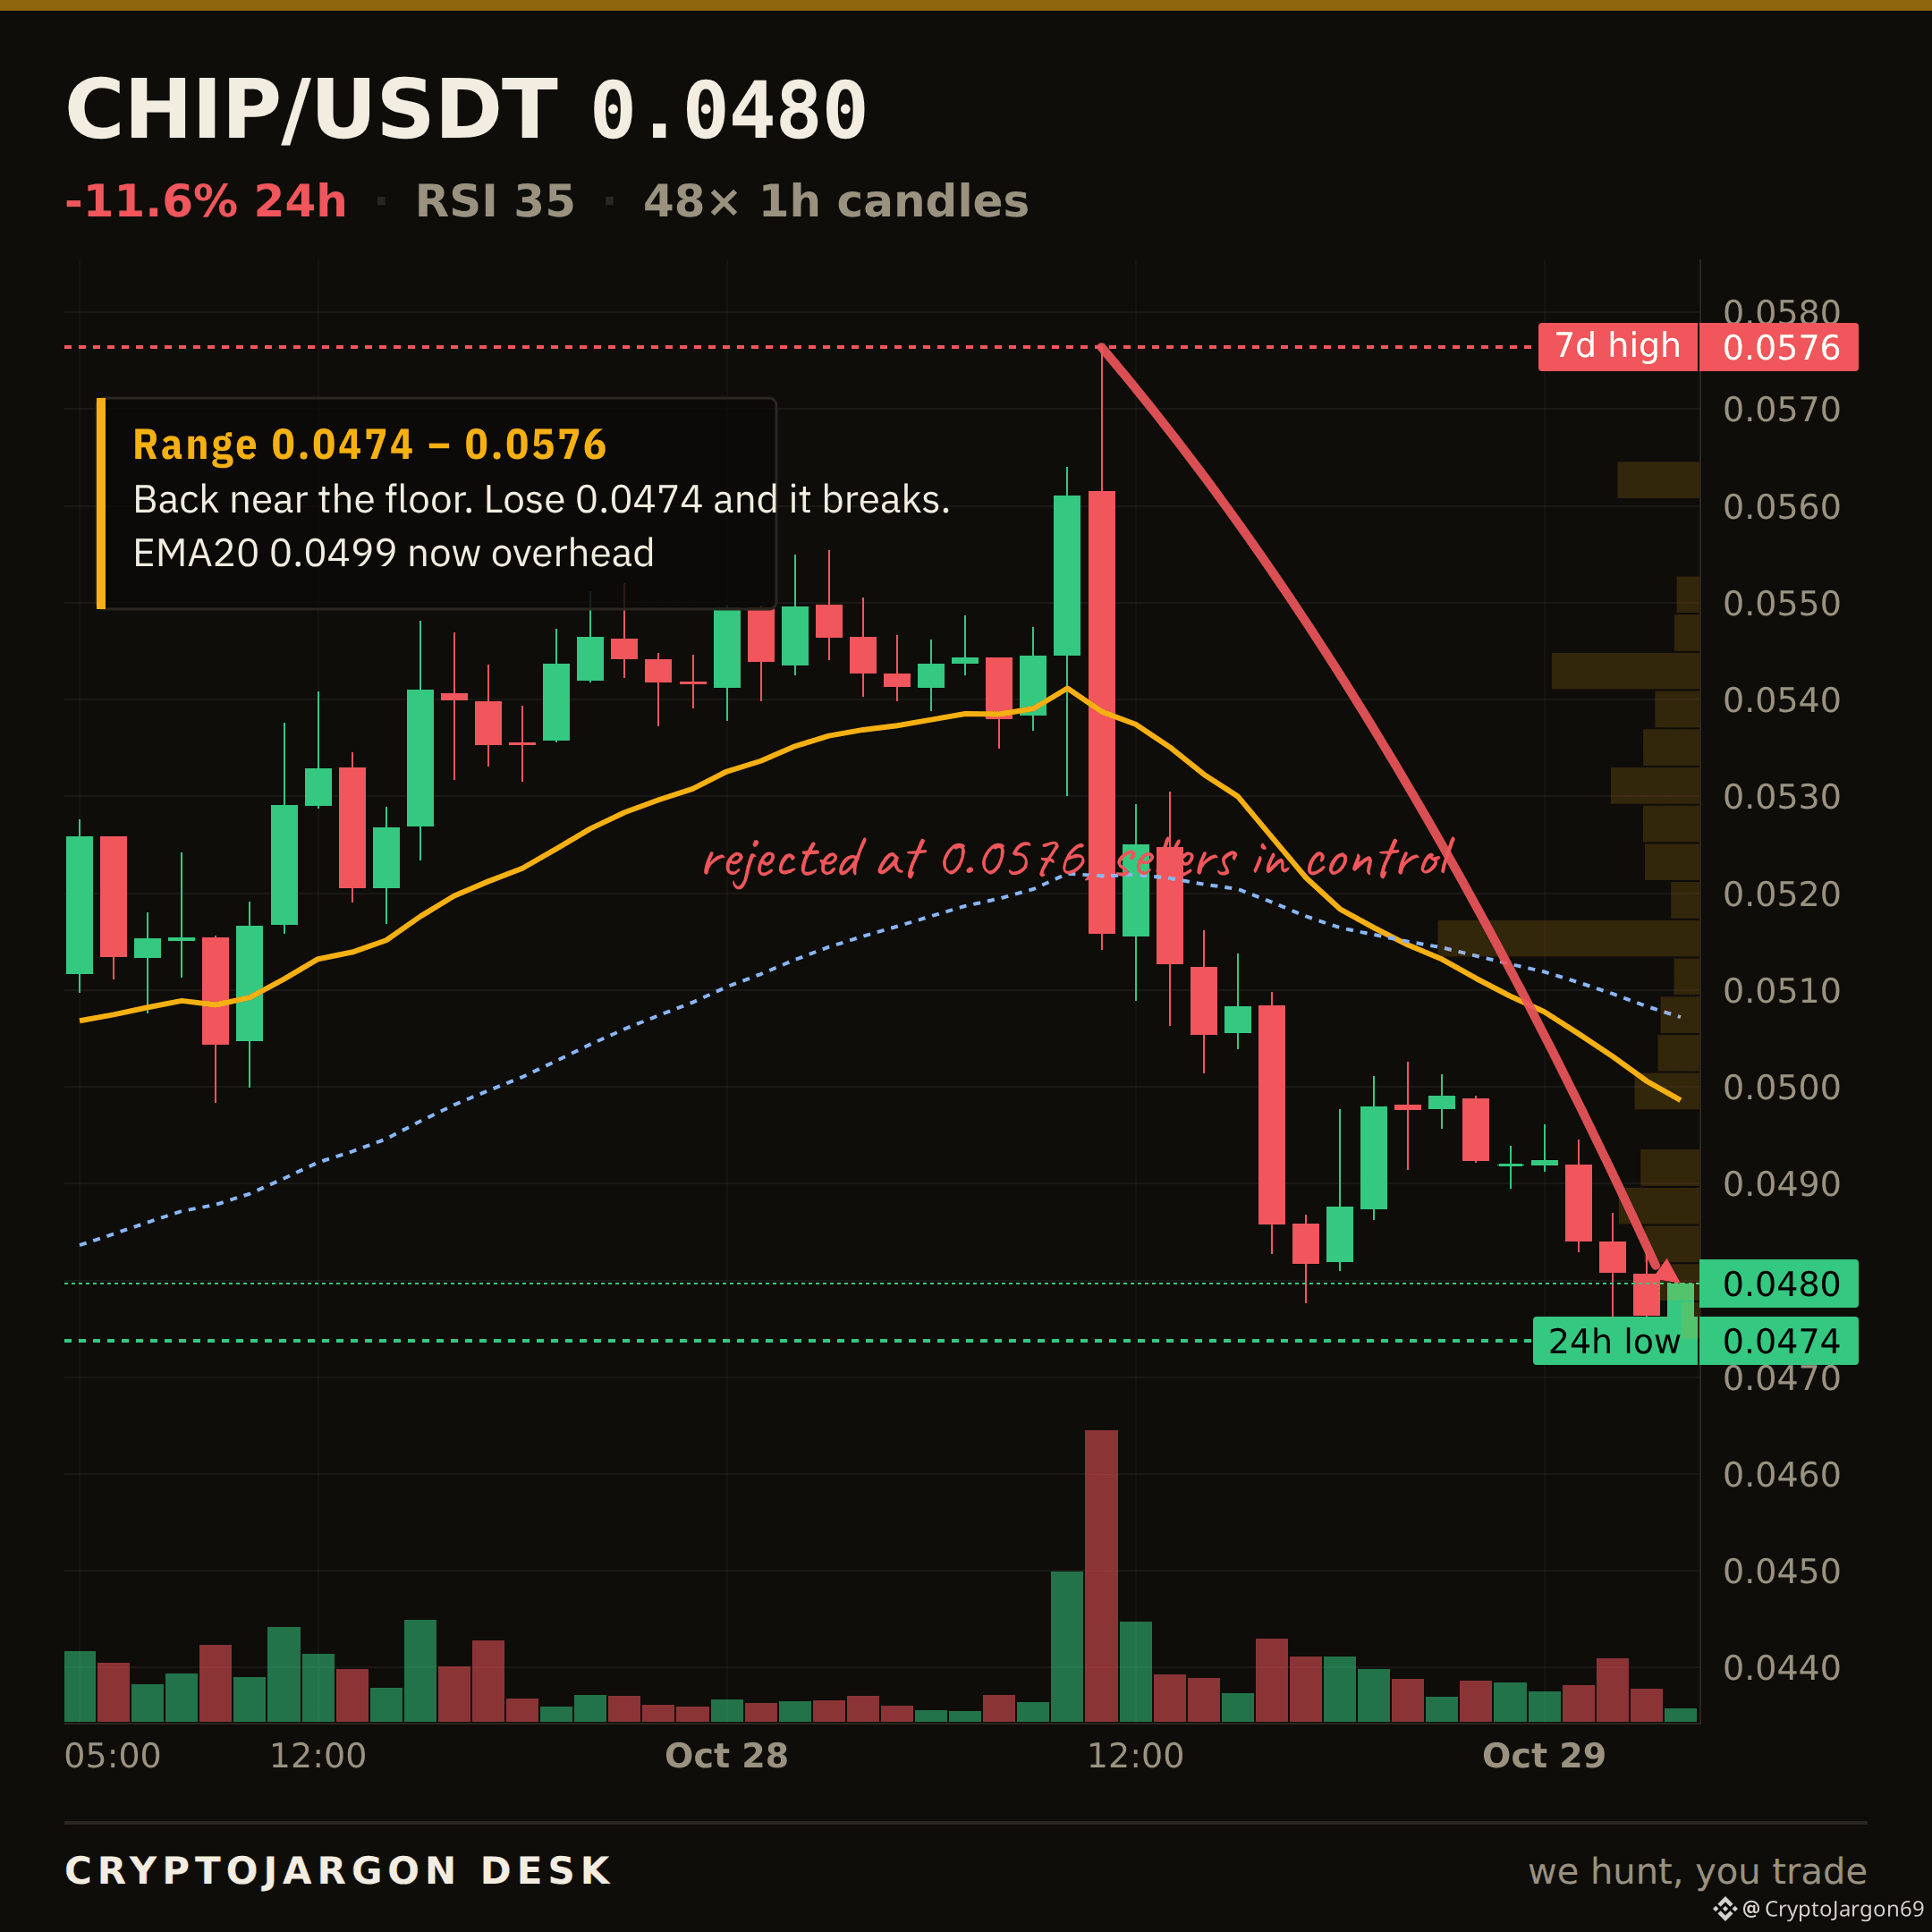
$0.048, -11.6% on the day.
Trend — price below both EMAs, the 20 under the 50.
Momentum — RSI 35.
Range — 6% up its 24h range ($0.0474–$0.0576).
Trend, momentum and range mostly point the same way — an aligned tape to the downside.
Levels: $0.0576 24h high (ceiling) · $0.0474 24h low (support) · 7d range $0.0409–$0.0576.
Chart: 1H candles, EMA20/50 + levels marked. $CHIP
33
查看翻譯
$BLUR · LEVEL TO WATCH
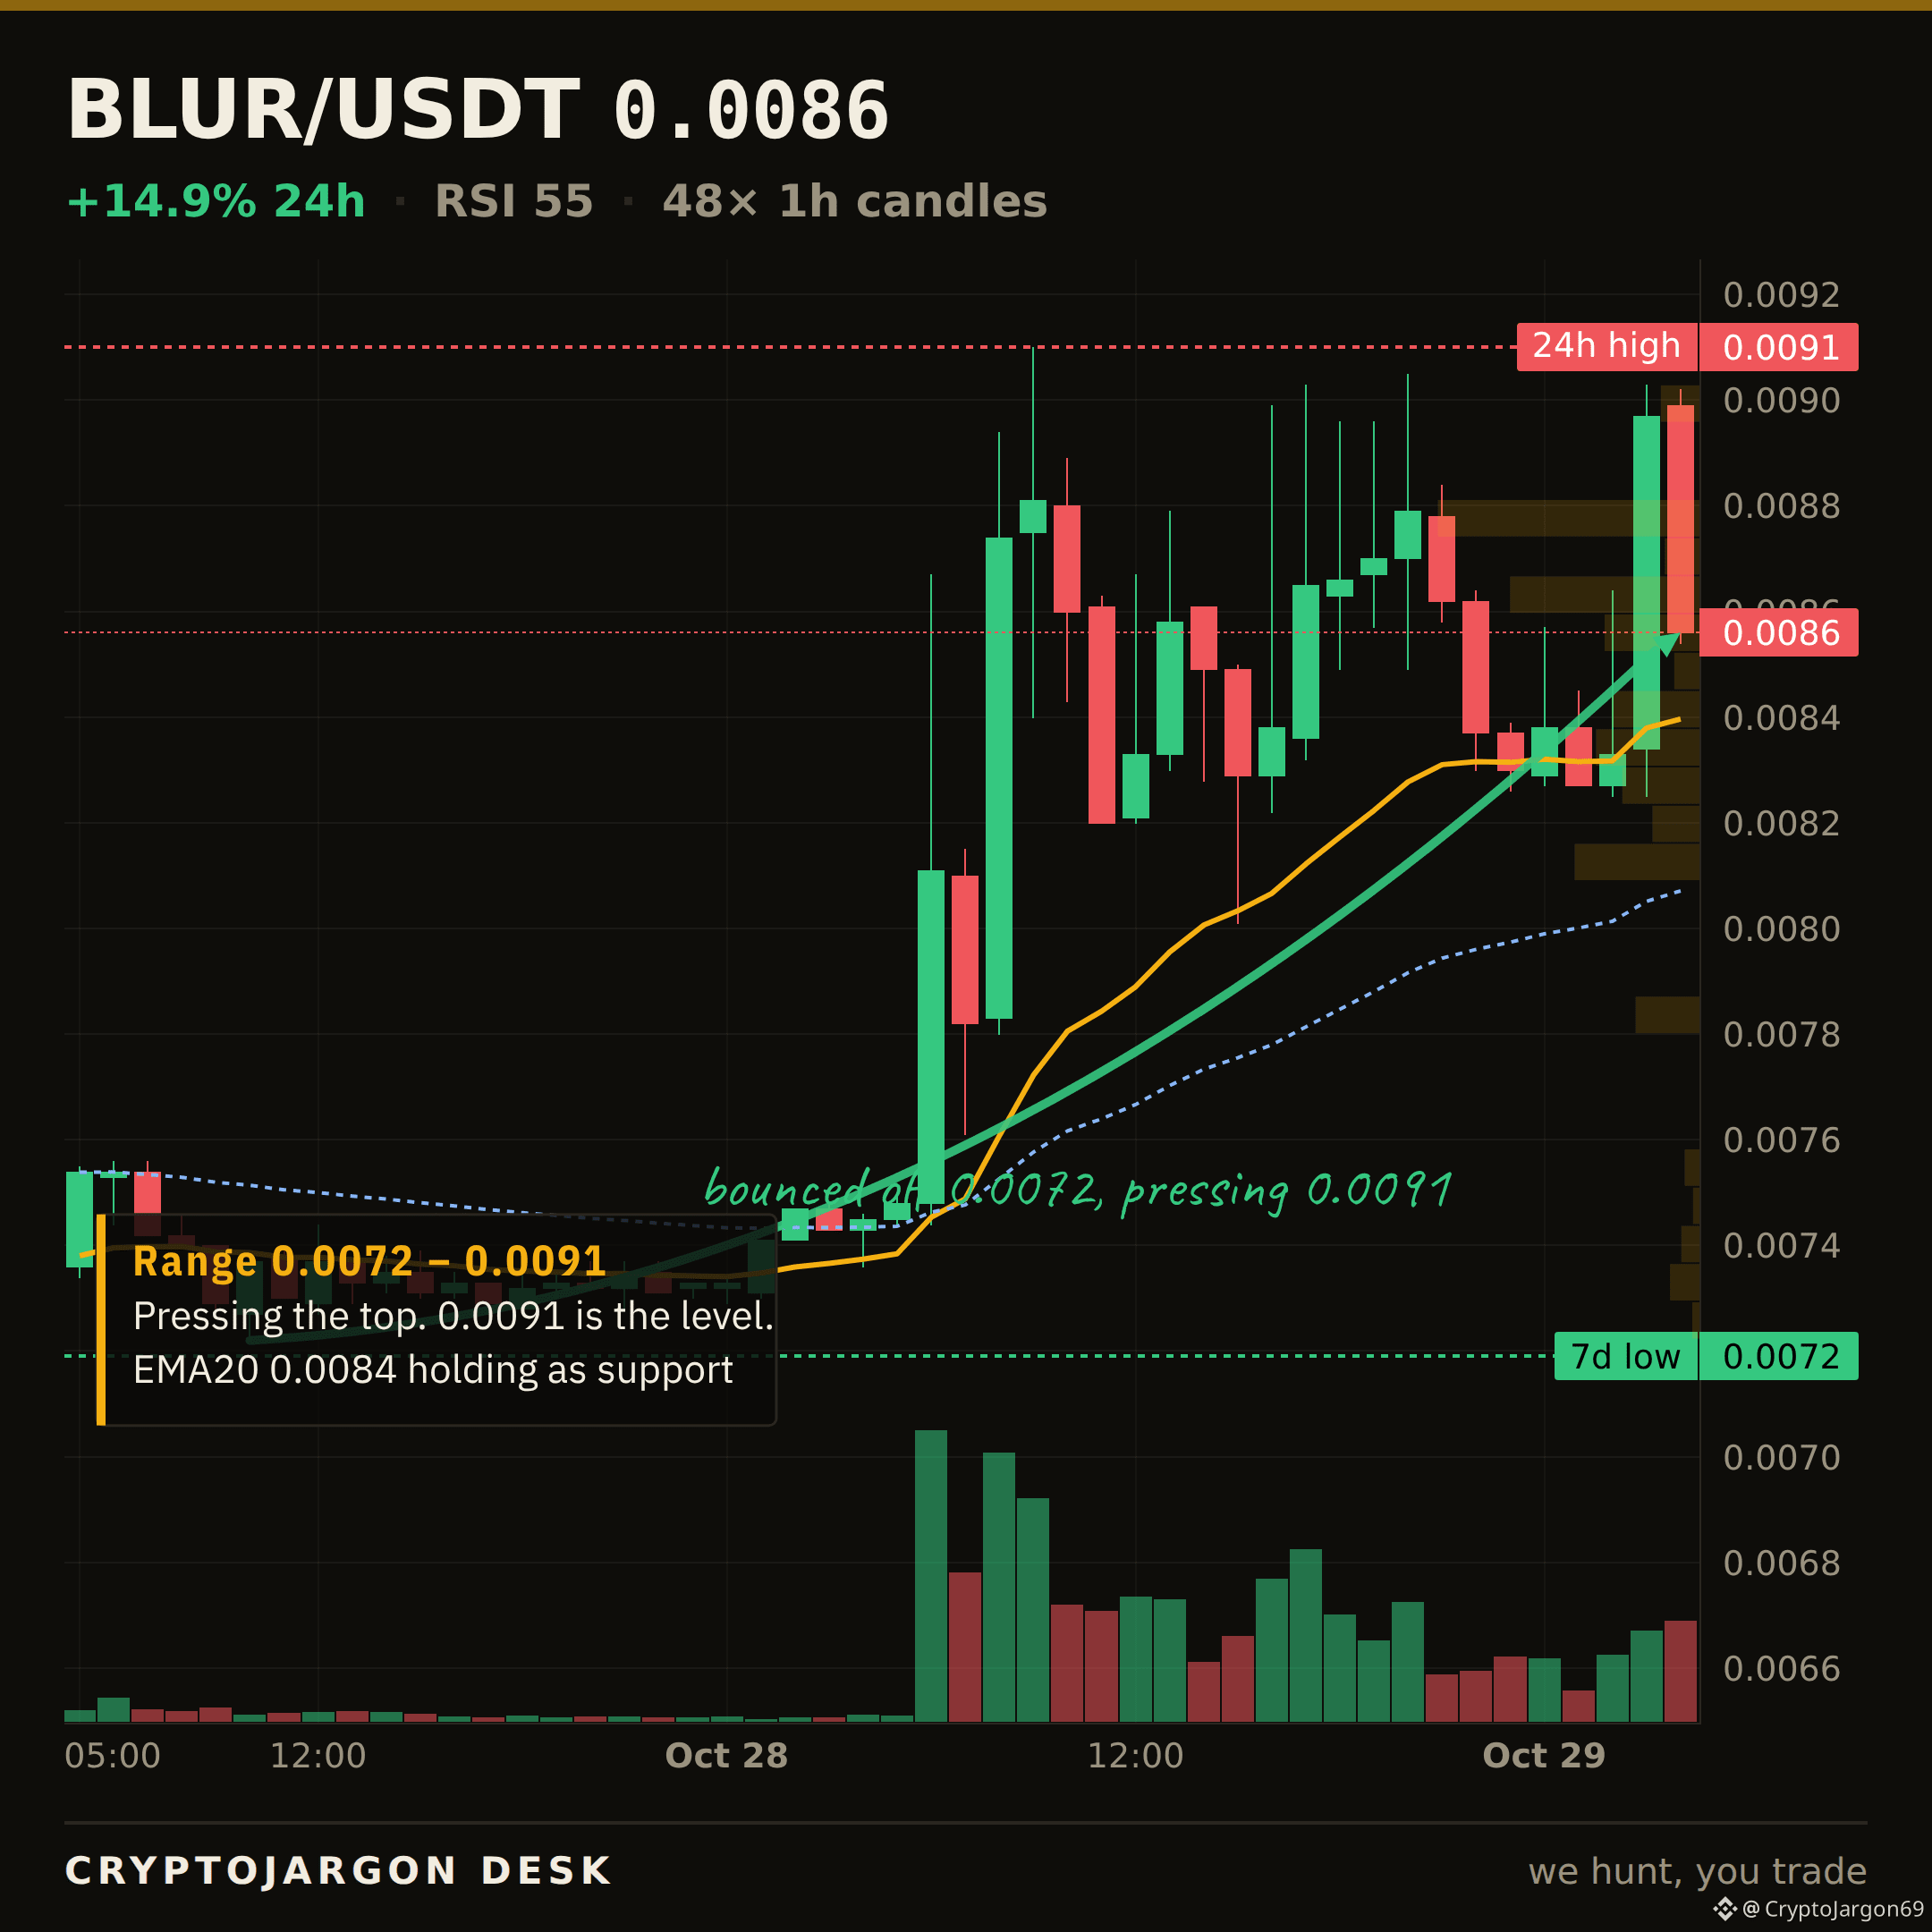
$0.00856 now.
The line that matters is $0.0084 — the 20-EMA, the floor the tape is sitting on.
Holding $0.0084 keeps the structure intact; a clean close below opens the range beneath it. I'll follow up when it resolves.
Chart: the level is on it. $BLUR
$BLUR · LEVEL TO WATCH
$0.00856 now.
The line that matters is $0.0084 — the 20-EMA, the floor the tape is sitting on.
Holding $0.0084 keeps the structure intact; a clean close below opens the range beneath it. I'll follow up when it resolves.
Chart: the level is on it. $BLUR
$0.00856 now.
The line that matters is $0.0084 — the 20-EMA, the floor the tape is sitting on.
Holding $0.0084 keeps the structure intact; a clean close below opens the range beneath it. I'll follow up when it resolves.
Chart: the level is on it. $BLUR
50
查看翻譯
A company booked $150M in Bitcoin. It might not exist.
Datavault AI was credited 1,309 BTC at Biconomy via an "off-chain transfer." The exchange simply updated a number in its database; the coins never moved on-chain. Datavault hasn't been able to withdraw since June.
Now the company is restating four financial reports and questioning its own survival. It booked an exchange IOU as a liquid asset. A balance on a third-party platform is just a promise until coins are in your wallet. Always.
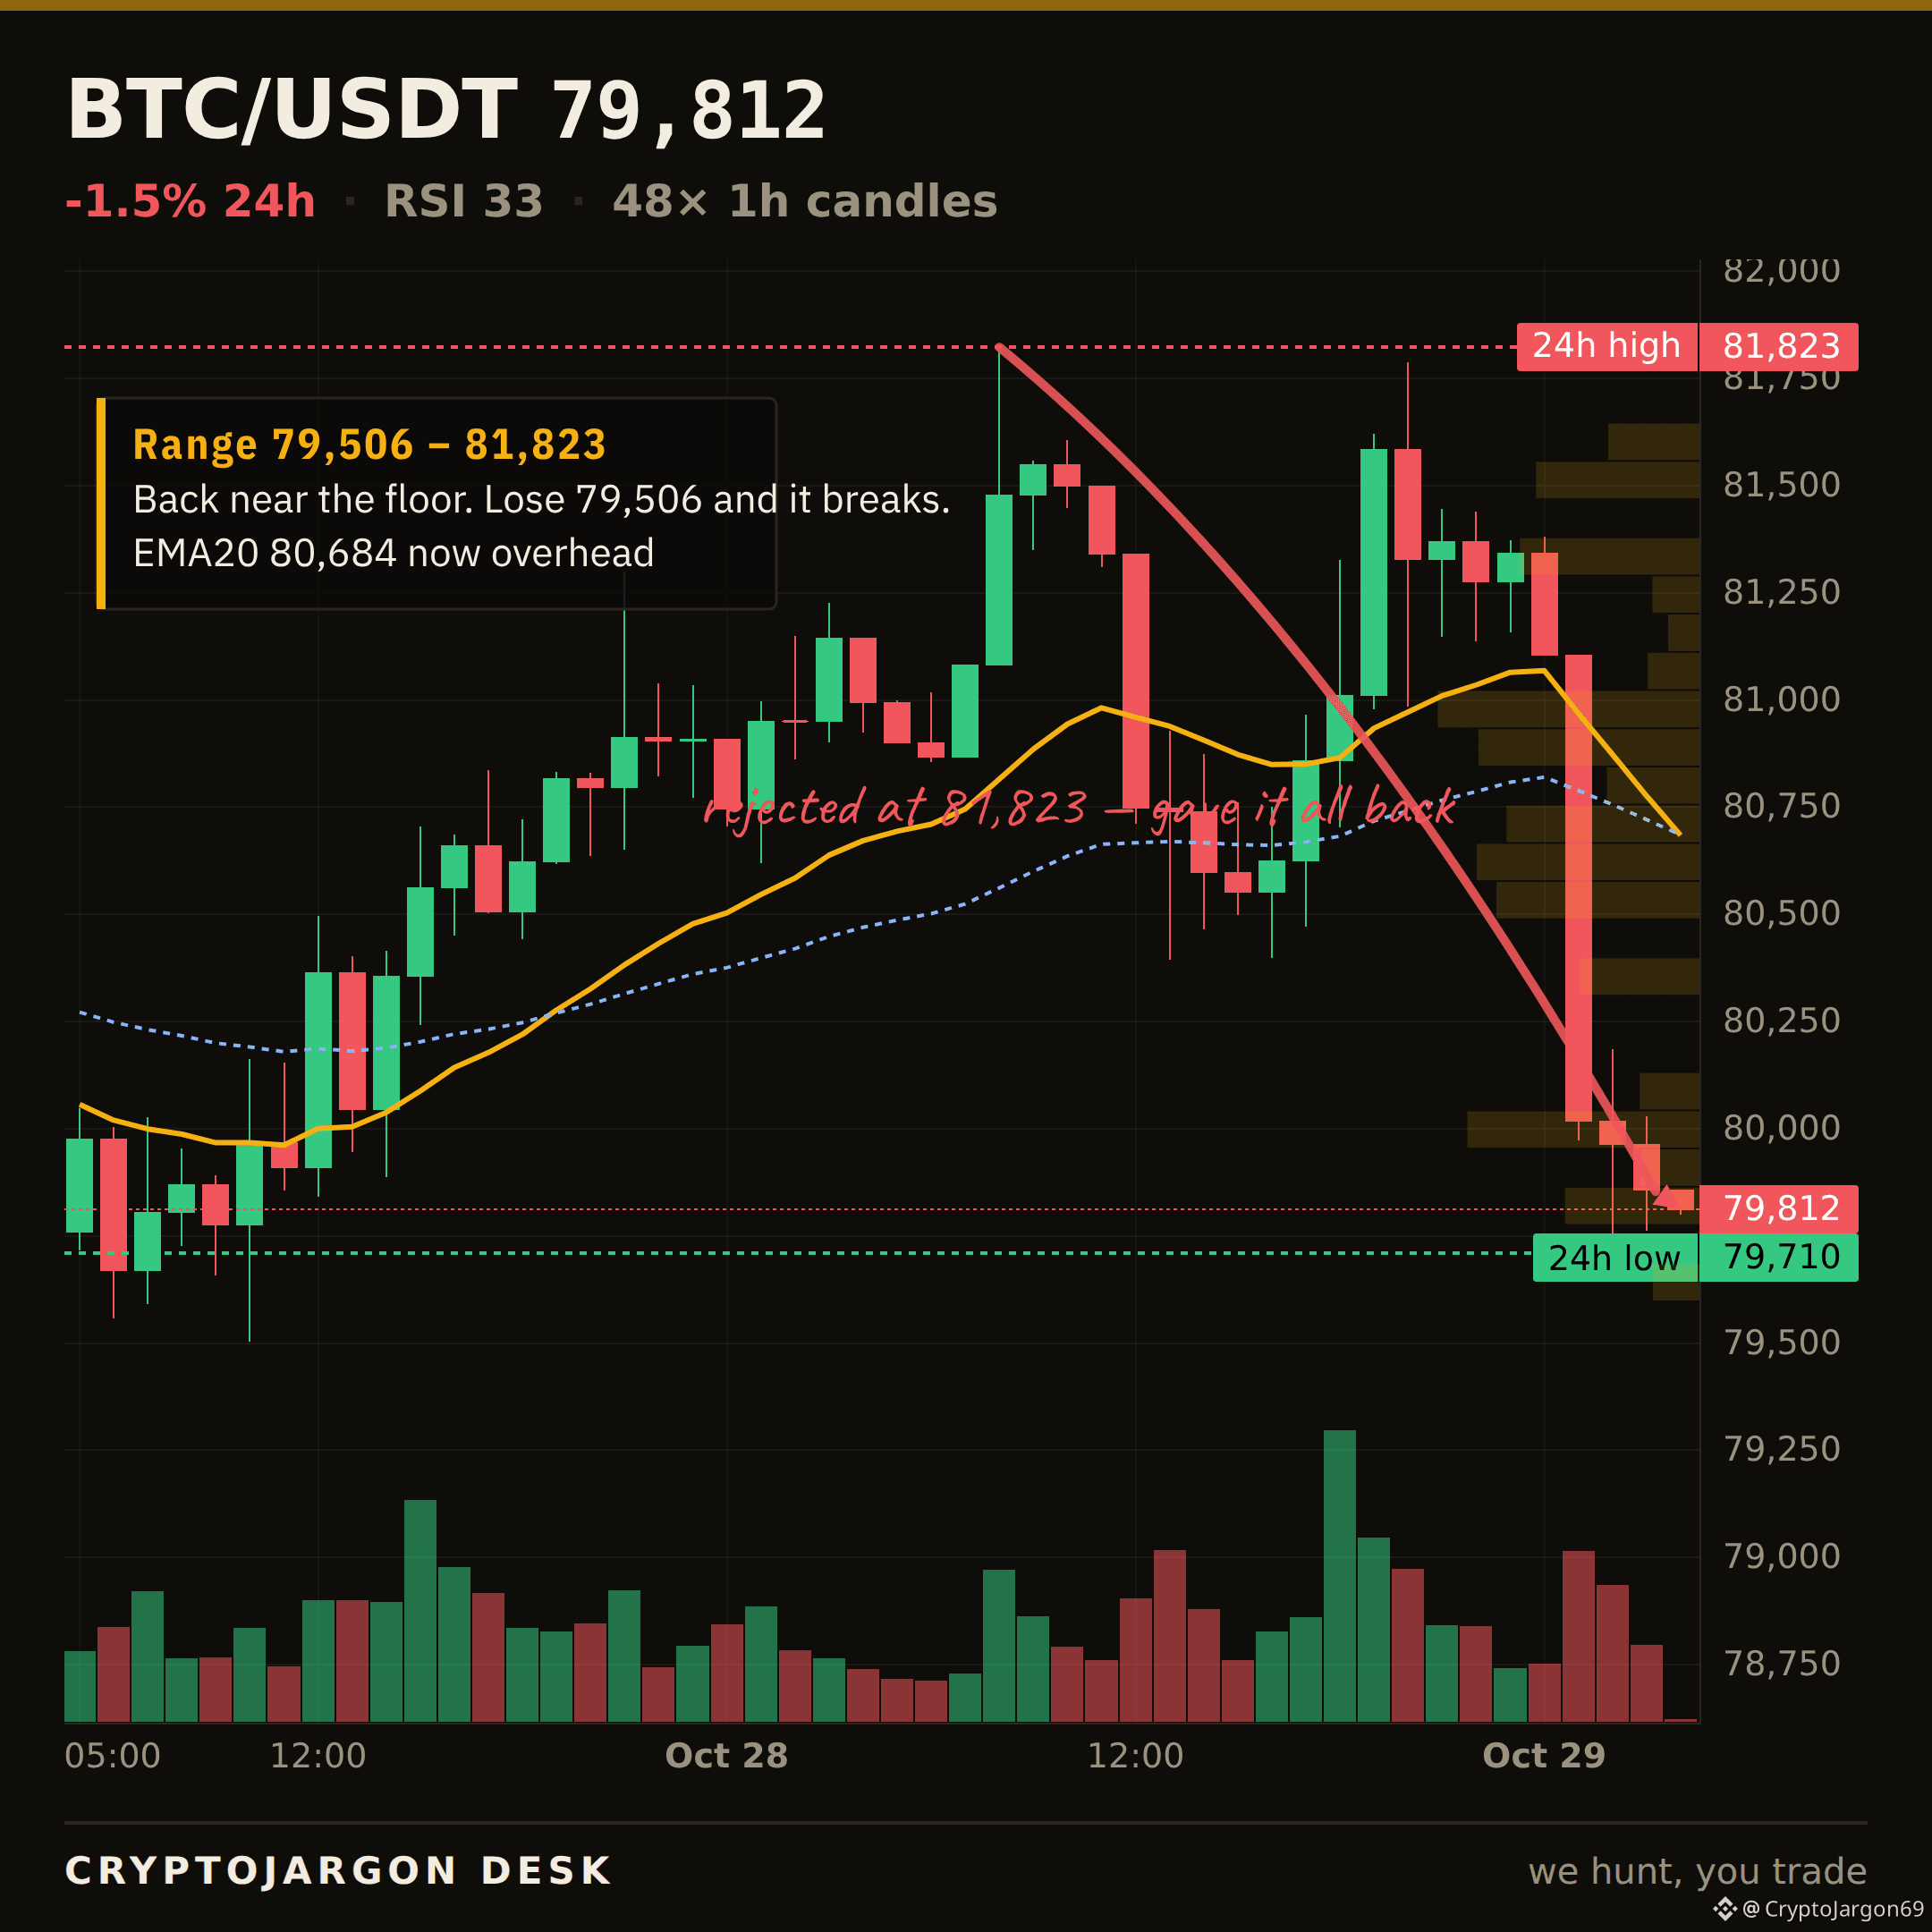
The market shrugs. Price holds just above the 7-day low of 79,221. Is another exchange story just noise, or is that the line in the sand?
$BTC
More of these coming today. Follow to catch them as they land.
11
查看翻譯
$BTC · THE LEVEL BROKE
That floor is gone.
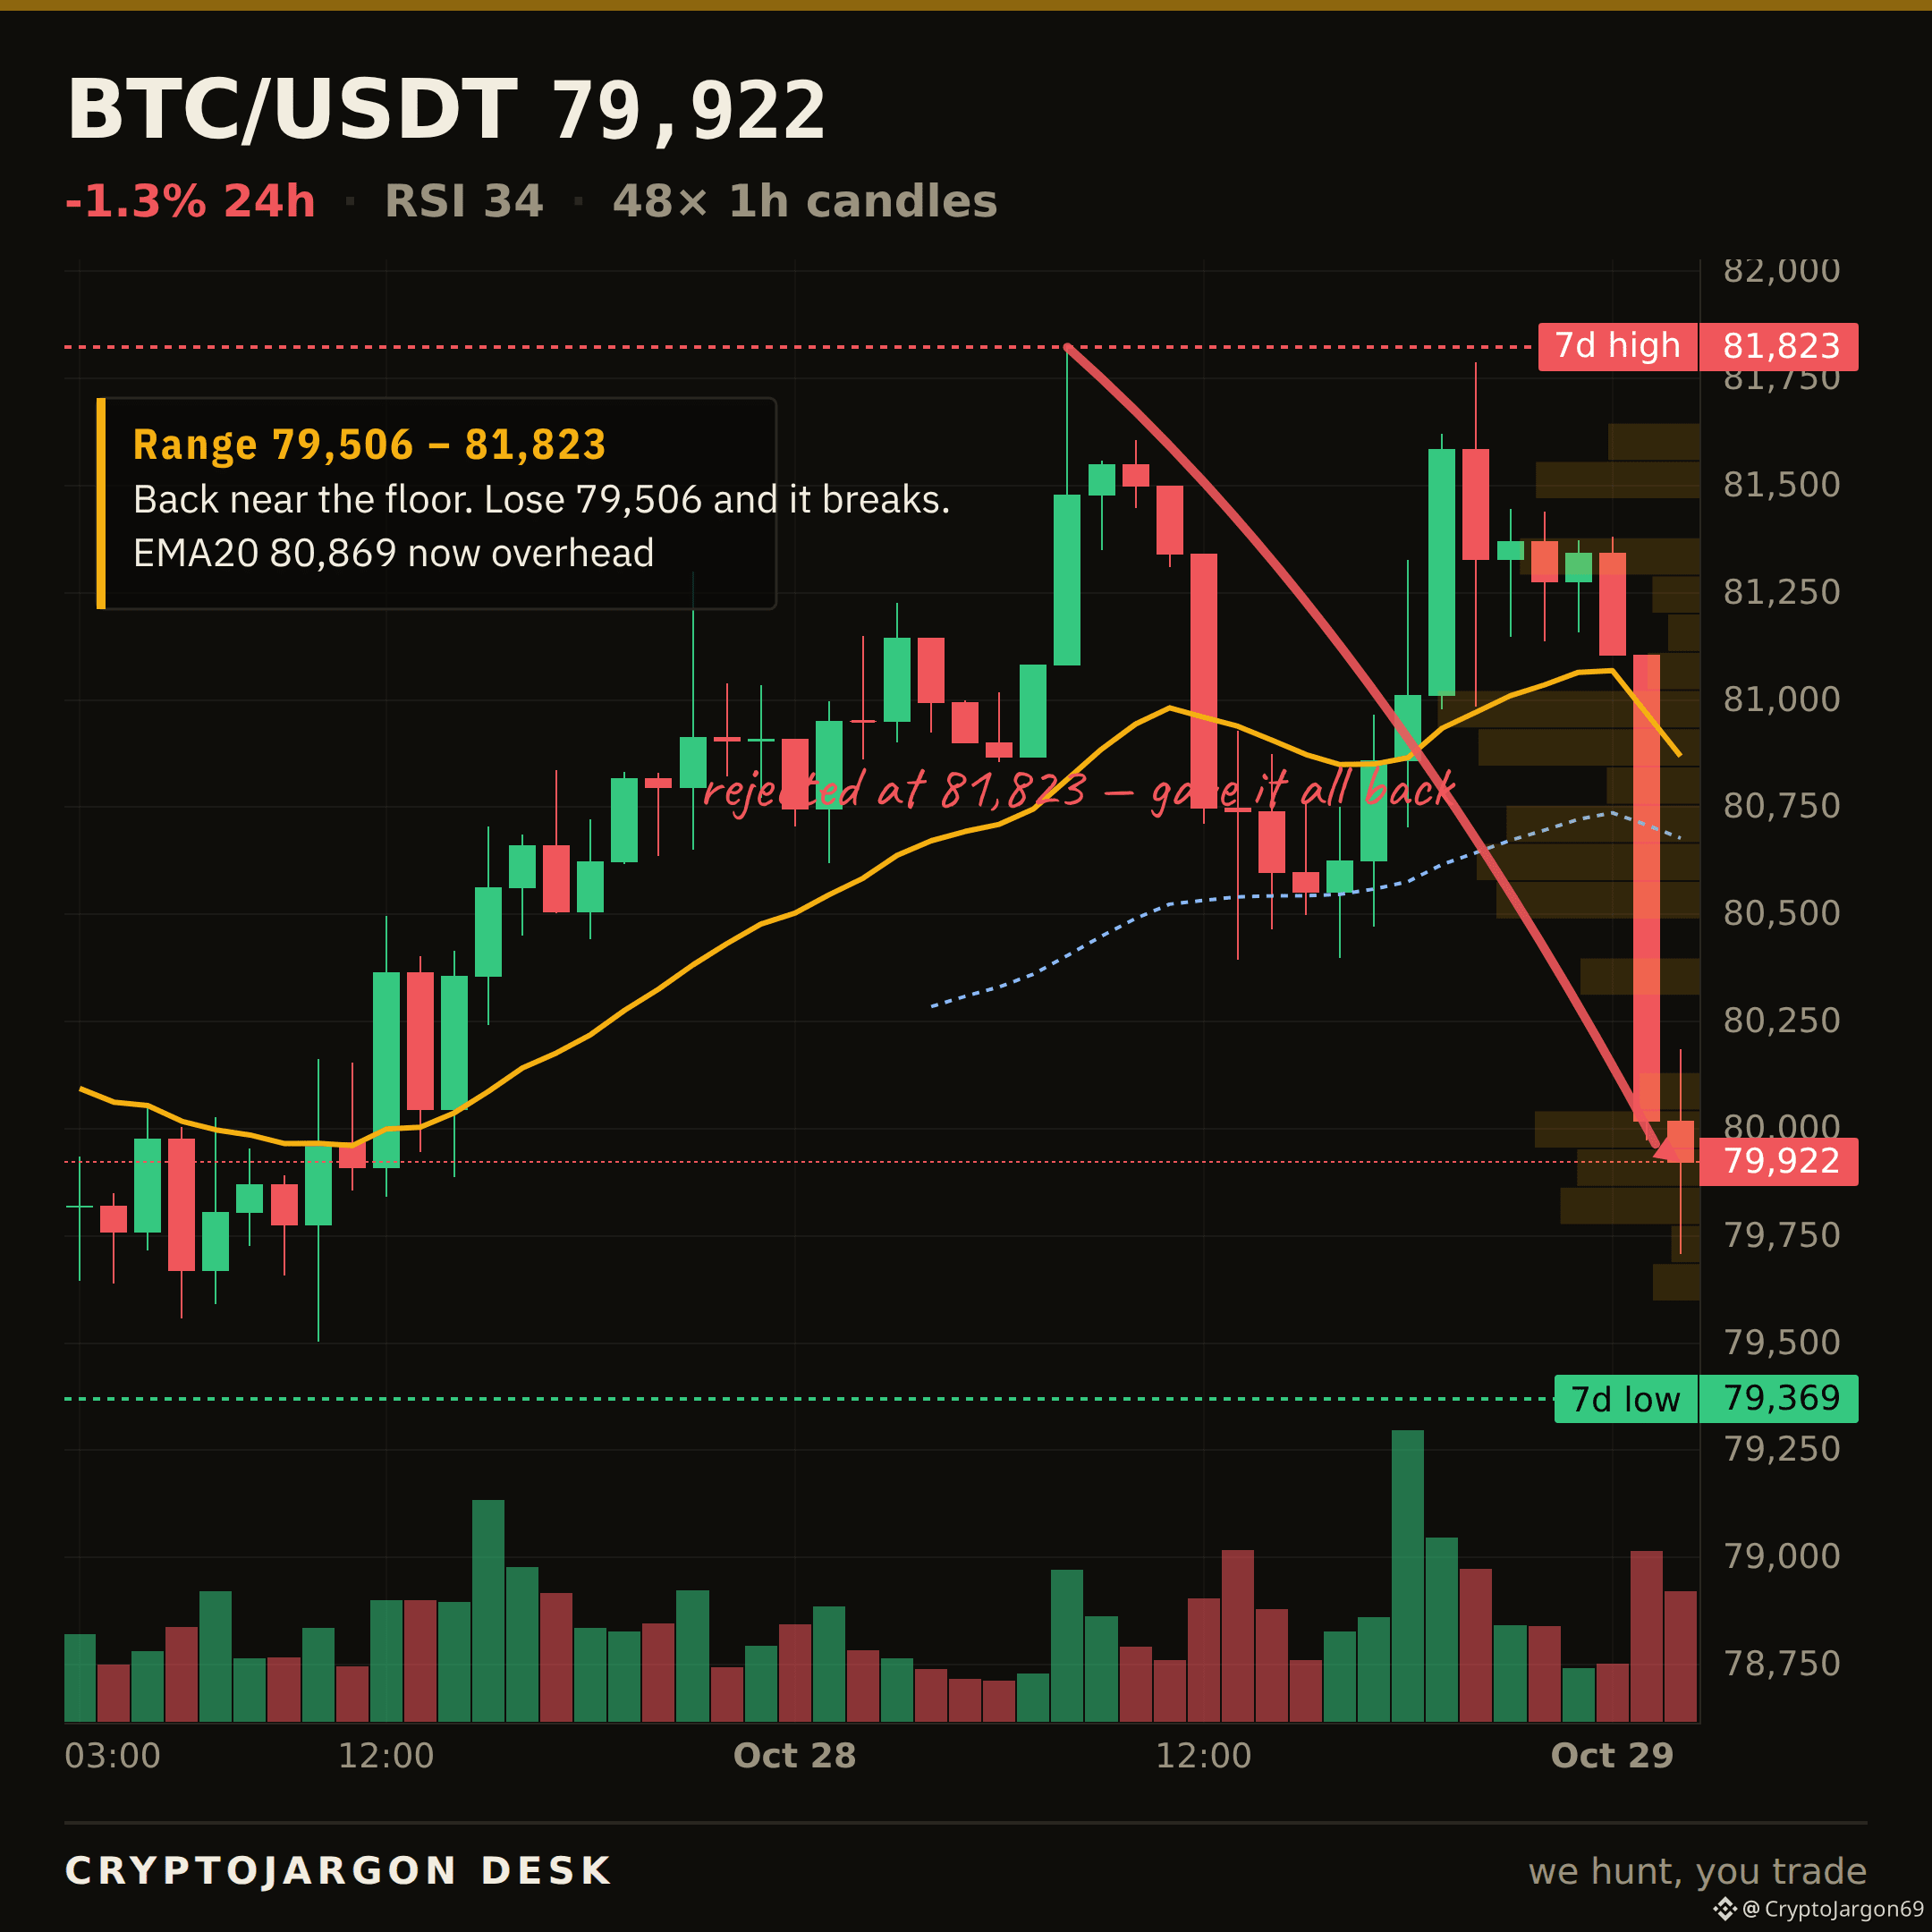
$80,671 was the floor we flagged on $BTC. Price closed below it — $79,922 now. The range beneath opens up, and that line flips into the ceiling it has to win back.
Reclaim from here, or is this the start of the next leg down?
$BTC
$BTC · THE LEVEL BROKE
That floor is gone.
$80,671 was the floor we flagged on $BTC . Price closed below it — $79,922 now. The range beneath opens up, and that line flips into the ceiling it has to win back.
Reclaim from here, or is this the start of the next leg down?
$BTC
That floor is gone.
$80,671 was the floor we flagged on $BTC . Price closed below it — $79,922 now. The range beneath opens up, and that line flips into the ceiling it has to win back.
Reclaim from here, or is this the start of the next leg down?
$BTC
64
查看翻譯
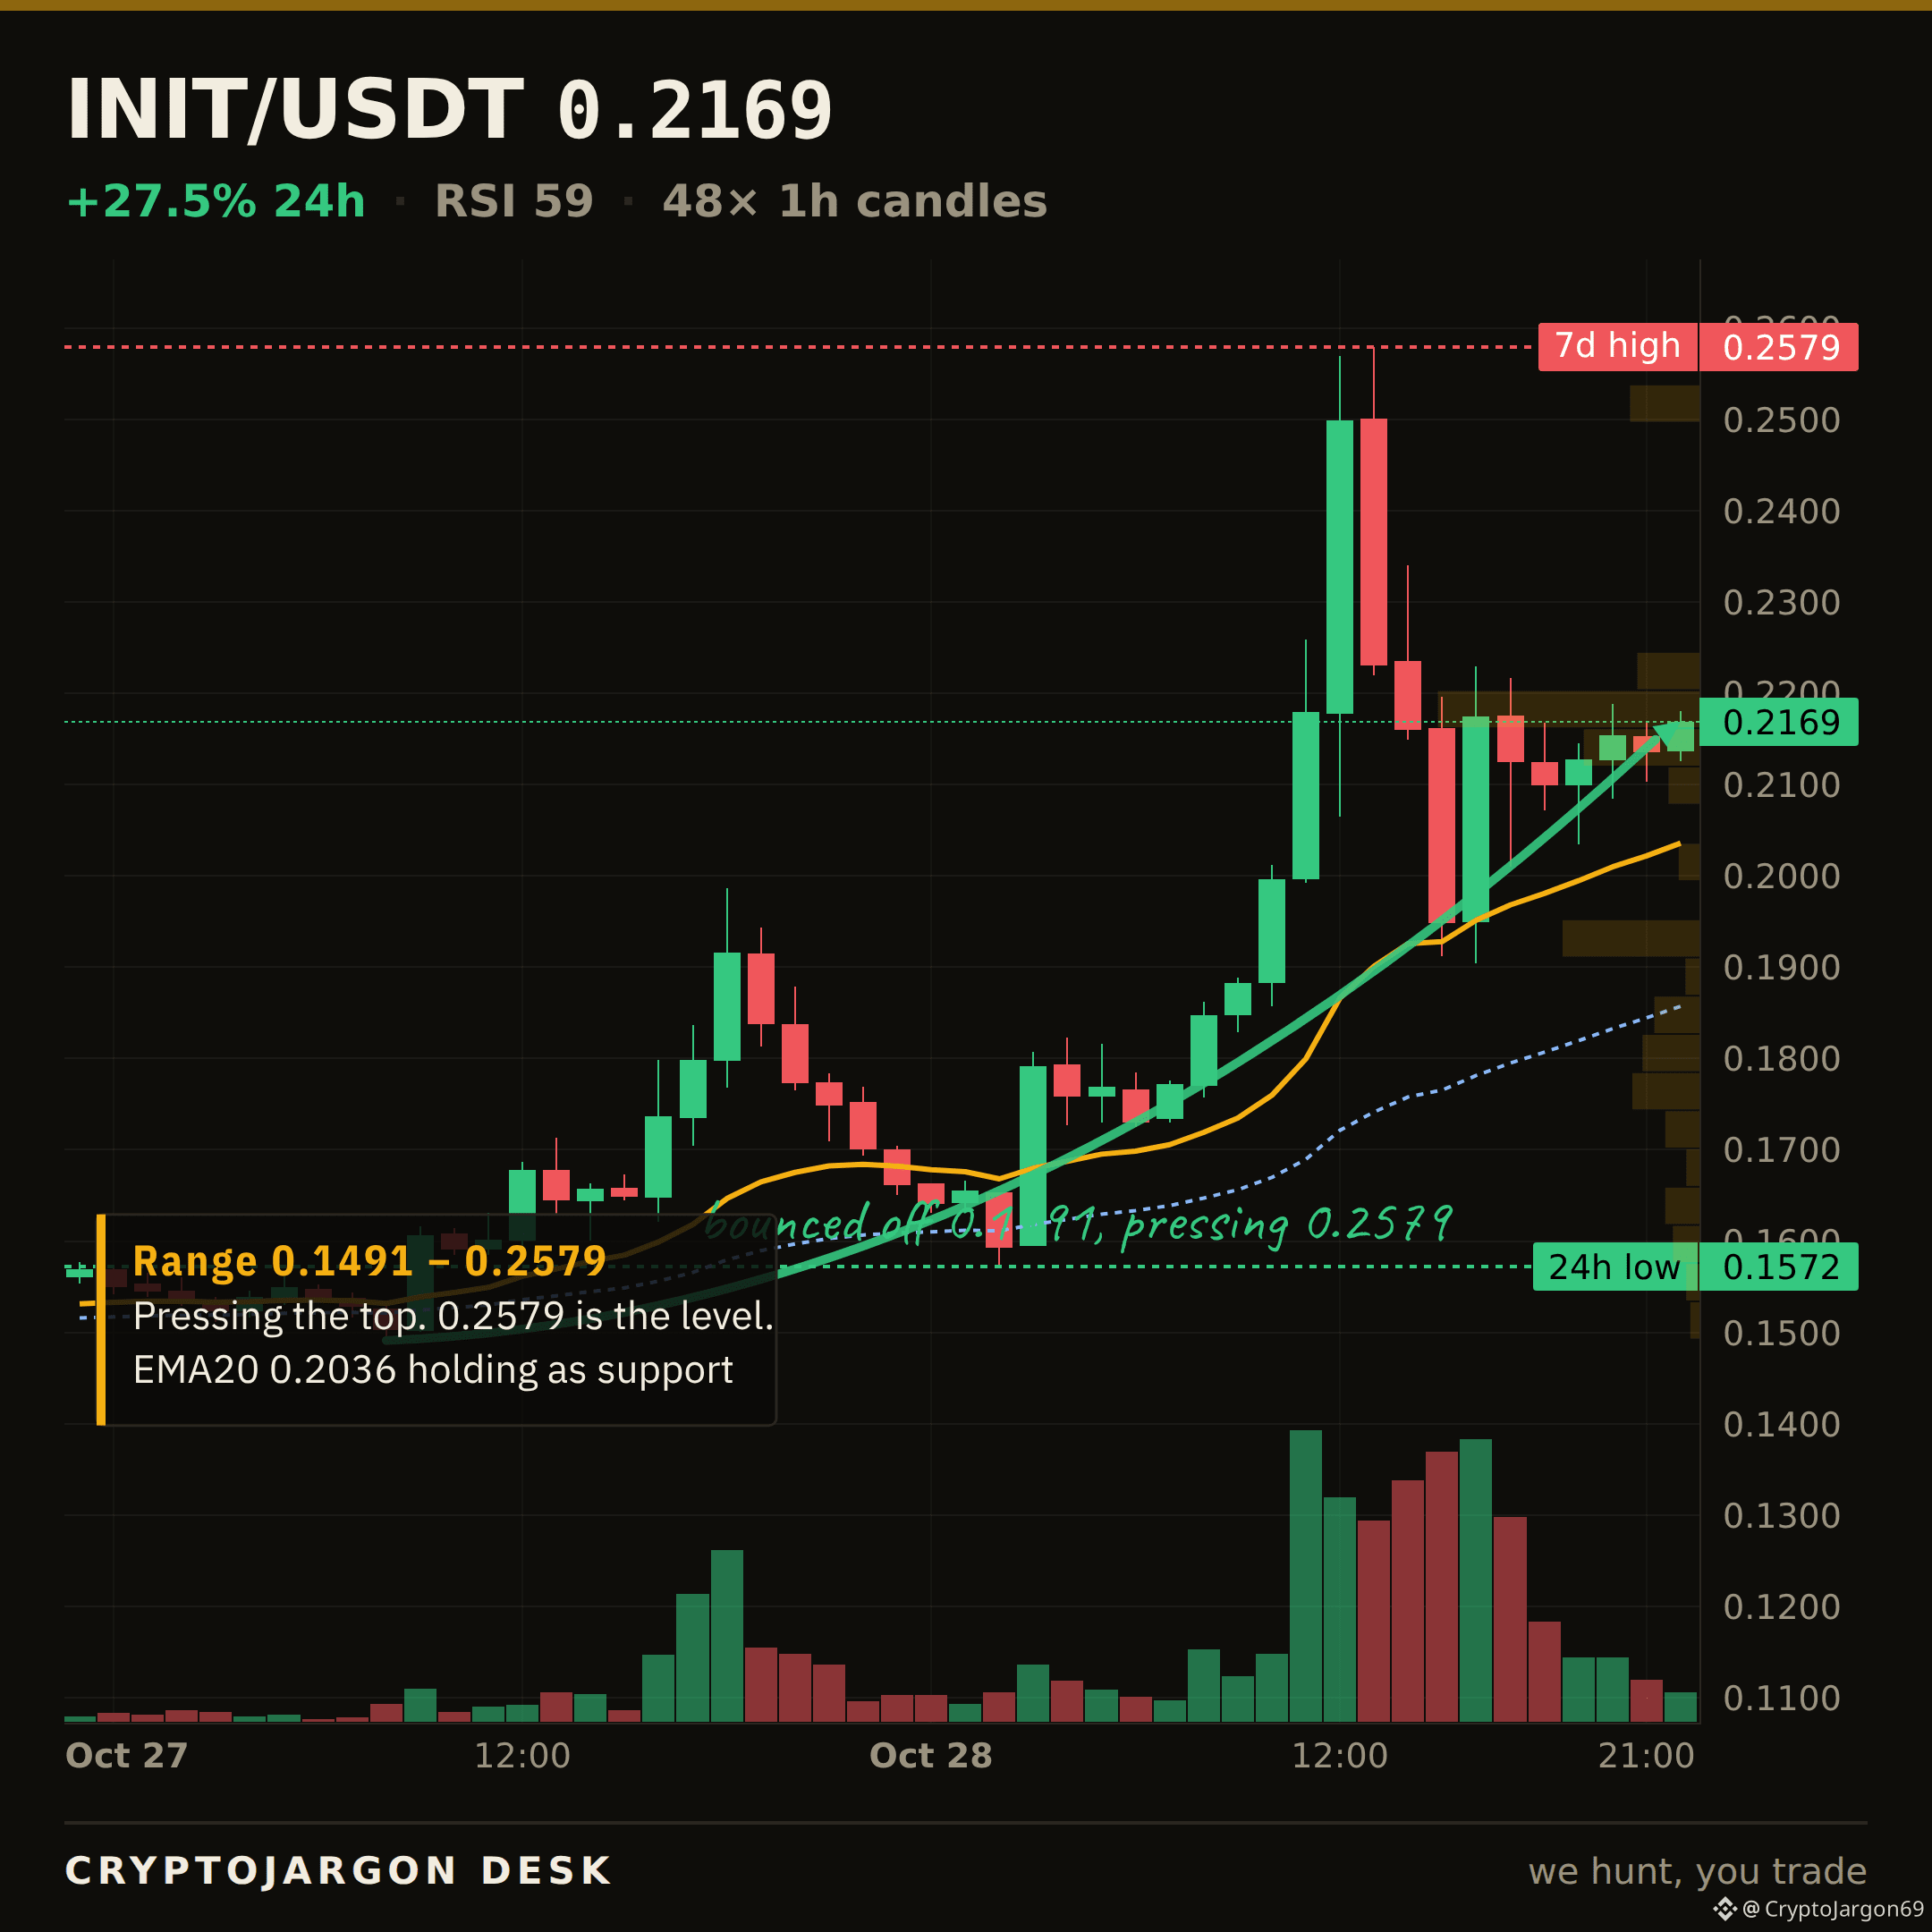
$INIT · MARKET STRUCTURE
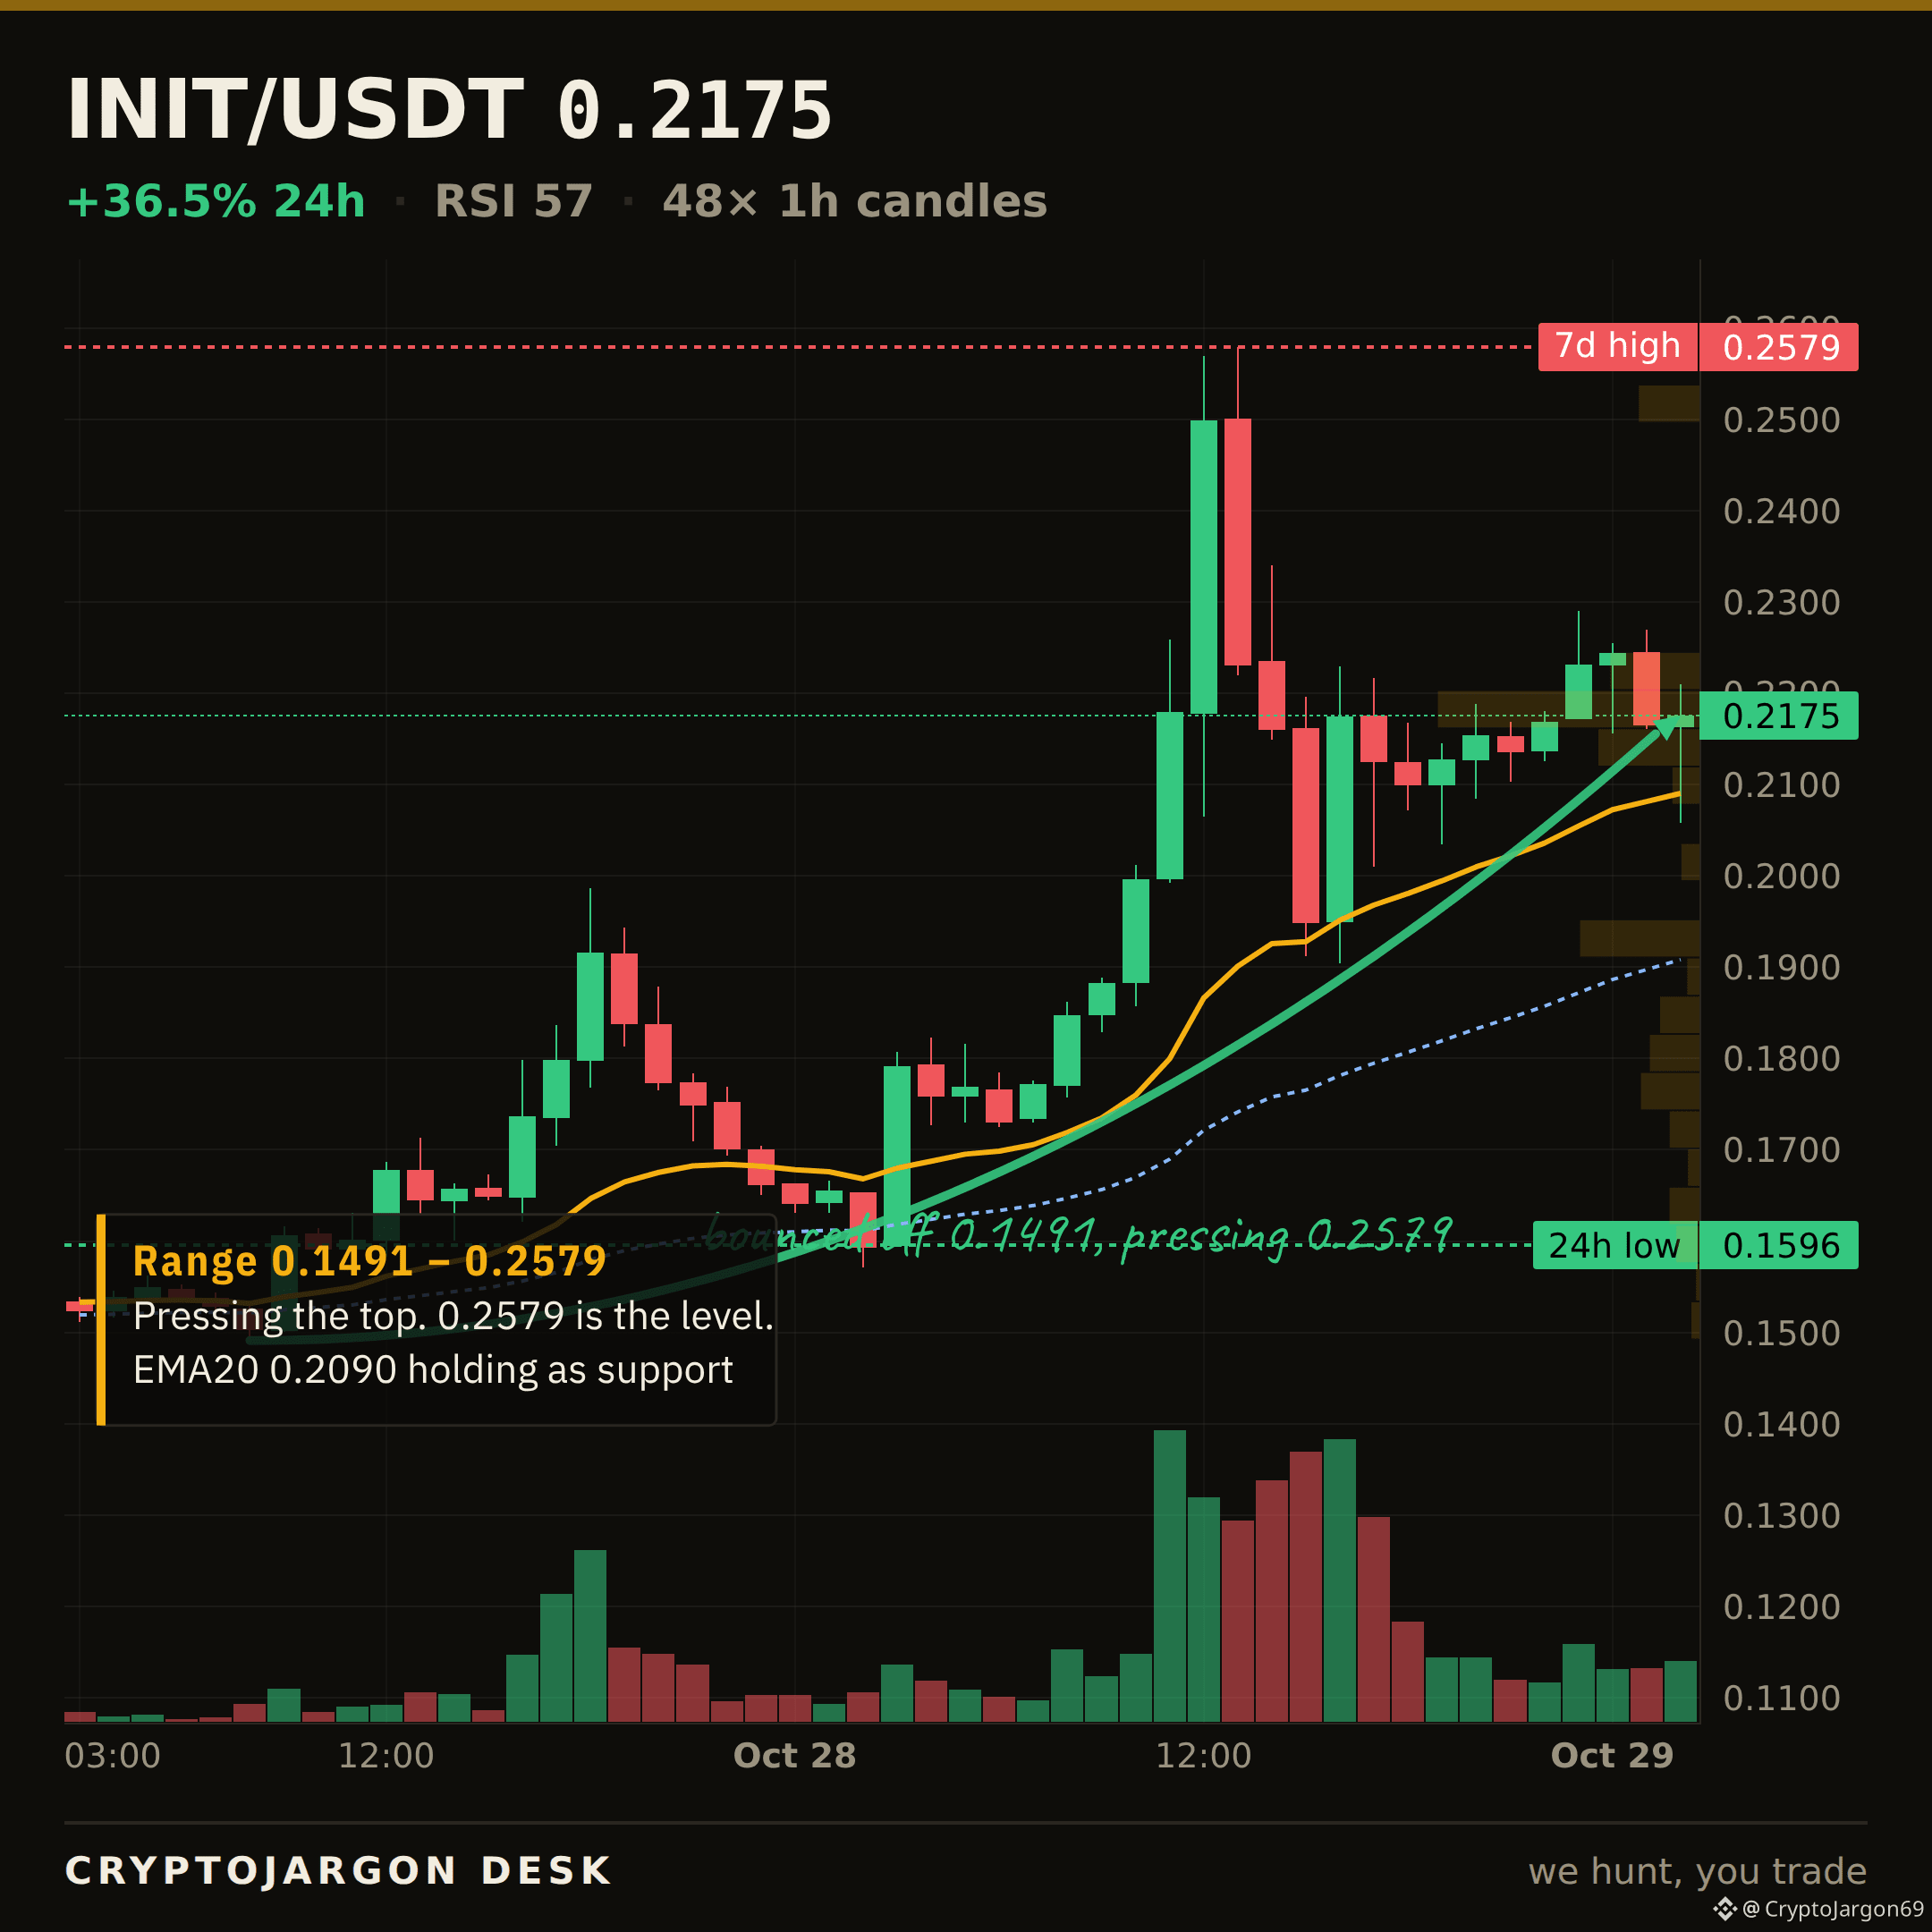
$0.218, +36.5% on the day.
Trend — price above both EMAs, the 20 over the 50.
Momentum — RSI 57.
Range — 59% up its 24h range ($0.16–$0.258).
Trend, momentum and range mostly point the same way — an aligned tape to the upside.
Levels: $0.258 24h high (ceiling) · $0.16 24h low (support) · 7d range $0.113–$0.258.
Chart: 1H candles, EMA20/50 + levels marked. $INIT
88
查看翻譯
$BCH · LEVEL TO WATCH
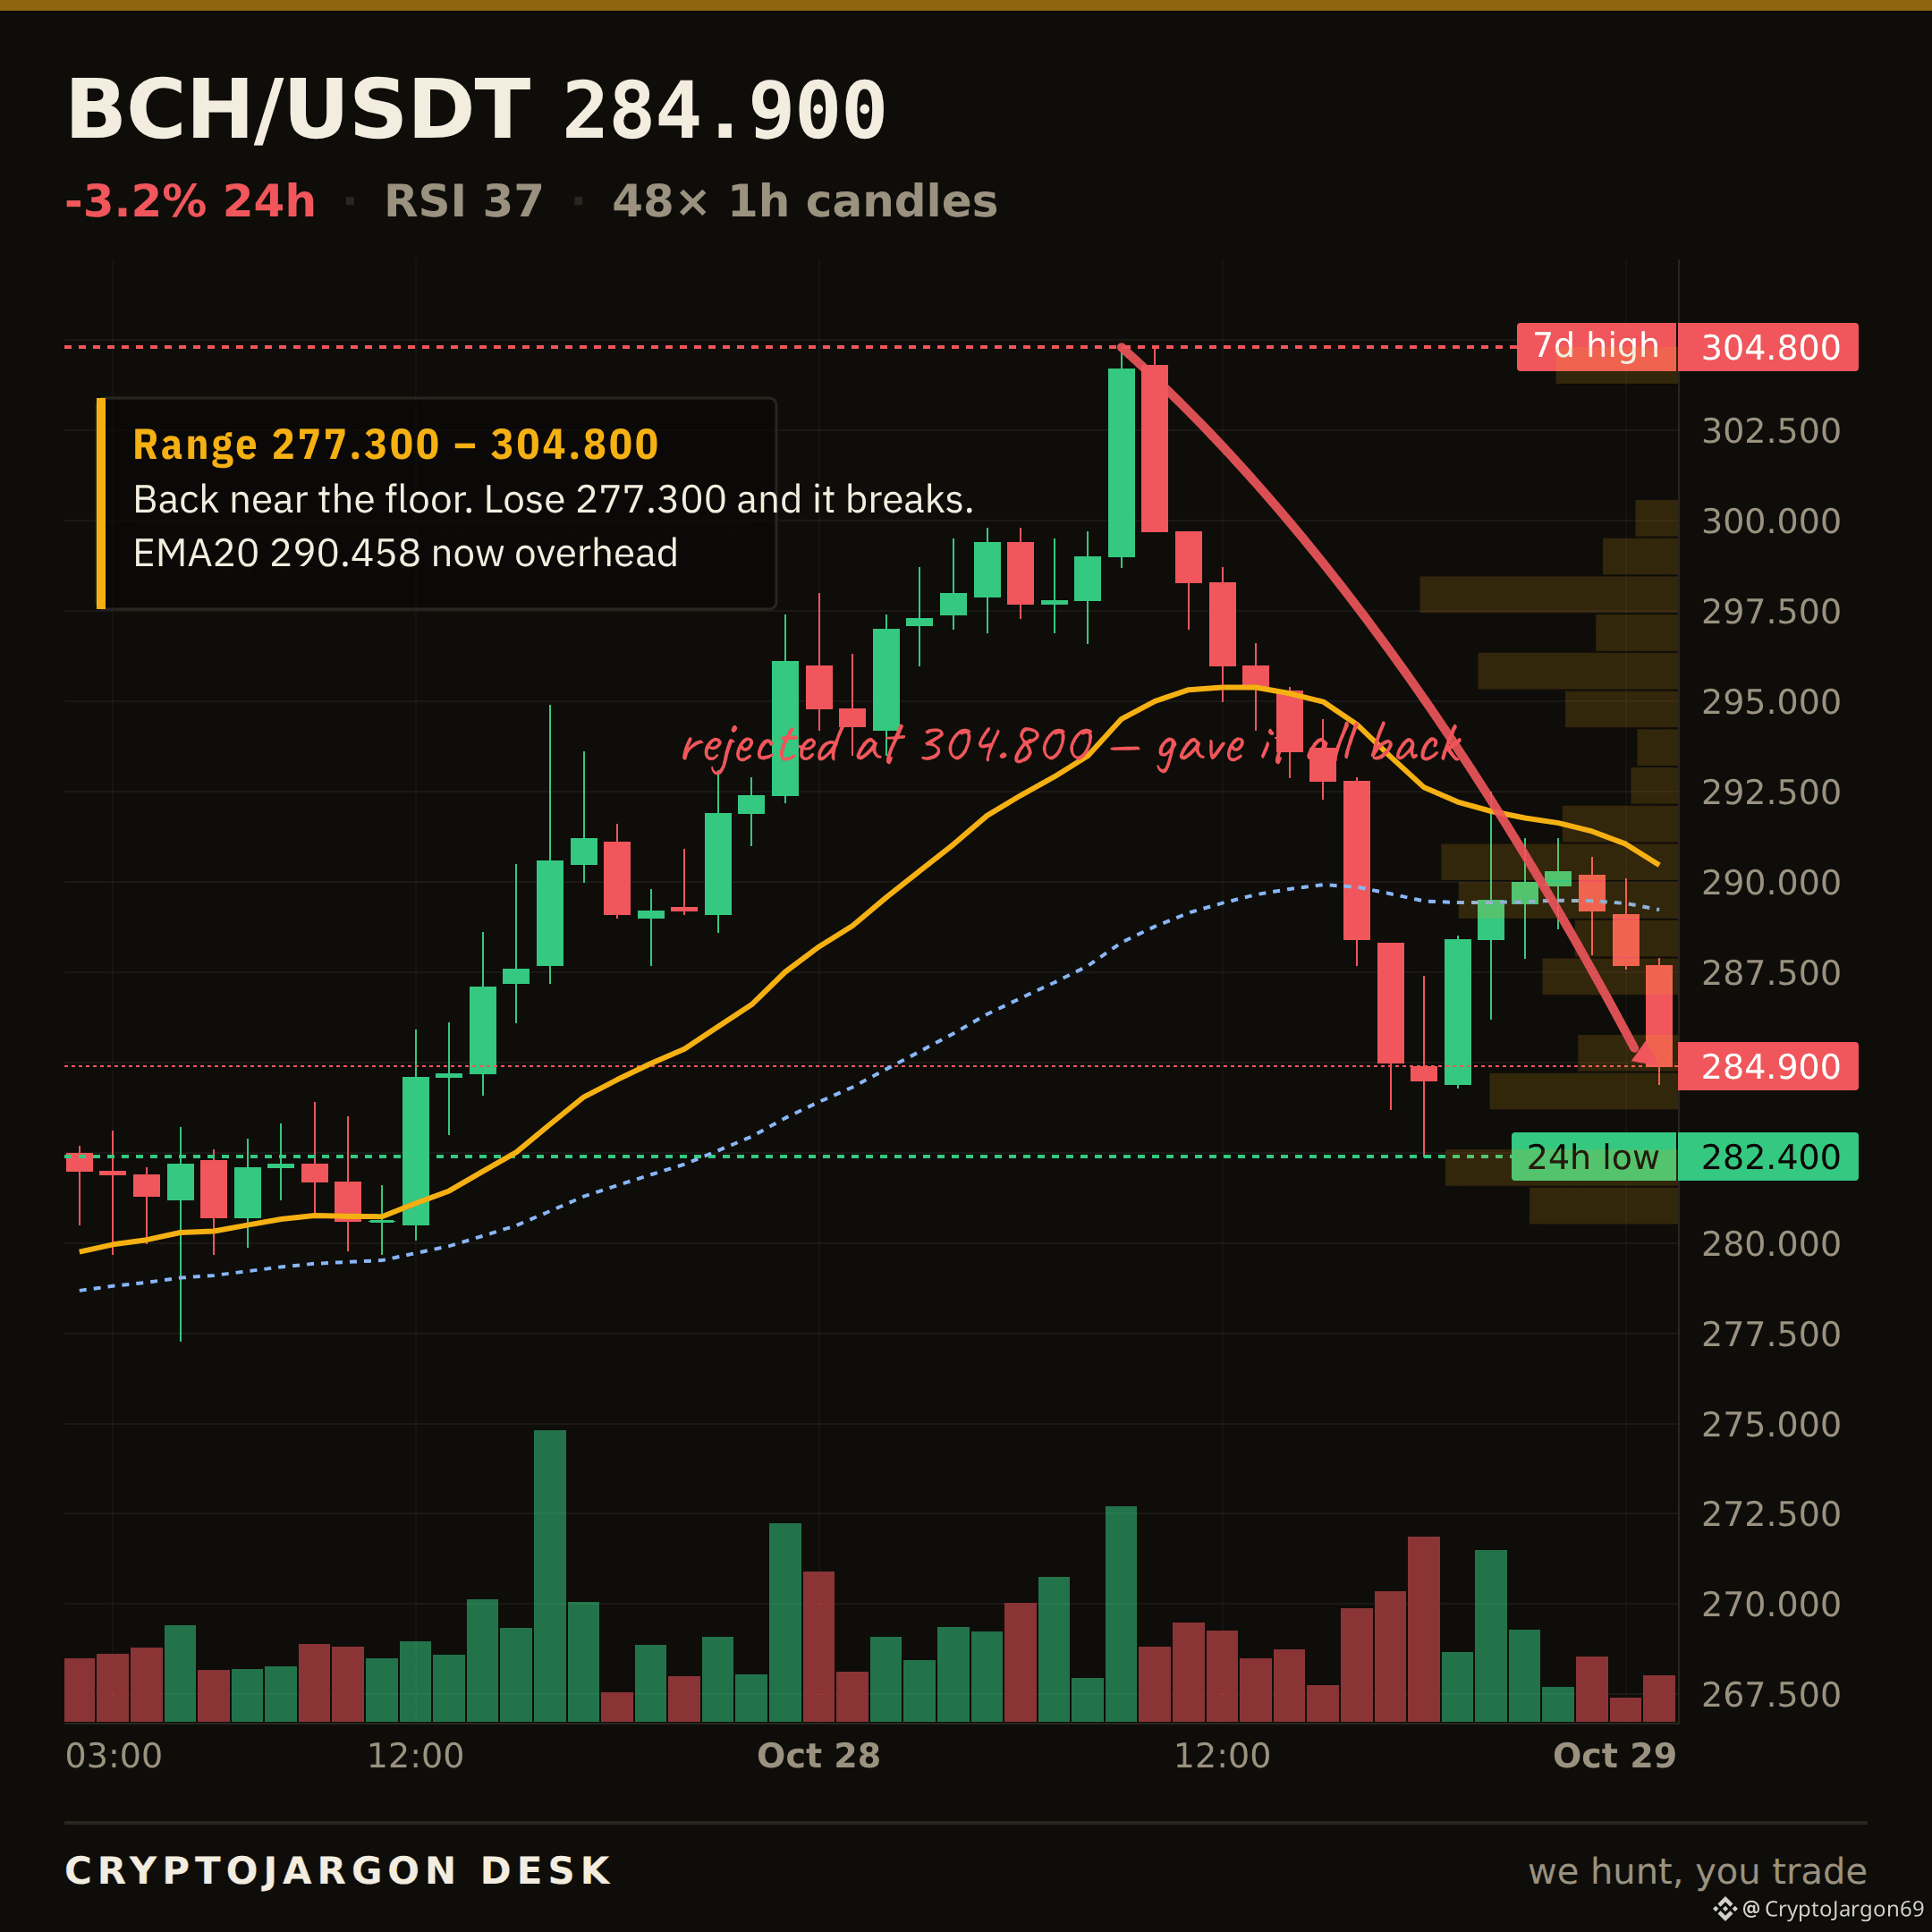
$284.90 now.
The line that matters is $282.40 — the 24h low, the floor the tape is sitting on.
Holding $282.40 keeps the structure intact; a clean close below opens the range beneath it. I'll follow up when it resolves.
Chart: the level is on it. $BCH
$BCH · LEVEL TO WATCH
$284.90 now.
The line that matters is $282.40 — the 24h low, the floor the tape is sitting on.
Holding $282.40 keeps the structure intact; a clean close below opens the range beneath it. I'll follow up when it resolves.
Chart: the level is on it. $BCH
$284.90 now.
The line that matters is $282.40 — the 24h low, the floor the tape is sitting on.
Holding $282.40 keeps the structure intact; a clean close below opens the range beneath it. I'll follow up when it resolves.
Chart: the level is on it. $BCH
102
INIT 今天上漲了 25.9%,但從 0.258 的高點回落,吐回了大部分漲幅。
這根 K 線留下了長長的上影線,成交量達 1900 萬美元。7 日區間頂部出現了大量拋壓。目前價格守在 0.204 的 EMA20 上方。
這看起來是一次典型的受阻回落。過去 24 小時積累的上漲動能剛好撞上了賣壓。
這是下一波上漲前適合買入的健康回調,還是那根上影線意味着有人藉機出逃?
$INIT
關注我,獲取下一次分析——行情一動,我就發佈。
INIT 今天上漲了 25.9%,但從 0.258 的高點回落,吐回了大部分漲幅。
這根 K 線留下了長長的上影線,成交量達 1900 萬美元。7 日區間頂部出現了大量拋壓。目前價格守在 0.204 的 EMA20 上方。
這看起來是一次典型的受阻回落。過去 24 小時積累的上漲動能剛好撞上了賣壓。
這是下一波上漲前適合買入的健康回調,還是那根上影線意味着有人藉機出逃?
$INIT
關注我,獲取下一次分析——行情一動,我就發佈。
這根 K 線留下了長長的上影線,成交量達 1900 萬美元。7 日區間頂部出現了大量拋壓。目前價格守在 0.204 的 EMA20 上方。
這看起來是一次典型的受阻回落。過去 24 小時積累的上漲動能剛好撞上了賣壓。
這是下一波上漲前適合買入的健康回調,還是那根上影線意味着有人藉機出逃?
$INIT
關注我,獲取下一次分析——行情一動,我就發佈。
41
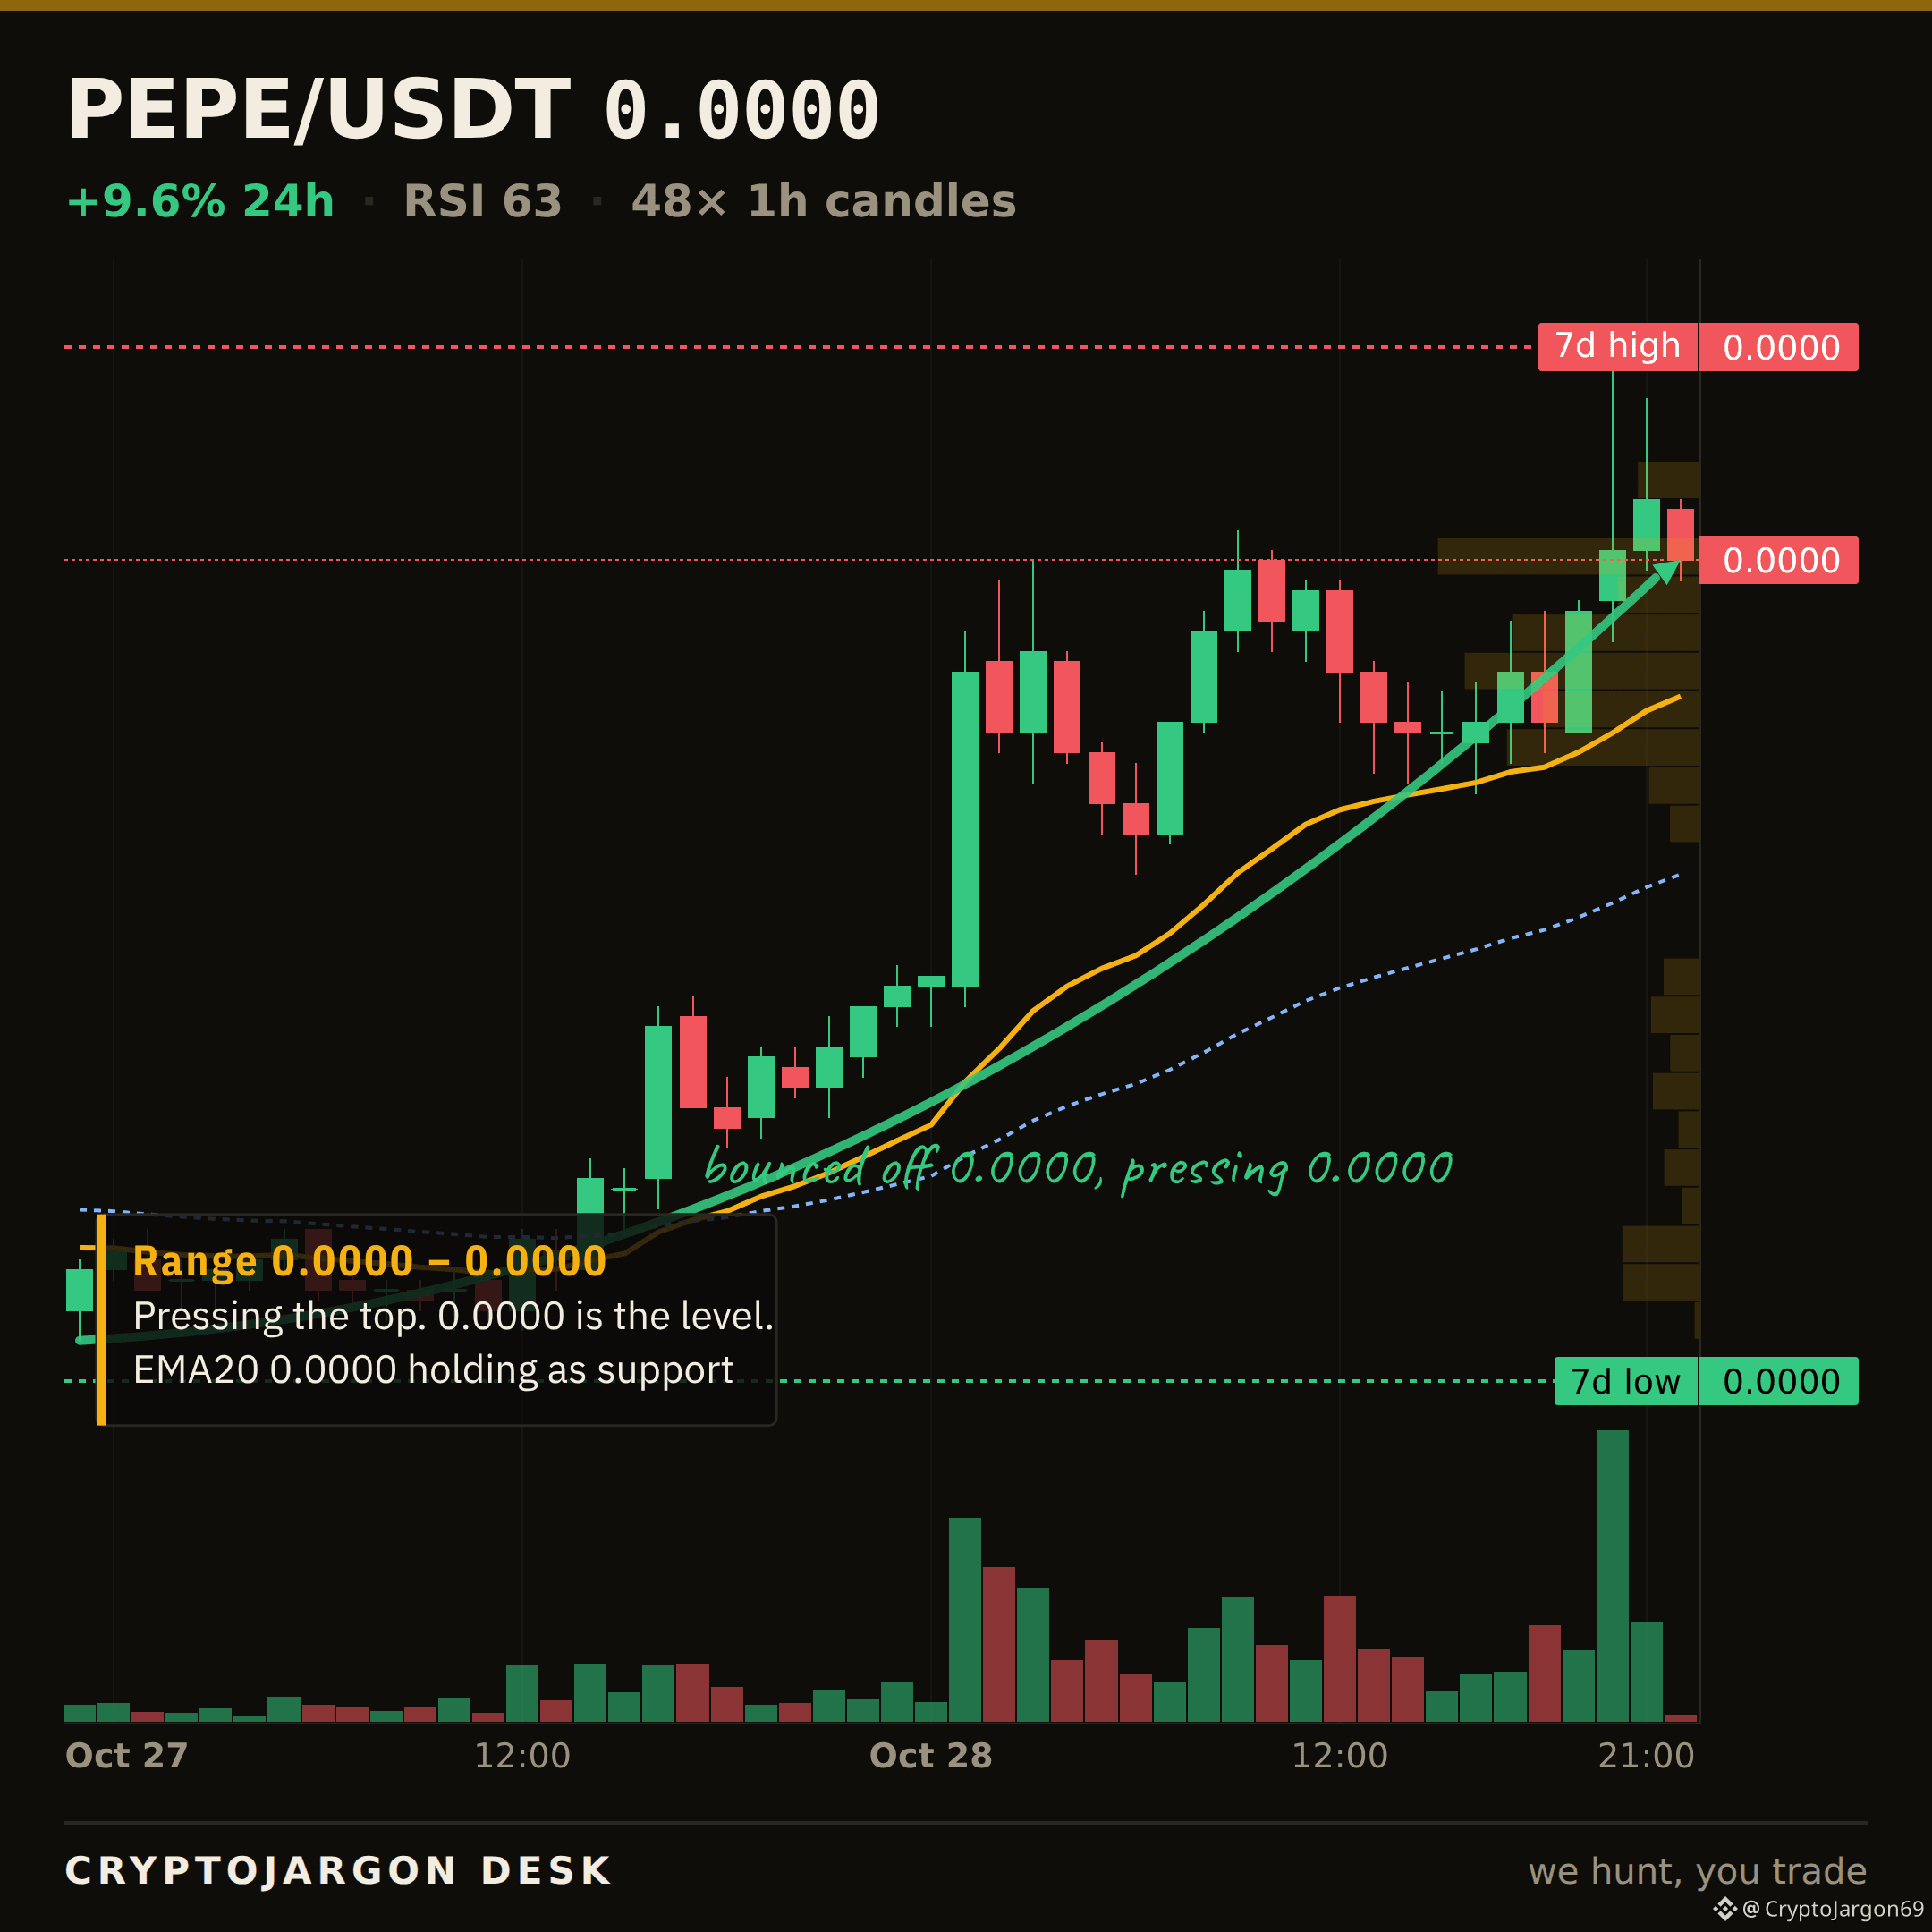
PEPE 上漲了 11.3%,直衝 7 日高點 0.00000523。
價格走勢守在短期移動均線上方,但 24 小時成交量僅爲 1.13 億美元。有人稱這是亞洲芯片股上漲帶來的溢出效應。我們並不這麼認爲。整體市場走勢中性,恐懼與貪婪指數爲 51。這看起來更像是針對 PEPE 的個別考驗,而不是宏觀浪潮帶動所有資產上漲。
那麼,這是一次乾淨利落的突破,還是他們只是在區間上方掃掉止損單?
$PEPE #PEPE
我們每天都會持續發佈內容。如果覺得有用,歡迎關注。
PEPE 上漲了 11.3%,直衝 7 日高點 0.00000523。
價格走勢守在短期移動均線上方,但 24 小時成交量僅爲 1.13 億美元。有人稱這是亞洲芯片股上漲帶來的溢出效應。我們並不這麼認爲。整體市場走勢中性,恐懼與貪婪指數爲 51。這看起來更像是針對 PEPE 的個別考驗,而不是宏觀浪潮帶動所有資產上漲。
那麼,這是一次乾淨利落的突破,還是他們只是在區間上方掃掉止損單?
$PEPE #PEPE
我們每天都會持續發佈內容。如果覺得有用,歡迎關注。
價格走勢守在短期移動均線上方,但 24 小時成交量僅爲 1.13 億美元。有人稱這是亞洲芯片股上漲帶來的溢出效應。我們並不這麼認爲。整體市場走勢中性,恐懼與貪婪指數爲 51。這看起來更像是針對 PEPE 的個別考驗,而不是宏觀浪潮帶動所有資產上漲。
那麼,這是一次乾淨利落的突破,還是他們只是在區間上方掃掉止損單?
$PEPE #PEPE
我們每天都會持續發佈內容。如果覺得有用,歡迎關注。
47
查看翻譯
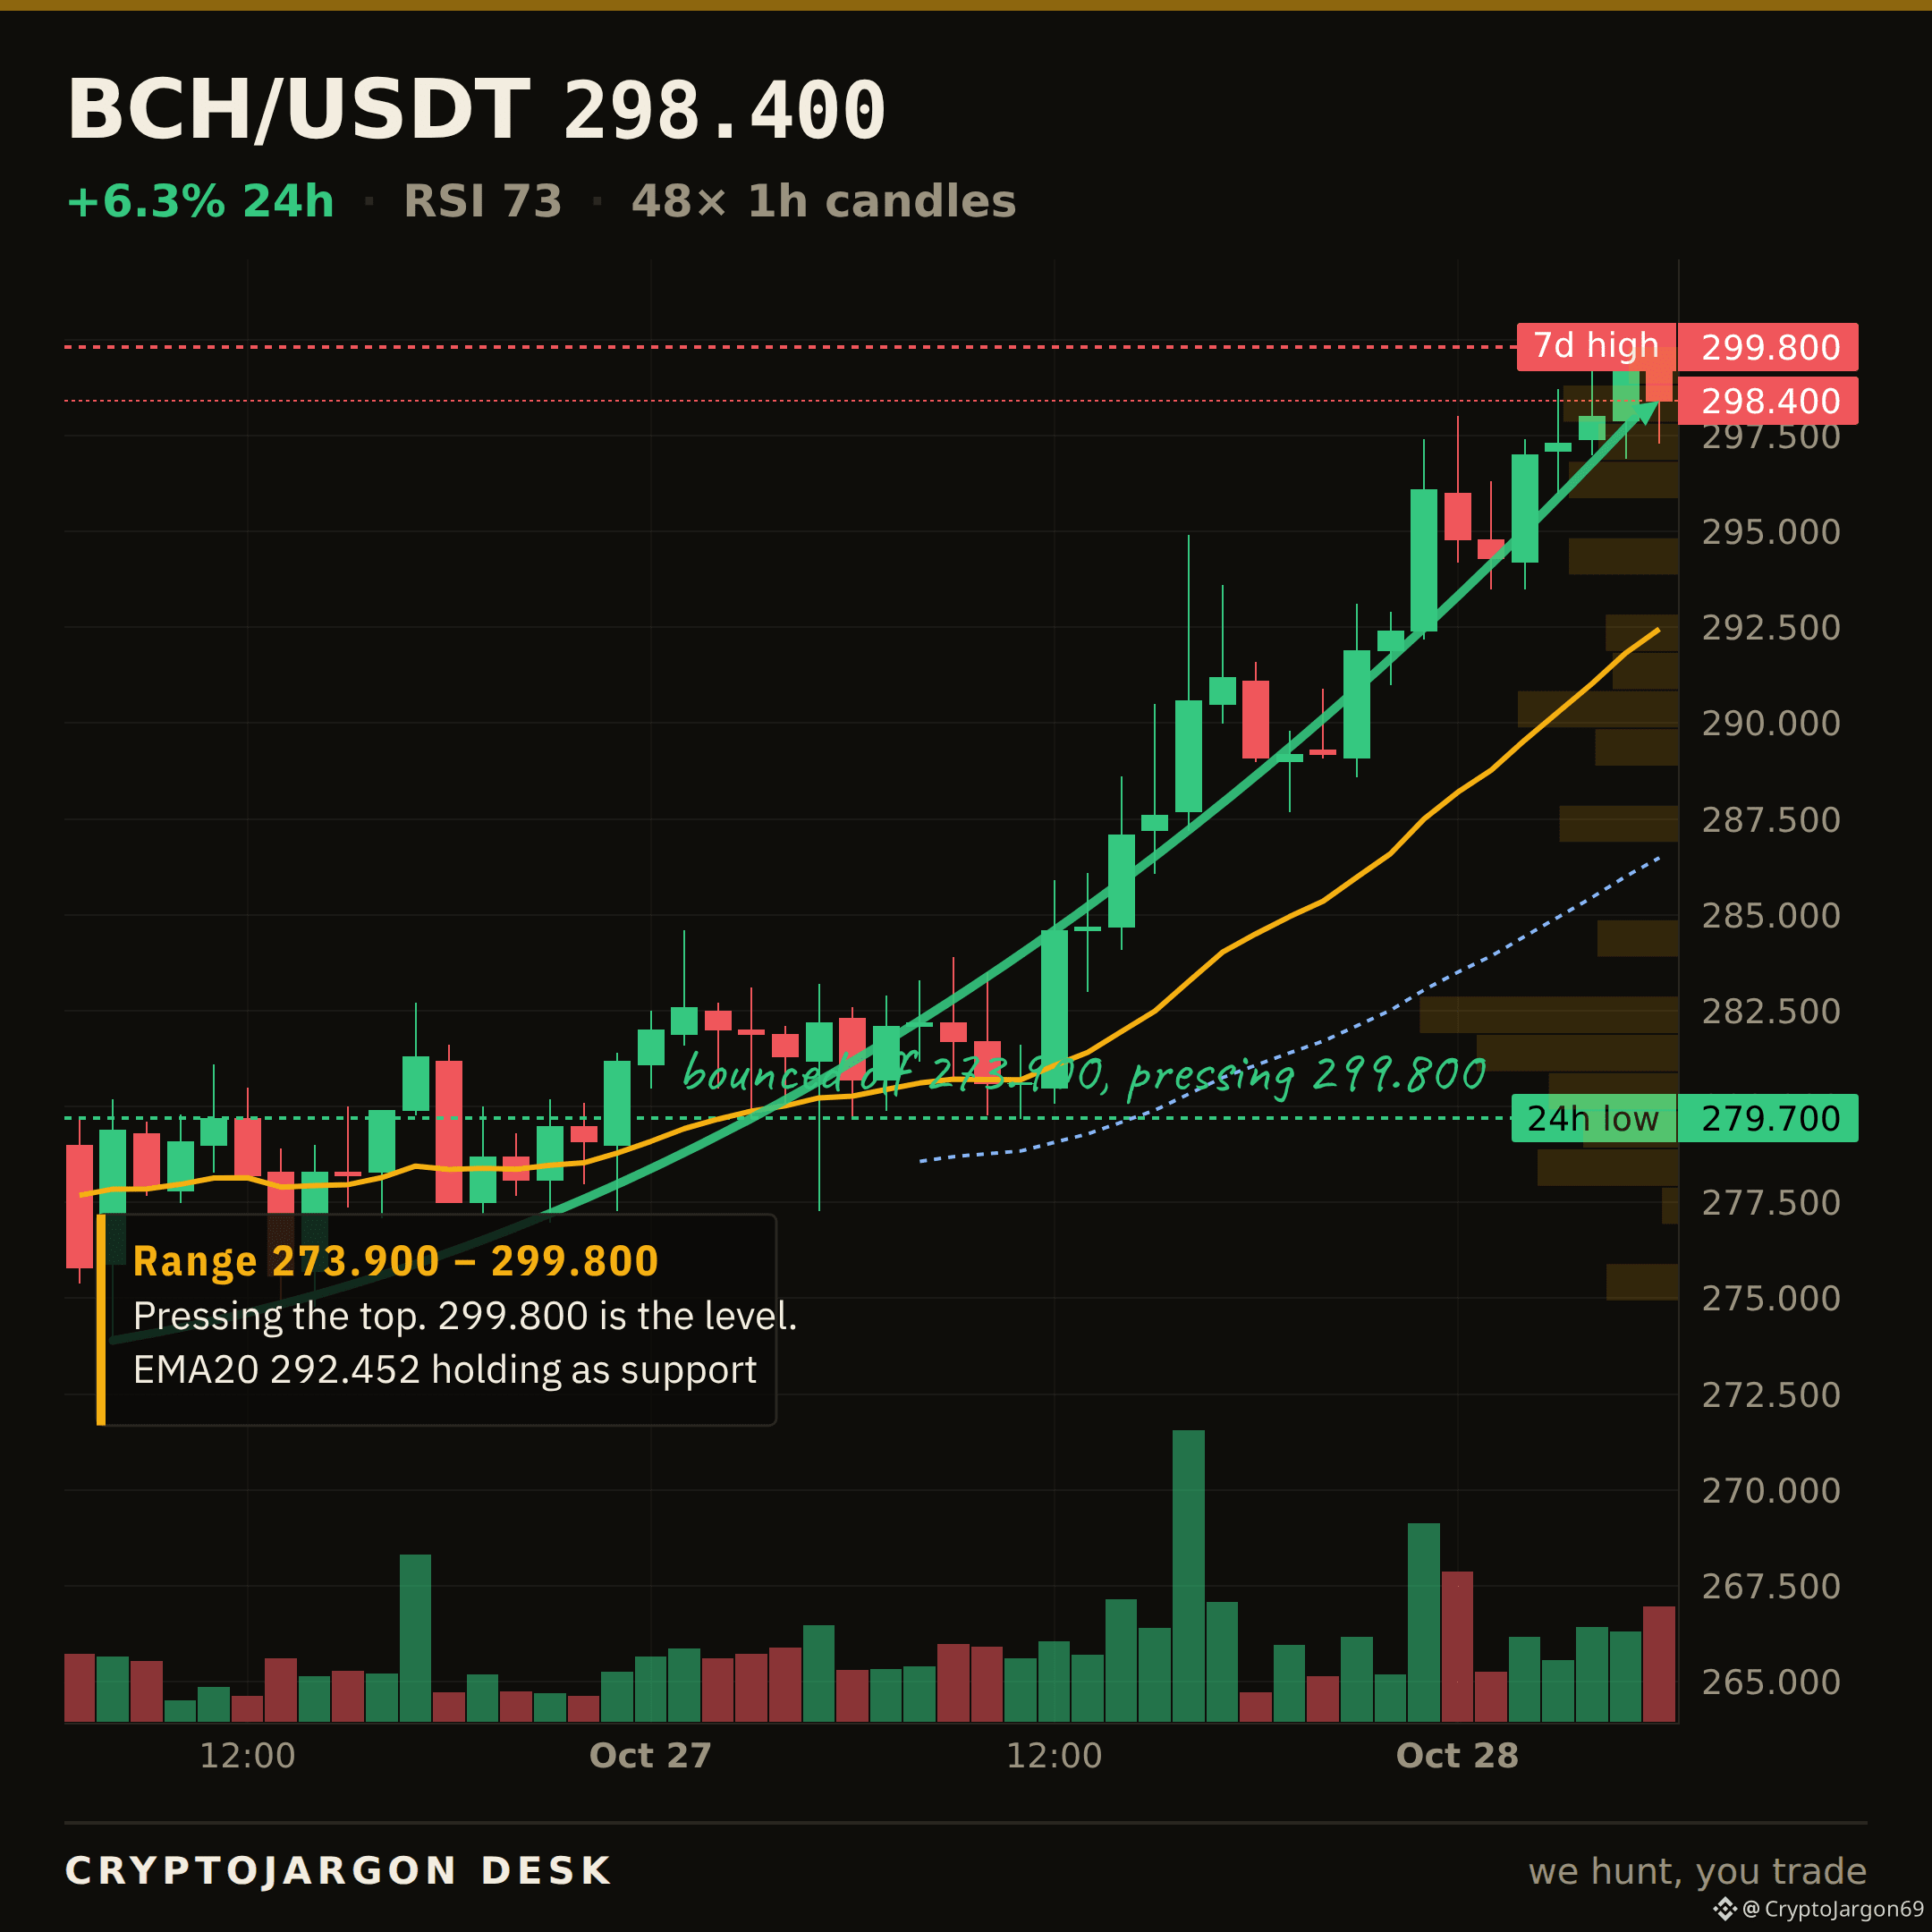
$BCH · THE LEVEL CLEARED
That ceiling is gone.
$298.00 was the ceiling we flagged on $BCH. Price closed back above it — $298.40 now. It flips into the floor that has to hold, and the upper range is open while it does.
Does $298.00 hold as support now, or is this a fakeout?
$BCH
$BCH · THE LEVEL CLEARED
That ceiling is gone.
$298.00 was the ceiling we flagged on $BCH . Price closed back above it — $298.40 now. It flips into the floor that has to hold, and the upper range is open while it does.
Does $298.00 hold as support now, or is this a fakeout?
$BCH
That ceiling is gone.
$298.00 was the ceiling we flagged on $BCH . Price closed back above it — $298.40 now. It flips into the floor that has to hold, and the upper range is open while it does.
Does $298.00 hold as support now, or is this a fakeout?
$BCH
120
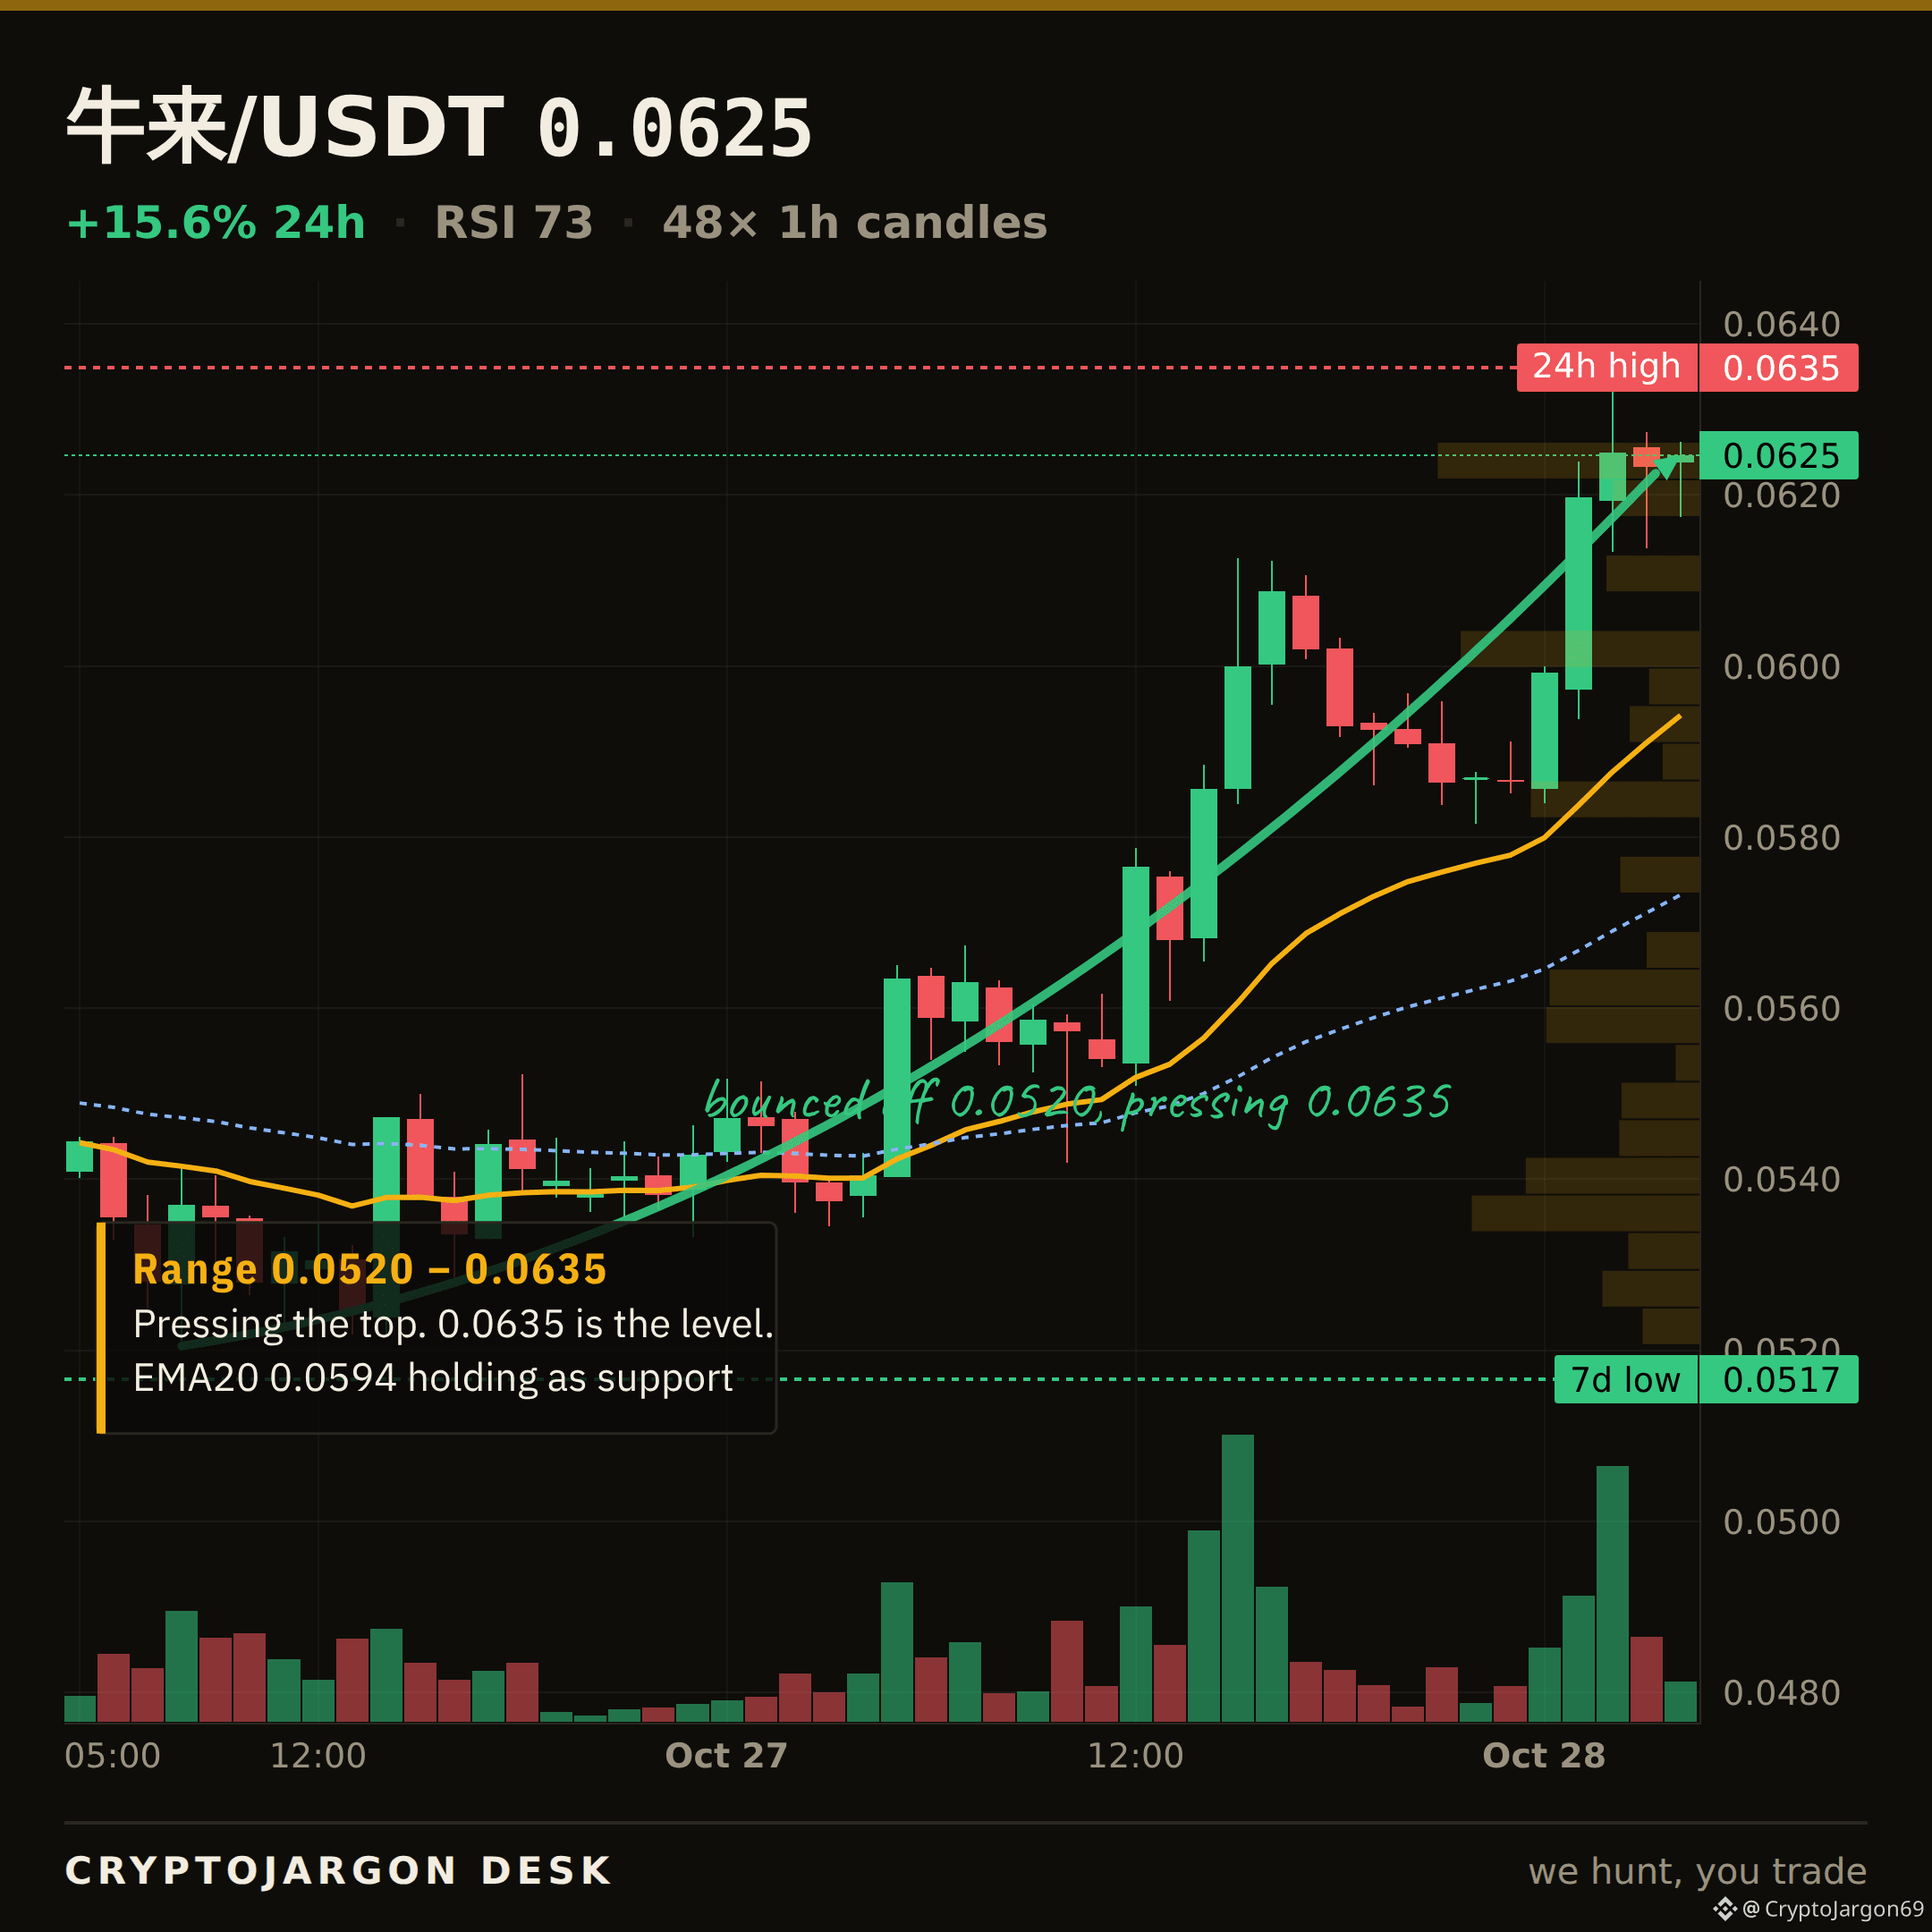
$牛來 · 市場結構
$0.0625,今日上漲 15.6%。
趨勢 — 價格高於兩條 EMA,且 EMA20 高於 EMA50。
動能 — RSI 爲 73。
區間 — 價格處於 24 小時區間($0.054–$0.0635)的上方 89% 位置。
趨勢、動能和區間大體指向同一方向 — 盤面走勢一致向上。
關鍵位:$0.0635(24 小時高點,阻力位) · $0.054(24 小時低點,支撐位) · 7 日區間 $0.0517–$0.0648。
圖表:1 小時 K 線,標示 EMA20/50 和關鍵位。$牛來
$牛來 · 市場結構
$0.0625,今日上漲 15.6%。
趨勢 — 價格高於兩條 EMA,且 EMA20 高於 EMA50。
動能 — RSI 爲 73。
區間 — 價格處於 24 小時區間($0.054–$0.0635)的上方 89% 位置。
趨勢、動能和區間大體指向同一方向 — 盤面走勢一致向上。
關鍵位:$0.0635(24 小時高點,阻力位) · $0.054(24 小時低點,支撐位) · 7 日區間 $0.0517–$0.0648。
圖表:1 小時 K 線,標示 EMA20/50 和關鍵位。$牛來
$0.0625,今日上漲 15.6%。
趨勢 — 價格高於兩條 EMA,且 EMA20 高於 EMA50。
動能 — RSI 爲 73。
區間 — 價格處於 24 小時區間($0.054–$0.0635)的上方 89% 位置。
趨勢、動能和區間大體指向同一方向 — 盤面走勢一致向上。
關鍵位:$0.0635(24 小時高點,阻力位) · $0.054(24 小時低點,支撐位) · 7 日區間 $0.0517–$0.0648。
圖表:1 小時 K 線,標示 EMA20/50 和關鍵位。$牛來
41
查看翻譯
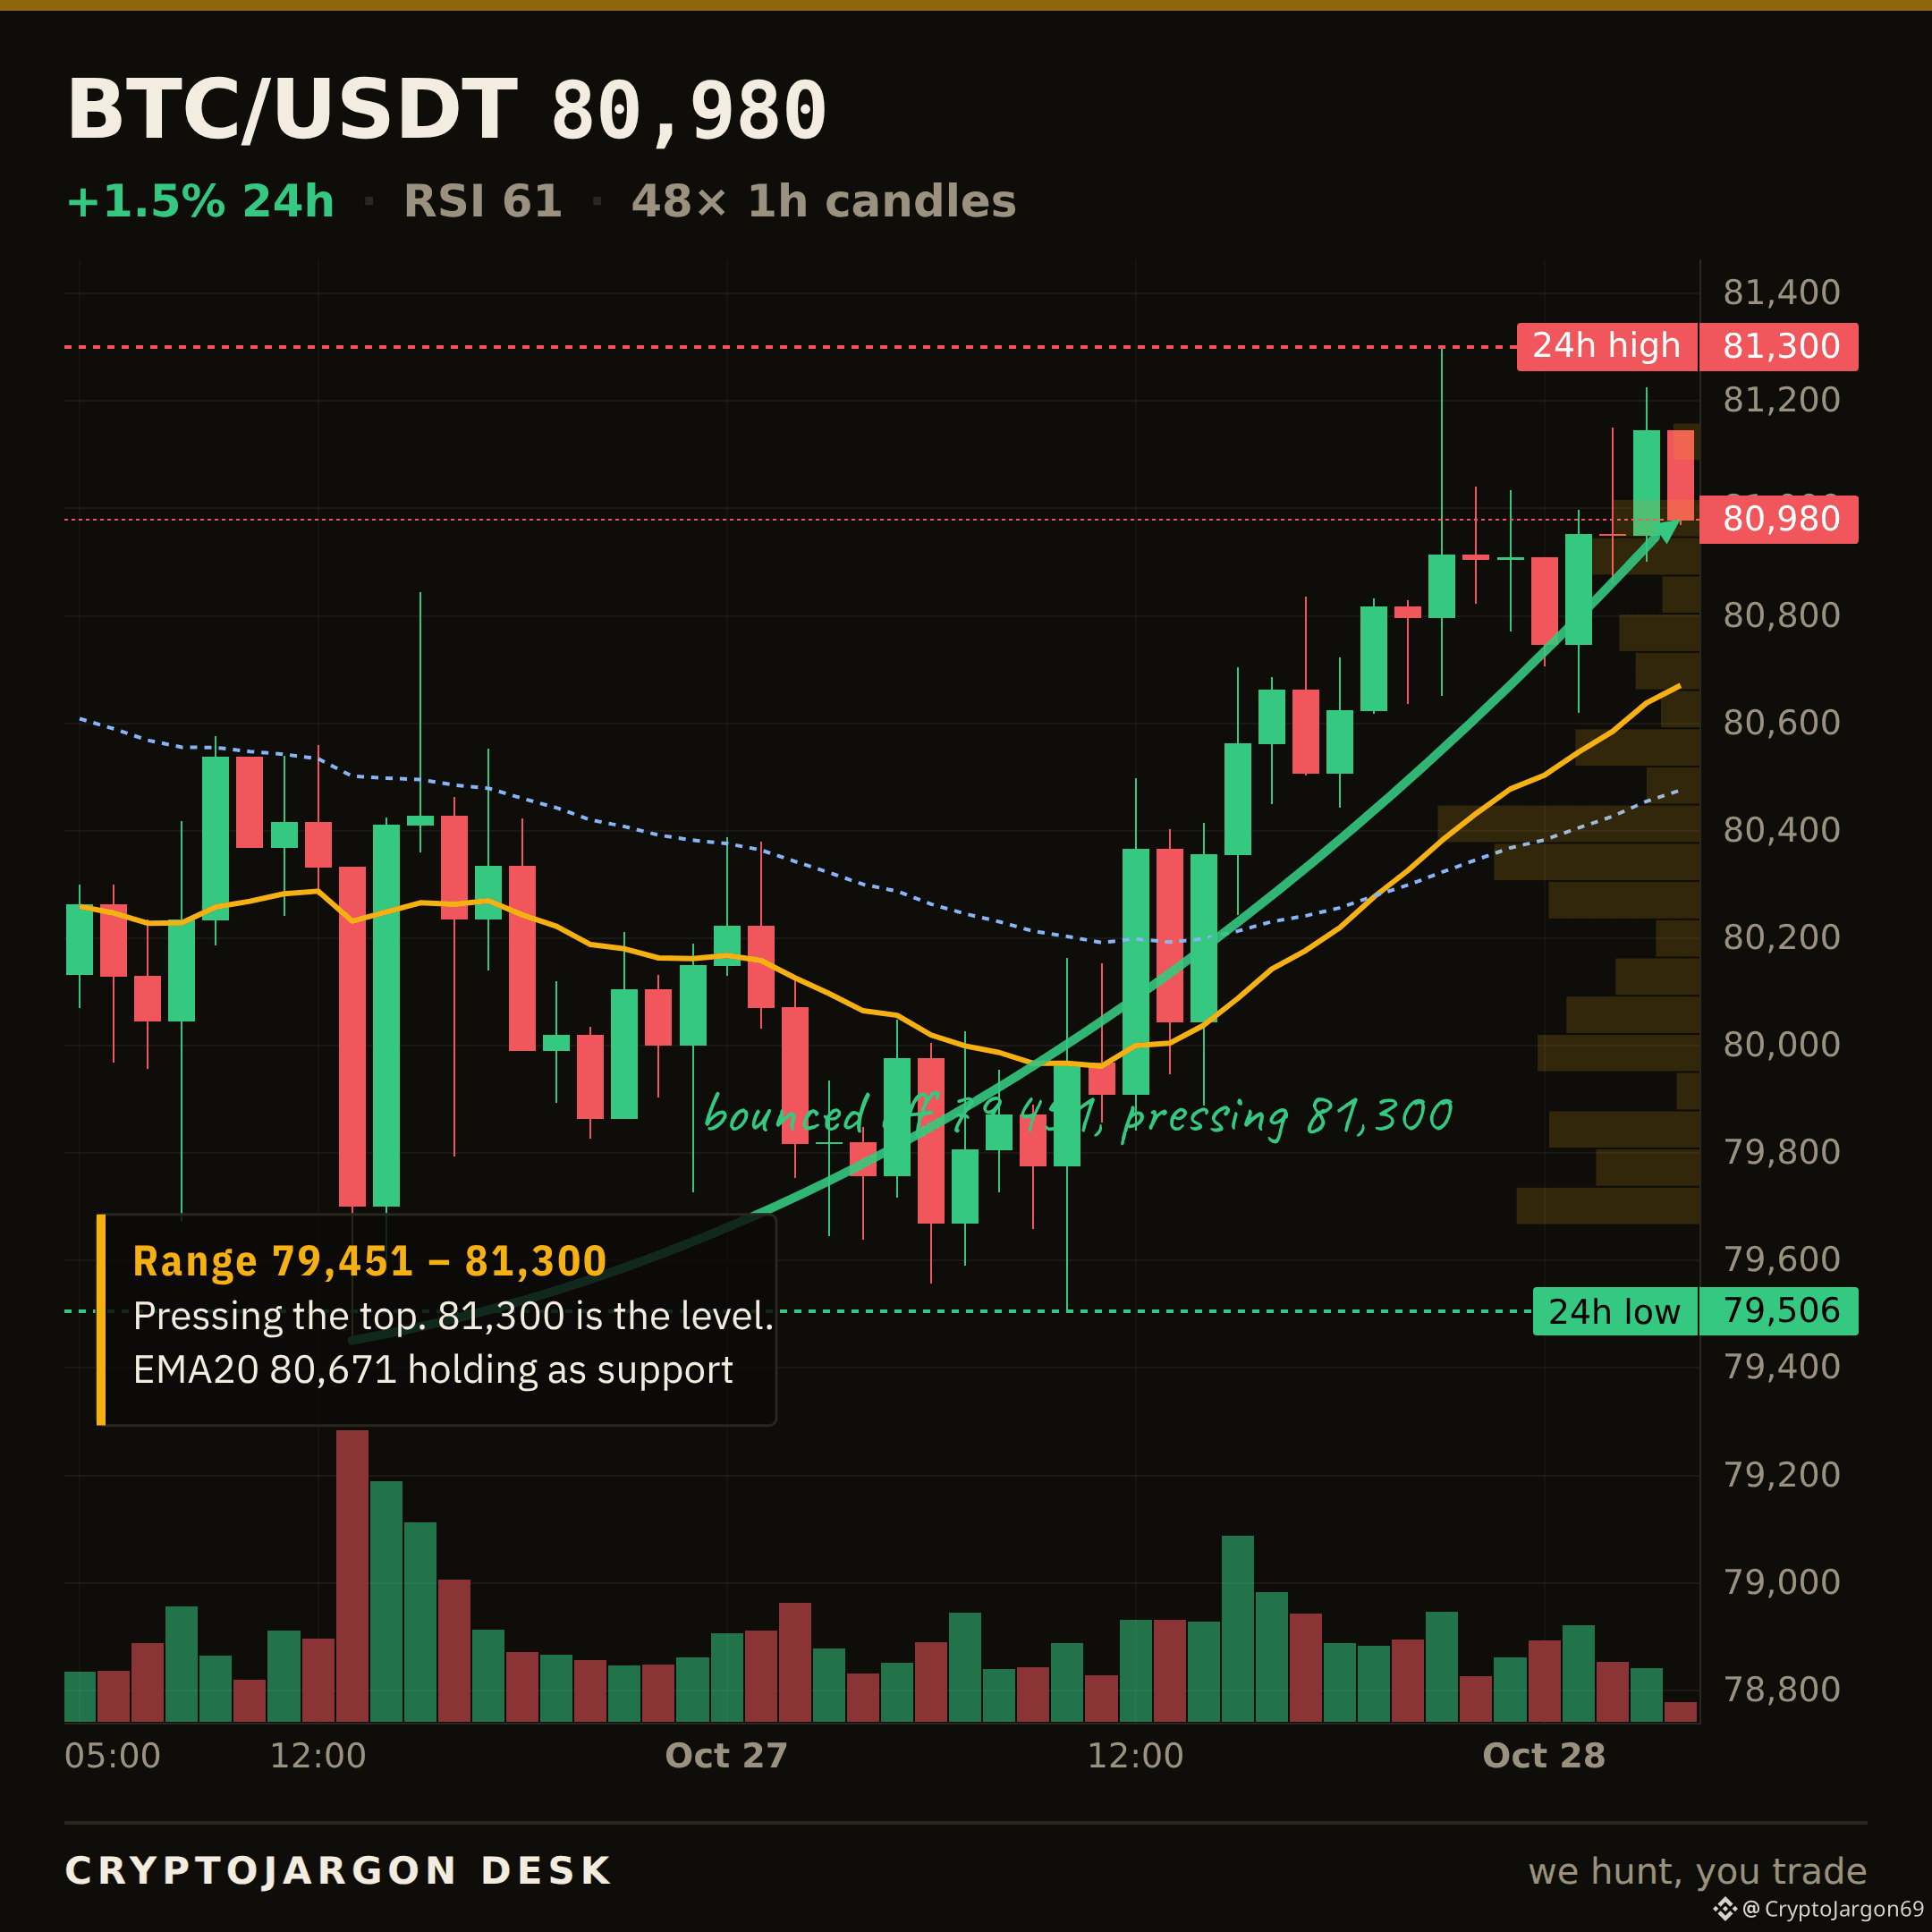
$BTC · LEVEL TO WATCH
$80,980 now.
The line that matters is $80,671 — the 20-EMA, the floor the tape is sitting on. It lines up with the 50-EMA too — a spot several things share.
Holding $80,671 keeps the structure intact; a clean close below opens the range beneath it. I'll follow up when it resolves.
Chart: the level is on it. $BTC
46
查看翻譯
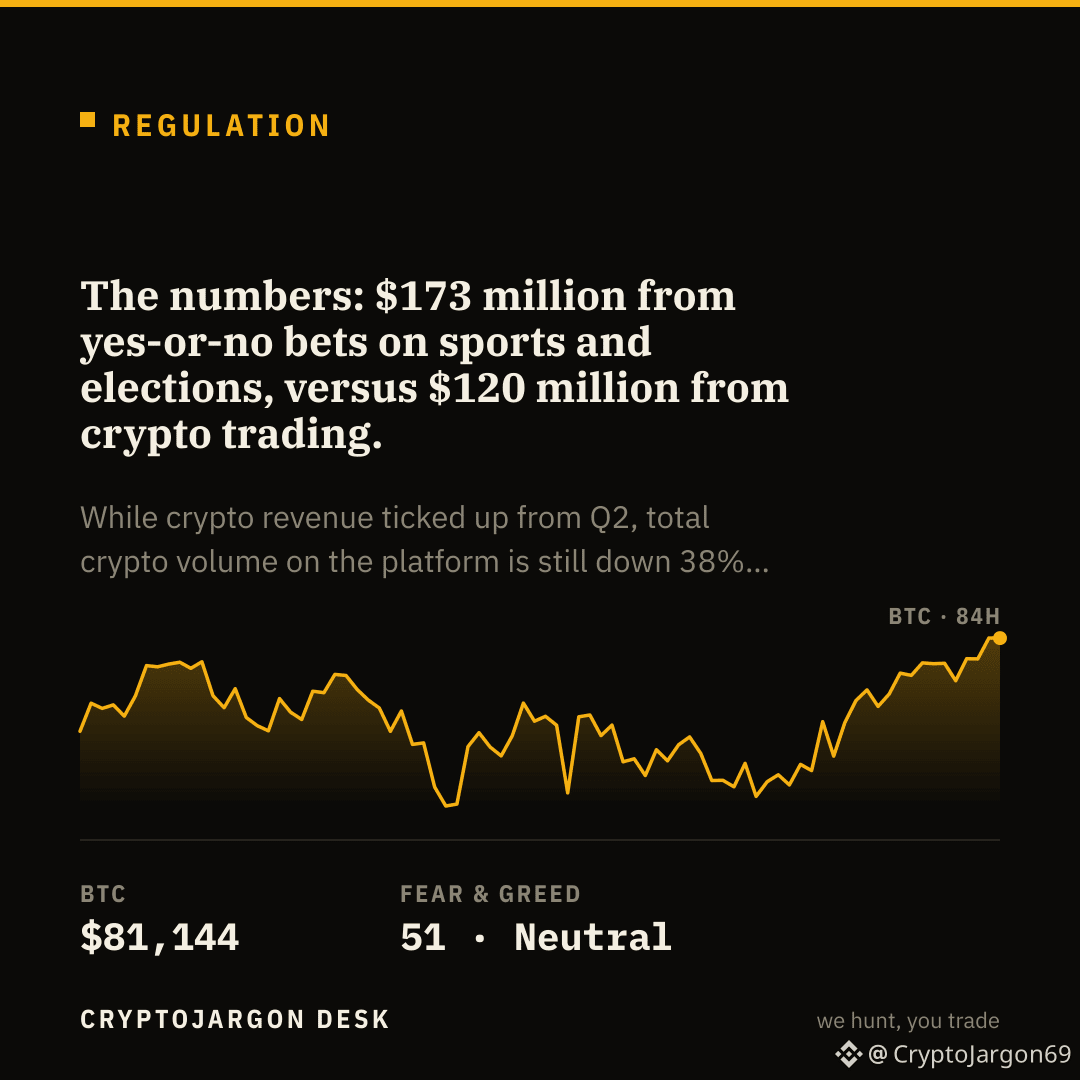
For the second quarter in a row, Robinhood made more money from prediction markets than from crypto.
The numbers: $173 million from yes-or-no bets on sports and elections, versus $120 million from crypto trading. While crypto revenue ticked up from Q2, total crypto volume on the platform is still down 38% from a year earlier.
This is a clean read on the retail mindset. The CEO called it a "prediction market supercycle," and the data is proving him right. The average user is reaching for a simple, binary bet, not for a complex crypto asset. It suggests the easiest-to-understand product wins, not necessarily the most technically advanced one.
Is the real retail 'supercycle' in simple yes/no bets, not crypto?
$BTC
New reads post through the day. Follow so you don't miss the next one.
44
文章
查看翻譯
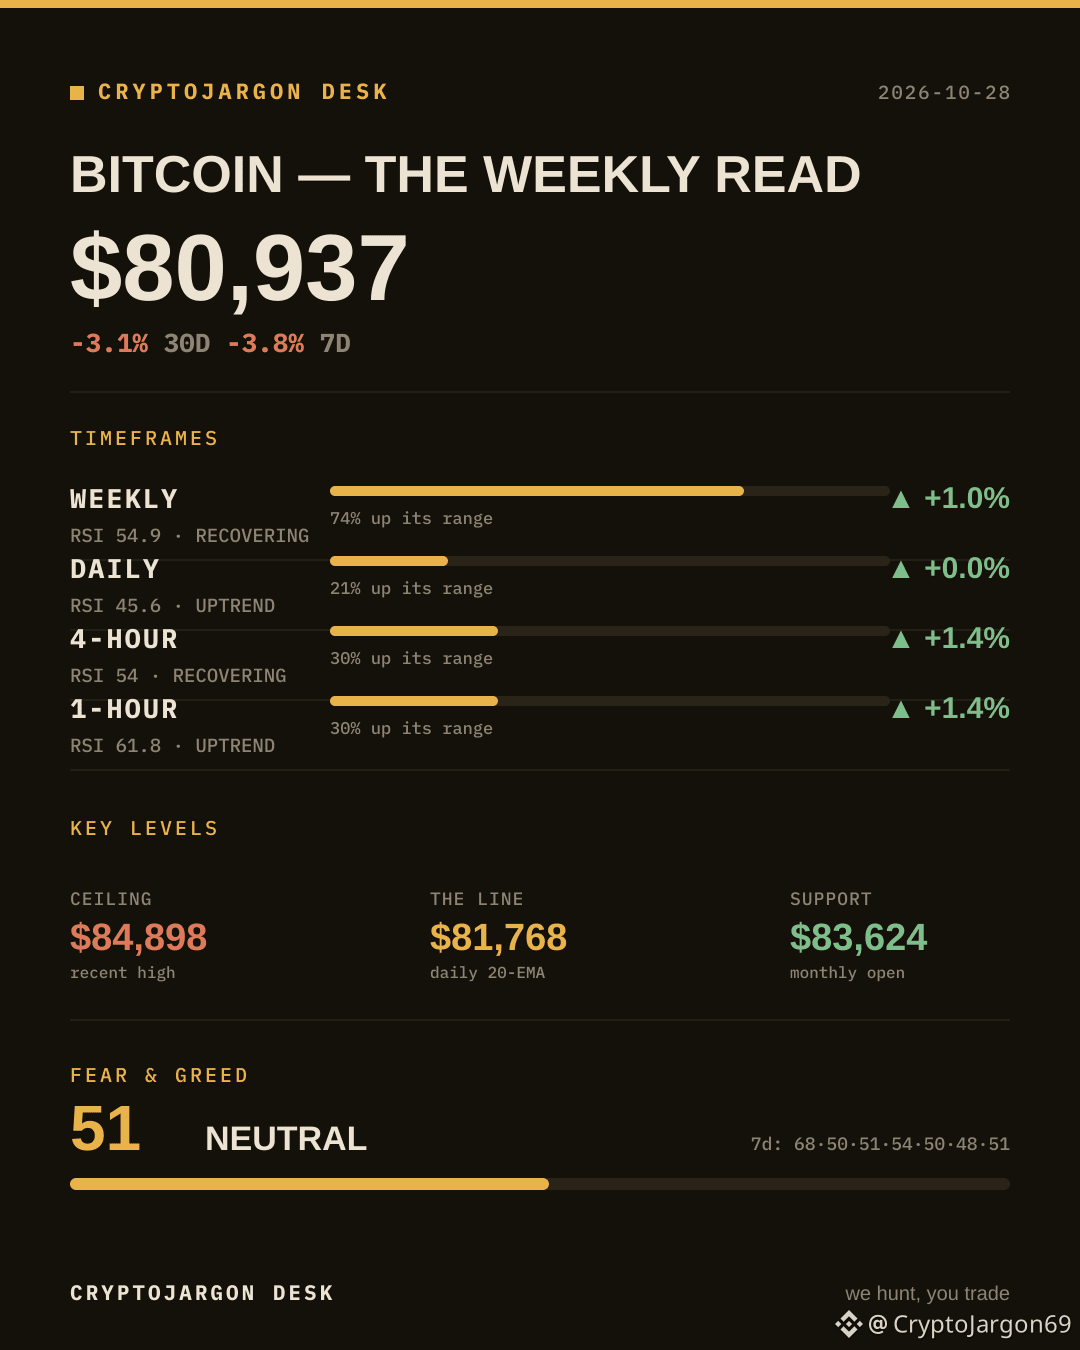
Bitcoin: The Weekly Read — Every Timeframe on One MapBitcoin sits at $80,937 after a slide that has it 3.1% lower over thirty days and -3.8% on the week. Fear & Greed reads 51 (Neutral). Here is what every timeframe is actually saying, top down.
THE 30-DAY / 7-DAY FRAME
-3.1% over thirty days, -3.8% on the week. The month is the trend; the week is the noise around it. Keep both in view — the higher timeframes carry the weight, the lower ones carry the swings.
THE MACRO BACKDROP
This week's sentiment is shaped by conflicting narratives of institutional integration and persistent risk. On the adoption front, a new diversified ETF blended Bitcoin with traditional assets, while a potential U.S. Treasury official framed crypto as a tool for dollar dominance. Conversely, headwinds persist from broader macro uncertainty, highlighted by significant losses in Chinese equity markets, alongside ongoing concerns about long-term technological threats and immediate hardware security vulnerabilities that continue to surface within the ecosystem.
WEEKLY
RSI 54.9 — neutral. The trend here reads recovering: price is above the 20-EMA ($77,137) and above the 50-EMA ($80,441), with the 20 still under the 50. It is sitting 74% up its range ($62,535–$87,396); the last closed candle came on a light 0.84x its average volume. On the weekly, the $80,441 50-EMA is the line the longer trend pivots on.
DAILY
RSI 45.6 — neutral. The trend here reads uptrend: price is below the 20-EMA ($81,768) and above the 50-EMA ($80,781), with the 20 leading the 50. It is sitting 21% up its range ($79,221–$87,220). The daily is the structure that matters most for the swing.
4-HOUR
RSI 54 — neutral. The trend here reads recovering: price is above the 20-EMA ($80,544) and below the 50-EMA ($81,016), with the 20 still under the 50. It is sitting 30% up its range ($79,221–$84,898). This is where the intraday chop lives.
1-HOUR
RSI 61.8 — firm, with room. The trend here reads uptrend: price is above the 20-EMA ($80,619) and above the 50-EMA ($80,416), with the 20 leading the 50. It is sitting 30% up its range ($79,221–$84,898); the last closed candle came on a light 0.67x its average volume. Shortest-term, this is momentum, not trend — treat it as timing, not direction.
THE LEVELS THAT MATTER
$84,898 — the recent high, the ceiling to clear.
$81,768 — the daily 20-EMA, the line price is riding. Hold above it and the trend is fine; lose it and momentum shifts.
$83,624 — the monthly open, the first real support below. Lose it and the $79,221 area comes into play.
SENTIMENT
Fear & Greed at 51 (Neutral), tracing 68, 50, 51, 54, 50, 48, 51 across the week. Sentiment is middling — no extreme to fade.
THE SYNTHESIS
Top to bottom, this is an aligned uptrend — the daily leads and the lower frames are following, not fighting it. The trend gets the benefit of the doubt while $83,624 holds as support.
For now: watch $81,768 on the way down and $84,898 on the way up. Everything in between is range.
Where are you leaning from here — continuation, or a retest of $83,624?
$BTC
Bitcoin: The Weekly Read — Every Timeframe on One Map
Bitcoin sits at $80,937 after a slide that has it 3.1% lower over thirty days and -3.8% on the week. Fear & Greed reads 51 (Neutral). Here is what every timeframe is actually saying, top down.
THE 30-DAY / 7-DAY FRAME
-3.1% over thirty days, -3.8% on the week. The month is the trend; the week is the noise around it. Keep both in view — the higher timeframes carry the weight, the lower ones carry the swings.
THE MACRO BACKDROP
This week's sentiment is shaped by conflicting narratives of institutional integration and persistent risk. On the adoption front, a new diversified ETF blended Bitcoin with traditional assets, while a potential U.S. Treasury official framed crypto as a tool for dollar dominance. Conversely, headwinds persist from broader macro uncertainty, highlighted by significant losses in Chinese equity markets, alongside ongoing concerns about long-term technological threats and immediate hardware security vulnerabilities that continue to surface within the ecosystem.
WEEKLY
RSI 54.9 — neutral. The trend here reads recovering: price is above the 20-EMA ($77,137) and above the 50-EMA ($80,441), with the 20 still under the 50. It is sitting 74% up its range ($62,535–$87,396); the last closed candle came on a light 0.84x its average volume. On the weekly, the $80,441 50-EMA is the line the longer trend pivots on.
DAILY
RSI 45.6 — neutral. The trend here reads uptrend: price is below the 20-EMA ($81,768) and above the 50-EMA ($80,781), with the 20 leading the 50. It is sitting 21% up its range ($79,221–$87,220). The daily is the structure that matters most for the swing.
4-HOUR
RSI 54 — neutral. The trend here reads recovering: price is above the 20-EMA ($80,544) and below the 50-EMA ($81,016), with the 20 still under the 50. It is sitting 30% up its range ($79,221–$84,898). This is where the intraday chop lives.
1-HOUR
RSI 61.8 — firm, with room. The trend here reads uptrend: price is above the 20-EMA ($80,619) and above the 50-EMA ($80,416), with the 20 leading the 50. It is sitting 30% up its range ($79,221–$84,898); the last closed candle came on a light 0.67x its average volume. Shortest-term, this is momentum, not trend — treat it as timing, not direction.
THE LEVELS THAT MATTER
$84,898 — the recent high, the ceiling to clear.
$81,768 — the daily 20-EMA, the line price is riding. Hold above it and the trend is fine; lose it and momentum shifts.
$83,624 — the monthly open, the first real support below. Lose it and the $79,221 area comes into play.
SENTIMENT
Fear & Greed at 51 (Neutral), tracing 68, 50, 51, 54, 50, 48, 51 across the week. Sentiment is middling — no extreme to fade.
THE SYNTHESIS
Top to bottom, this is an aligned uptrend — the daily leads and the lower frames are following, not fighting it. The trend gets the benefit of the doubt while $83,624 holds as support.
For now: watch $81,768 on the way down and $84,898 on the way up. Everything in between is range.
Where are you leaning from here — continuation, or a retest of $83,624?
$BTC
94
查看翻譯
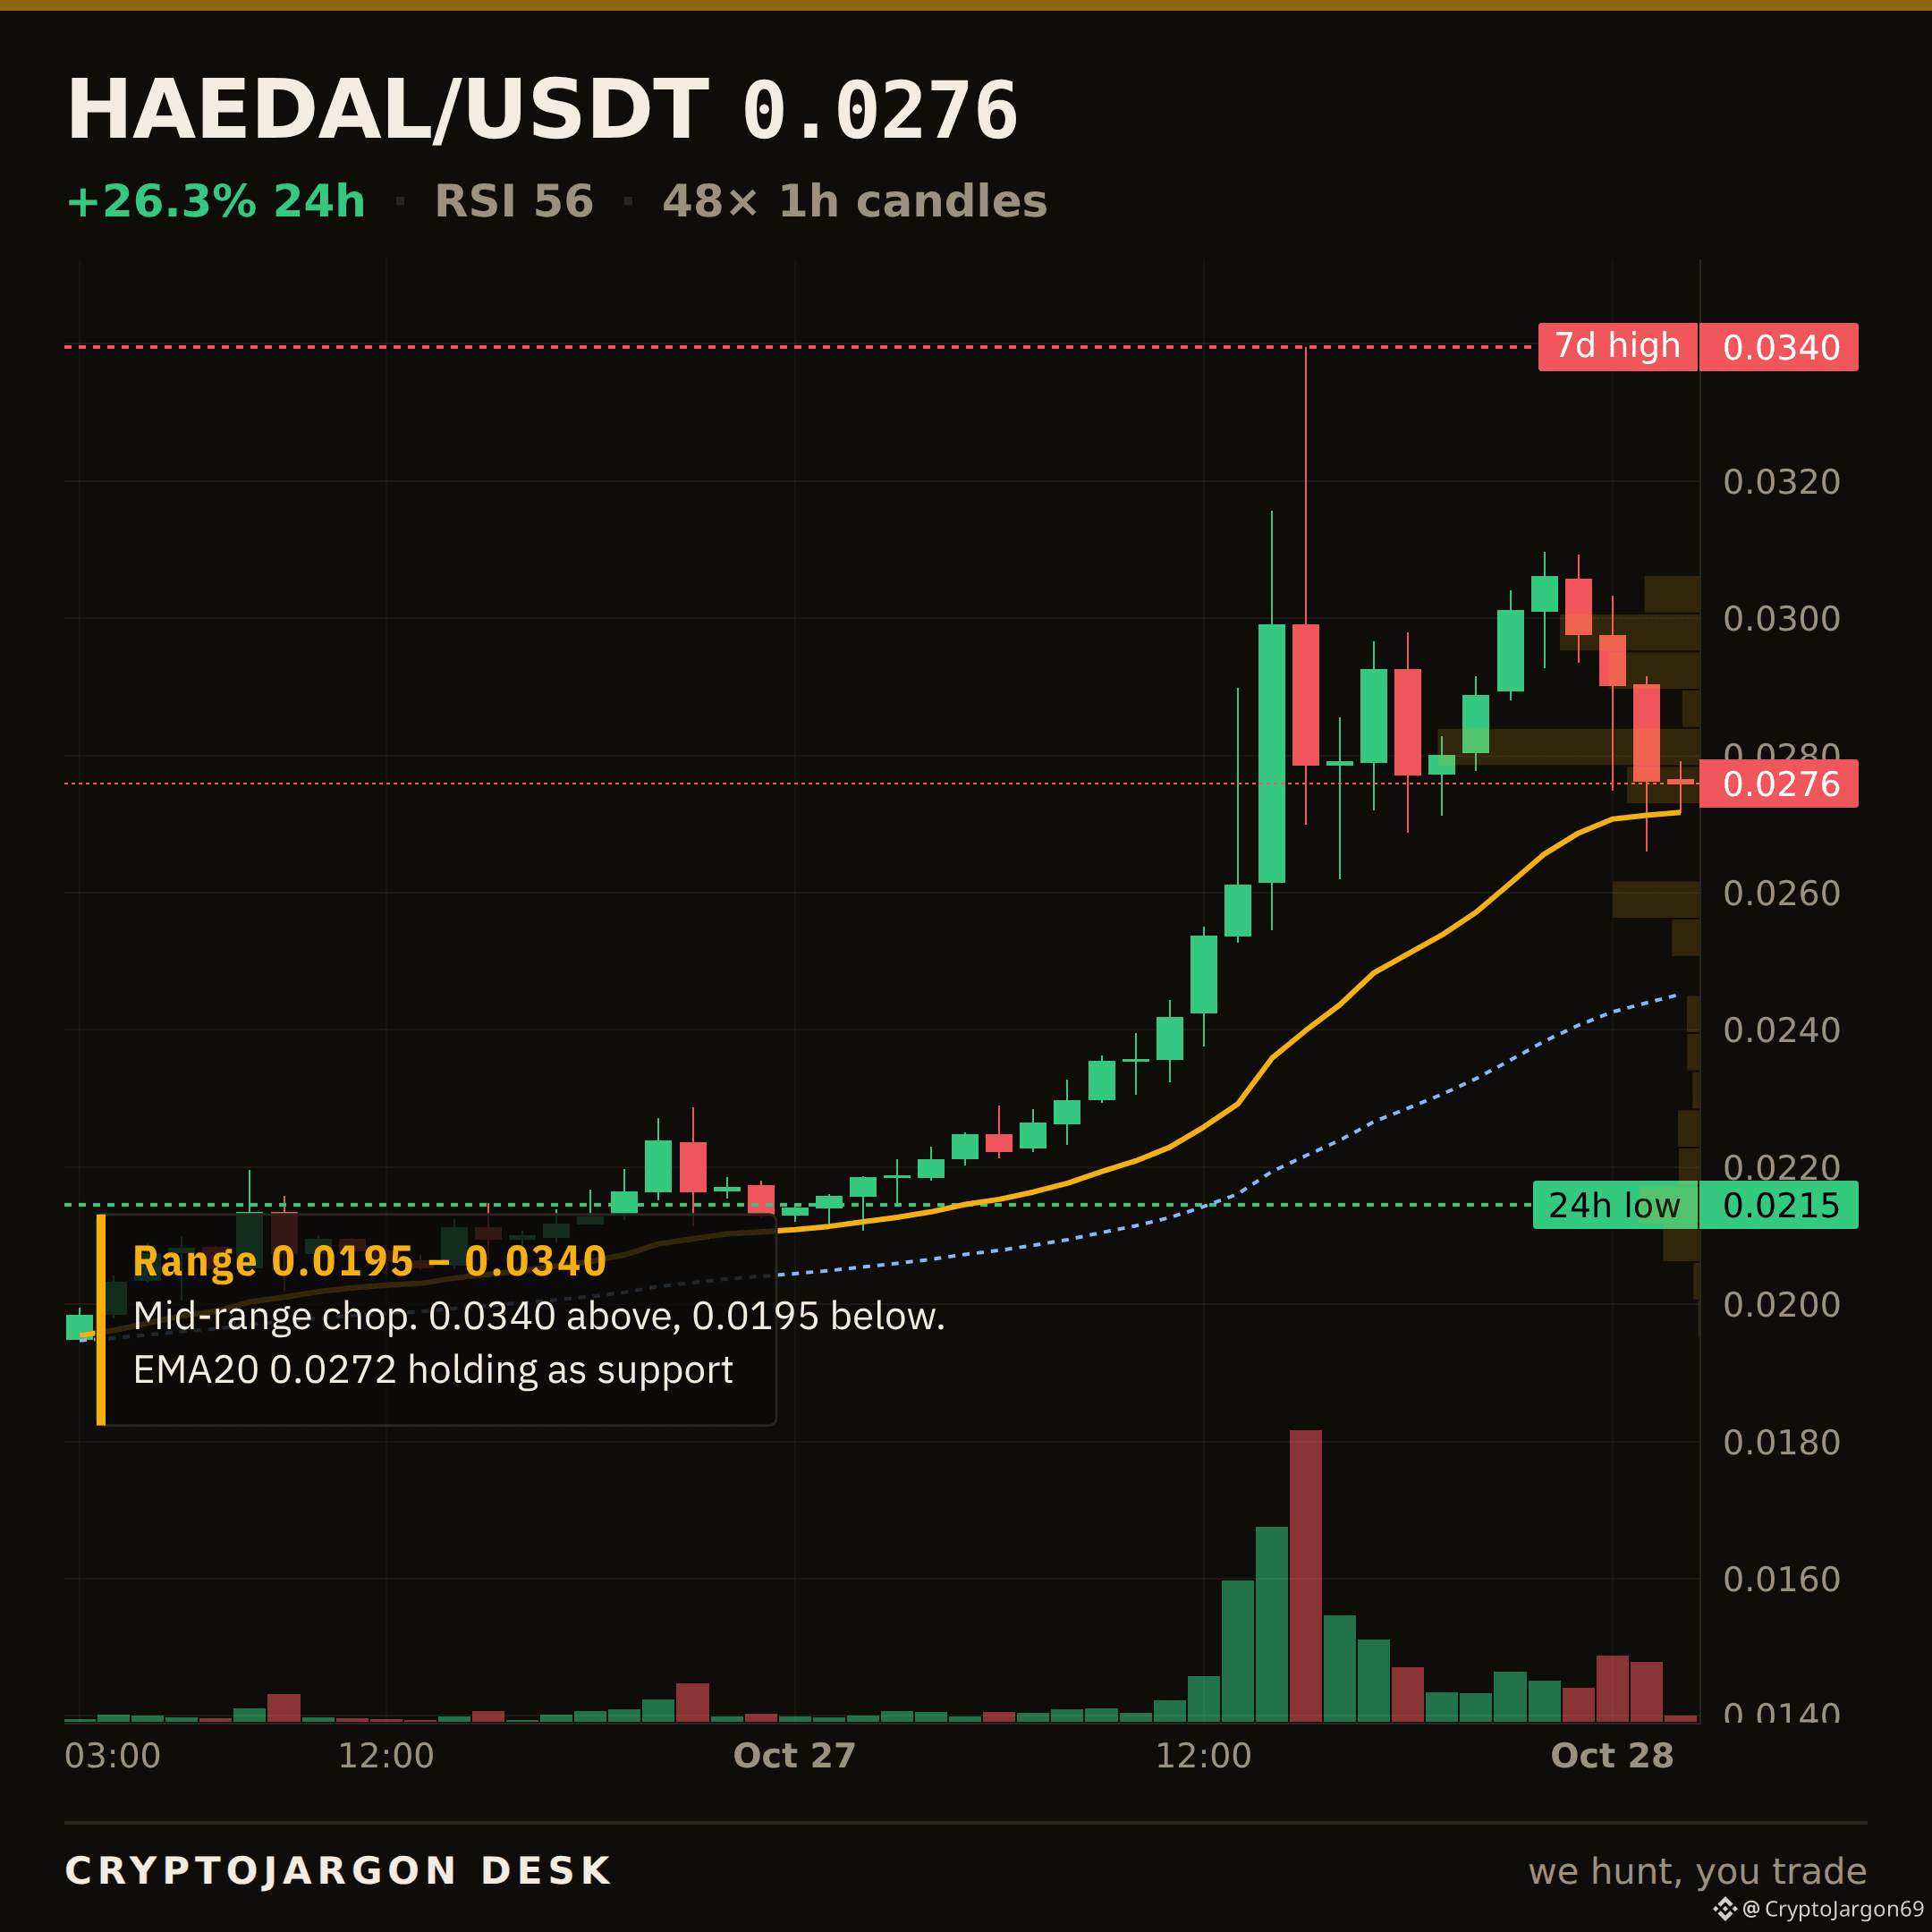
$HAEDAL · MARKET STRUCTURE
$0.0276, +26.3% on the day.
Trend — price above both EMAs, the 20 over the 50.
Momentum — RSI 56.
Range — 49% up its 24h range ($0.0215–$0.034).
Trend, momentum and range mostly point the same way — an aligned tape to the upside.
Levels: $0.034 24h high (ceiling) · $0.0215 24h low (support) · 7d range $0.0176–$0.034.
Chart: 1H candles, EMA20/50 + levels marked. $HAEDAL
97
登入以探索更多內容
加入幣安廣場中的全球加密貨幣用戶
⚡️ 獲取加密貨幣的最新和實用資訊。
💬 受到全球最大加密貨幣交易所的信任。
👍 發掘來自經過驗證創作者的真實見解。
電子郵件 / 電話號碼
熱門話題
FOMC会议
1M 次瀏覽
2,880 討論中
完犢子了!家人們,大利空!
昨天凌晨利率公佈,維持利率不變,但內部分歧明顯!直接就是給出來壓力了,這次保持不變,12月必須得加息的壓迫感!直接帶動了市場短期的極速下跌!
而且主要是從明年秋季開始,美聯儲的會議議程要改了,大白話就是說——唉呀,每次會議都公佈加還是不加還是保持不變,太緊湊了,而且一年要有8次這樣的會議公佈,不行,調整到一年就2次真正公佈決策,其它6次就用於討論政策決定就行了!🤣
每年還是8次,就2次拿來公佈利率情況,6次用來討論。大概大白話就是這個意思。
有種,後面就憋個大的,大的波動就那幾個時間,不會隔一段時間市場又要投票了。
所以,這到底是好事還是壞事?
但這走勢和預期,剛好就是我們提前兩天反覆個給大家預判的走勢,別人可能還沉迷在說什麼週期回漲,利率公佈後會大拉。
我缺反覆強調了,保持不變是投票結果了,但是搞不好還施壓讓短期回踩一下!
這就是人性,總要爲自己做的事情找到理由緩衝一下的!
別問我可不可以抄底,畢500已經提前了很久給了區間了,辛苦自己回去翻看記錄✍️!
我們8.7w減出的倉,70%的比例空倉等很久了!#FOMC会议
毕500系统架构师
·2 人按讚
·5.3k 次瀏覽
美国中期选举倒计时,美股博弈窗口已开启?
91,716 次瀏覽
242 討論中
英国央行征询代币化抵押品意见
20,543 次瀏覽
94 討論中