

CLYTHERONIX 1
189 貼文

CLYTHERONIX 1
舉報
封鎖用戶
Smarter Plays, Sharper Insights 𓃦
0 關注
1 粉絲
7 點讚數
貼文
查看翻譯
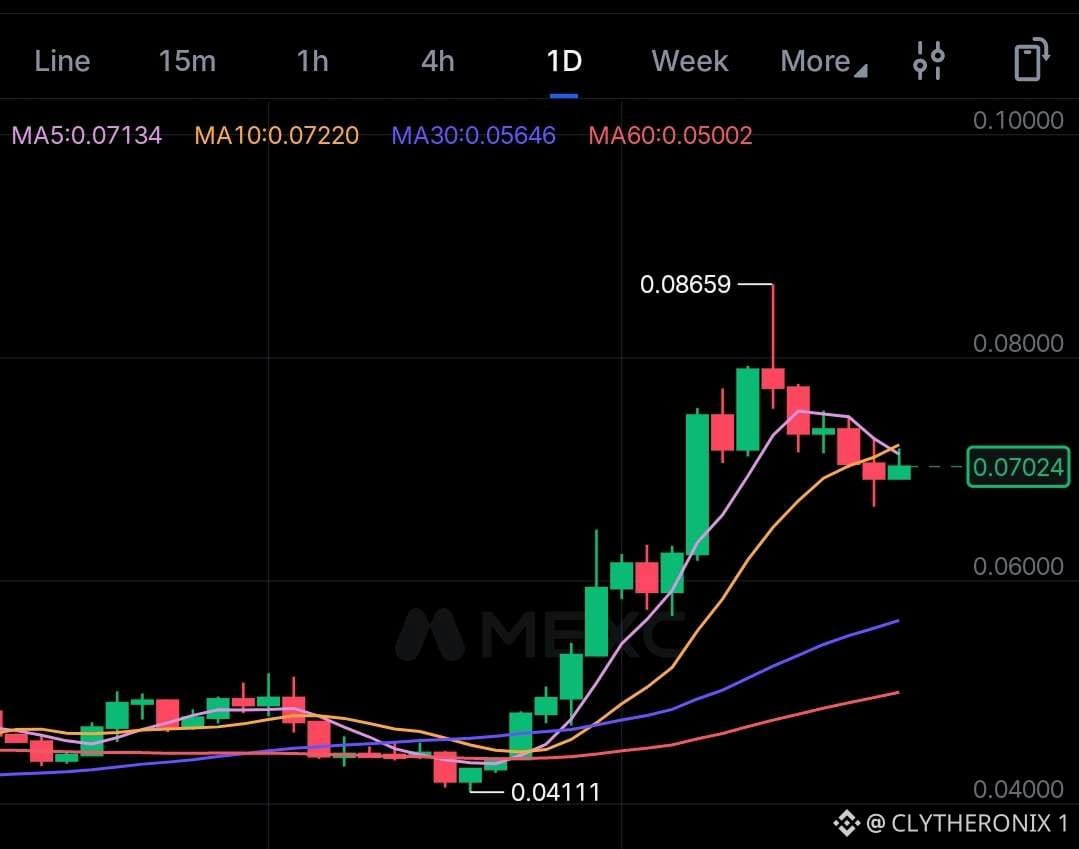
SEI BLOCKCHAIN EYES $0.70.
I observed $SEI trading down -0.93% at $0.07029 as price navigates a layered technical setup. Sentiment remains 58% bearish, reflecting caution over stringent reversal requirements.
• Price: $0.07029
• 24h change: -0.93%
• MA(7): N/A
• MA(30): N/A
• MA(200): N/A
• RSI(14): N/A
• MACD: Neutral
In my view, $SEI must clear two key levels: reclaiming $0.10 first and breaking $0.38 before expanding toward $0.70. Downside risk is clearly defined, as a weekly close below $0.04 invalidates the bullish structure.
The chart indicates traders should wait for a reclaim of $0.10 before anticipating higher targets while managing risk above $0.04.
Disclaimer: This analysis reflects my personal research and is not financial advice.
SEI BLOCKCHAIN EYES $0.70.
I observed $SEI trading down -0.93% at $0.07029 as price navigates a layered technical setup. Sentiment remains 58% bearish, reflecting caution over stringent reversal requirements.
• Price: $0.07029
• 24h change: -0.93%
• MA(7): N/A
• MA(30): N/A
• MA(200): N/A
• RSI(14): N/A
• MACD: Neutral
In my view, $SEI must clear two key levels: reclaiming $0.10 first and breaking $0.38 before expanding toward $0.70. Downside risk is clearly defined, as a weekly close below $0.04 invalidates the bullish structure.
The chart indicates traders should wait for a reclaim of $0.10 before anticipating higher targets while managing risk above $0.04.
Disclaimer: This analysis reflects my personal research and is not financial advice.
I observed $SEI trading down -0.93% at $0.07029 as price navigates a layered technical setup. Sentiment remains 58% bearish, reflecting caution over stringent reversal requirements.
• Price: $0.07029
• 24h change: -0.93%
• MA(7): N/A
• MA(30): N/A
• MA(200): N/A
• RSI(14): N/A
• MACD: Neutral
In my view, $SEI must clear two key levels: reclaiming $0.10 first and breaking $0.38 before expanding toward $0.70. Downside risk is clearly defined, as a weekly close below $0.04 invalidates the bullish structure.
The chart indicates traders should wait for a reclaim of $0.10 before anticipating higher targets while managing risk above $0.04.
Disclaimer: This analysis reflects my personal research and is not financial advice.
40
查看翻譯
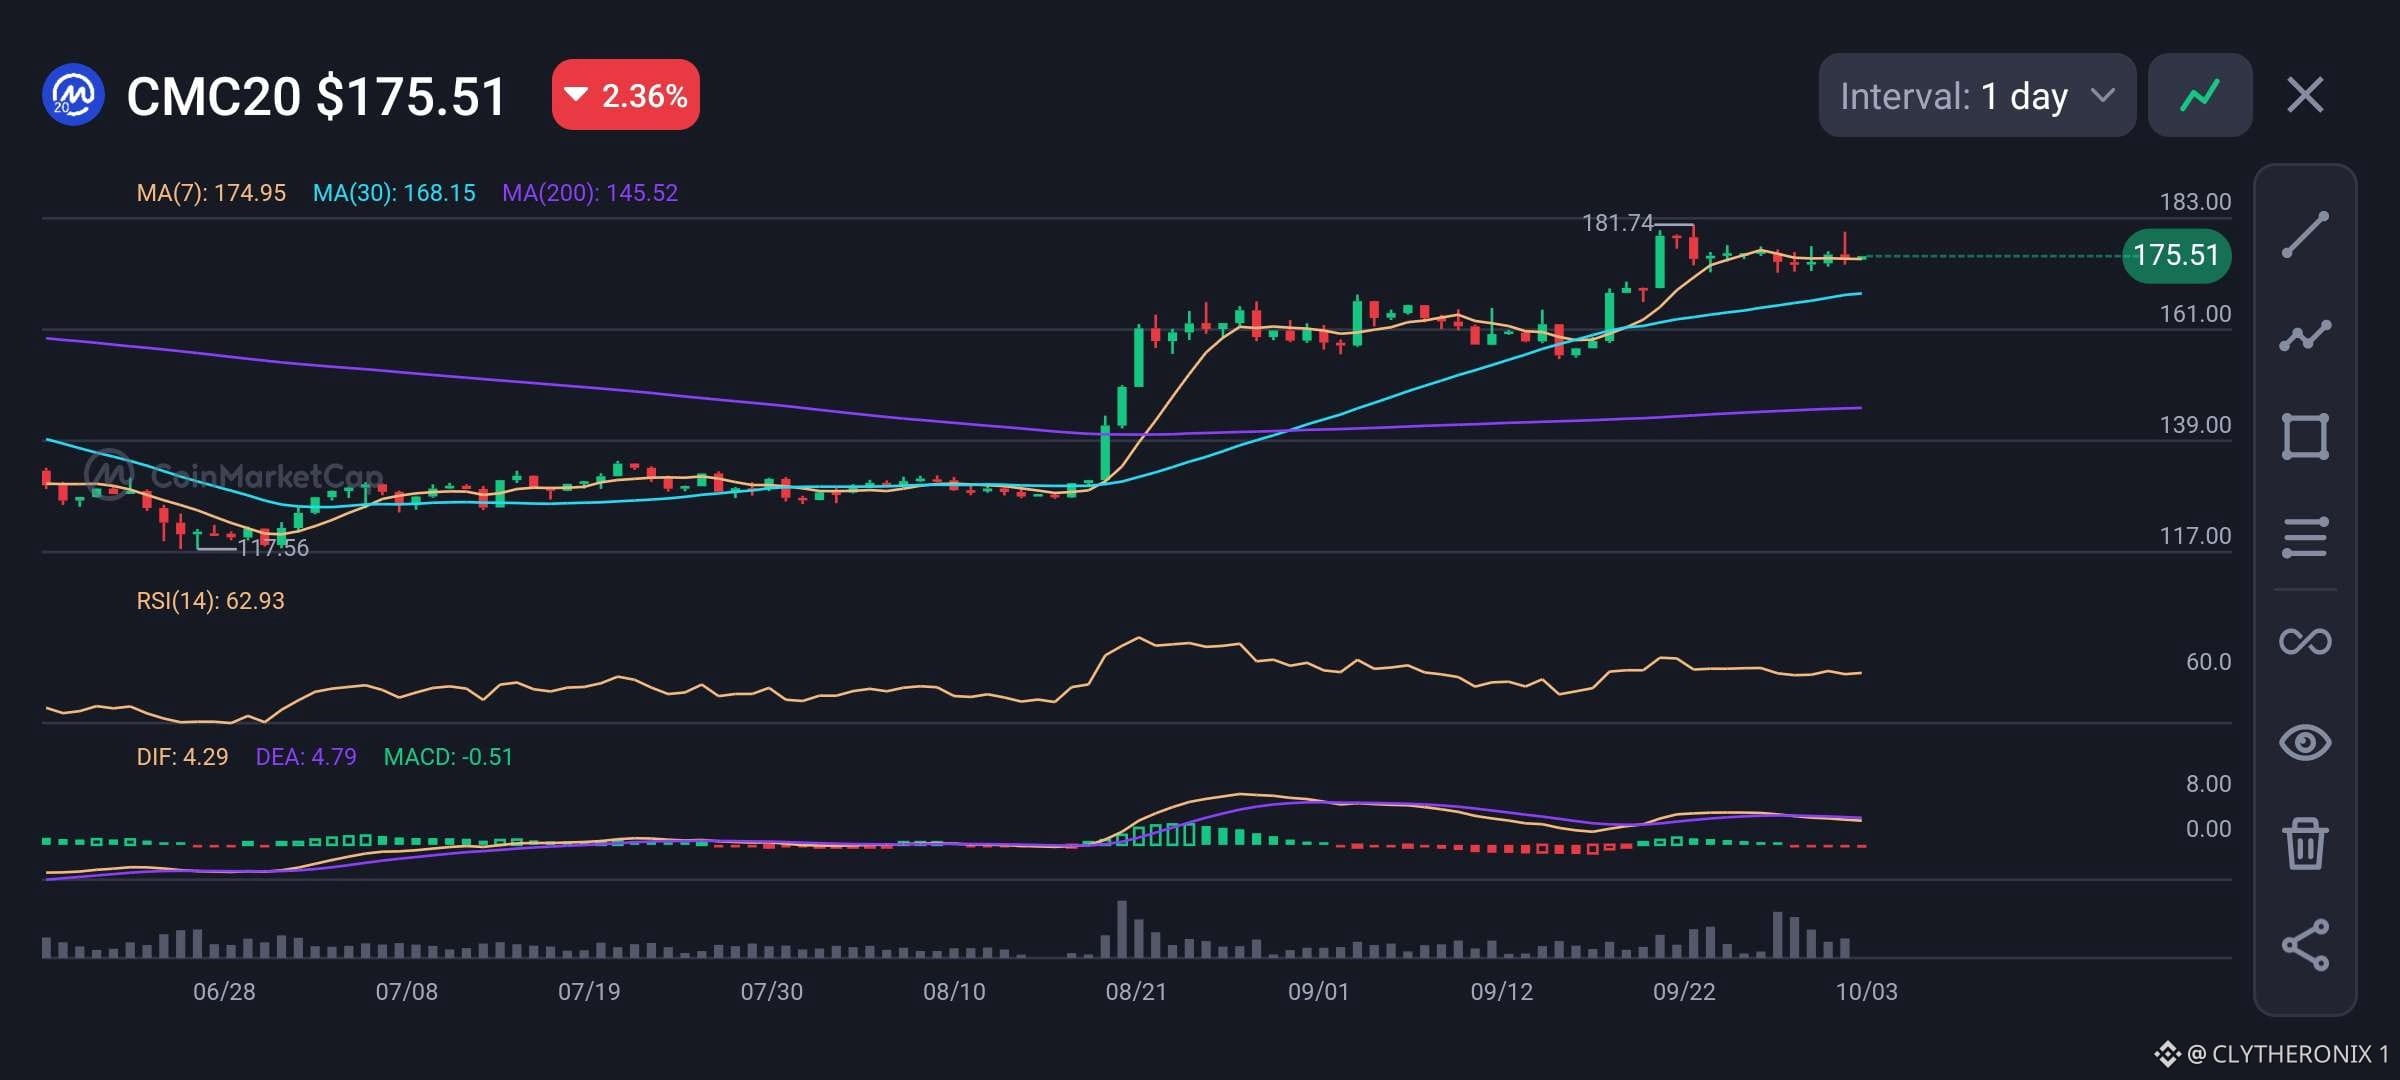
CMC20 CONSOLIDATES NEAR $175.51 AFTER MULTI-MONTH RALLY.
I observed CMC20 pulling back -2.36% to $175.51 after hitting a local high of $181.74 on BNB Smart Chain.
On-chain data from DEXTools shows over $1.74M in pool liquidity and $524K in 24h trading volume, indicating deep DEX liquidity is comfortably absorbing current profit-taking.
• Price: $175.51
• 24h change: -2.36%
• MA(7): $174.95
• MA(30): $168.15
• MA(200): $145.52
• RSI(14): 62.93
• MACD: -0.51 (Neutral)
In my view, $CMC20 remains in a solid macro uptrend, holding above its short-term MA(7) ($174.95), MA(30) ($168.15), and long-term MA(200) ($145.52).
An RSI of 62.93 reflects strong momentum without being overbought, while a neutral MACD indicates minor consolidation.
Key support rests at $174.95, while overhead resistance remains at $181.74.
The chart indicates that $CMC20 is in a healthy consolidation phase, meaning traders should watch for a breakout above $181.74 or a supportive bounce off $174.95.
Disclaimer: This analysis reflects my personal research and is not financial advice.
CMC20 CONSOLIDATES NEAR $175.51 AFTER MULTI-MONTH RALLY.
I observed CMC20 pulling back -2.36% to $175.51 after hitting a local high of $181.74 on BNB Smart Chain.
On-chain data from DEXTools shows over $1.74M in pool liquidity and $524K in 24h trading volume, indicating deep DEX liquidity is comfortably absorbing current profit-taking.
• Price: $175.51
• 24h change: -2.36%
• MA(7): $174.95
• MA(30): $168.15
• MA(200): $145.52
• RSI(14): 62.93
• MACD: -0.51 (Neutral)
In my view, $CMC20 remains in a solid macro uptrend, holding above its short-term MA(7) ($174.95), MA(30) ($168.15), and long-term MA(200) ($145.52).
An RSI of 62.93 reflects strong momentum without being overbought, while a neutral MACD indicates minor consolidation.
Key support rests at $174.95, while overhead resistance remains at $181.74.
The chart indicates that $CMC20 is in a healthy consolidation phase, meaning traders should watch for a breakout above $181.74 or a supportive bounce off $174.95.
Disclaimer: This analysis reflects my personal research and is not financial advice.
I observed CMC20 pulling back -2.36% to $175.51 after hitting a local high of $181.74 on BNB Smart Chain.
On-chain data from DEXTools shows over $1.74M in pool liquidity and $524K in 24h trading volume, indicating deep DEX liquidity is comfortably absorbing current profit-taking.
• Price: $175.51
• 24h change: -2.36%
• MA(7): $174.95
• MA(30): $168.15
• MA(200): $145.52
• RSI(14): 62.93
• MACD: -0.51 (Neutral)
In my view, $CMC20 remains in a solid macro uptrend, holding above its short-term MA(7) ($174.95), MA(30) ($168.15), and long-term MA(200) ($145.52).
An RSI of 62.93 reflects strong momentum without being overbought, while a neutral MACD indicates minor consolidation.
Key support rests at $174.95, while overhead resistance remains at $181.74.
The chart indicates that $CMC20 is in a healthy consolidation phase, meaning traders should watch for a breakout above $181.74 or a supportive bounce off $174.95.
Disclaimer: This analysis reflects my personal research and is not financial advice.
51
疲弱就業數據使美聯儲加息概率降至17%,比特幣瞄準花旗11.3萬美元看漲期權
儘管宏觀環境對數字資產有利,我觀察到比特幣下跌-1.98%。疲弱的美國勞動力市場數據導致美聯儲的加息預期僅降至17%。
在我看來,更寬鬆的貨幣政策環境爲 $BTC 提供了基本面順風,支撐花旗對其長期目標 11.3 萬美元的判斷。
• 24小時漲跌:-1.98%
• MACD:中性
從技術面來看,儘管短期回撤壓力將價格拉低了-1.98%,但更廣泛的宏觀流動性論點仍然保持不變。
消化本地賣壓並守住關鍵支撐位,將對維持向花旗 11.3 萬美元目標看齊的上行軌跡至關重要。
數據顯示,交易者在爲進一步延續至更高目標水平進行倉位佈局之前,應重點關注利率政策動態以及對支撐位的承接情況。
免責聲明:本分析反映的是我的個人觀點,並不構成任何金融建議。
#宏觀洞察#
疲弱就業數據使美聯儲加息概率降至17%,比特幣瞄準花旗11.3萬美元看漲期權
儘管宏觀環境對數字資產有利,我觀察到比特幣下跌-1.98%。疲弱的美國勞動力市場數據導致美聯儲的加息預期僅降至17%。
在我看來,更寬鬆的貨幣政策環境爲 $BTC 提供了基本面順風,支撐花旗對其長期目標 11.3 萬美元的判斷。
• 24小時漲跌:-1.98%
• MACD:中性
從技術面來看,儘管短期回撤壓力將價格拉低了-1.98%,但更廣泛的宏觀流動性論點仍然保持不變。
消化本地賣壓並守住關鍵支撐位,將對維持向花旗 11.3 萬美元目標看齊的上行軌跡至關重要。
數據顯示,交易者在爲進一步延續至更高目標水平進行倉位佈局之前,應重點關注利率政策動態以及對支撐位的承接情況。
免責聲明:本分析反映的是我的個人觀點,並不構成任何金融建議。
#宏觀洞察#
儘管宏觀環境對數字資產有利,我觀察到比特幣下跌-1.98%。疲弱的美國勞動力市場數據導致美聯儲的加息預期僅降至17%。
在我看來,更寬鬆的貨幣政策環境爲 $BTC 提供了基本面順風,支撐花旗對其長期目標 11.3 萬美元的判斷。
• 24小時漲跌:-1.98%
• MACD:中性
從技術面來看,儘管短期回撤壓力將價格拉低了-1.98%,但更廣泛的宏觀流動性論點仍然保持不變。
消化本地賣壓並守住關鍵支撐位,將對維持向花旗 11.3 萬美元目標看齊的上行軌跡至關重要。
數據顯示,交易者在爲進一步延續至更高目標水平進行倉位佈局之前,應重點關注利率政策動態以及對支撐位的承接情況。
免責聲明:本分析反映的是我的個人觀點,並不構成任何金融建議。
#宏觀洞察#
79
查看翻譯
The interesting part here is that the first line of pain may not be the ETF buyers. Leveraged longs are much more fragile because they can be forcefully liquidated as $BTC moves lower.
If $83K gives way, those longs could become the first source of selling pressure. Then, $82.5K becomes important.
A move toward $81K would put many recent ETF buyers below their estimated cost basis, and that is where psychology starts changing.
The market may look cleaner with lower OI and neutral funding, but spot holders can still create selling pressure if support keeps breaking.
For me, $83K to $80K is the real test. Lose that zone, and the Q4 narrative gets a lot more complicated.
The interesting part here is that the first line of pain may not be the ETF buyers. Leveraged longs are much more fragile because they can be forcefully liquidated as $BTC moves lower.
If $83K gives way, those longs could become the first source of selling pressure. Then, $82.5K becomes important.
A move toward $81K would put many recent ETF buyers below their estimated cost basis, and that is where psychology starts changing.
The market may look cleaner with lower OI and neutral funding, but spot holders can still create selling pressure if support keeps breaking.
For me, $83K to $80K is the real test. Lose that zone, and the Q4 narrative gets a lot more complicated.
If $83K gives way, those longs could become the first source of selling pressure. Then, $82.5K becomes important.
A move toward $81K would put many recent ETF buyers below their estimated cost basis, and that is where psychology starts changing.
The market may look cleaner with lower OI and neutral funding, but spot holders can still create selling pressure if support keeps breaking.
For me, $83K to $80K is the real test. Lose that zone, and the Q4 narrative gets a lot more complicated.
28
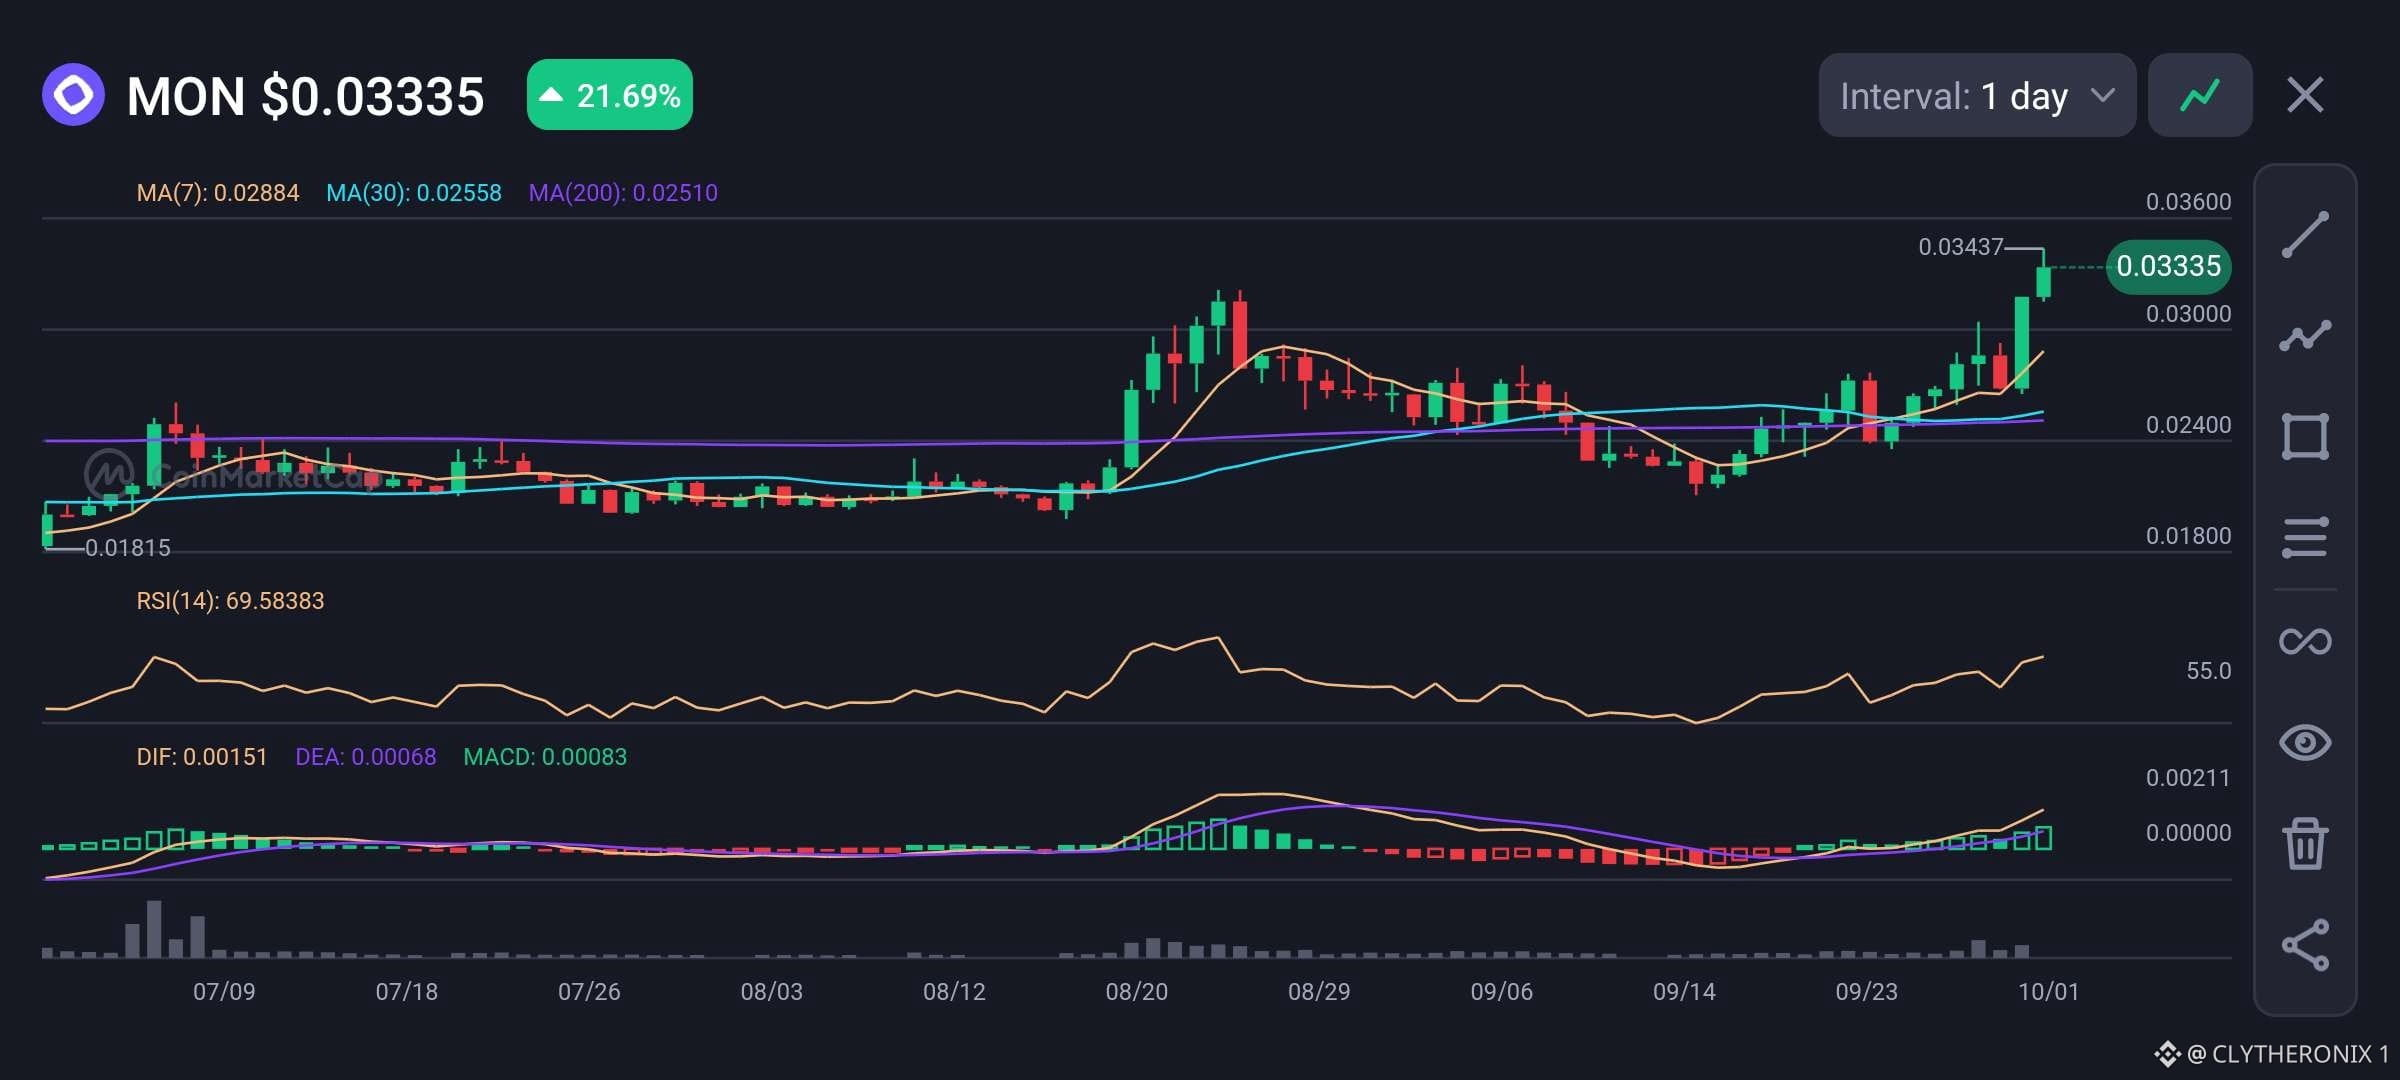
MONAD 泵浦在多頭突破中上漲 21.69%。
我觀察到 $MON 在日線圖中急劇突破,飆升 +21.69% 至 $0.03335。
DEXTools 的 Solana 流動性池成交量增加,正將價格推升至過去數月的盤整區間之上。
• 價格:$0.03335
• 24 小時變化:+21.69%
• MA(7):$0.02884
• MA(30):$0.02558
• MA(200):$0.02510
• RSI(14):69.58
• MACD:0.00083(偏多)
就目前來看, $MON 展現出強勁的技術面一致性:價格穩穩守在 MA(7)、MA(30) 與 MA(200) 之上。
RSI 為 69.58 反映出強烈的買盤壓力,正在逼近超買區域;而持續擴大的正向 MACD 支持價格朝向本地高點 $0.03437 延續。
關鍵支撐在 $0.02884。
圖表顯示 $MON 正處於強勢擴張階段,提醒交易者留意:若能持續收盤站上 $0.03437 以獲得更高的延續,或對 $0.02884 支撐進行健康回測。
免責聲明:此分析反映我個人的研究,不構成任何投資建議。
#宏觀洞察#
MONAD 泵浦在多頭突破中上漲 21.69%。
我觀察到 $MON 在日線圖中急劇突破,飆升 +21.69% 至 $0.03335。
DEXTools 的 Solana 流動性池成交量增加,正將價格推升至過去數月的盤整區間之上。
• 價格:$0.03335
• 24 小時變化:+21.69%
• MA(7):$0.02884
• MA(30):$0.02558
• MA(200):$0.02510
• RSI(14):69.58
• MACD:0.00083(偏多)
就目前來看, $MON 展現出強勁的技術面一致性:價格穩穩守在 MA(7)、MA(30) 與 MA(200) 之上。
RSI 為 69.58 反映出強烈的買盤壓力,正在逼近超買區域;而持續擴大的正向 MACD 支持價格朝向本地高點 $0.03437 延續。
關鍵支撐在 $0.02884。
圖表顯示 $MON 正處於強勢擴張階段,提醒交易者留意:若能持續收盤站上 $0.03437 以獲得更高的延續,或對 $0.02884 支撐進行健康回測。
免責聲明:此分析反映我個人的研究,不構成任何投資建議。
#宏觀洞察#
我觀察到 $MON 在日線圖中急劇突破,飆升 +21.69% 至 $0.03335。
DEXTools 的 Solana 流動性池成交量增加,正將價格推升至過去數月的盤整區間之上。
• 價格:$0.03335
• 24 小時變化:+21.69%
• MA(7):$0.02884
• MA(30):$0.02558
• MA(200):$0.02510
• RSI(14):69.58
• MACD:0.00083(偏多)
就目前來看, $MON 展現出強勁的技術面一致性:價格穩穩守在 MA(7)、MA(30) 與 MA(200) 之上。
RSI 為 69.58 反映出強烈的買盤壓力,正在逼近超買區域;而持續擴大的正向 MACD 支持價格朝向本地高點 $0.03437 延續。
關鍵支撐在 $0.02884。
圖表顯示 $MON 正處於強勢擴張階段,提醒交易者留意:若能持續收盤站上 $0.03437 以獲得更高的延續,或對 $0.02884 支撐進行健康回測。
免責聲明:此分析反映我個人的研究,不構成任何投資建議。
#宏觀洞察#
41
歷史偏愛十月,但這就足夠了嗎?
比特幣在過去13年中有10年的十月收盤是上漲,平均十月報酬約為19.1%。
但數據也說明了為何季節性應被視為脈絡,而不是訊號。
2014年10月下跌11.6%、2018年10月下跌4.7%,甚至最新一個在2025年的十月也仍下跌3.9%。
$BTC 進入2026年10月時約在 $83.6K 左右,因為今日稍早曾交易在 $85K 以上。近期反彈也失去了一些動能,成為需要留意的因素包含公債殖利率上升以及現貨需求放緩。
所以,僅靠歷史就足以相信另一個「Uptober(十月上漲)」嗎?
不只是如此。歷史模式很有趣,但市場結構、流動性、ETF資金流、宏觀環境以及需求,將決定2026年10月是否會重演相同走勢。
歷史提供我們一個參考點。價格走勢必須予以驗證。
#BTC Price Analysis#
歷史偏愛十月,但這就足夠了嗎?
比特幣在過去13年中有10年的十月收盤是上漲,平均十月報酬約為19.1%。
但數據也說明了為何季節性應被視為脈絡,而不是訊號。
2014年10月下跌11.6%、2018年10月下跌4.7%,甚至最新一個在2025年的十月也仍下跌3.9%。
$BTC 進入2026年10月時約在 $83.6K 左右,因為今日稍早曾交易在 $85K 以上。近期反彈也失去了一些動能,成為需要留意的因素包含公債殖利率上升以及現貨需求放緩。
所以,僅靠歷史就足以相信另一個「Uptober(十月上漲)」嗎?
不只是如此。歷史模式很有趣,但市場結構、流動性、ETF資金流、宏觀環境以及需求,將決定2026年10月是否會重演相同走勢。
歷史提供我們一個參考點。價格走勢必須予以驗證。
#BTC Price Analysis#
比特幣在過去13年中有10年的十月收盤是上漲,平均十月報酬約為19.1%。
但數據也說明了為何季節性應被視為脈絡,而不是訊號。
2014年10月下跌11.6%、2018年10月下跌4.7%,甚至最新一個在2025年的十月也仍下跌3.9%。
$BTC 進入2026年10月時約在 $83.6K 左右,因為今日稍早曾交易在 $85K 以上。近期反彈也失去了一些動能,成為需要留意的因素包含公債殖利率上升以及現貨需求放緩。
所以,僅靠歷史就足以相信另一個「Uptober(十月上漲)」嗎?
不只是如此。歷史模式很有趣,但市場結構、流動性、ETF資金流、宏觀環境以及需求,將決定2026年10月是否會重演相同走勢。
歷史提供我們一個參考點。價格走勢必須予以驗證。
#BTC Price Analysis#

64
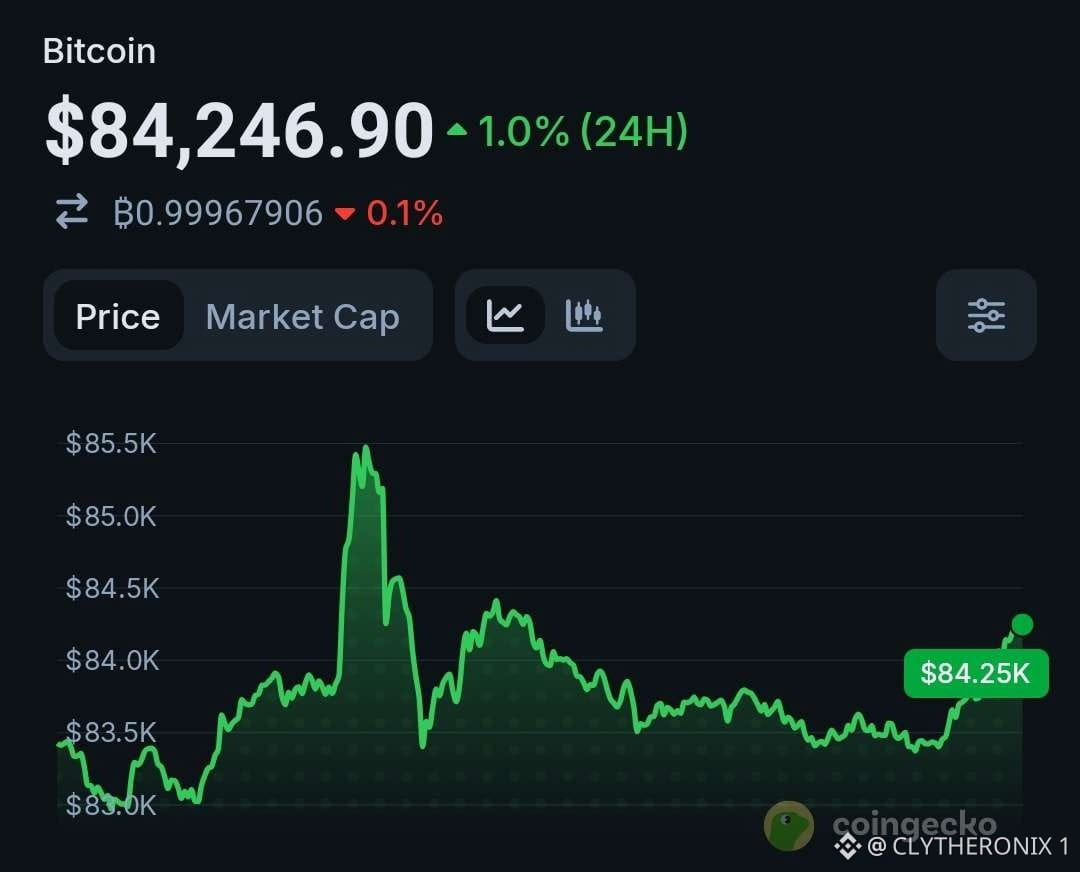
比特幣儘管核心PCE計算出現轉折,仍在第三季度上漲42.7%結束:
我觀察到比特幣( $BTC)在9月收盤上漲6.4%,從而以強勁的42.7%第三季度漲幅收官。
儘管較低的核心PCE數據將美聯儲加息概率壓至38%,但這份偏軟的數據部分來自統計方法上的調整——將通脹指標下調了0.2個百分點。
即便美國國債收益率反彈導致價格回吐了此前的初始漲勢,市場社區情緒仍保持58%的看漲。
• 價格:$84,220.6
• 24小時漲跌:+0.14%
• MACD:中性
在我看來,儘管面臨宏觀逆風, $BTC 依然展現出堅實的內在結構韌性。
在嘗試突破更高阻力位之前,守住 $84,000 區域對於買方維持長期動能至關重要。
數據顯示,在價格於約 $84,200 附近盤整之際,交易者應保持耐心,並關注宏觀層面收益率的變化。
免責聲明:本分析反映的是我個人的研究觀點,不構成任何財務建議。
#BTC價格分析#
比特幣儘管核心PCE計算出現轉折,仍在第三季度上漲42.7%結束:
我觀察到比特幣( $BTC)在9月收盤上漲6.4%,從而以強勁的42.7%第三季度漲幅收官。
儘管較低的核心PCE數據將美聯儲加息概率壓至38%,但這份偏軟的數據部分來自統計方法上的調整——將通脹指標下調了0.2個百分點。
即便美國國債收益率反彈導致價格回吐了此前的初始漲勢,市場社區情緒仍保持58%的看漲。
• 價格:$84,220.6
• 24小時漲跌:+0.14%
• MACD:中性
在我看來,儘管面臨宏觀逆風, $BTC 依然展現出堅實的內在結構韌性。
在嘗試突破更高阻力位之前,守住 $84,000 區域對於買方維持長期動能至關重要。
數據顯示,在價格於約 $84,200 附近盤整之際,交易者應保持耐心,並關注宏觀層面收益率的變化。
免責聲明:本分析反映的是我個人的研究觀點,不構成任何財務建議。
#BTC價格分析#
我觀察到比特幣( $BTC)在9月收盤上漲6.4%,從而以強勁的42.7%第三季度漲幅收官。
儘管較低的核心PCE數據將美聯儲加息概率壓至38%,但這份偏軟的數據部分來自統計方法上的調整——將通脹指標下調了0.2個百分點。
即便美國國債收益率反彈導致價格回吐了此前的初始漲勢,市場社區情緒仍保持58%的看漲。
• 價格:$84,220.6
• 24小時漲跌:+0.14%
• MACD:中性
在我看來,儘管面臨宏觀逆風, $BTC 依然展現出堅實的內在結構韌性。
在嘗試突破更高阻力位之前,守住 $84,000 區域對於買方維持長期動能至關重要。
數據顯示,在價格於約 $84,200 附近盤整之際,交易者應保持耐心,並關注宏觀層面收益率的變化。
免責聲明:本分析反映的是我個人的研究觀點,不構成任何財務建議。
#BTC價格分析#
75
比特幣清算地圖:1.42B 美元多空挤压风险——突破 86K 以上
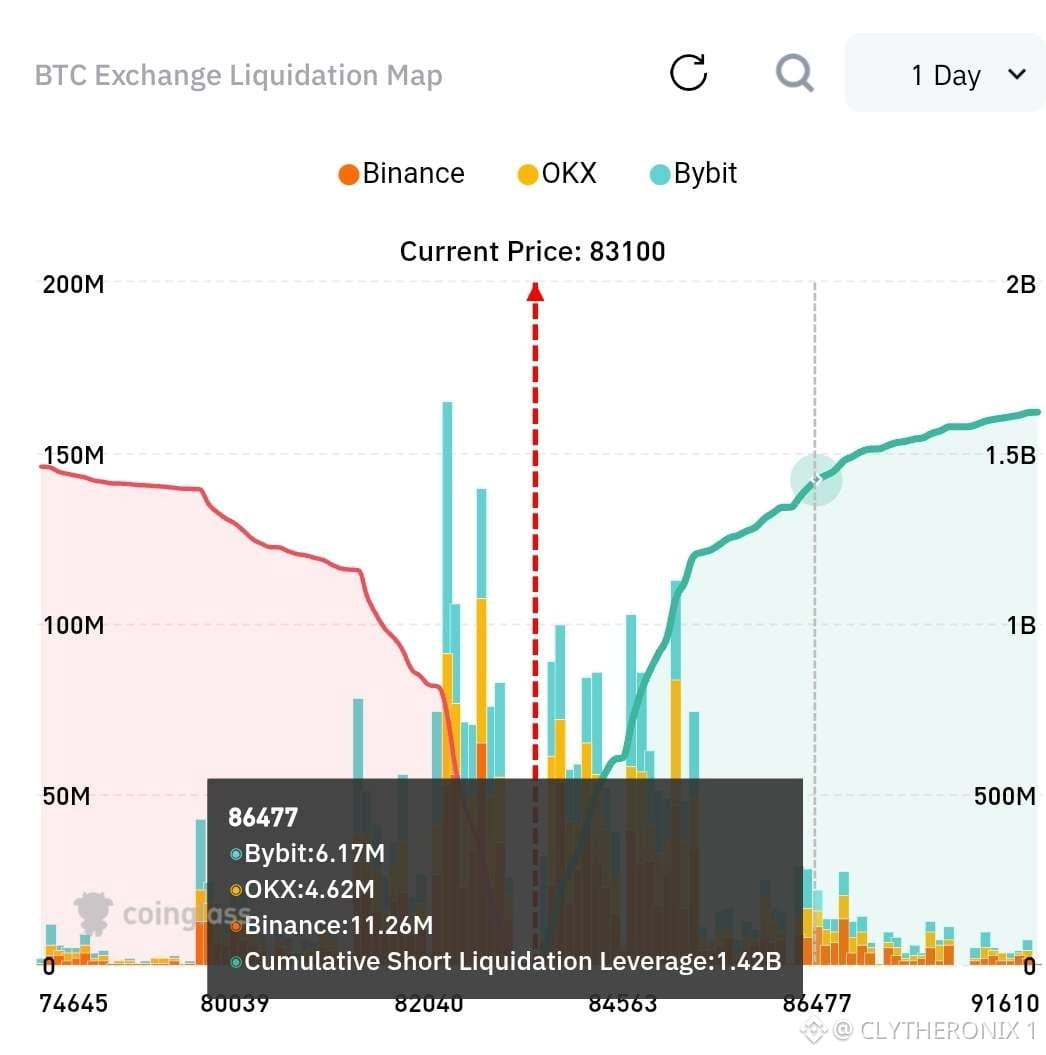
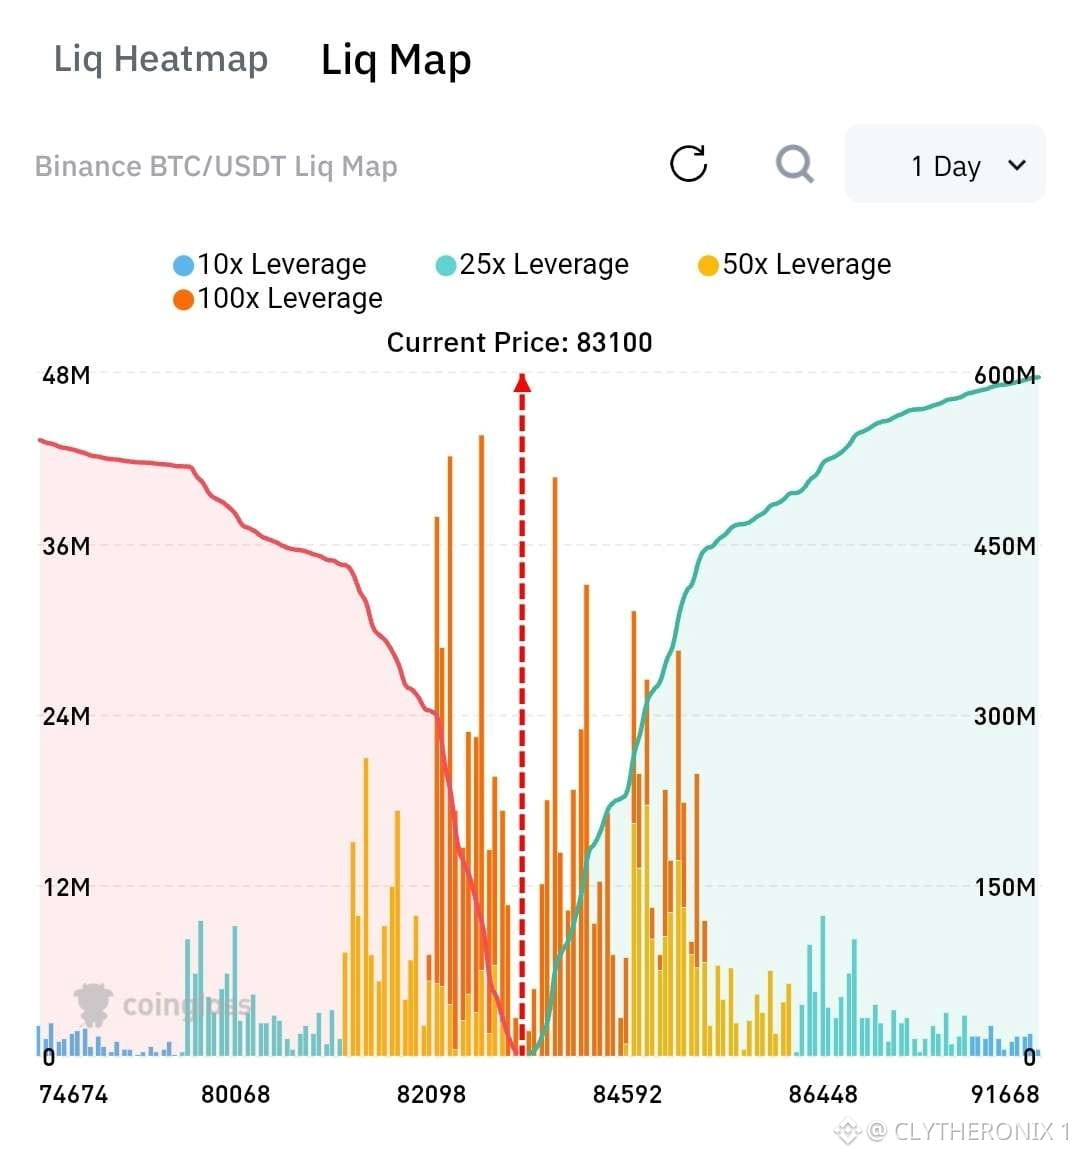
我觀察到 $BTC 在 83,100 美元附近,被困在一個緊密的 100 倍槓桿區間。
CoinGlass 在 Binance、OKX 和 Bybit 的數據顯示,82,098 至 84,592 美元之間出現大量清算。
在我看来,流动性有利於上行追擊。若推高至 84,592 美元之上,可能引發擠压,目標指向 86,477 美元;此处累计空头槓桿达到 1.42B 美元。下行的多头流动性位於 82,098 美元。
關鍵阻力為 84,600 美元與 86,500 美元;支撐在 82,100 美元。
圖表顯示,交易者應留意可能發生的上行流动性掃蕩,方向朝向 86,477 美元,鎖定高槓桿空單。
聲明:個人研究,非財務建議。
#BTC 價格分析#
比特幣清算地圖:1.42B 美元多空挤压风险——突破 86K 以上
我觀察到 $BTC 在 83,100 美元附近,被困在一個緊密的 100 倍槓桿區間。
CoinGlass 在 Binance、OKX 和 Bybit 的數據顯示,82,098 至 84,592 美元之間出現大量清算。
在我看来,流动性有利於上行追擊。若推高至 84,592 美元之上,可能引發擠压,目標指向 86,477 美元;此处累计空头槓桿达到 1.42B 美元。下行的多头流动性位於 82,098 美元。
關鍵阻力為 84,600 美元與 86,500 美元;支撐在 82,100 美元。
圖表顯示,交易者應留意可能發生的上行流动性掃蕩,方向朝向 86,477 美元,鎖定高槓桿空單。
聲明:個人研究,非財務建議。
#BTC 價格分析#
我觀察到 $BTC 在 83,100 美元附近,被困在一個緊密的 100 倍槓桿區間。
CoinGlass 在 Binance、OKX 和 Bybit 的數據顯示,82,098 至 84,592 美元之間出現大量清算。
在我看来,流动性有利於上行追擊。若推高至 84,592 美元之上,可能引發擠压,目標指向 86,477 美元;此处累计空头槓桿达到 1.42B 美元。下行的多头流动性位於 82,098 美元。
關鍵阻力為 84,600 美元與 86,500 美元;支撐在 82,100 美元。
圖表顯示,交易者應留意可能發生的上行流动性掃蕩,方向朝向 86,477 美元,鎖定高槓桿空單。
聲明:個人研究,非財務建議。
#BTC 價格分析#
53
查看翻譯
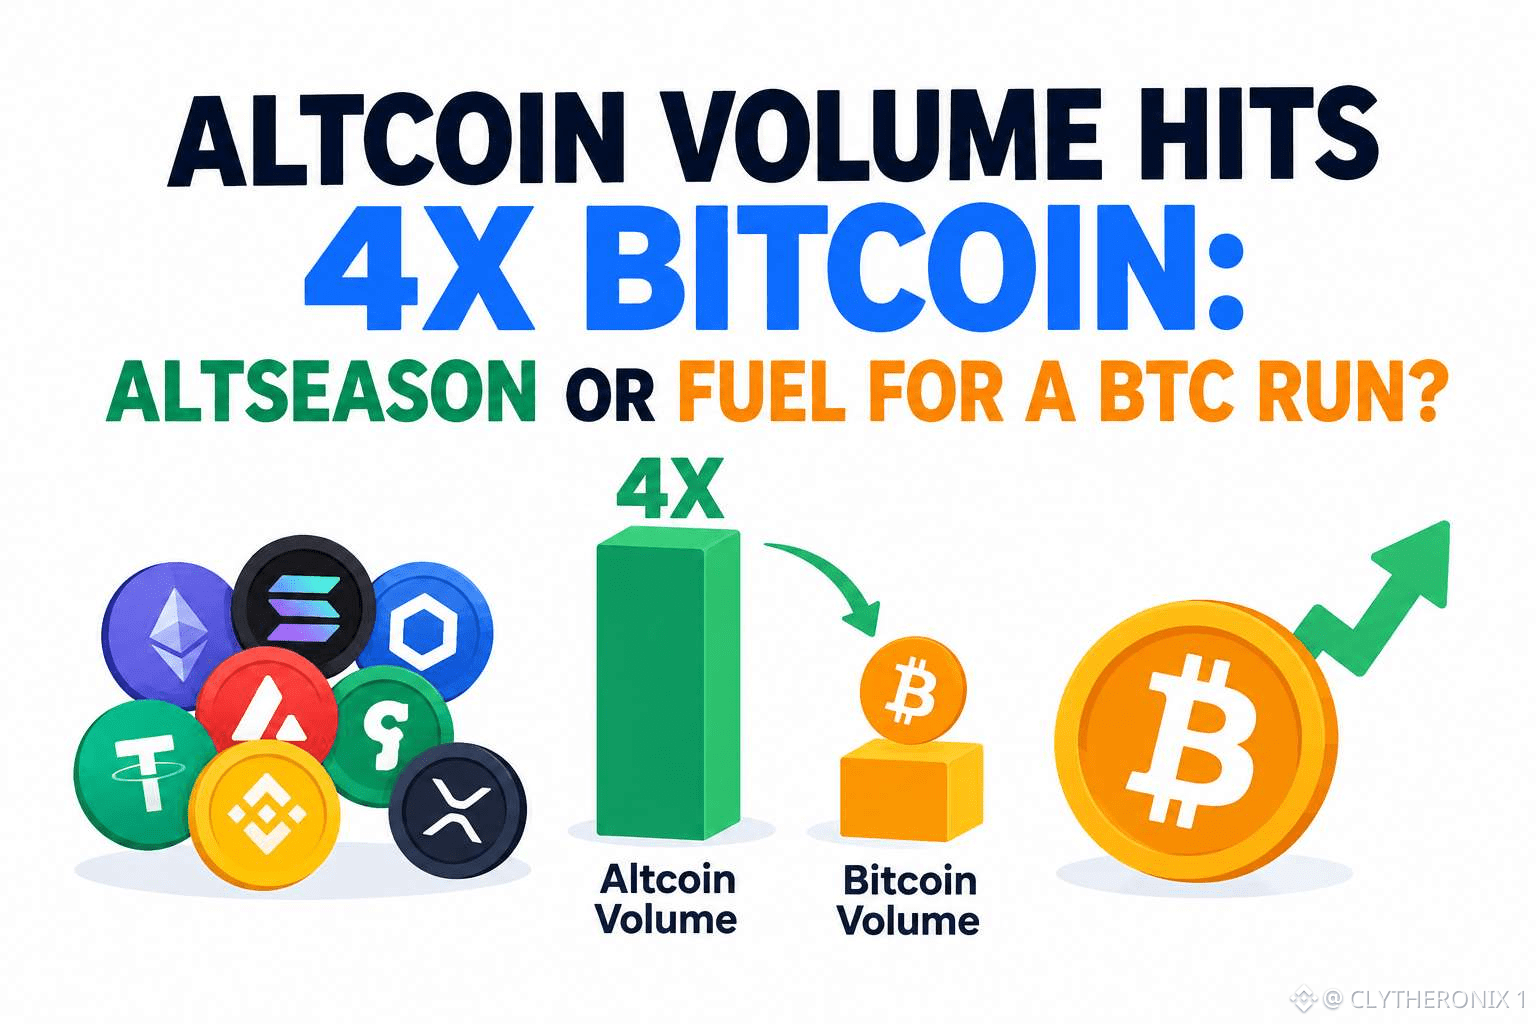
Altcoin spot trading volume has climbed to nearly 4X Bitcoin's, reaching its highest ratio since September 2025. Glassnode also reports that 72.5% of tracked altcoins have outperformed BTC, up sharply from 39% during August.
That looks like capital rotation, but it does not automatically confirm altseason. The current Altcoin Season Index is 53, still below the 75 threshold used to define a broad altseason.
There is another side to this. Glassnode says similar bursts of aggressive altcoin risk taking have often appeared around local Bitcoin tops. BTC is also trading below its recent ~$87K high, while ETF inflows have slowed across recent sessions.
So the real question is whether altcoin volume is expanding the crypto rally or simply rotating profits ahead of another $BTC move.
For now, volume confirms rising risk appetite. The next signal is whether Bitcoin holds its range while altcoins continue gaining breadth.
#BTC Price Analysis#
Altcoin spot trading volume has climbed to nearly 4X Bitcoin's, reaching its highest ratio since September 2025. Glassnode also reports that 72.5% of tracked altcoins have outperformed BTC, up sharply from 39% during August.
That looks like capital rotation, but it does not automatically confirm altseason. The current Altcoin Season Index is 53, still below the 75 threshold used to define a broad altseason.
There is another side to this. Glassnode says similar bursts of aggressive altcoin risk taking have often appeared around local Bitcoin tops. BTC is also trading below its recent ~$87K high, while ETF inflows have slowed across recent sessions.
So the real question is whether altcoin volume is expanding the crypto rally or simply rotating profits ahead of another $BTC move.
For now, volume confirms rising risk appetite. The next signal is whether Bitcoin holds its range while altcoins continue gaining breadth.
#BTC Price Analysis#
That looks like capital rotation, but it does not automatically confirm altseason. The current Altcoin Season Index is 53, still below the 75 threshold used to define a broad altseason.
There is another side to this. Glassnode says similar bursts of aggressive altcoin risk taking have often appeared around local Bitcoin tops. BTC is also trading below its recent ~$87K high, while ETF inflows have slowed across recent sessions.
So the real question is whether altcoin volume is expanding the crypto rally or simply rotating profits ahead of another $BTC move.
For now, volume confirms rising risk appetite. The next signal is whether Bitcoin holds its range while altcoins continue gaining breadth.
#BTC Price Analysis#
50
查看翻譯
THE BITGET HACK SHOWS THAT SECURITY DOES NOT END WITH PRIVATE KEYS
The Bitget hack is a reminder that crypto security is bigger than simply protecting private keys.
On September 24, attackers moved about $387.5M from Bitget's exchange infrastructure.
Bitget says its private keys were not compromised. Instead, the attacker exploited a backend vulnerability and bypassed security controls to authorize fraudulent transfers.
The more interesting part came after the theft.
The attacker has continued moving funds across chains. On September 28, about 2,390 $ETH worth roughly $6.3M was converted into 75.2 $BTC through THORChain, despite Bitget asking the protocol to block addresses associated with the hack.
At the same time, $NEAR Intents reportedly detected more than $50M in attempted flows linked to the attacker, with its security system blocking most of the activity. About $503K was frozen during execution, while roughly $166K reportedly passed through.
This creates an important lesson for crypto users: decentralization, permissionless infrastructure, and security are not the same thing.
A protocol can be permissionless while still having security mechanisms. But the moment stolen funds move across multiple chains, exchanges, bridges, and swap protocols, responsibility becomes much harder to define.
For users, the lesson is simple: don't judge a platform's security only by whether it uses cold wallets or protects private keys.
Look at the entire system, including backend infrastructure, authorization controls, withdrawal procedures, monitoring, and how quickly suspicious transactions can be detected and contained.
Crypto gives users unprecedented control over assets, but that also means the security architecture behind every transaction matters.
The Bitget incident shows exactly why.
THE BITGET HACK SHOWS THAT SECURITY DOES NOT END WITH PRIVATE KEYS
The Bitget hack is a reminder that crypto security is bigger than simply protecting private keys.
On September 24, attackers moved about $387.5M from Bitget's exchange infrastructure.
Bitget says its private keys were not compromised. Instead, the attacker exploited a backend vulnerability and bypassed security controls to authorize fraudulent transfers.
The more interesting part came after the theft.
The attacker has continued moving funds across chains. On September 28, about 2,390 $ETH worth roughly $6.3M was converted into 75.2 $BTC through THORChain, despite Bitget asking the protocol to block addresses associated with the hack.
At the same time, $NEAR Intents reportedly detected more than $50M in attempted flows linked to the attacker, with its security system blocking most of the activity. About $503K was frozen during execution, while roughly $166K reportedly passed through.
This creates an important lesson for crypto users: decentralization, permissionless infrastructure, and security are not the same thing.
A protocol can be permissionless while still having security mechanisms. But the moment stolen funds move across multiple chains, exchanges, bridges, and swap protocols, responsibility becomes much harder to define.
For users, the lesson is simple: don't judge a platform's security only by whether it uses cold wallets or protects private keys.
Look at the entire system, including backend infrastructure, authorization controls, withdrawal procedures, monitoring, and how quickly suspicious transactions can be detected and contained.
Crypto gives users unprecedented control over assets, but that also means the security architecture behind every transaction matters.
The Bitget incident shows exactly why.
The Bitget hack is a reminder that crypto security is bigger than simply protecting private keys.
On September 24, attackers moved about $387.5M from Bitget's exchange infrastructure.
Bitget says its private keys were not compromised. Instead, the attacker exploited a backend vulnerability and bypassed security controls to authorize fraudulent transfers.
The more interesting part came after the theft.
The attacker has continued moving funds across chains. On September 28, about 2,390 $ETH worth roughly $6.3M was converted into 75.2 $BTC through THORChain, despite Bitget asking the protocol to block addresses associated with the hack.
At the same time, $NEAR Intents reportedly detected more than $50M in attempted flows linked to the attacker, with its security system blocking most of the activity. About $503K was frozen during execution, while roughly $166K reportedly passed through.
This creates an important lesson for crypto users: decentralization, permissionless infrastructure, and security are not the same thing.
A protocol can be permissionless while still having security mechanisms. But the moment stolen funds move across multiple chains, exchanges, bridges, and swap protocols, responsibility becomes much harder to define.
For users, the lesson is simple: don't judge a platform's security only by whether it uses cold wallets or protects private keys.
Look at the entire system, including backend infrastructure, authorization controls, withdrawal procedures, monitoring, and how quickly suspicious transactions can be detected and contained.
Crypto gives users unprecedented control over assets, but that also means the security architecture behind every transaction matters.
The Bitget incident shows exactly why.

54
查看翻譯
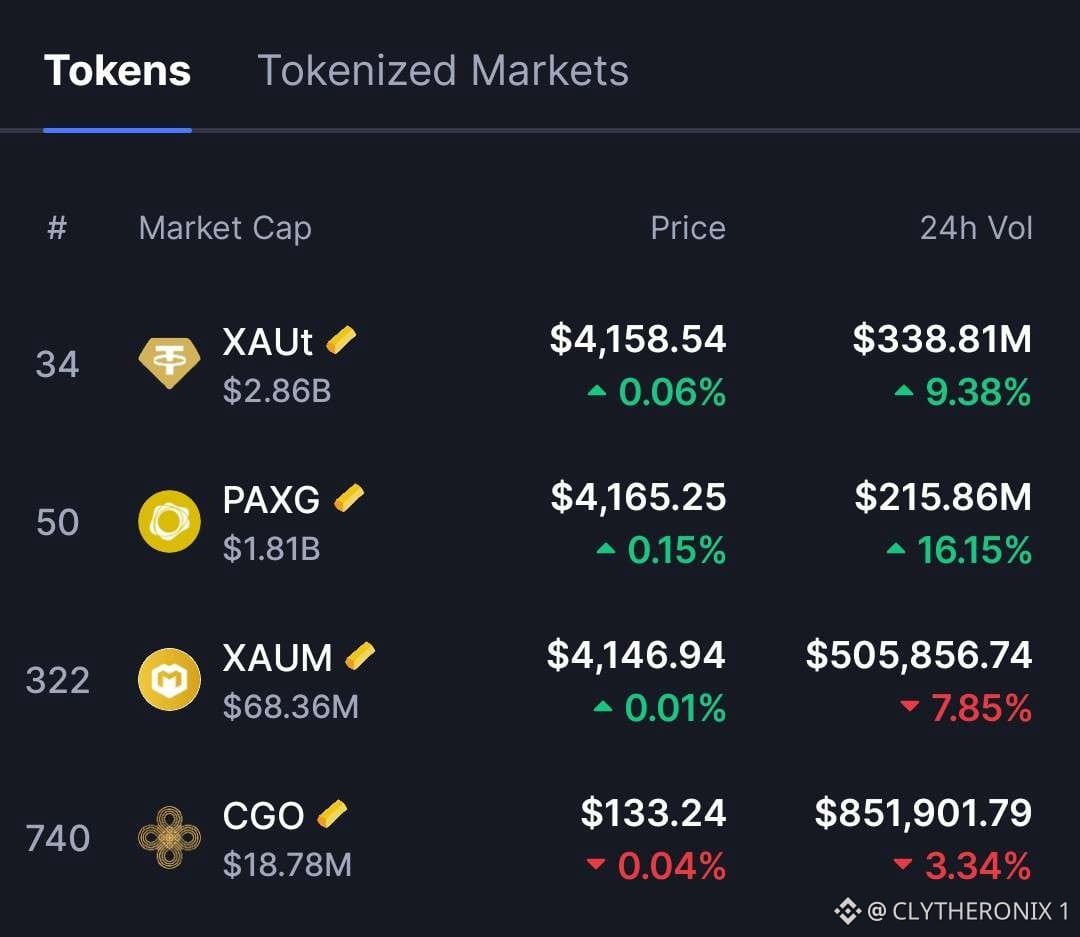
GOLD RWA: Tokenized Gold Holds Firm as Price Recovers
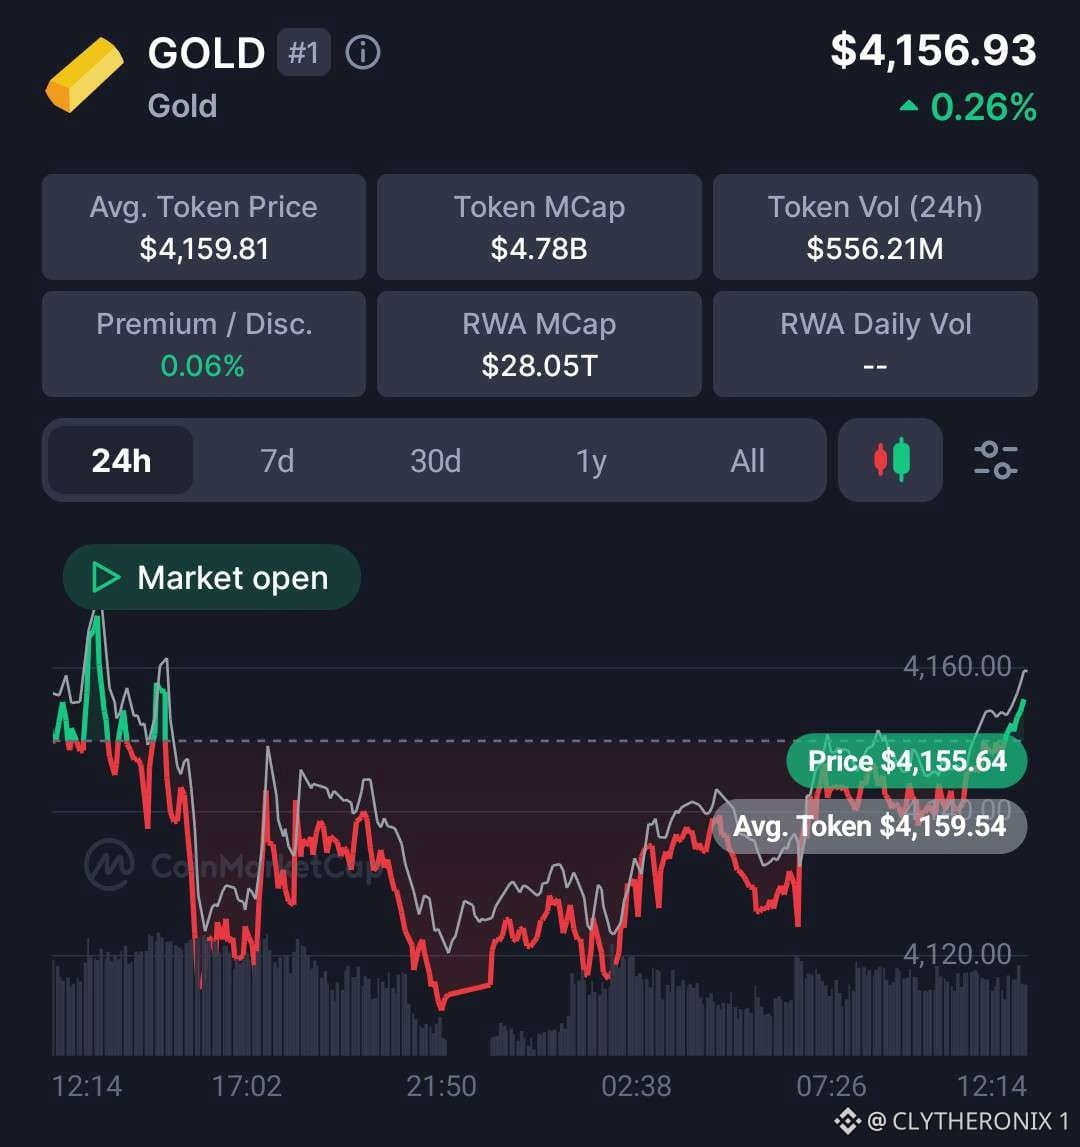
GOLD is showing modest positive momentum, trading around $4,156.93 with a 24-hour gain of 0.26%. The chart shows an early decline followed by a gradual recovery, with price moving back toward the upper end of its recent range.
* Price: $4,156.93
* 24h change: +0.26%
* Average token price: $4,159.81
* Token market cap: $4.78B
* 24h token volume: $556.2M
* Premium/discount: 0.06%
* RWA market cap: $28.05T
$PAXG Price is currently trading slightly below the average token price, suggesting the recovery has not fully erased the earlier weakness.
However, the latest upward move indicates that buyers have returned after the dip.
The modest daily gain points to relatively steady movement rather than a sharp breakout.
The tokenized gold market also shows substantial activity, with a reported 24-hour volume of $556.2M and a token market cap of $4.78B.
The 0.06% premium/discount indicates that the displayed token price is trading close to its reference value, although this figure alone does not establish the quality of its underlying backing or redemption arrangements.
The $4,160 area is the immediate level to watch. A sustained move above it could strengthen the short-term recovery, while a rejection may keep price moving sideways.
On the downside, the $4,120 area is an important support zone visible on the chart.
#RWA #Macro Insights#
GOLD RWA: Tokenized Gold Holds Firm as Price Recovers
GOLD is showing modest positive momentum, trading around $4,156.93 with a 24-hour gain of 0.26%. The chart shows an early decline followed by a gradual recovery, with price moving back toward the upper end of its recent range.
* Price: $4,156.93
* 24h change: +0.26%
* Average token price: $4,159.81
* Token market cap: $4.78B
* 24h token volume: $556.2M
* Premium/discount: 0.06%
* RWA market cap: $28.05T
$PAXG Price is currently trading slightly below the average token price, suggesting the recovery has not fully erased the earlier weakness.
However, the latest upward move indicates that buyers have returned after the dip.
The modest daily gain points to relatively steady movement rather than a sharp breakout.
The tokenized gold market also shows substantial activity, with a reported 24-hour volume of $556.2M and a token market cap of $4.78B.
The 0.06% premium/discount indicates that the displayed token price is trading close to its reference value, although this figure alone does not establish the quality of its underlying backing or redemption arrangements.
The $4,160 area is the immediate level to watch. A sustained move above it could strengthen the short-term recovery, while a rejection may keep price moving sideways.
On the downside, the $4,120 area is an important support zone visible on the chart.
#RWA #Macro Insights#
GOLD is showing modest positive momentum, trading around $4,156.93 with a 24-hour gain of 0.26%. The chart shows an early decline followed by a gradual recovery, with price moving back toward the upper end of its recent range.
* Price: $4,156.93
* 24h change: +0.26%
* Average token price: $4,159.81
* Token market cap: $4.78B
* 24h token volume: $556.2M
* Premium/discount: 0.06%
* RWA market cap: $28.05T
$PAXG Price is currently trading slightly below the average token price, suggesting the recovery has not fully erased the earlier weakness.
However, the latest upward move indicates that buyers have returned after the dip.
The modest daily gain points to relatively steady movement rather than a sharp breakout.
The tokenized gold market also shows substantial activity, with a reported 24-hour volume of $556.2M and a token market cap of $4.78B.
The 0.06% premium/discount indicates that the displayed token price is trading close to its reference value, although this figure alone does not establish the quality of its underlying backing or redemption arrangements.
The $4,160 area is the immediate level to watch. A sustained move above it could strengthen the short-term recovery, while a rejection may keep price moving sideways.
On the downside, the $4,120 area is an important support zone visible on the chart.
#RWA #Macro Insights#
80
查看翻譯
This is where decentralisation gets complicated. THORChain has a strong argument that a neutral protocol should not decide which addresses can transact.
Once that door opens, who decides what gets blocked, whether it is $BTC, $ETH, or another asset, and what prevents that power from being abused?
But the opposite argument is also valid. If validators can halt the protocol during an exploit, it is reasonable to ask why they can not respond when clearly identified stolen funds are being moved through it and converted into assets like BTC.
The answer needs to be more than “decentralisation.” There should be clear rules, transparency, and accountability.
Otherwise, neutrality can either become censorship in disguise or an excuse for avoiding responsibility.
#Macro Insights#
This is where decentralisation gets complicated. THORChain has a strong argument that a neutral protocol should not decide which addresses can transact.
Once that door opens, who decides what gets blocked, whether it is $BTC, $ETH, or another asset, and what prevents that power from being abused?
But the opposite argument is also valid. If validators can halt the protocol during an exploit, it is reasonable to ask why they can not respond when clearly identified stolen funds are being moved through it and converted into assets like BTC.
The answer needs to be more than “decentralisation.” There should be clear rules, transparency, and accountability.
Otherwise, neutrality can either become censorship in disguise or an excuse for avoiding responsibility.
#Macro Insights#
Once that door opens, who decides what gets blocked, whether it is $BTC, $ETH, or another asset, and what prevents that power from being abused?
But the opposite argument is also valid. If validators can halt the protocol during an exploit, it is reasonable to ask why they can not respond when clearly identified stolen funds are being moved through it and converted into assets like BTC.
The answer needs to be more than “decentralisation.” There should be clear rules, transparency, and accountability.
Otherwise, neutrality can either become censorship in disguise or an excuse for avoiding responsibility.
#Macro Insights#

31
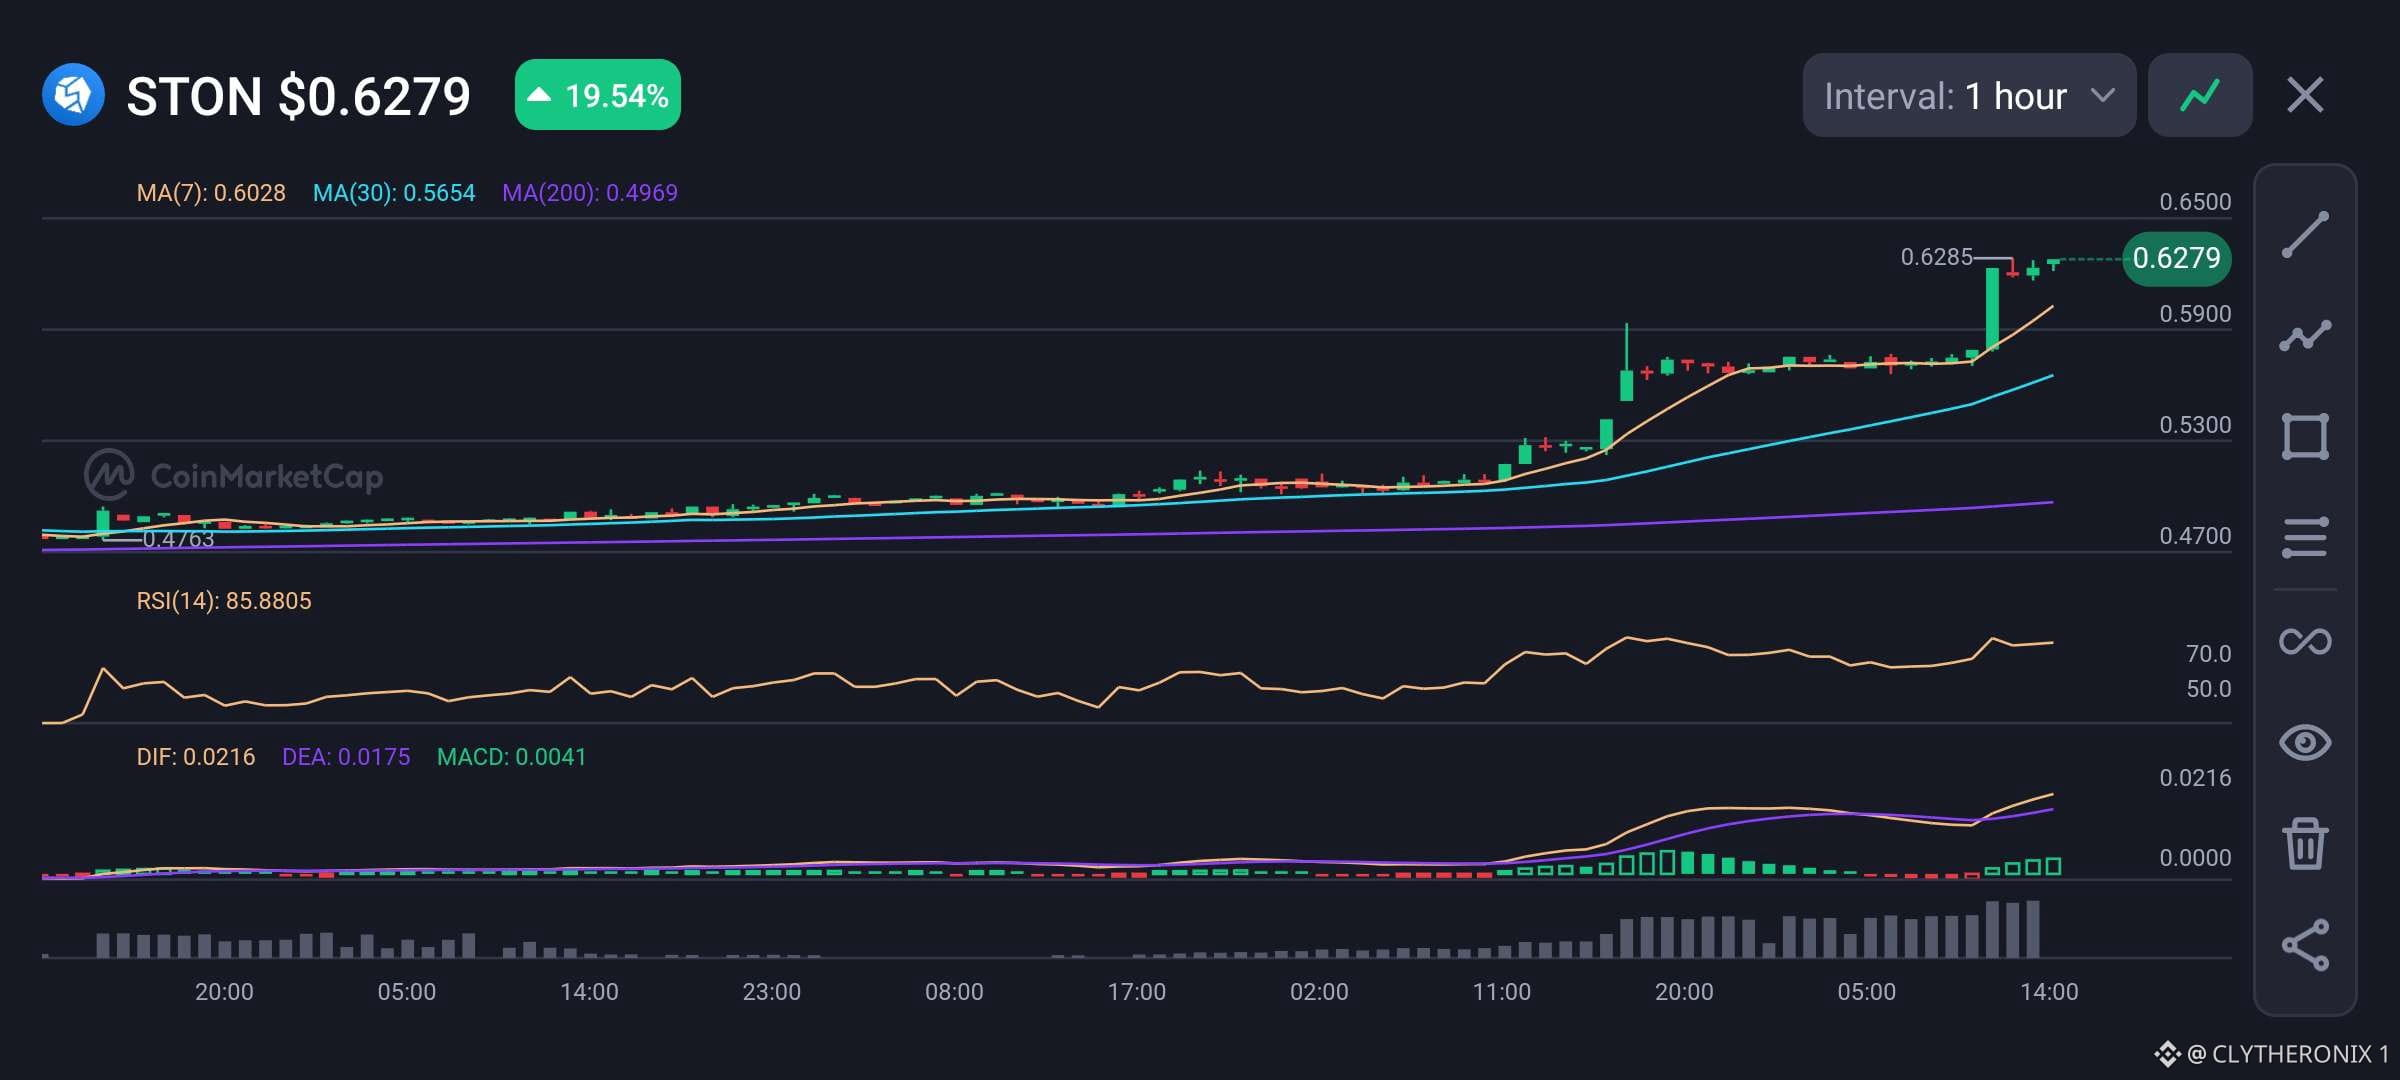
$STON 正在突破!
$STON 在 1 小時圖上出現急劇的看漲突破,股價衝破關鍵移動平均線並測試區間高點,約在 $0.6285 一帶。
來自 GeckoTerminal 的鏈上活動顯示,Stonfi (TON DEX) 的交易興趣升溫,支撐了這波快速價格擴張背後的高成交量激增。
• 價格:$0.6279
• 24 小時變化:+19.54%
• MA(7):$0.6028
• MA(30):$0.5654
• MA(200):$0.4969
• RSI(14):85.88
• MACD:0.0041(看漲)。
當前技術結構整體偏強看漲:股價位於 MA(7)、MA(30) 與 MA(200) 之上,且遠高於其均線水準。MACD 正值的柱狀圖也顯示上行動能持續擴大。
然而,RSI(14) 極端高達 85.88,代表已進入超買狀況,暗示短期可能出現盤整或回調,向移動平均線的支撐靠攏。
主要阻力位在 $0.6300;主要支撐位則在 $0.6025 與 $0.5650。只要能守在 $0.6000 之上,就維持看漲延續的潛力。
以上為研究內容,非投資建議。
$STON 正在突破!
$STON 在 1 小時圖上出現急劇的看漲突破,股價衝破關鍵移動平均線並測試區間高點,約在 $0.6285 一帶。
來自 GeckoTerminal 的鏈上活動顯示,Stonfi (TON DEX) 的交易興趣升溫,支撐了這波快速價格擴張背後的高成交量激增。
• 價格:$0.6279
• 24 小時變化:+19.54%
• MA(7):$0.6028
• MA(30):$0.5654
• MA(200):$0.4969
• RSI(14):85.88
• MACD:0.0041(看漲)。
當前技術結構整體偏強看漲:股價位於 MA(7)、MA(30) 與 MA(200) 之上,且遠高於其均線水準。MACD 正值的柱狀圖也顯示上行動能持續擴大。
然而,RSI(14) 極端高達 85.88,代表已進入超買狀況,暗示短期可能出現盤整或回調,向移動平均線的支撐靠攏。
主要阻力位在 $0.6300;主要支撐位則在 $0.6025 與 $0.5650。只要能守在 $0.6000 之上,就維持看漲延續的潛力。
以上為研究內容,非投資建議。
$STON 在 1 小時圖上出現急劇的看漲突破,股價衝破關鍵移動平均線並測試區間高點,約在 $0.6285 一帶。
來自 GeckoTerminal 的鏈上活動顯示,Stonfi (TON DEX) 的交易興趣升溫,支撐了這波快速價格擴張背後的高成交量激增。
• 價格:$0.6279
• 24 小時變化:+19.54%
• MA(7):$0.6028
• MA(30):$0.5654
• MA(200):$0.4969
• RSI(14):85.88
• MACD:0.0041(看漲)。
當前技術結構整體偏強看漲:股價位於 MA(7)、MA(30) 與 MA(200) 之上,且遠高於其均線水準。MACD 正值的柱狀圖也顯示上行動能持續擴大。
然而,RSI(14) 極端高達 85.88,代表已進入超買狀況,暗示短期可能出現盤整或回調,向移動平均線的支撐靠攏。
主要阻力位在 $0.6300;主要支撐位則在 $0.6025 與 $0.5650。只要能守在 $0.6000 之上,就維持看漲延續的潛力。
以上為研究內容,非投資建議。
59
查看翻譯
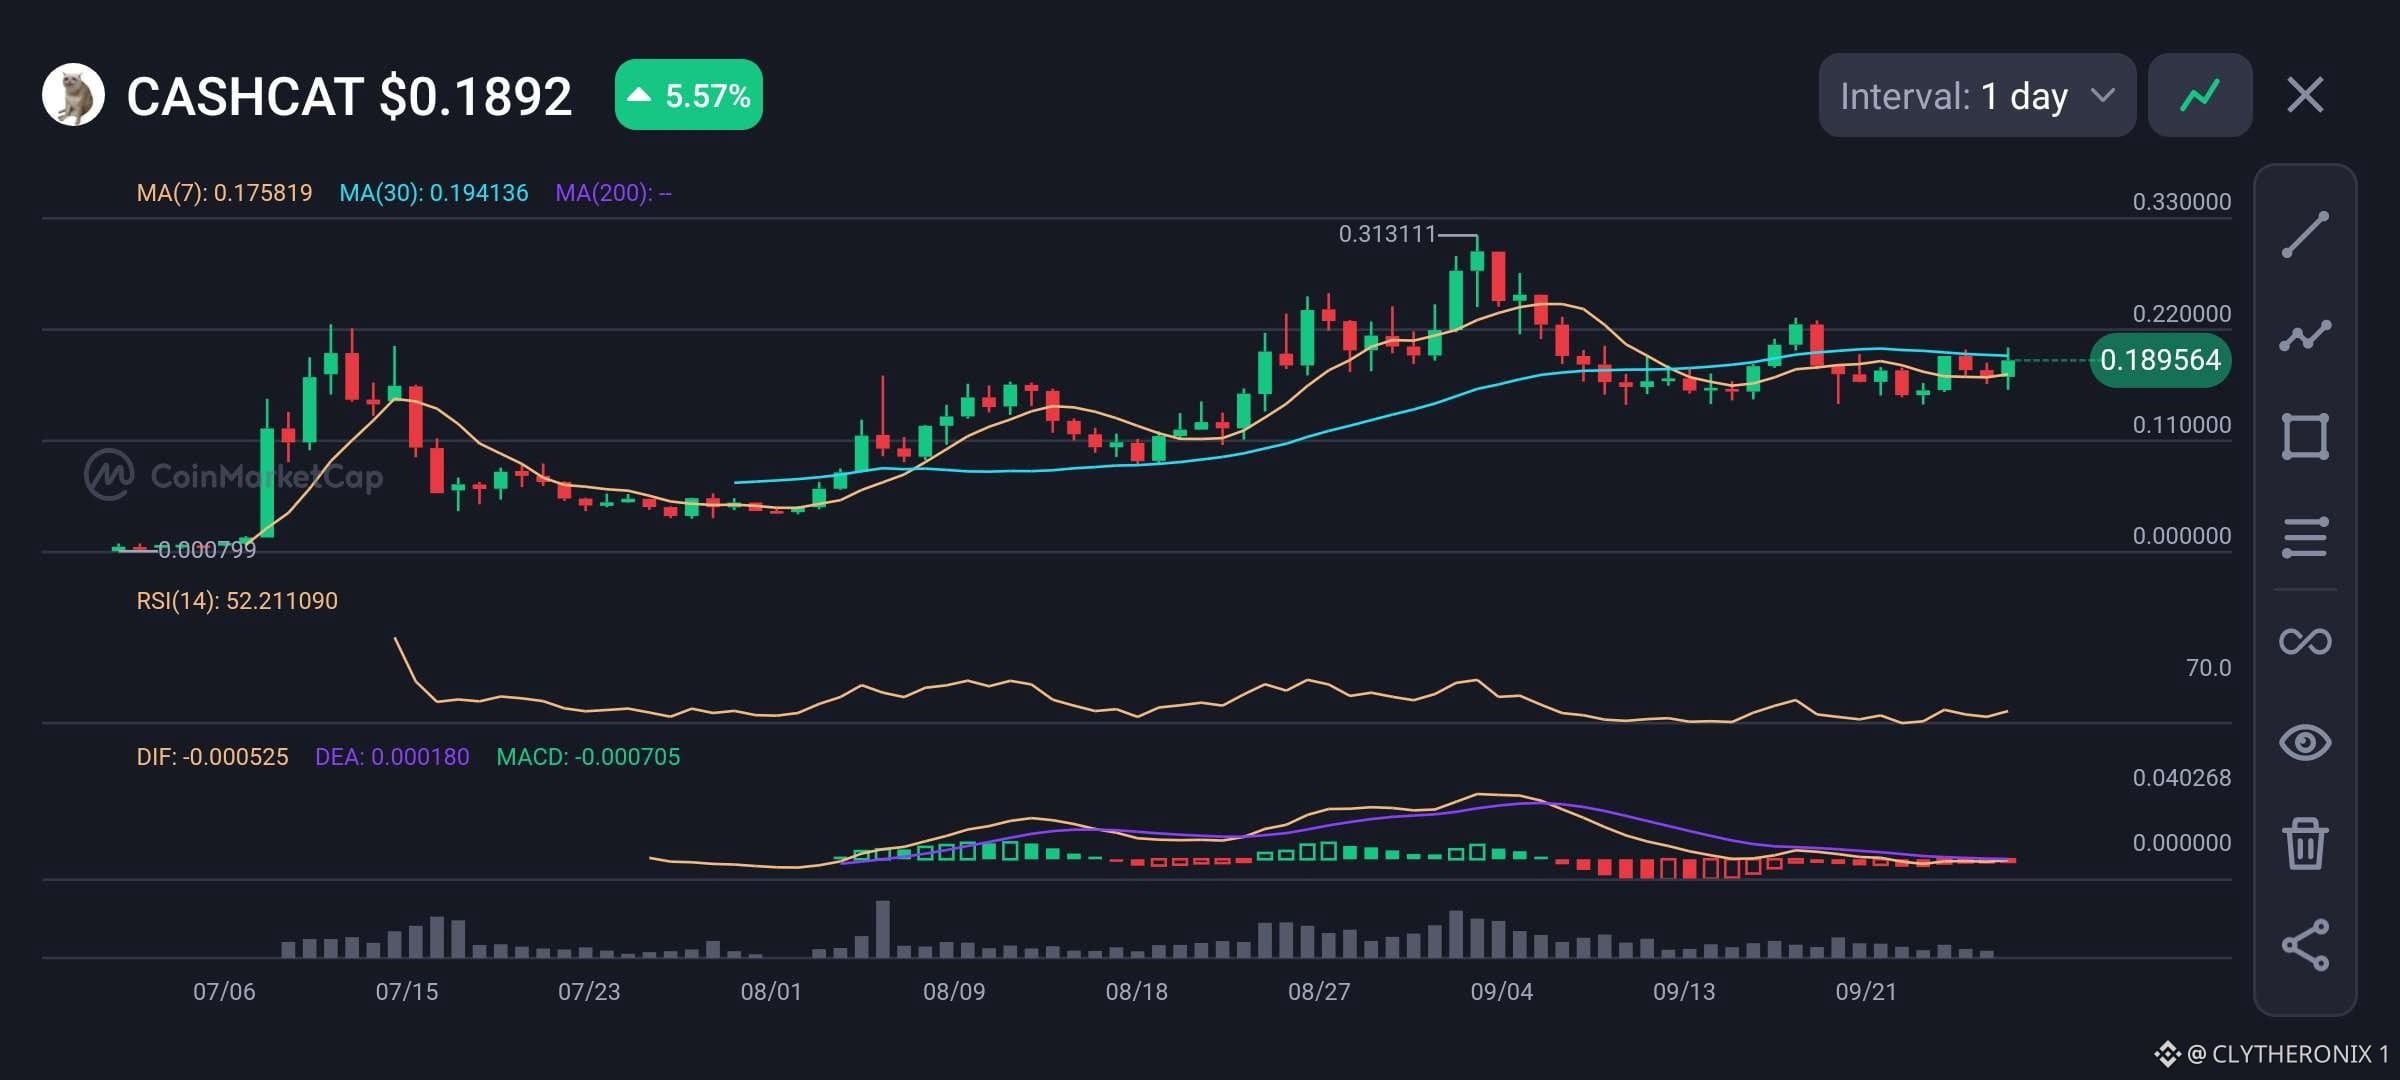
CASHCAT IS CONSOLIDATINGNEAR SUPPORT
$CASHCAT is undergoing minor consolidation after testing local highs.
I check the On-chain data from GeckoTerminal and see the liquidity of $5.76M on Uniswap V3, alongside $817.2K in 24h volume from 2,104 transactions
Sells slightly lead buys (1,082 vs 1,022), but a base of 112.5K holders maintains price stability.
• Price: $0.1806
• 24h change: -2.15%
• MA(7): $0.1845
• MA(30): $0.1910
• MA(200): N/A
• RSI(14): 46.5
• MACD: Neutral
The MA(7) sits above price, showing minor downward pressure, while an RSI of 46.5 confirms a neutral momentum state, and the deep pool liquidity absorbs current selling activity smoothly.
This current chart indicates $CASHCAT is in a neutral consolidation phase below its short-term moving averages, meaning that traders should wait for a decisive breakout above $0.2050 resistance or a breakdown below $0.1600 support before entering any new positions.
This is research work, not financial advice.
#Altcoin Season#
CASHCAT IS CONSOLIDATINGNEAR SUPPORT
$CASHCAT is undergoing minor consolidation after testing local highs.
I check the On-chain data from GeckoTerminal and see the liquidity of $5.76M on Uniswap V3, alongside $817.2K in 24h volume from 2,104 transactions
Sells slightly lead buys (1,082 vs 1,022), but a base of 112.5K holders maintains price stability.
• Price: $0.1806
• 24h change: -2.15%
• MA(7): $0.1845
• MA(30): $0.1910
• MA(200): N/A
• RSI(14): 46.5
• MACD: Neutral
The MA(7) sits above price, showing minor downward pressure, while an RSI of 46.5 confirms a neutral momentum state, and the deep pool liquidity absorbs current selling activity smoothly.
This current chart indicates $CASHCAT is in a neutral consolidation phase below its short-term moving averages, meaning that traders should wait for a decisive breakout above $0.2050 resistance or a breakdown below $0.1600 support before entering any new positions.
This is research work, not financial advice.
#Altcoin Season#
$CASHCAT is undergoing minor consolidation after testing local highs.
I check the On-chain data from GeckoTerminal and see the liquidity of $5.76M on Uniswap V3, alongside $817.2K in 24h volume from 2,104 transactions
Sells slightly lead buys (1,082 vs 1,022), but a base of 112.5K holders maintains price stability.
• Price: $0.1806
• 24h change: -2.15%
• MA(7): $0.1845
• MA(30): $0.1910
• MA(200): N/A
• RSI(14): 46.5
• MACD: Neutral
The MA(7) sits above price, showing minor downward pressure, while an RSI of 46.5 confirms a neutral momentum state, and the deep pool liquidity absorbs current selling activity smoothly.
This current chart indicates $CASHCAT is in a neutral consolidation phase below its short-term moving averages, meaning that traders should wait for a decisive breakout above $0.2050 resistance or a breakdown below $0.1600 support before entering any new positions.
This is research work, not financial advice.
#Altcoin Season#

62
查看翻譯
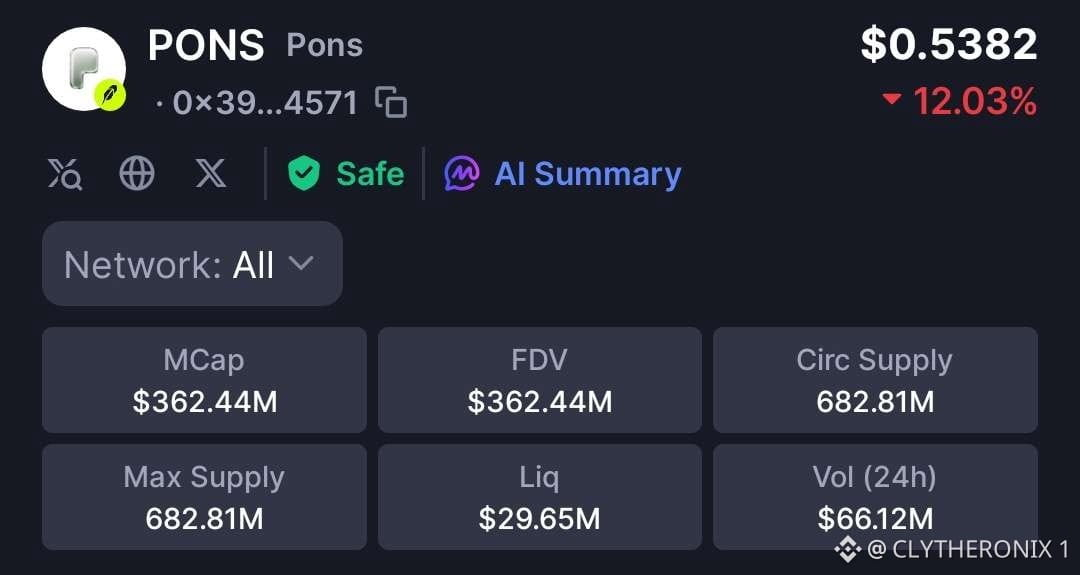
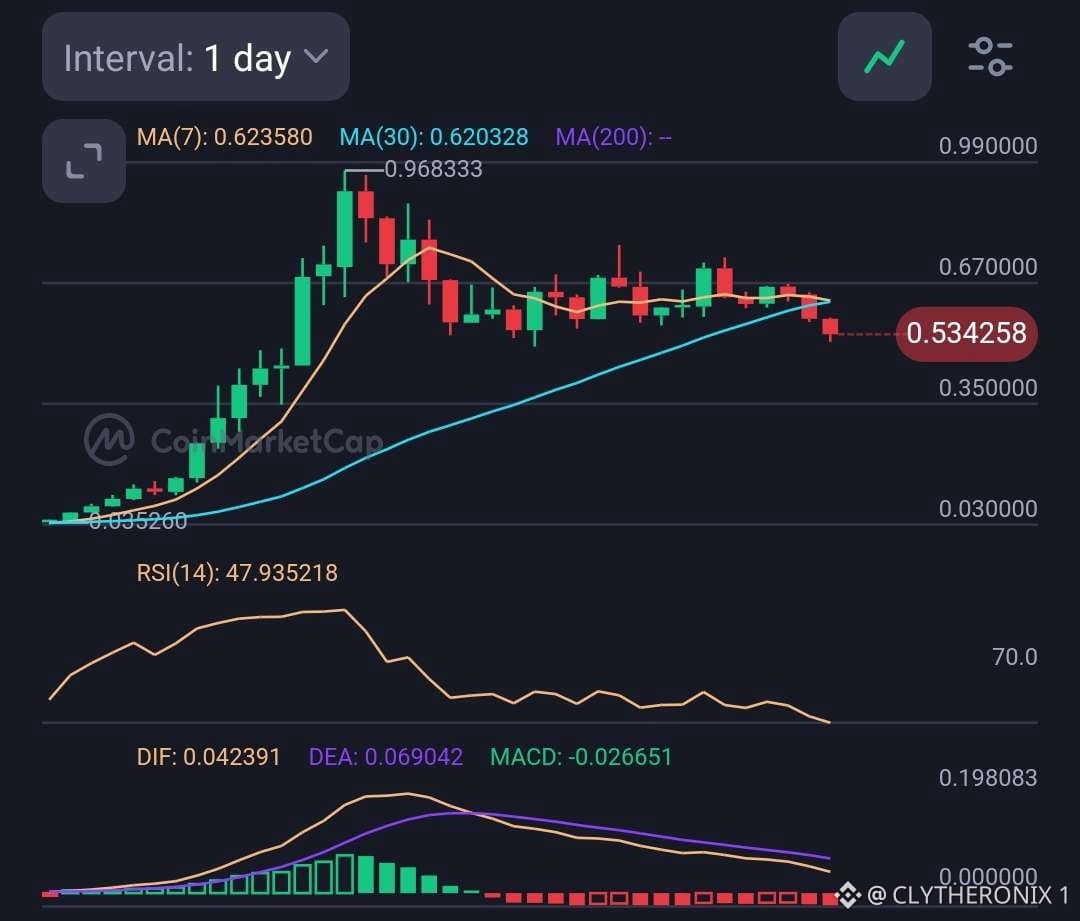
PONS is showing a cooling phase on the daily chart after its earlier rally. Price is around $0.5343, sitting below both the 7 day and 30 day moving averages.
On chain activity is still significant. The main $PONS/ $WETH pool on Robinhood Chain has recorded around $874K in 24-hour volume across 1,796 transactions, with liquidity around $4.1M and more than 101,000 holders. Buy and sell activity is relatively balanced, with 886 buys against 910 sells.
• Price: $0.5343
• MA(7): $0.6236
• MA(30): $0.6203
• RSI(14): 47.94
• MACD: -0.0267
The technical structure has weakened as price moved below the short-term averages. RSI near 48 shows fairly balanced momentum, while the negative MACD indicates that short-term selling pressure remains present.
But looking at the $PONS chart, the $0.62 area is the key level to reclaim. A move back above the 7 day and 30 day averages could improve the short-term structure, while the $0.50 area remains an important level if selling pressure continues.
I will personally not be trading this at this moment. Dyor because this is not FA.
PONS is showing a cooling phase on the daily chart after its earlier rally. Price is around $0.5343, sitting below both the 7 day and 30 day moving averages.
On chain activity is still significant. The main $PONS/ $WETH pool on Robinhood Chain has recorded around $874K in 24-hour volume across 1,796 transactions, with liquidity around $4.1M and more than 101,000 holders. Buy and sell activity is relatively balanced, with 886 buys against 910 sells.
• Price: $0.5343
• MA(7): $0.6236
• MA(30): $0.6203
• RSI(14): 47.94
• MACD: -0.0267
The technical structure has weakened as price moved below the short-term averages. RSI near 48 shows fairly balanced momentum, while the negative MACD indicates that short-term selling pressure remains present.
But looking at the $PONS chart, the $0.62 area is the key level to reclaim. A move back above the 7 day and 30 day averages could improve the short-term structure, while the $0.50 area remains an important level if selling pressure continues.
I will personally not be trading this at this moment. Dyor because this is not FA.
On chain activity is still significant. The main $PONS/ $WETH pool on Robinhood Chain has recorded around $874K in 24-hour volume across 1,796 transactions, with liquidity around $4.1M and more than 101,000 holders. Buy and sell activity is relatively balanced, with 886 buys against 910 sells.
• Price: $0.5343
• MA(7): $0.6236
• MA(30): $0.6203
• RSI(14): 47.94
• MACD: -0.0267
The technical structure has weakened as price moved below the short-term averages. RSI near 48 shows fairly balanced momentum, while the negative MACD indicates that short-term selling pressure remains present.
But looking at the $PONS chart, the $0.62 area is the key level to reclaim. A move back above the 7 day and 30 day averages could improve the short-term structure, while the $0.50 area remains an important level if selling pressure continues.
I will personally not be trading this at this moment. Dyor because this is not FA.
178
查看翻譯
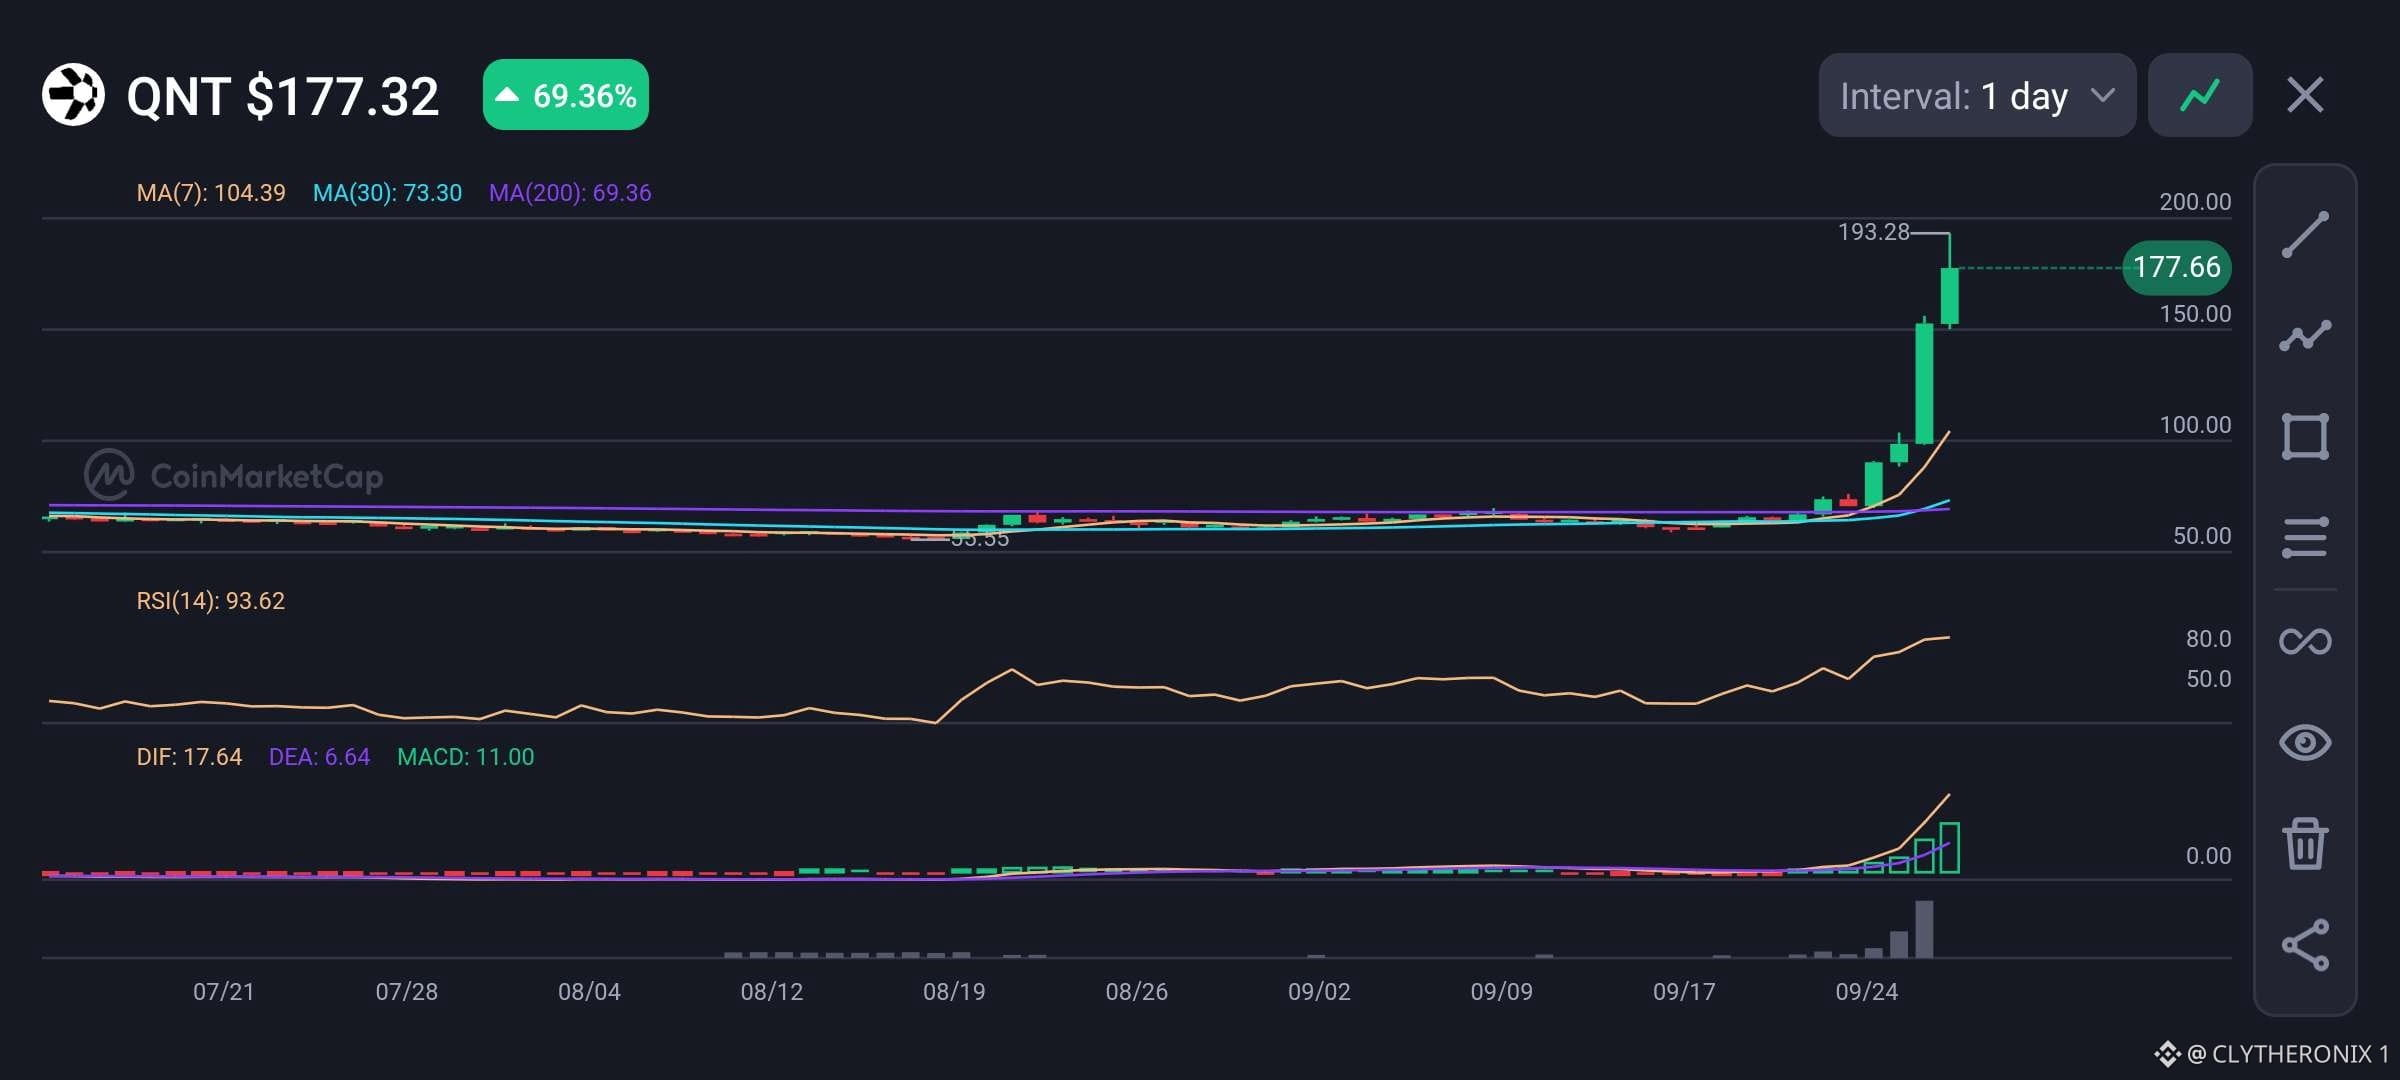
Quant is showing a powerful breakout on the daily chart, trading around $177.32 after gaining 69.36%. The move has pushed price far above its major moving averages and comes with a sharp increase in volume.
Social sentiment has also turned strongly bullish around $QNT. Recent coverage links the rally to Quant's selection by The Clearing House for its tokenized deposit initiative, while social discussions focus on institutional adoption, interoperability, and supply scarcity.
• Price: $177.32
• 24h gain: +69.36%
• MA(7): $104.39
• MA(30): $73.30
• MA(200): $69.36
• RSI(14): 93.62
• MACD: 11.00
Technically, the trend is extremely strong. Price has broken far above the 7, 30, and 200-day moving averages, while MACD is strongly positive and expanding. However, RSI at 93.62 shows extremely overbought conditions, so a period of profit taking or consolidation would not be surprising.
$QNT recent high around $193.28 is the key resistance. If momentum cools, the $150 area and then the $104 MA(7) become important levels to watch.
#Altcoin Season#
Quant is showing a powerful breakout on the daily chart, trading around $177.32 after gaining 69.36%. The move has pushed price far above its major moving averages and comes with a sharp increase in volume.
Social sentiment has also turned strongly bullish around $QNT. Recent coverage links the rally to Quant's selection by The Clearing House for its tokenized deposit initiative, while social discussions focus on institutional adoption, interoperability, and supply scarcity.
• Price: $177.32
• 24h gain: +69.36%
• MA(7): $104.39
• MA(30): $73.30
• MA(200): $69.36
• RSI(14): 93.62
• MACD: 11.00
Technically, the trend is extremely strong. Price has broken far above the 7, 30, and 200-day moving averages, while MACD is strongly positive and expanding. However, RSI at 93.62 shows extremely overbought conditions, so a period of profit taking or consolidation would not be surprising.
$QNT recent high around $193.28 is the key resistance. If momentum cools, the $150 area and then the $104 MA(7) become important levels to watch.
#Altcoin Season#
Social sentiment has also turned strongly bullish around $QNT. Recent coverage links the rally to Quant's selection by The Clearing House for its tokenized deposit initiative, while social discussions focus on institutional adoption, interoperability, and supply scarcity.
• Price: $177.32
• 24h gain: +69.36%
• MA(7): $104.39
• MA(30): $73.30
• MA(200): $69.36
• RSI(14): 93.62
• MACD: 11.00
Technically, the trend is extremely strong. Price has broken far above the 7, 30, and 200-day moving averages, while MACD is strongly positive and expanding. However, RSI at 93.62 shows extremely overbought conditions, so a period of profit taking or consolidation would not be surprising.
$QNT recent high around $193.28 is the key resistance. If momentum cools, the $150 area and then the $104 MA(7) become important levels to watch.
#Altcoin Season#
73
查看翻譯
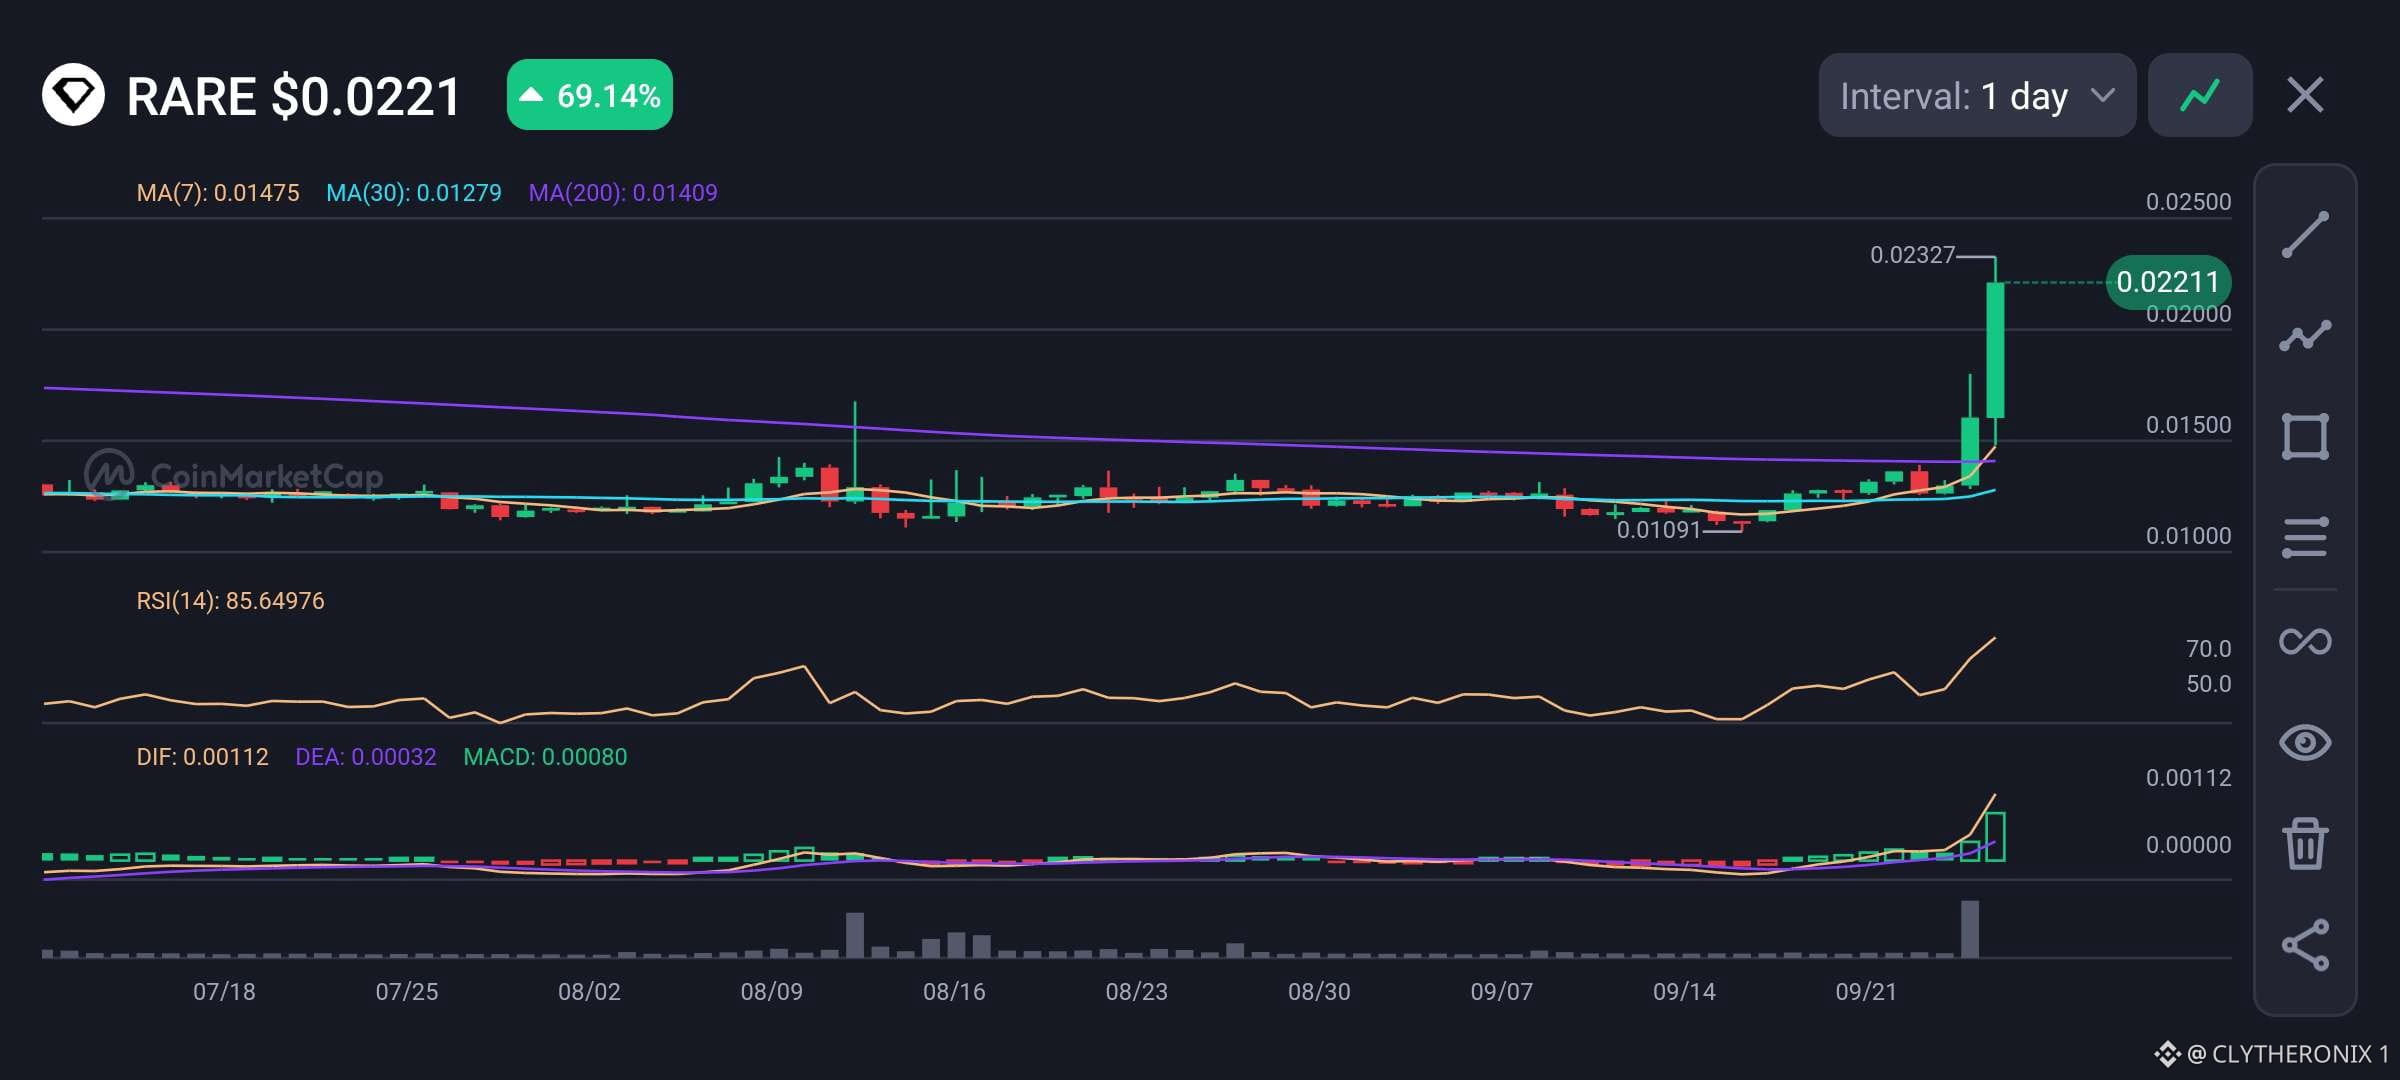
SUPERRARE is showing a major breakout on the daily chart, trading around $0.0221 after gaining 69.14%.
• Price: $0.0221
• 24h gain: +69.14%
• MA(7): $0.01475
• MA(30): $0.01279
• MA(200): $0.01409
• RSI(14): 85.65
• MACD: 0.00080
Price has moved sharply above all three moving averages, confirming a strong shift in short-term momentum. The breakout is also supported by a major increase in trading volume, suggesting strong buying activity behind the move.
MACD has turned strongly positive and is rising, adding further confirmation to the bullish momentum. However, RSI at 85.65 is deeply overbought, so the risk of profit taking and a short-term pullback is now elevated.
The recent high around $0.02327 is the immediate resistance to watch. If $RARE breaks and holds above it, the move could continue. On the downside, $0.01475 around the 7 day MA is an important support area if the market starts cooling off.
#Altcoin Season#
SUPERRARE is showing a major breakout on the daily chart, trading around $0.0221 after gaining 69.14%.
• Price: $0.0221
• 24h gain: +69.14%
• MA(7): $0.01475
• MA(30): $0.01279
• MA(200): $0.01409
• RSI(14): 85.65
• MACD: 0.00080
Price has moved sharply above all three moving averages, confirming a strong shift in short-term momentum. The breakout is also supported by a major increase in trading volume, suggesting strong buying activity behind the move.
MACD has turned strongly positive and is rising, adding further confirmation to the bullish momentum. However, RSI at 85.65 is deeply overbought, so the risk of profit taking and a short-term pullback is now elevated.
The recent high around $0.02327 is the immediate resistance to watch. If $RARE breaks and holds above it, the move could continue. On the downside, $0.01475 around the 7 day MA is an important support area if the market starts cooling off.
#Altcoin Season#
• Price: $0.0221
• 24h gain: +69.14%
• MA(7): $0.01475
• MA(30): $0.01279
• MA(200): $0.01409
• RSI(14): 85.65
• MACD: 0.00080
Price has moved sharply above all three moving averages, confirming a strong shift in short-term momentum. The breakout is also supported by a major increase in trading volume, suggesting strong buying activity behind the move.
MACD has turned strongly positive and is rising, adding further confirmation to the bullish momentum. However, RSI at 85.65 is deeply overbought, so the risk of profit taking and a short-term pullback is now elevated.
The recent high around $0.02327 is the immediate resistance to watch. If $RARE breaks and holds above it, the move could continue. On the downside, $0.01475 around the 7 day MA is an important support area if the market starts cooling off.
#Altcoin Season#
51
查看翻譯
If you keep crypto on Bitget, you deserve to lose it.
But for Bitcoin, this $351M hack is actually bullish. Every exchange collapse dumps short-term panic on $BTC prices, driving weak hands to sell. Yet, it ruthlessly proves Bitcoin’s core purpose: self-custody. Centralized exchanges are just predatory, unregulated banks.
When they halt withdrawals, paper-bitcoin illusions shatter, and real $BTC gets pulled into cold storage.
Stop crying about frozen funds when you were too lazy to buy a hardware wallet.
BTC survives because of cryptography, not parasitic middlemen.
Own your keys 🔑.
If you keep crypto on Bitget, you deserve to lose it.
But for Bitcoin, this $351M hack is actually bullish. Every exchange collapse dumps short-term panic on $BTC prices, driving weak hands to sell. Yet, it ruthlessly proves Bitcoin’s core purpose: self-custody. Centralized exchanges are just predatory, unregulated banks.
When they halt withdrawals, paper-bitcoin illusions shatter, and real $BTC gets pulled into cold storage.
Stop crying about frozen funds when you were too lazy to buy a hardware wallet.
BTC survives because of cryptography, not parasitic middlemen.
Own your keys 🔑.
But for Bitcoin, this $351M hack is actually bullish. Every exchange collapse dumps short-term panic on $BTC prices, driving weak hands to sell. Yet, it ruthlessly proves Bitcoin’s core purpose: self-custody. Centralized exchanges are just predatory, unregulated banks.
When they halt withdrawals, paper-bitcoin illusions shatter, and real $BTC gets pulled into cold storage.
Stop crying about frozen funds when you were too lazy to buy a hardware wallet.
BTC survives because of cryptography, not parasitic middlemen.
Own your keys 🔑.
28
查看翻譯
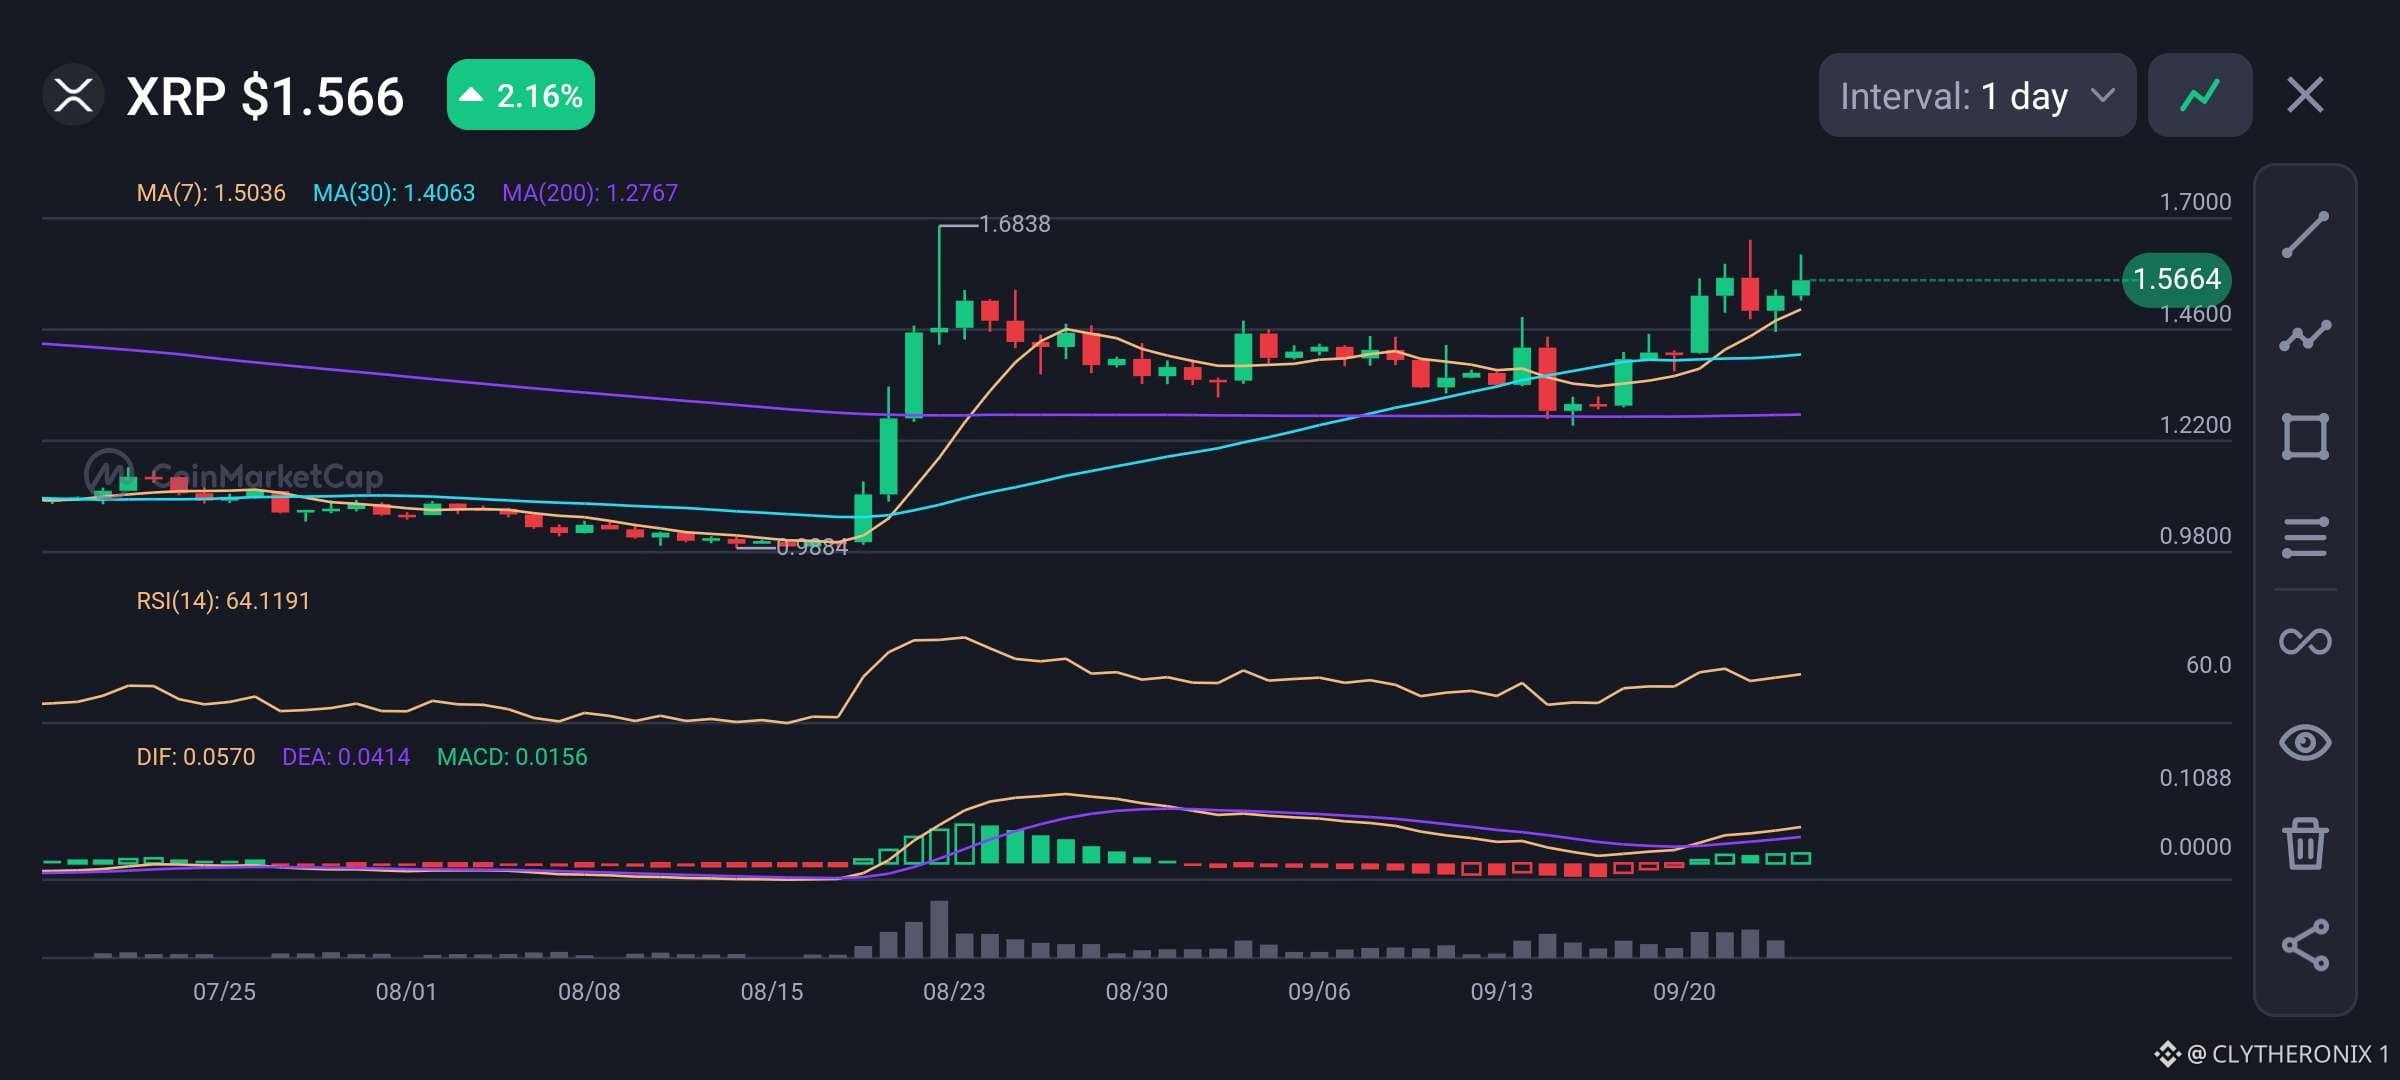
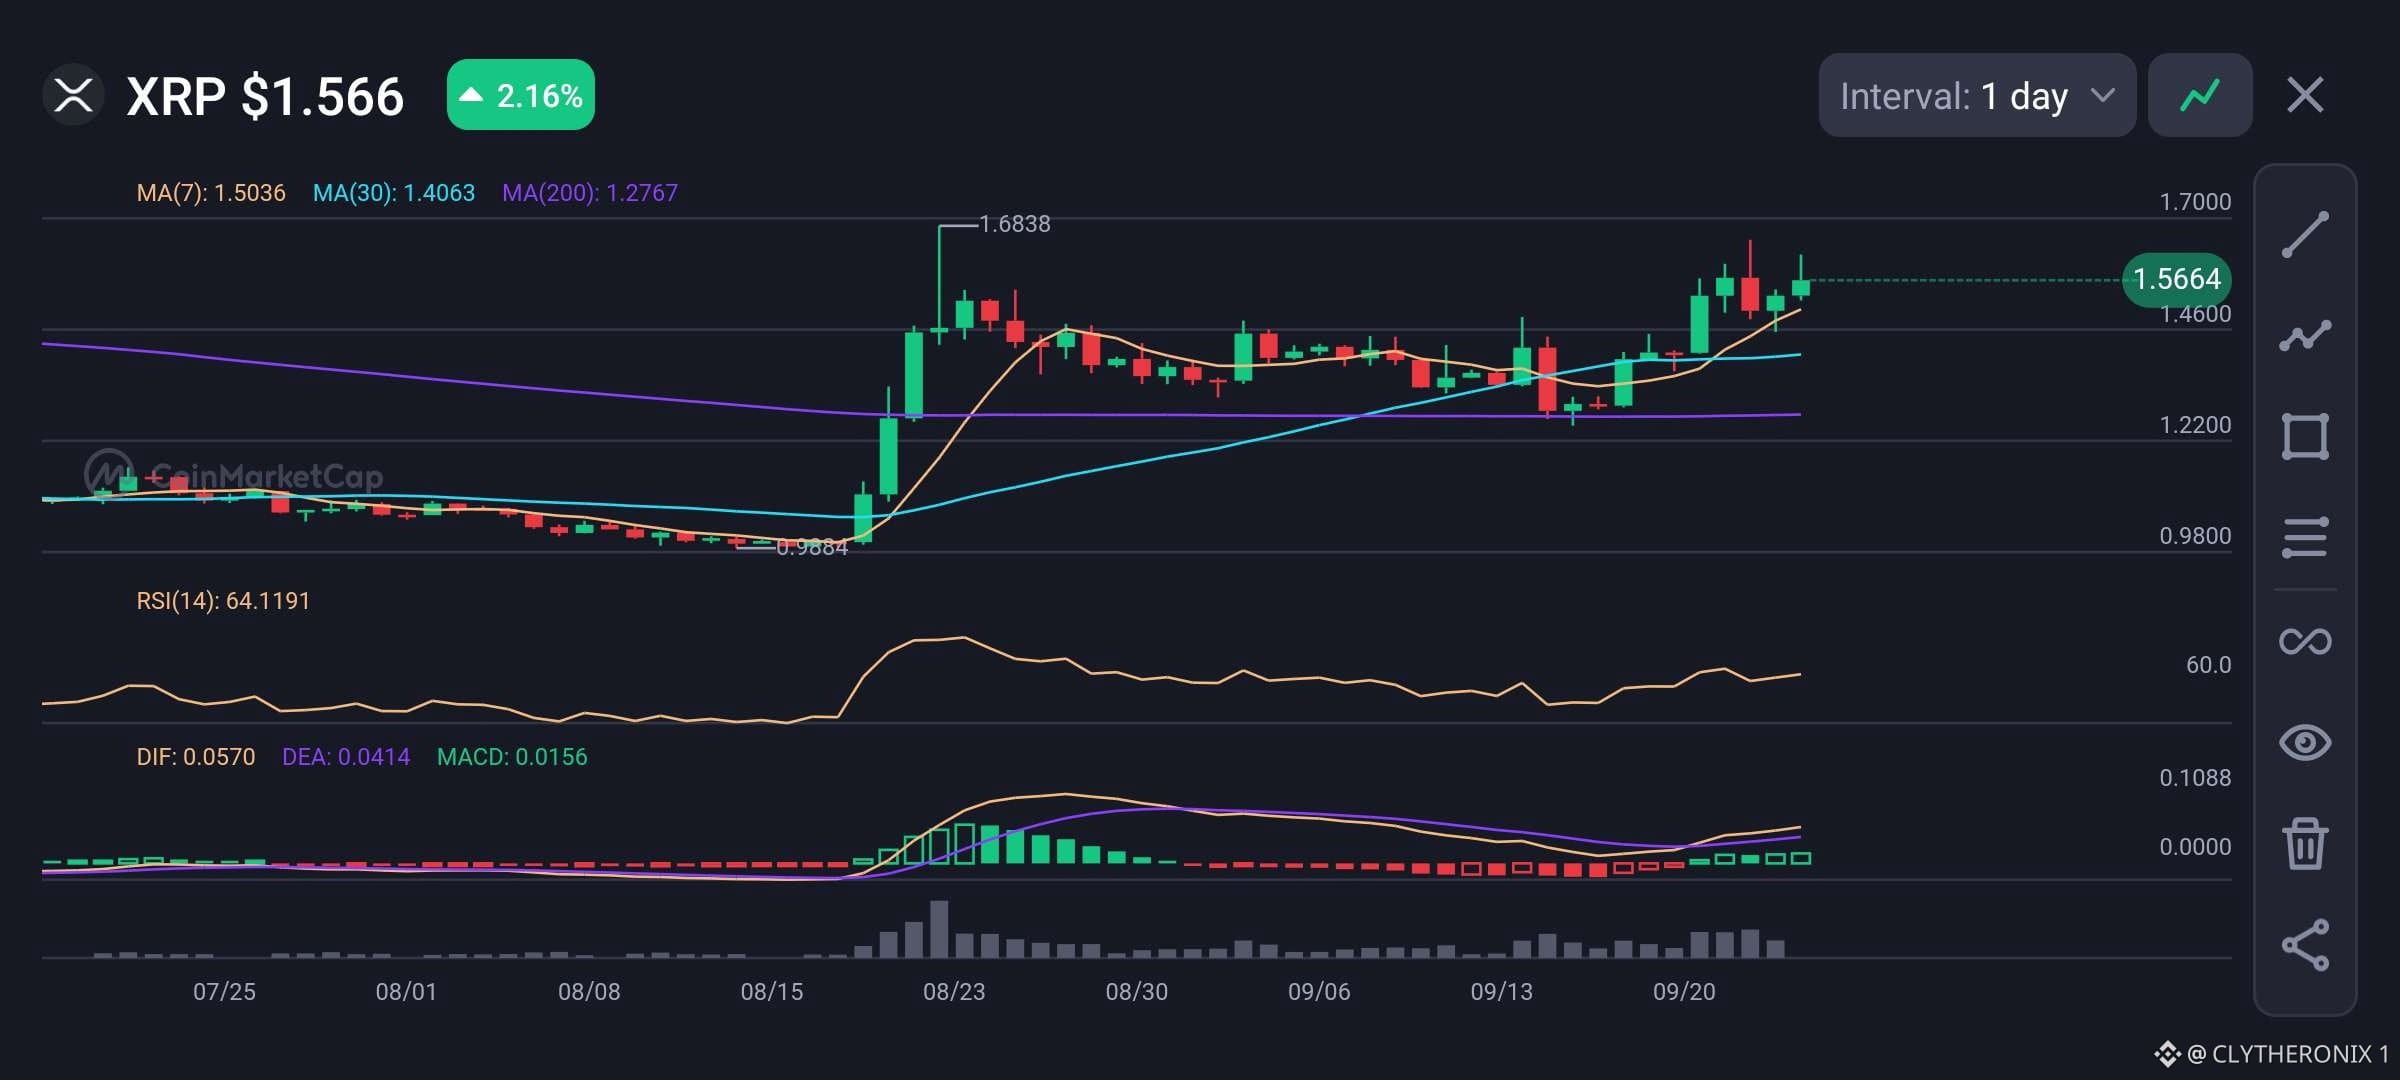
XRP is currently trading at $1.566 following a 2.16% price gain on the daily chart.
The main trend stays strongly bullish as the price remains above key support levels.
The 7 day Moving Average sits at $1.5036, the 30-day Moving Average is at $1.4063, and the 200-day Moving Average is at $1.2767.
Short-term support is near the 7 day line at $1.5036, while the main resistance is at $1.6838.
The 14 period RSI is at 64.12, which shows healthy buying momentum without reaching overbought levels for $XRP.
The MACD indicator remains positive with DIF at 0.0570 above DEA at 0.0414, giving a green MACD value of 0.0156.
If buyers hold the $1.5036 support level, $XRP can push back up toward $1.6838. However, dropping below this level could push the price down to test $1.4063.
#Altcoin Season#
XRP is currently trading at $1.566 following a 2.16% price gain on the daily chart.
The main trend stays strongly bullish as the price remains above key support levels.
The 7 day Moving Average sits at $1.5036, the 30-day Moving Average is at $1.4063, and the 200-day Moving Average is at $1.2767.
Short-term support is near the 7 day line at $1.5036, while the main resistance is at $1.6838.
The 14 period RSI is at 64.12, which shows healthy buying momentum without reaching overbought levels for $XRP.
The MACD indicator remains positive with DIF at 0.0570 above DEA at 0.0414, giving a green MACD value of 0.0156.
If buyers hold the $1.5036 support level, $XRP can push back up toward $1.6838. However, dropping below this level could push the price down to test $1.4063.
#Altcoin Season#
The main trend stays strongly bullish as the price remains above key support levels.
The 7 day Moving Average sits at $1.5036, the 30-day Moving Average is at $1.4063, and the 200-day Moving Average is at $1.2767.
Short-term support is near the 7 day line at $1.5036, while the main resistance is at $1.6838.
The 14 period RSI is at 64.12, which shows healthy buying momentum without reaching overbought levels for $XRP.
The MACD indicator remains positive with DIF at 0.0570 above DEA at 0.0414, giving a green MACD value of 0.0156.
If buyers hold the $1.5036 support level, $XRP can push back up toward $1.6838. However, dropping below this level could push the price down to test $1.4063.
#Altcoin Season#
39
查看翻譯
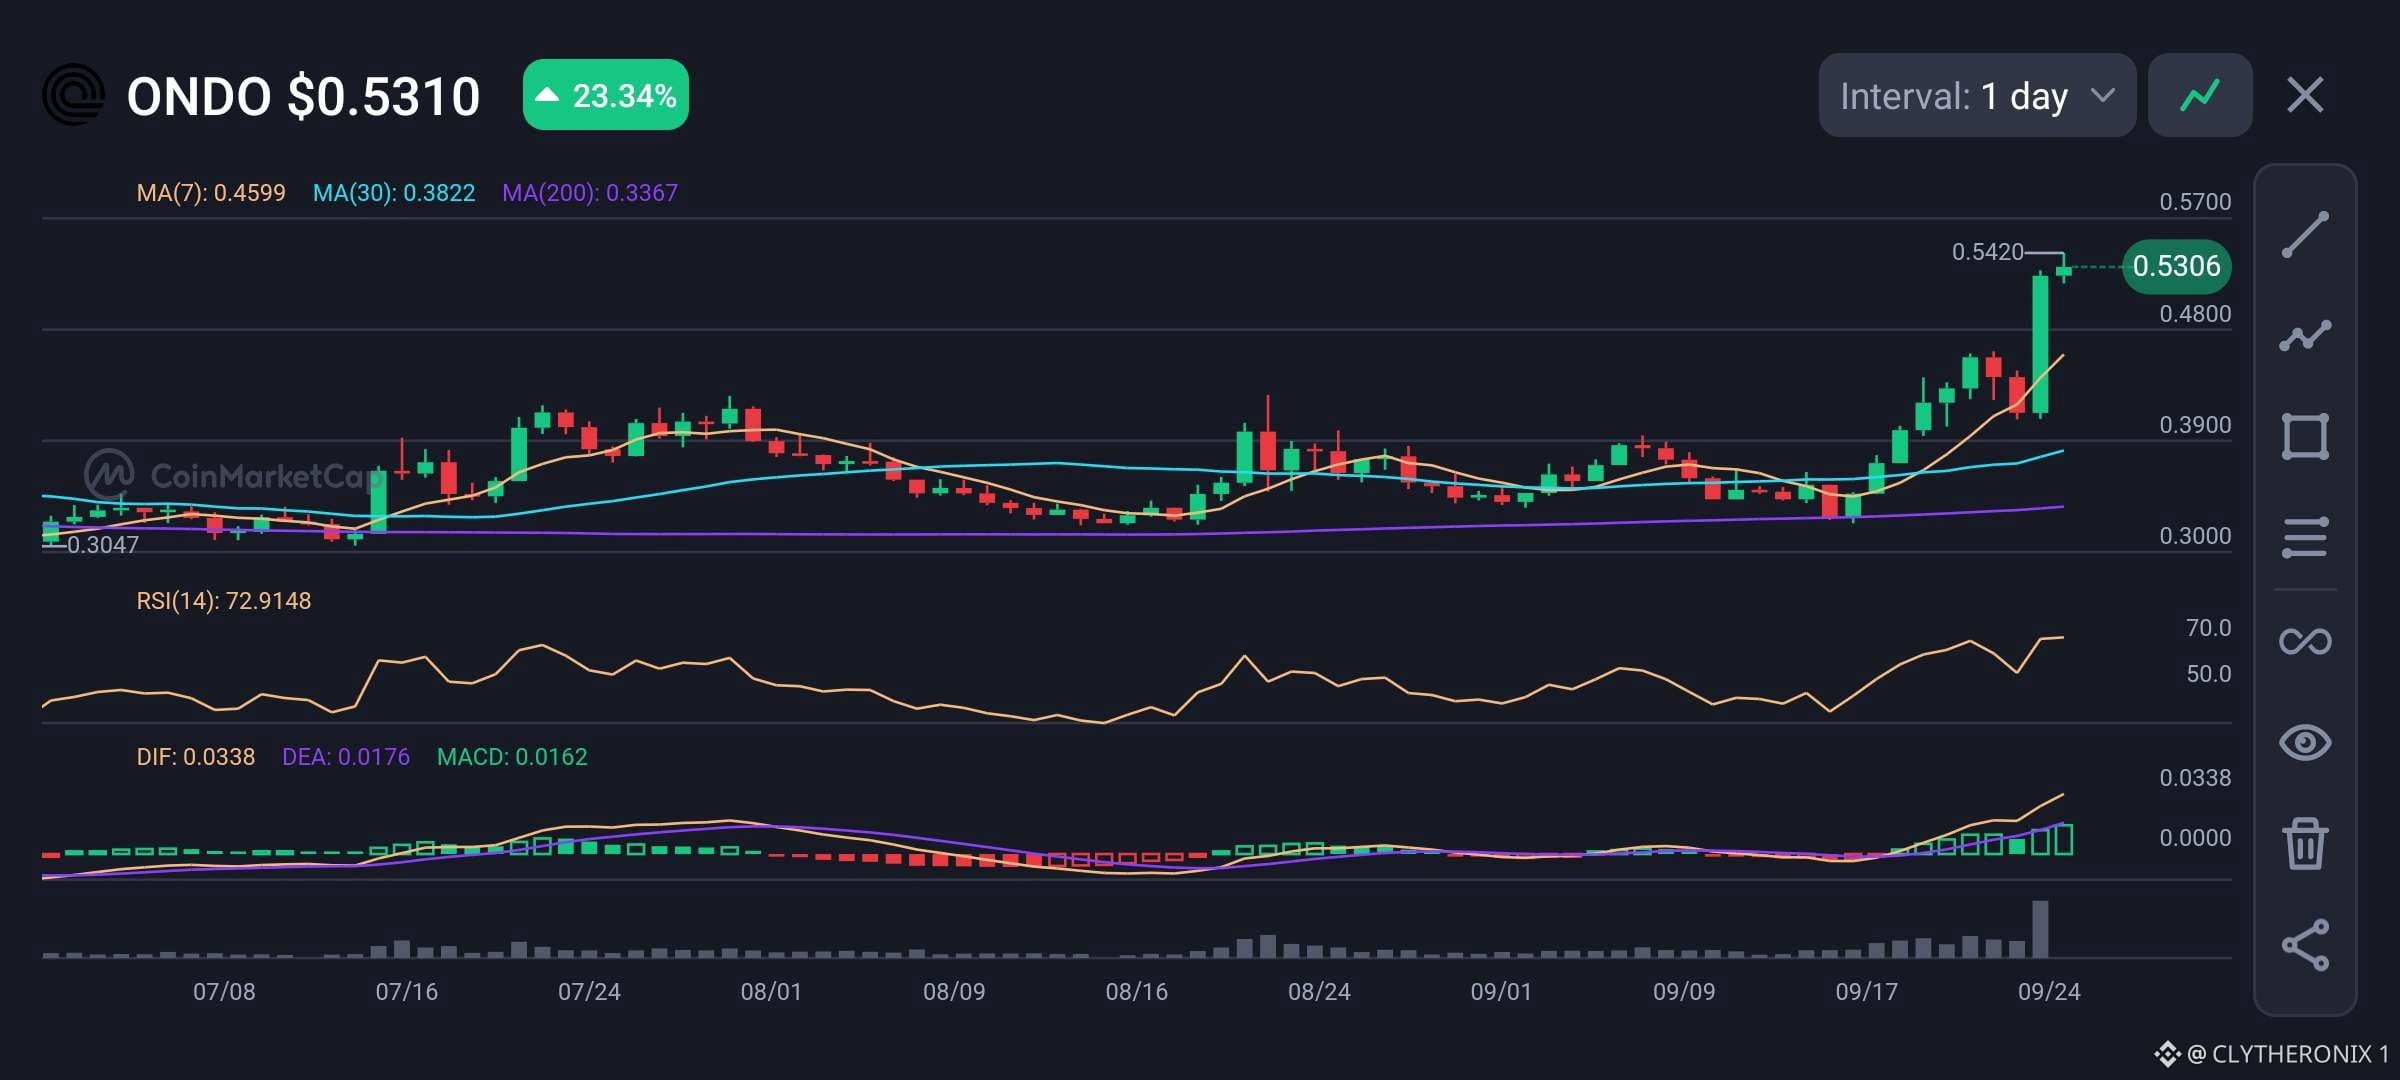
ONDO is showing strong bullish momentum on the daily chart, trading around $0.5310 after gaining 23.34%.
• Price: $0.5310
• 24h gain: +23.34%
• MA(7): $0.4599
• MA(30): $0.3822
• MA(200): $0.3367
• RSI(14): 72.91
• MACD: 0.0162
$ONDO has moved well above the 7 day, 30 day, and 200 day moving averages, showing that buyers are firmly in control of the current trend. The recent candles also came with a clear increase in trading volume, supporting the strength of the breakout.
MACD is positive and rising, which adds further confirmation to the current momentum. However, RSI is at 72.91, placing ONDO in overbought territory. This means the price could see some profit taking or short-term consolidation after such a strong move.
The $0.480 area is an important level to watch, while the 7 day MA around $0.4599 could act as deeper support. Holding these levels would keep the current bullish structure intact, while a rejection from the recent high could lead to a temporary pullback.
#Macro Insights#
ONDO is showing strong bullish momentum on the daily chart, trading around $0.5310 after gaining 23.34%.
• Price: $0.5310
• 24h gain: +23.34%
• MA(7): $0.4599
• MA(30): $0.3822
• MA(200): $0.3367
• RSI(14): 72.91
• MACD: 0.0162
$ONDO has moved well above the 7 day, 30 day, and 200 day moving averages, showing that buyers are firmly in control of the current trend. The recent candles also came with a clear increase in trading volume, supporting the strength of the breakout.
MACD is positive and rising, which adds further confirmation to the current momentum. However, RSI is at 72.91, placing ONDO in overbought territory. This means the price could see some profit taking or short-term consolidation after such a strong move.
The $0.480 area is an important level to watch, while the 7 day MA around $0.4599 could act as deeper support. Holding these levels would keep the current bullish structure intact, while a rejection from the recent high could lead to a temporary pullback.
#Macro Insights#
• Price: $0.5310
• 24h gain: +23.34%
• MA(7): $0.4599
• MA(30): $0.3822
• MA(200): $0.3367
• RSI(14): 72.91
• MACD: 0.0162
$ONDO has moved well above the 7 day, 30 day, and 200 day moving averages, showing that buyers are firmly in control of the current trend. The recent candles also came with a clear increase in trading volume, supporting the strength of the breakout.
MACD is positive and rising, which adds further confirmation to the current momentum. However, RSI is at 72.91, placing ONDO in overbought territory. This means the price could see some profit taking or short-term consolidation after such a strong move.
The $0.480 area is an important level to watch, while the 7 day MA around $0.4599 could act as deeper support. Holding these levels would keep the current bullish structure intact, while a rejection from the recent high could lead to a temporary pullback.
#Macro Insights#
47
登入以探索更多內容
加入幣安廣場中的全球加密貨幣用戶
⚡️ 獲取加密貨幣的最新和實用資訊。
💬 受到全球最大加密貨幣交易所的信任。
👍 發掘來自經過驗證創作者的真實見解。
電子郵件 / 電話號碼
熱門話題
Zcash现货ETF首现周度净流出9360万美元
67,466 次瀏覽
86 討論中
$ZEC
ZEC ETF突然翻車
大錘10天就曾經說ZEC要瀑布
現在是雪上加霜了
首周淨流出9360萬美元
接盤俠都TM去哪了?
ZEC這波
突然有點尷尬了
前段時間他是最靚的仔
無數ETF爭先追捧
其中最首當其衝的就是灰度ZCSH
前兩週還流入了9820萬美元
當時我發帖還調侃
說別TM很快再獲利套現
結果還真被我說中了
這次灰度整整流出9360萬美元
直接來個大反轉
目前ZEC已經跌到了大約1308美元
一週之內跌了71.5%
目前距離前高回撤已經23%左右了
爲啥前兩週大家都在搶ZEC
現在都跑路了
其實幣圈很現實
ETF是追漲的核彈
也有可能會變成跌的時候的原子彈
其實大錘在9月23號就說過
ZEC要大跌
不知道有多少夥伴記得
目前來看
ZEC日線拐頭
4小時轉空頭
短期下跌趨勢已定
之前爲什麼會判斷瀑布
因爲頂部走了末端旗形同時還是上升通道
且衝高不破
大概率要跌
最起碼要橫盤震盪
所以短期下跌是一定的
初步判定會跌到1100左右
1041是多頭最後防守位
如跌破
則破壞了多頭結構
可能就要走更大級別的震盪或回調
短期看跌
長期看漲
開單帶損
切勿扛單
#zcash现货etf首现周度净流出9360万美元
孔大锤
·1 人按讚
·25.2k 次瀏覽
希腊警方破获加密诈骗团伙拘17人
6,639 次瀏覽
60 討論中
比特币冲击8.7万美元遇阻回落
121,770 次瀏覽
232 討論中