
BlockViz
382 貼文

BlockViz
舉報
封鎖用戶
Crypto price and market data visualization and simulation website for traders and macro-focused investors. Visit: X @blockviz_xyz or https://blockviz.xyz
15 關注
34 粉絲
136 點讚數
貼文
全部
引用
·
--
查看翻譯
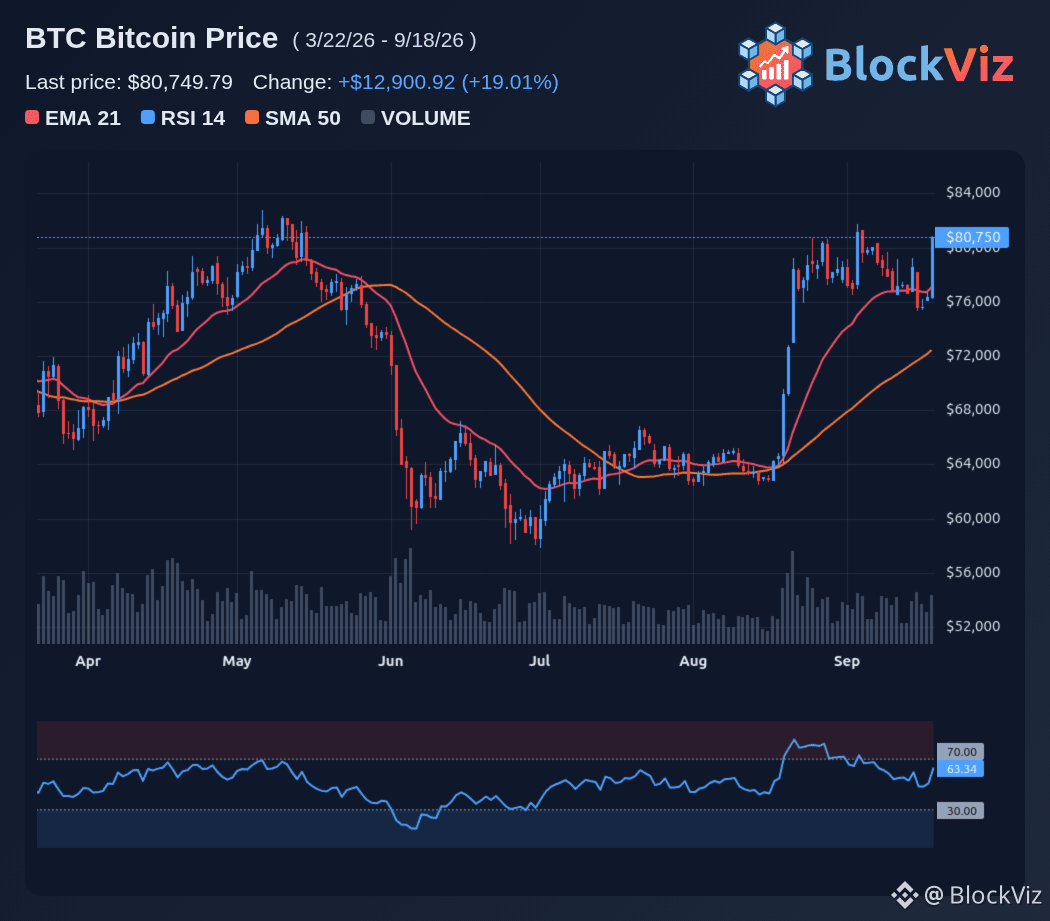
The Fed just hiked rates, but the market is fixated on a different number: 15.6 billion. That is the size of the Treasury's latest bond buyback operation, and it has traders asking whether this is stealth QE that is fueling Bitcoin's breakout toward 80,000.
The tension is real. On one side, the Fed raised the policy rate by 25 basis points to 3.75% to 4.00%, the first hike since 2023, and signaled a hawkish path with one more increase possible by year end. On the other side, the Treasury is injecting liquidity through debt buybacks, with up to 14.5 billion per week in purchases and a 15.6 billion operation hitting the market this week. That combination of tightening policy and targeted liquidity is exactly what has BTC ripping from the 76,000s back toward 77,300 to 78,000.
For traders, the question is whether this liquidity bid is enough to offset the headwinds from higher rates, ETF outflows, and the Clarity Act setback. BTC has already recovered from a July low near 58,000, gaining nearly 33% into mid-September, but it still faces heavy resistance at 78,000 and then the 365-day moving average near 82,300. A clean break above 78,000 would signal that the Treasury liquidity injection is winning, while a failure could see BTC slide back toward 74,000 to 75,000.
Watch the next Treasury buyback announcements and the Fed's balance sheet data for signs of continued liquidity support. The key levels are 78,000 on the upside and 74,000 on the downside. If the 15.6 billion operation is just the start of a larger program, BTC could test 80,000 and then 82,300. If the liquidity tap slows, the hawkish Fed path will likely dominate and push BTC back toward 70,000.
$BTC
The Fed just hiked rates, but the market is fixated on a different number: 15.6 billion. That is the size of the Treasury's latest bond buyback operation, and it has traders asking whether this is stealth QE that is fueling Bitcoin's breakout toward 80,000.
The tension is real. On one side, the Fed raised the policy rate by 25 basis points to 3.75% to 4.00%, the first hike since 2023, and signaled a hawkish path with one more increase possible by year end. On the other side, the Treasury is injecting liquidity through debt buybacks, with up to 14.5 billion per week in purchases and a 15.6 billion operation hitting the market this week. That combination of tightening policy and targeted liquidity is exactly what has BTC ripping from the 76,000s back toward 77,300 to 78,000.
For traders, the question is whether this liquidity bid is enough to offset the headwinds from higher rates, ETF outflows, and the Clarity Act setback. BTC has already recovered from a July low near 58,000, gaining nearly 33% into mid-September, but it still faces heavy resistance at 78,000 and then the 365-day moving average near 82,300. A clean break above 78,000 would signal that the Treasury liquidity injection is winning, while a failure could see BTC slide back toward 74,000 to 75,000.
Watch the next Treasury buyback announcements and the Fed's balance sheet data for signs of continued liquidity support. The key levels are 78,000 on the upside and 74,000 on the downside. If the 15.6 billion operation is just the start of a larger program, BTC could test 80,000 and then 82,300. If the liquidity tap slows, the hawkish Fed path will likely dominate and push BTC back toward 70,000.
$BTC
The tension is real. On one side, the Fed raised the policy rate by 25 basis points to 3.75% to 4.00%, the first hike since 2023, and signaled a hawkish path with one more increase possible by year end. On the other side, the Treasury is injecting liquidity through debt buybacks, with up to 14.5 billion per week in purchases and a 15.6 billion operation hitting the market this week. That combination of tightening policy and targeted liquidity is exactly what has BTC ripping from the 76,000s back toward 77,300 to 78,000.
For traders, the question is whether this liquidity bid is enough to offset the headwinds from higher rates, ETF outflows, and the Clarity Act setback. BTC has already recovered from a July low near 58,000, gaining nearly 33% into mid-September, but it still faces heavy resistance at 78,000 and then the 365-day moving average near 82,300. A clean break above 78,000 would signal that the Treasury liquidity injection is winning, while a failure could see BTC slide back toward 74,000 to 75,000.
Watch the next Treasury buyback announcements and the Fed's balance sheet data for signs of continued liquidity support. The key levels are 78,000 on the upside and 74,000 on the downside. If the 15.6 billion operation is just the start of a larger program, BTC could test 80,000 and then 82,300. If the liquidity tap slows, the hawkish Fed path will likely dominate and push BTC back toward 70,000.
$BTC
63
·
--
查看翻譯
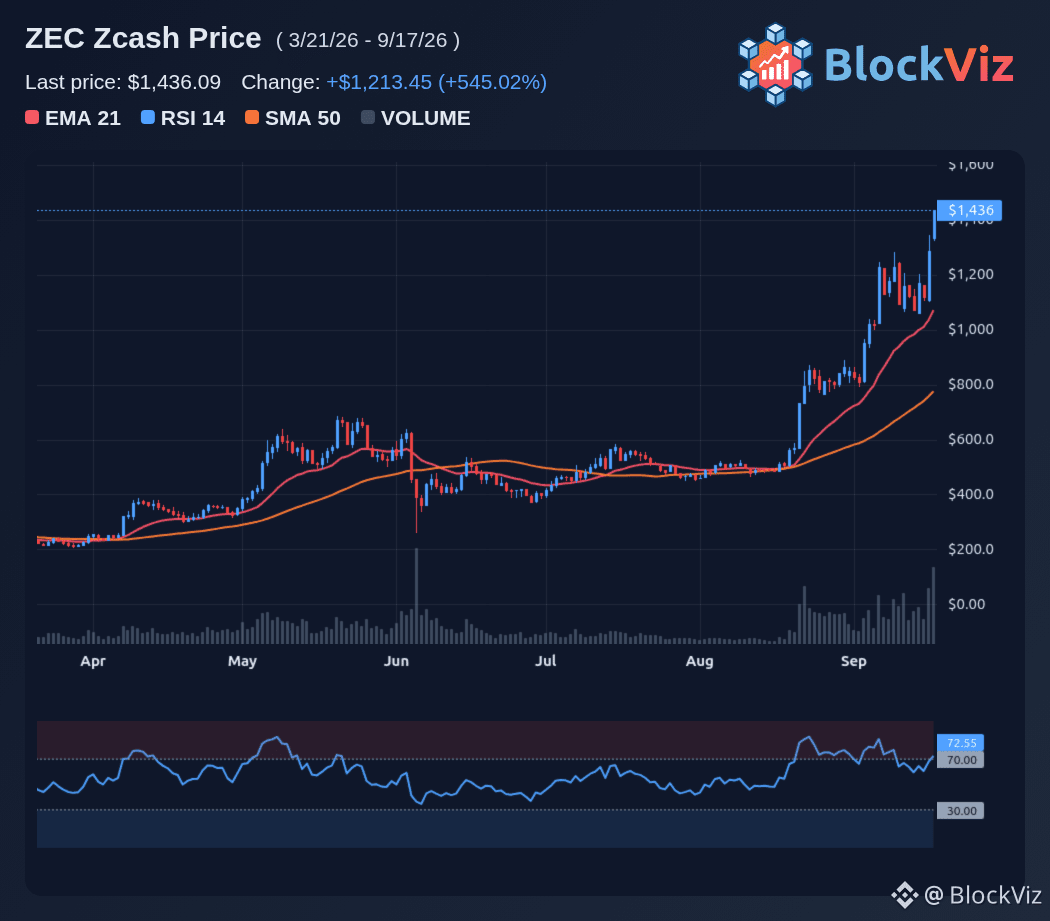
Hackers want Monero. VCs want Zcash. That split is the cleanest read on the privacy trade right now. The Revolut breach just put Monero back in the headlines with a 3 million dollar ransom demand, while Zcash is riding a wave of institutional flows, ETF access, and VC treasury positioning that has pushed ZEC toward 1,400 and extended its lead over XMR by more than 10 billion in market cap.
The tension matters because the two assets are now telling different stories. Monero is the default privacy choice for illicit actors, with every transaction hidden at the protocol level and no viewing key option. That keeps demand high in the underground economy but also keeps regulated venues away, with Kraken and other EU platforms already restricting XMR ahead of the July 2027 AMLR ban. Zcash, by contrast, offers optional shielded transactions and viewing keys that let holders disclose details to auditors or regulators, which is exactly why Grayscale could launch a US-listed product and why funds like Multicoin Capital and Cypherpunk have built large ZEC positions.
For traders, the question is whether the privacy bid rotates further into ZEC or whether Monero's illicit-use narrative and delisting pressure create a contrarian setup. ZEC has outperformed on institutional inflows, with more than 34 million in net flows reported in the first two weeks of the ZCSH product and fresh liquidity from THORChain integration and SwissBorg listing. XMR remains more sensitive to exchange delistings and regulatory headlines, but it still commands deep liquidity in OTC and non-KYC venues.
Watch ZEC around 1,400 and then 1,500 for the next leg, with a failure back below 1,200 signaling a cooling institutional bid. For XMR, monitor whether it can hold key support after the Revolut headlines fade and whether any new exchange restrictions hit before the 2027 EU deadline. The next catalysts are the THORChain vaults for both assets by early October and any further VC or corporate treasury ann...
$ZEC
Hackers want Monero. VCs want Zcash. That split is the cleanest read on the privacy trade right now. The Revolut breach just put Monero back in the headlines with a 3 million dollar ransom demand, while Zcash is riding a wave of institutional flows, ETF access, and VC treasury positioning that has pushed ZEC toward 1,400 and extended its lead over XMR by more than 10 billion in market cap.
The tension matters because the two assets are now telling different stories. Monero is the default privacy choice for illicit actors, with every transaction hidden at the protocol level and no viewing key option. That keeps demand high in the underground economy but also keeps regulated venues away, with Kraken and other EU platforms already restricting XMR ahead of the July 2027 AMLR ban. Zcash, by contrast, offers optional shielded transactions and viewing keys that let holders disclose details to auditors or regulators, which is exactly why Grayscale could launch a US-listed product and why funds like Multicoin Capital and Cypherpunk have built large ZEC positions.
For traders, the question is whether the privacy bid rotates further into ZEC or whether Monero's illicit-use narrative and delisting pressure create a contrarian setup. ZEC has outperformed on institutional inflows, with more than 34 million in net flows reported in the first two weeks of the ZCSH product and fresh liquidity from THORChain integration and SwissBorg listing. XMR remains more sensitive to exchange delistings and regulatory headlines, but it still commands deep liquidity in OTC and non-KYC venues.
Watch ZEC around 1,400 and then 1,500 for the next leg, with a failure back below 1,200 signaling a cooling institutional bid. For XMR, monitor whether it can hold key support after the Revolut headlines fade and whether any new exchange restrictions hit before the 2027 EU deadline. The next catalysts are the THORChain vaults for both assets by early October and any further VC or corporate treasury ann...
$ZEC
The tension matters because the two assets are now telling different stories. Monero is the default privacy choice for illicit actors, with every transaction hidden at the protocol level and no viewing key option. That keeps demand high in the underground economy but also keeps regulated venues away, with Kraken and other EU platforms already restricting XMR ahead of the July 2027 AMLR ban. Zcash, by contrast, offers optional shielded transactions and viewing keys that let holders disclose details to auditors or regulators, which is exactly why Grayscale could launch a US-listed product and why funds like Multicoin Capital and Cypherpunk have built large ZEC positions.
For traders, the question is whether the privacy bid rotates further into ZEC or whether Monero's illicit-use narrative and delisting pressure create a contrarian setup. ZEC has outperformed on institutional inflows, with more than 34 million in net flows reported in the first two weeks of the ZCSH product and fresh liquidity from THORChain integration and SwissBorg listing. XMR remains more sensitive to exchange delistings and regulatory headlines, but it still commands deep liquidity in OTC and non-KYC venues.
Watch ZEC around 1,400 and then 1,500 for the next leg, with a failure back below 1,200 signaling a cooling institutional bid. For XMR, monitor whether it can hold key support after the Revolut headlines fade and whether any new exchange restrictions hit before the 2027 EU deadline. The next catalysts are the THORChain vaults for both assets by early October and any further VC or corporate treasury ann...
$ZEC
70
·
--
查看翻譯
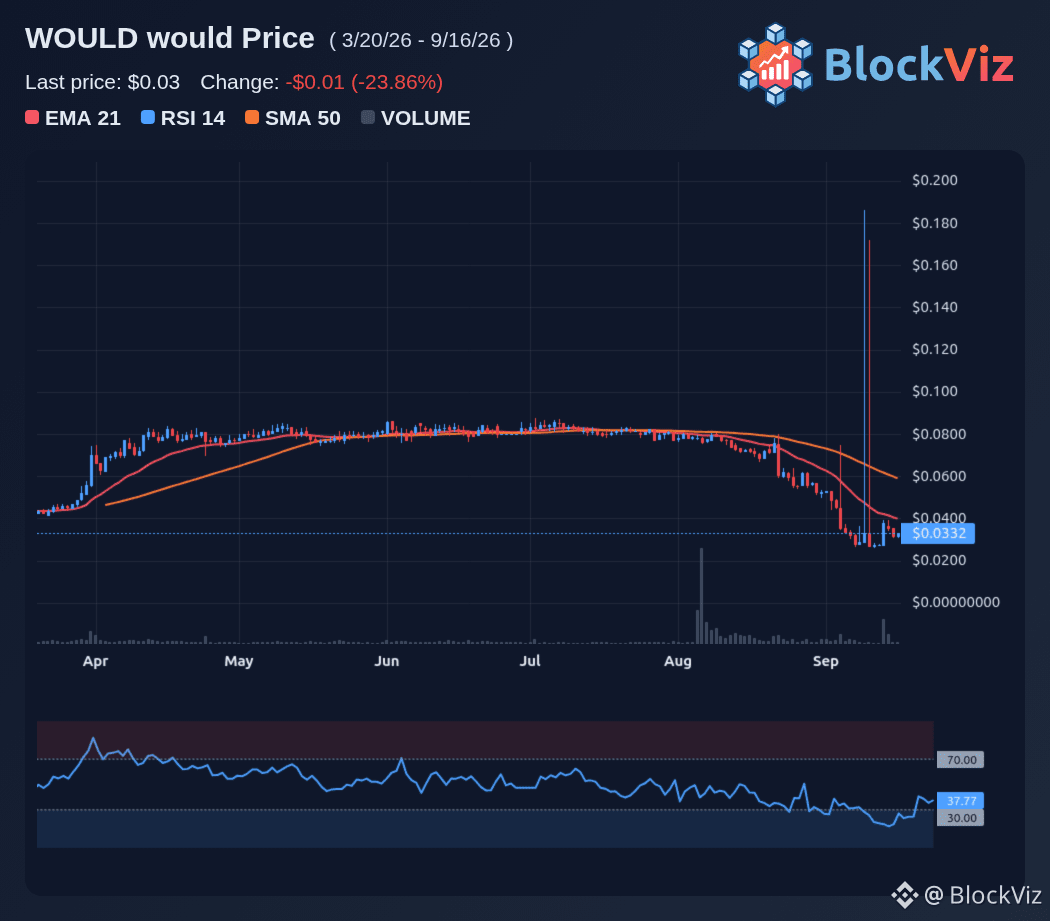
The first Fed hike in three years is now the main event, but the real risk for crypto is not the hike itself. Markets are pricing a 92% to 93% chance of a 25 basis point move to 3.75% to 4.00%, so the headline is largely expected. What can move BTC from the 75,000 to 78,000 range is a surprise hold or a dot plot and press conference tone that is more hawkish or dovish than priced in.
A surprise hold would be the bigger shock. It would force shorts to cover quickly and could push Bitcoin through 78,189, with XRP and ETH also breaking key resistance. The odds are against it, but that is exactly why a hold would hit harder than a standard hike. The more likely scenario is a hike with the market watching the dot plot for clues on whether another move is coming in October or December.
BTC is already down from the low 80,000s after the Clarity Act failed to clear the 60-vote hurdle, and it briefly dipped below 75,000 before stabilizing near 75,500 to 75,900. A hawkish dot plot or guidance could extend the move toward 74,000 and then 70,000. A neutral to dovish read could help BTC reclaim 78,000 and test 80,000 again.
Traders should watch the 2 p.m. ET decision, the dot plot projections and Warsh's press conference at 2:30 p.m. ET. The key levels are 74,000 on the downside and 78,189 on the upside. A close below 74,000 would confirm a hawkish read, while a break and hold above 78,189 would signal that the market is treating the hike as a buy-the-news event.
$WOULD
The first Fed hike in three years is now the main event, but the real risk for crypto is not the hike itself. Markets are pricing a 92% to 93% chance of a 25 basis point move to 3.75% to 4.00%, so the headline is largely expected. What can move BTC from the 75,000 to 78,000 range is a surprise hold or a dot plot and press conference tone that is more hawkish or dovish than priced in.
A surprise hold would be the bigger shock. It would force shorts to cover quickly and could push Bitcoin through 78,189, with XRP and ETH also breaking key resistance. The odds are against it, but that is exactly why a hold would hit harder than a standard hike. The more likely scenario is a hike with the market watching the dot plot for clues on whether another move is coming in October or December.
BTC is already down from the low 80,000s after the Clarity Act failed to clear the 60-vote hurdle, and it briefly dipped below 75,000 before stabilizing near 75,500 to 75,900. A hawkish dot plot or guidance could extend the move toward 74,000 and then 70,000. A neutral to dovish read could help BTC reclaim 78,000 and test 80,000 again.
Traders should watch the 2 p.m. ET decision, the dot plot projections and Warsh's press conference at 2:30 p.m. ET. The key levels are 74,000 on the downside and 78,189 on the upside. A close below 74,000 would confirm a hawkish read, while a break and hold above 78,189 would signal that the market is treating the hike as a buy-the-news event.
$WOULD
A surprise hold would be the bigger shock. It would force shorts to cover quickly and could push Bitcoin through 78,189, with XRP and ETH also breaking key resistance. The odds are against it, but that is exactly why a hold would hit harder than a standard hike. The more likely scenario is a hike with the market watching the dot plot for clues on whether another move is coming in October or December.
BTC is already down from the low 80,000s after the Clarity Act failed to clear the 60-vote hurdle, and it briefly dipped below 75,000 before stabilizing near 75,500 to 75,900. A hawkish dot plot or guidance could extend the move toward 74,000 and then 70,000. A neutral to dovish read could help BTC reclaim 78,000 and test 80,000 again.
Traders should watch the 2 p.m. ET decision, the dot plot projections and Warsh's press conference at 2:30 p.m. ET. The key levels are 74,000 on the downside and 78,189 on the upside. A close below 74,000 would confirm a hawkish read, while a break and hold above 78,189 would signal that the market is treating the hike as a buy-the-news event.
$WOULD
64
·
--
查看翻譯
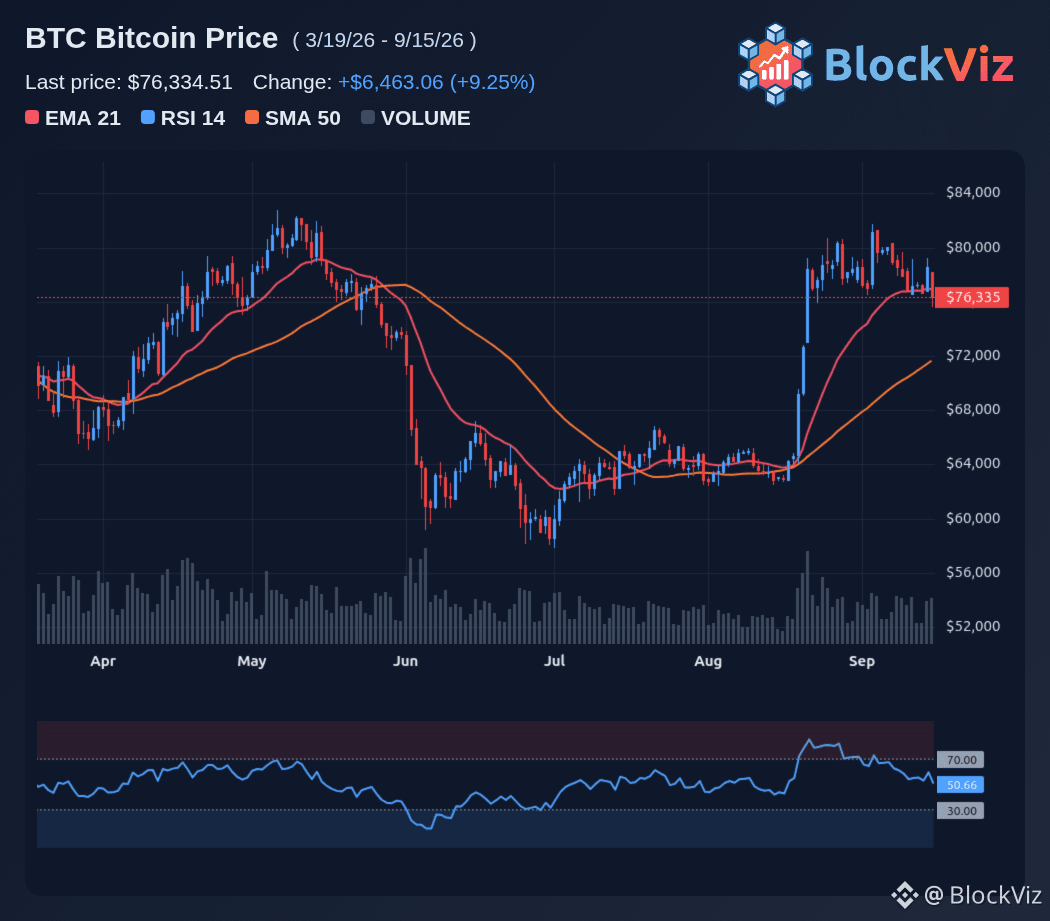
The Clarity Act just went from priced-in win to real doubt in less than 24 hours. Prediction markets saw passage odds jump from about 14% to near 30% over the weekend, then crash back toward 14% to 18% on Tuesday as Democrats pushed back on ethics provisions and banks, state attorneys general and Elizabeth Warren all voiced opposition.
The immediate test is the Senate cloture vote at 2:15 p.m. ET. This is not final passage. It is a procedural vote on whether the Senate can even start debating the bill, and it needs 60 yes votes. Republicans hold 53 seats, so at least seven Democrats must cross the aisle, with some analysts saying the real number could be closer to nine if one or two Republicans defect on procedure.
That is why BTC slid from the high 70,000s toward 76,000 and why majors turned red across the board. The market spent Monday pricing a regulatory win and then spent Tuesday morning taking that bet back off the table. If cloture clears, the bill moves to formal debate and a final vote that only needs 51 votes. If it fails, the Clarity Act is likely dead for 2026 and possibly until after the midterms.
Traders should watch the vote count, whether it lands above or below 60, and how BTC reacts around 76,000 to 78,000. A close failure in the 55 to 59 range would keep some hope for 2027. A clear miss would shift focus back to macro, with the Fed decision and liquidity conditions dominating the next move.
$BTC
The Clarity Act just went from priced-in win to real doubt in less than 24 hours. Prediction markets saw passage odds jump from about 14% to near 30% over the weekend, then crash back toward 14% to 18% on Tuesday as Democrats pushed back on ethics provisions and banks, state attorneys general and Elizabeth Warren all voiced opposition.
The immediate test is the Senate cloture vote at 2:15 p.m. ET. This is not final passage. It is a procedural vote on whether the Senate can even start debating the bill, and it needs 60 yes votes. Republicans hold 53 seats, so at least seven Democrats must cross the aisle, with some analysts saying the real number could be closer to nine if one or two Republicans defect on procedure.
That is why BTC slid from the high 70,000s toward 76,000 and why majors turned red across the board. The market spent Monday pricing a regulatory win and then spent Tuesday morning taking that bet back off the table. If cloture clears, the bill moves to formal debate and a final vote that only needs 51 votes. If it fails, the Clarity Act is likely dead for 2026 and possibly until after the midterms.
Traders should watch the vote count, whether it lands above or below 60, and how BTC reacts around 76,000 to 78,000. A close failure in the 55 to 59 range would keep some hope for 2027. A clear miss would shift focus back to macro, with the Fed decision and liquidity conditions dominating the next move.
$BTC
The immediate test is the Senate cloture vote at 2:15 p.m. ET. This is not final passage. It is a procedural vote on whether the Senate can even start debating the bill, and it needs 60 yes votes. Republicans hold 53 seats, so at least seven Democrats must cross the aisle, with some analysts saying the real number could be closer to nine if one or two Republicans defect on procedure.
That is why BTC slid from the high 70,000s toward 76,000 and why majors turned red across the board. The market spent Monday pricing a regulatory win and then spent Tuesday morning taking that bet back off the table. If cloture clears, the bill moves to formal debate and a final vote that only needs 51 votes. If it fails, the Clarity Act is likely dead for 2026 and possibly until after the midterms.
Traders should watch the vote count, whether it lands above or below 60, and how BTC reacts around 76,000 to 78,000. A close failure in the 55 to 59 range would keep some hope for 2027. A clear miss would shift focus back to macro, with the Fed decision and liquidity conditions dominating the next move.
$BTC
56
·
--
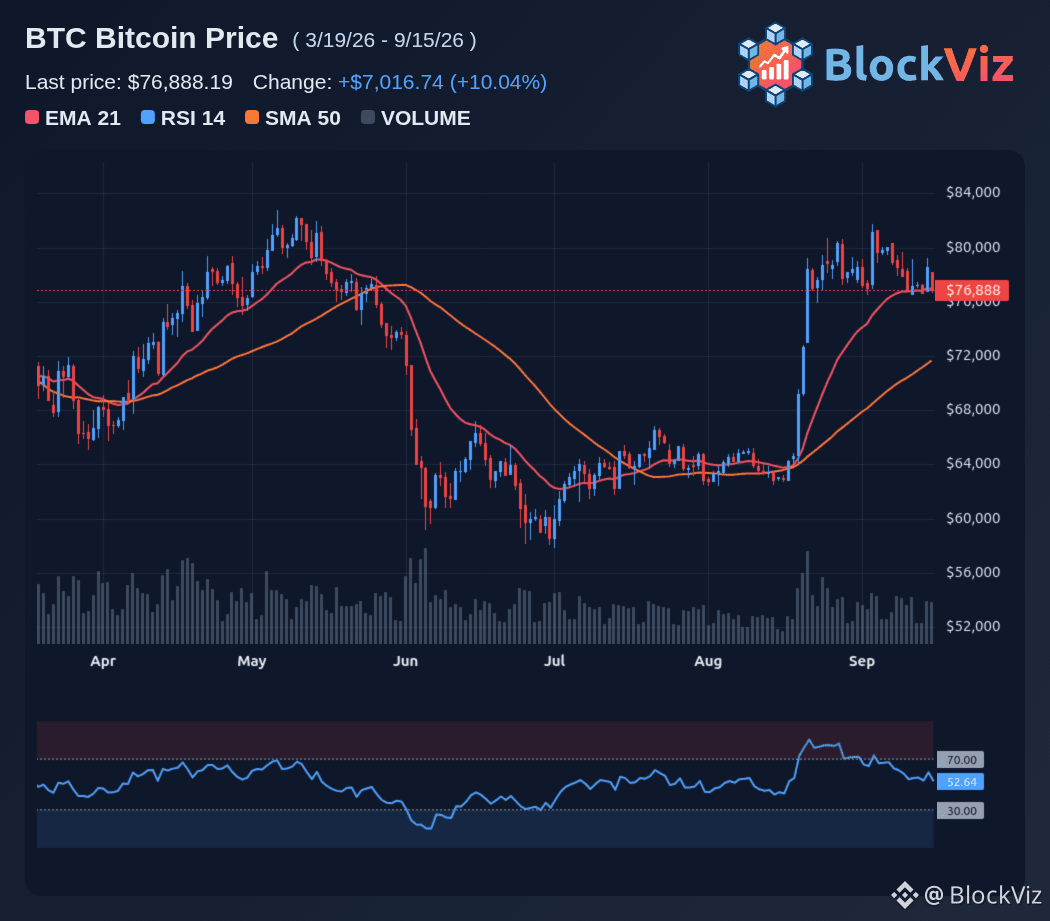
本週,兩則截然不同的敘事正在碰撞。在政策層面,特朗普在倫理問題上的讓步將《清晰法案》(Clarity Act)的通過概率推升至約32%至34%,從而爲一場關鍵的參議院投票鋪平道路。在資金流層面,貝萊德(BlackRock)的ETH相關產品目前已連續20個交易日淨流入,其中ETHA和支持質押的ETHB持續吸引數億美元資金,而比特幣ETF在連續四個交易時段裏淨流出約463 million,隨後出現部分反彈。
正因爲這種背離,人們纔在問:華爾街是否在悄然向ETH傾斜。以太坊ETF上週吸金約1.97億美元,隨後週一又追加2.81億美元,貝萊德提供了最大的份額。相比之下,比特幣ETF剛剛結束其在2026年最好的連續三週資金流入紀錄:當週淨流出達到4.627億美元;儘管如此,IBIT仍在9月14日實現了1.6億美元的資金淨流入。
宏觀因素也很關鍵。市場正在爲9月16日發生25個基點的美聯儲加息定價,這將收緊流動性,並在《清晰法案》希望提振市場情緒的同時增強美元。比特幣多次在82,000附近遭到回絕,目前徘徊在7萬後半段;而以太坊在決議臨近時展現了更強的相對韌性。
交易員應重點關注週二的閉幕(cloture)結果、週三的美聯儲決議,以及比特幣能否重新站上80,000至82,000,同時以太坊能否維持在2,500上方。若《清晰法案》向前推進且美聯儲按兵不動,那麼BTC與ETH都有可能獲得更高的估值重定價。若《清晰法案》受阻且美聯儲加息,宏觀逆風可能佔據主導;而ETH與BTC之間的資金流背離,將是機構是否真的在輪動,還是僅在戰術層面進行倉位調整的關鍵信號。
$BTC
本週,兩則截然不同的敘事正在碰撞。在政策層面,特朗普在倫理問題上的讓步將《清晰法案》(Clarity Act)的通過概率推升至約32%至34%,從而爲一場關鍵的參議院投票鋪平道路。在資金流層面,貝萊德(BlackRock)的ETH相關產品目前已連續20個交易日淨流入,其中ETHA和支持質押的ETHB持續吸引數億美元資金,而比特幣ETF在連續四個交易時段裏淨流出約463 million,隨後出現部分反彈。
正因爲這種背離,人們纔在問:華爾街是否在悄然向ETH傾斜。以太坊ETF上週吸金約1.97億美元,隨後週一又追加2.81億美元,貝萊德提供了最大的份額。相比之下,比特幣ETF剛剛結束其在2026年最好的連續三週資金流入紀錄:當週淨流出達到4.627億美元;儘管如此,IBIT仍在9月14日實現了1.6億美元的資金淨流入。
宏觀因素也很關鍵。市場正在爲9月16日發生25個基點的美聯儲加息定價,這將收緊流動性,並在《清晰法案》希望提振市場情緒的同時增強美元。比特幣多次在82,000附近遭到回絕,目前徘徊在7萬後半段;而以太坊在決議臨近時展現了更強的相對韌性。
交易員應重點關注週二的閉幕(cloture)結果、週三的美聯儲決議,以及比特幣能否重新站上80,000至82,000,同時以太坊能否維持在2,500上方。若《清晰法案》向前推進且美聯儲按兵不動,那麼BTC與ETH都有可能獲得更高的估值重定價。若《清晰法案》受阻且美聯儲加息,宏觀逆風可能佔據主導;而ETH與BTC之間的資金流背離,將是機構是否真的在輪動,還是僅在戰術層面進行倉位調整的關鍵信號。
$BTC
正因爲這種背離,人們纔在問:華爾街是否在悄然向ETH傾斜。以太坊ETF上週吸金約1.97億美元,隨後週一又追加2.81億美元,貝萊德提供了最大的份額。相比之下,比特幣ETF剛剛結束其在2026年最好的連續三週資金流入紀錄:當週淨流出達到4.627億美元;儘管如此,IBIT仍在9月14日實現了1.6億美元的資金淨流入。
宏觀因素也很關鍵。市場正在爲9月16日發生25個基點的美聯儲加息定價,這將收緊流動性,並在《清晰法案》希望提振市場情緒的同時增強美元。比特幣多次在82,000附近遭到回絕,目前徘徊在7萬後半段;而以太坊在決議臨近時展現了更強的相對韌性。
交易員應重點關注週二的閉幕(cloture)結果、週三的美聯儲決議,以及比特幣能否重新站上80,000至82,000,同時以太坊能否維持在2,500上方。若《清晰法案》向前推進且美聯儲按兵不動,那麼BTC與ETH都有可能獲得更高的估值重定價。若《清晰法案》受阻且美聯儲加息,宏觀逆風可能佔據主導;而ETH與BTC之間的資金流背離,將是機構是否真的在輪動,還是僅在戰術層面進行倉位調整的關鍵信號。
$BTC
51
·
--
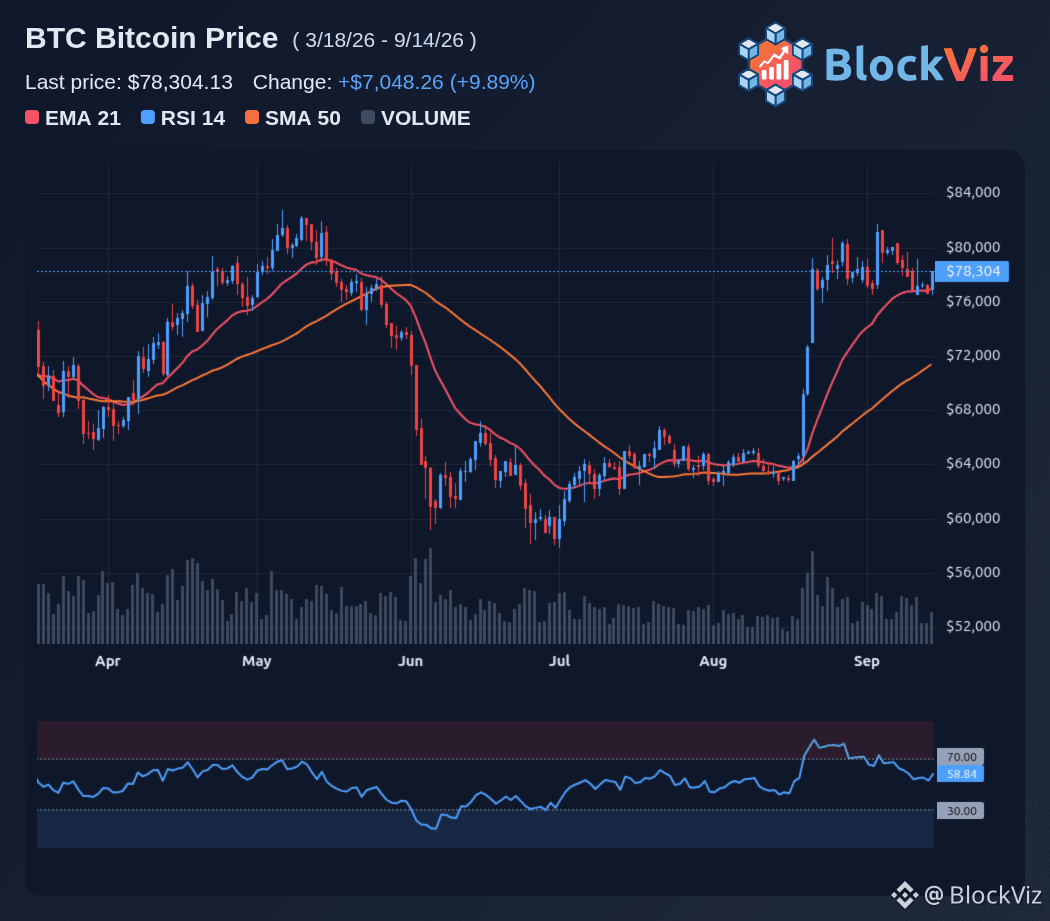
《清晰法案》剛剛在數月內獲得了最強的政治順風,但美聯儲仍是更大的“錘子”。特朗普在道德條款上的讓步,已將該法案成爲法律的可能性推升至預測市場約32%,高於上週低十幾個百分點。週二計劃進行終止辯論(cloture)表決,提案方表示他們預計將跨過推進辯論所需的60票門檻。
這就是對加密貨幣的看漲情景。如果《清晰法案》獲得通過,它將建立首個明確的美國數字資產監管框架,將監管職責在美國證券交易委員會(SEC)和美國商品期貨交易委員會(CFTC)之間拆分,並可能釋放更多機構參與。伯恩斯坦指出,任何正面意外都尚未被計入定價:比特幣徘徊在77,700至80,000附近,而XRP因該消息上漲約4%。
問題在於時間安排。美聯儲將在9月16日開會,該日期距參議院投票僅一天;市場預計美聯儲以較高概率將加息25個基點。加息將收緊流動性、強化美元,並在《清晰法案》試圖提振市場情緒之際對風險資產施壓。比特幣此前已多次在82,000附近遭到回絕,而若《清晰法案》未通過或令市場失望,偏鷹派的美聯儲可能會將其推回至77,300,隨後再到75,500。
交易者應關注週二的終止辯論結果、週三的美聯儲決議,以及在美聯儲發聲之前BTC能否收盤站上82,283。若《清晰法案》推進且美聯儲暫停或釋放鴿派路徑信號,80,000至82,000或將從阻力位轉爲支撐位。若《清晰法案》擱淺且美聯儲加息,宏觀逆風可能會壓過一切監管層面的進展。
$BTC
《清晰法案》剛剛在數月內獲得了最強的政治順風,但美聯儲仍是更大的“錘子”。特朗普在道德條款上的讓步,已將該法案成爲法律的可能性推升至預測市場約32%,高於上週低十幾個百分點。週二計劃進行終止辯論(cloture)表決,提案方表示他們預計將跨過推進辯論所需的60票門檻。
這就是對加密貨幣的看漲情景。如果《清晰法案》獲得通過,它將建立首個明確的美國數字資產監管框架,將監管職責在美國證券交易委員會(SEC)和美國商品期貨交易委員會(CFTC)之間拆分,並可能釋放更多機構參與。伯恩斯坦指出,任何正面意外都尚未被計入定價:比特幣徘徊在77,700至80,000附近,而XRP因該消息上漲約4%。
問題在於時間安排。美聯儲將在9月16日開會,該日期距參議院投票僅一天;市場預計美聯儲以較高概率將加息25個基點。加息將收緊流動性、強化美元,並在《清晰法案》試圖提振市場情緒之際對風險資產施壓。比特幣此前已多次在82,000附近遭到回絕,而若《清晰法案》未通過或令市場失望,偏鷹派的美聯儲可能會將其推回至77,300,隨後再到75,500。
交易者應關注週二的終止辯論結果、週三的美聯儲決議,以及在美聯儲發聲之前BTC能否收盤站上82,283。若《清晰法案》推進且美聯儲暫停或釋放鴿派路徑信號,80,000至82,000或將從阻力位轉爲支撐位。若《清晰法案》擱淺且美聯儲加息,宏觀逆風可能會壓過一切監管層面的進展。
$BTC
這就是對加密貨幣的看漲情景。如果《清晰法案》獲得通過,它將建立首個明確的美國數字資產監管框架,將監管職責在美國證券交易委員會(SEC)和美國商品期貨交易委員會(CFTC)之間拆分,並可能釋放更多機構參與。伯恩斯坦指出,任何正面意外都尚未被計入定價:比特幣徘徊在77,700至80,000附近,而XRP因該消息上漲約4%。
問題在於時間安排。美聯儲將在9月16日開會,該日期距參議院投票僅一天;市場預計美聯儲以較高概率將加息25個基點。加息將收緊流動性、強化美元,並在《清晰法案》試圖提振市場情緒之際對風險資產施壓。比特幣此前已多次在82,000附近遭到回絕,而若《清晰法案》未通過或令市場失望,偏鷹派的美聯儲可能會將其推回至77,300,隨後再到75,500。
交易者應關注週二的終止辯論結果、週三的美聯儲決議,以及在美聯儲發聲之前BTC能否收盤站上82,283。若《清晰法案》推進且美聯儲暫停或釋放鴿派路徑信號,80,000至82,000或將從阻力位轉爲支撐位。若《清晰法案》擱淺且美聯儲加息,宏觀逆風可能會壓過一切監管層面的進展。
$BTC
69
·
--
查看翻譯
Hunter Biden is turning political meme warfare into an on-chain experiment. LAPTOP, a 1 billion supply memecoin launching on Base on September 9, is allocating 20% of its tokens to airdrops that include wallets that lost money on TRUMP, plus subscribers to his Substack and Andrew Callaghan's Channel 5 list.
The angle is obvious: target the underwater TRUMP bagholders and frame LAPTOP as the coin funded by the other side's losses. About 20 million LAPTOP is reportedly reserved for TRUMP-loss recipients, distributed through participating exchanges, while the rest of the airdrop goes to early subscribers. Founders hold 30% locked for six months, with additional event-based burns tied to political and market milestones.
The degen vote will likely split along lines rather than logic. TRUMP holders who are deep in loss now have a potential recovery narrative, but they are being asked to engage with a token explicitly designed to mock their position. Biden and crypto-native degens may see it as a clever distribution mechanism, but the overlap between Substack subscribers and active memecoin traders is not guaranteed.
Traders should watch the launch liquidity, whether the airdrop creates immediate sell pressure, and how TRUMP itself reacts as the snapshot and claim window approach. If LAPTOP opens strong and holds, it could pull attention and volume toward Base memecoins. If it fades quickly, this may be remembered as a political stunt rather than a lasting shift in where the degen flow goes.
$ETH
Hunter Biden is turning political meme warfare into an on-chain experiment. LAPTOP, a 1 billion supply memecoin launching on Base on September 9, is allocating 20% of its tokens to airdrops that include wallets that lost money on TRUMP, plus subscribers to his Substack and Andrew Callaghan's Channel 5 list.
The angle is obvious: target the underwater TRUMP bagholders and frame LAPTOP as the coin funded by the other side's losses. About 20 million LAPTOP is reportedly reserved for TRUMP-loss recipients, distributed through participating exchanges, while the rest of the airdrop goes to early subscribers. Founders hold 30% locked for six months, with additional event-based burns tied to political and market milestones.
The degen vote will likely split along lines rather than logic. TRUMP holders who are deep in loss now have a potential recovery narrative, but they are being asked to engage with a token explicitly designed to mock their position. Biden and crypto-native degens may see it as a clever distribution mechanism, but the overlap between Substack subscribers and active memecoin traders is not guaranteed.
Traders should watch the launch liquidity, whether the airdrop creates immediate sell pressure, and how TRUMP itself reacts as the snapshot and claim window approach. If LAPTOP opens strong and holds, it could pull attention and volume toward Base memecoins. If it fades quickly, this may be remembered as a political stunt rather than a lasting shift in where the degen flow goes.
$ETH
The angle is obvious: target the underwater TRUMP bagholders and frame LAPTOP as the coin funded by the other side's losses. About 20 million LAPTOP is reportedly reserved for TRUMP-loss recipients, distributed through participating exchanges, while the rest of the airdrop goes to early subscribers. Founders hold 30% locked for six months, with additional event-based burns tied to political and market milestones.
The degen vote will likely split along lines rather than logic. TRUMP holders who are deep in loss now have a potential recovery narrative, but they are being asked to engage with a token explicitly designed to mock their position. Biden and crypto-native degens may see it as a clever distribution mechanism, but the overlap between Substack subscribers and active memecoin traders is not guaranteed.
Traders should watch the launch liquidity, whether the airdrop creates immediate sell pressure, and how TRUMP itself reacts as the snapshot and claim window approach. If LAPTOP opens strong and holds, it could pull attention and volume toward Base memecoins. If it fades quickly, this may be remembered as a political stunt rather than a lasting shift in where the degen flow goes.
$ETH

51
·
--
刺激性講話回來了,市場立刻在問:這能否再現2020年的比特幣行情。這一次,局面不同。2020年,新一輪財政和貨幣刺激涌入市場,當時BTC仍定價在約10,000美元左右,而且未來還擁有數年的採用空間。如今,BTC在8月強勢表現之後,在80,000到82,000附近進行整固,但其市值更大、機構持有比例也更高。
看漲的論點是:任何新的1萬億美元刺激計劃都會削弱美元、擡升通脹預期,並推動投資者回到硬資產。BTC過去90天與黃金的相關性剛剛創下六年新高,升至0.5以上,這與2020年的刺激時代相呼應。若流動性再次擴張,“貨幣貶值交易”可能讓漲勢延續至90,000甚至100,000。
看跌的情形則是:僅靠刺激可能還不夠。利率預期、美債收益率以及美元仍然很關鍵,而BTC也不再是2020年那種小盤、高貝塔的資產。若只有刺激標題、卻沒有後續落地,可能引發“利好出盡賣消息”的反應,尤其是在價格未能幹淨地突破82,000到84,000時。
交易者應關注BTC能否將80,000守住作爲支撐;刺激是否能推動新的ETF資金流入,以及美元走弱;同時黃金與BTC是否繼續同步運行。如果刺激帶來持續的流動性擴張,100K將再次被提上日程。若行情在阻力位附近回落,這可能又是一次宏觀層面的“假信號”,而非類似2020年的重新定價。
$BTC
刺激性講話回來了,市場立刻在問:這能否再現2020年的比特幣行情。這一次,局面不同。2020年,新一輪財政和貨幣刺激涌入市場,當時BTC仍定價在約10,000美元左右,而且未來還擁有數年的採用空間。如今,BTC在8月強勢表現之後,在80,000到82,000附近進行整固,但其市值更大、機構持有比例也更高。
看漲的論點是:任何新的1萬億美元刺激計劃都會削弱美元、擡升通脹預期,並推動投資者回到硬資產。BTC過去90天與黃金的相關性剛剛創下六年新高,升至0.5以上,這與2020年的刺激時代相呼應。若流動性再次擴張,“貨幣貶值交易”可能讓漲勢延續至90,000甚至100,000。
看跌的情形則是:僅靠刺激可能還不夠。利率預期、美債收益率以及美元仍然很關鍵,而BTC也不再是2020年那種小盤、高貝塔的資產。若只有刺激標題、卻沒有後續落地,可能引發“利好出盡賣消息”的反應,尤其是在價格未能幹淨地突破82,000到84,000時。
交易者應關注BTC能否將80,000守住作爲支撐;刺激是否能推動新的ETF資金流入,以及美元走弱;同時黃金與BTC是否繼續同步運行。如果刺激帶來持續的流動性擴張,100K將再次被提上日程。若行情在阻力位附近回落,這可能又是一次宏觀層面的“假信號”,而非類似2020年的重新定價。
$BTC
看漲的論點是:任何新的1萬億美元刺激計劃都會削弱美元、擡升通脹預期,並推動投資者回到硬資產。BTC過去90天與黃金的相關性剛剛創下六年新高,升至0.5以上,這與2020年的刺激時代相呼應。若流動性再次擴張,“貨幣貶值交易”可能讓漲勢延續至90,000甚至100,000。
看跌的情形則是:僅靠刺激可能還不夠。利率預期、美債收益率以及美元仍然很關鍵,而BTC也不再是2020年那種小盤、高貝塔的資產。若只有刺激標題、卻沒有後續落地,可能引發“利好出盡賣消息”的反應,尤其是在價格未能幹淨地突破82,000到84,000時。
交易者應關注BTC能否將80,000守住作爲支撐;刺激是否能推動新的ETF資金流入,以及美元走弱;同時黃金與BTC是否繼續同步運行。如果刺激帶來持續的流動性擴張,100K將再次被提上日程。若行情在阻力位附近回落,這可能又是一次宏觀層面的“假信號”,而非類似2020年的重新定價。
$BTC

67
·
--
ZEC 和 XRP 纔是真正出現突破的那兩個,但更大的問題是:這是孤立的強勢,還是 altseason(山寨季)的首次真正推動。
ZEC 一直是明確的領跑者,過去 24 小時上漲超過 16%,並對 960 到 1,000 美元區間發起衝擊。若出現日線收盤站上 1,000,將爲測試 1,200 打開空間;支撐則大約在 935 附近。XRP 本週上漲約 10%,從 1.31 區間突破至接近 1.48 的高點,目前正在 1.45 附近整固。若能順利突破 1.48,將使 1.50 以及隨後 1.66 再次進入視野。
關鍵在於背景。比特幣也在 80,000 上方走強,而 BTC 的主導率仍接近 57% 到 58%。經典的 altseason 通常需要 BTC 停滯,同時主導率向 55% 或更低迴落,從而讓資金更積極地輪動到山寨幣。就目前來看,這更像是 ZEC 和 XRP 的選擇性突破,而不是全面交接。
要確認 altseason,交易者應關注:如果 BTC 回調,ZEC 和 XRP 的漲幅能否守住;BTC 的主導率是否開始下跌;以及市場廣度是否改善,不能只侷限於隱私幣與大市值龍頭。若在 BTC 震盪整固的同時山寨幣持續跑贏,輪動邏輯會更強。如果隨着下一次 BTC 下跌這一走勢消退,那麼更可能只是戰術性動作,而非行情制度的切換。
$XRP
ZEC 和 XRP 纔是真正出現突破的那兩個,但更大的問題是:這是孤立的強勢,還是 altseason(山寨季)的首次真正推動。
ZEC 一直是明確的領跑者,過去 24 小時上漲超過 16%,並對 960 到 1,000 美元區間發起衝擊。若出現日線收盤站上 1,000,將爲測試 1,200 打開空間;支撐則大約在 935 附近。XRP 本週上漲約 10%,從 1.31 區間突破至接近 1.48 的高點,目前正在 1.45 附近整固。若能順利突破 1.48,將使 1.50 以及隨後 1.66 再次進入視野。
關鍵在於背景。比特幣也在 80,000 上方走強,而 BTC 的主導率仍接近 57% 到 58%。經典的 altseason 通常需要 BTC 停滯,同時主導率向 55% 或更低迴落,從而讓資金更積極地輪動到山寨幣。就目前來看,這更像是 ZEC 和 XRP 的選擇性突破,而不是全面交接。
要確認 altseason,交易者應關注:如果 BTC 回調,ZEC 和 XRP 的漲幅能否守住;BTC 的主導率是否開始下跌;以及市場廣度是否改善,不能只侷限於隱私幣與大市值龍頭。若在 BTC 震盪整固的同時山寨幣持續跑贏,輪動邏輯會更強。如果隨着下一次 BTC 下跌這一走勢消退,那麼更可能只是戰術性動作,而非行情制度的切換。
$XRP
ZEC 一直是明確的領跑者,過去 24 小時上漲超過 16%,並對 960 到 1,000 美元區間發起衝擊。若出現日線收盤站上 1,000,將爲測試 1,200 打開空間;支撐則大約在 935 附近。XRP 本週上漲約 10%,從 1.31 區間突破至接近 1.48 的高點,目前正在 1.45 附近整固。若能順利突破 1.48,將使 1.50 以及隨後 1.66 再次進入視野。
關鍵在於背景。比特幣也在 80,000 上方走強,而 BTC 的主導率仍接近 57% 到 58%。經典的 altseason 通常需要 BTC 停滯,同時主導率向 55% 或更低迴落,從而讓資金更積極地輪動到山寨幣。就目前來看,這更像是 ZEC 和 XRP 的選擇性突破,而不是全面交接。
要確認 altseason,交易者應關注:如果 BTC 回調,ZEC 和 XRP 的漲幅能否守住;BTC 的主導率是否開始下跌;以及市場廣度是否改善,不能只侷限於隱私幣與大市值龍頭。若在 BTC 震盪整固的同時山寨幣持續跑贏,輪動邏輯會更強。如果隨着下一次 BTC 下跌這一走勢消退,那麼更可能只是戰術性動作,而非行情制度的切換。
$XRP

49
·
--
亨特·拜登正把政治梗(meme)戰爭轉化爲一次鏈上實驗。名爲 LAPTOP 的、供應量 10 億枚的 memecoin 將於 9 月 9 日在 Base 上線,計劃把 20% 的代幣用於空投,其中包括曾在 TRUMP 上虧錢的錢包,以及他 Substack 的訂閱者和 Andrew Callaghan 的 Channel 5 名單。
重點很明顯:瞄準“深水”持有 TRUMP 且被套牢的用戶,並把 LAPTOP 打造成由對手一方的損失“資助”的幣。據稱,大約 2000 萬枚 LAPTOP 預留給 TRUMP 虧損接收者,需通過參與的交易所進行分發;其餘空投則發給早期訂閱者。創始團隊持有 30%,鎖定六個月,並且還會根據政治與市場的里程碑觸發額外的事件型銷燬。
這場“瘋子投票”很可能會按陣營而非邏輯來分裂。如今深度虧損的 TRUMP 持有者擁有潛在的反彈敘事,但他們被要求去參與一種專門用來嘲諷其立場的代幣。拜登以及加密原生的瘋子們可能會把它視爲巧妙的分發機制,但 Substack 訂閱者與活躍 memecoin 交易者之間的重疊並不被保證。
交易者應關注上線時的流動性:空投是否會造成立刻的拋壓,以及隨着快照與申領窗口臨近,TRUMP 本身會如何反應。如果 LAPTOP 開盤強勁並能穩住,可能會把關注度和交易量拉向 Base 上的 memecoin。若其很快走弱,這也許會被人們記作一場政治噱頭,而不是去改變“瘋子資金”流向的持久轉折。
亨特·拜登正把政治梗(meme)戰爭轉化爲一次鏈上實驗。名爲 LAPTOP 的、供應量 10 億枚的 memecoin 將於 9 月 9 日在 Base 上線,計劃把 20% 的代幣用於空投,其中包括曾在 TRUMP 上虧錢的錢包,以及他 Substack 的訂閱者和 Andrew Callaghan 的 Channel 5 名單。
重點很明顯:瞄準“深水”持有 TRUMP 且被套牢的用戶,並把 LAPTOP 打造成由對手一方的損失“資助”的幣。據稱,大約 2000 萬枚 LAPTOP 預留給 TRUMP 虧損接收者,需通過參與的交易所進行分發;其餘空投則發給早期訂閱者。創始團隊持有 30%,鎖定六個月,並且還會根據政治與市場的里程碑觸發額外的事件型銷燬。
這場“瘋子投票”很可能會按陣營而非邏輯來分裂。如今深度虧損的 TRUMP 持有者擁有潛在的反彈敘事,但他們被要求去參與一種專門用來嘲諷其立場的代幣。拜登以及加密原生的瘋子們可能會把它視爲巧妙的分發機制,但 Substack 訂閱者與活躍 memecoin 交易者之間的重疊並不被保證。
交易者應關注上線時的流動性:空投是否會造成立刻的拋壓,以及隨着快照與申領窗口臨近,TRUMP 本身會如何反應。如果 LAPTOP 開盤強勁並能穩住,可能會把關注度和交易量拉向 Base 上的 memecoin。若其很快走弱,這也許會被人們記作一場政治噱頭,而不是去改變“瘋子資金”流向的持久轉折。
重點很明顯:瞄準“深水”持有 TRUMP 且被套牢的用戶,並把 LAPTOP 打造成由對手一方的損失“資助”的幣。據稱,大約 2000 萬枚 LAPTOP 預留給 TRUMP 虧損接收者,需通過參與的交易所進行分發;其餘空投則發給早期訂閱者。創始團隊持有 30%,鎖定六個月,並且還會根據政治與市場的里程碑觸發額外的事件型銷燬。
這場“瘋子投票”很可能會按陣營而非邏輯來分裂。如今深度虧損的 TRUMP 持有者擁有潛在的反彈敘事,但他們被要求去參與一種專門用來嘲諷其立場的代幣。拜登以及加密原生的瘋子們可能會把它視爲巧妙的分發機制,但 Substack 訂閱者與活躍 memecoin 交易者之間的重疊並不被保證。
交易者應關注上線時的流動性:空投是否會造成立刻的拋壓,以及隨着快照與申領窗口臨近,TRUMP 本身會如何反應。如果 LAPTOP 開盤強勁並能穩住,可能會把關注度和交易量拉向 Base 上的 memecoin。若其很快走弱,這也許會被人們記作一場政治噱頭,而不是去改變“瘋子資金”流向的持久轉折。

56
·
--
比特幣正試探其最受關注的技術信號之一,而其背後的歷史幾乎無法忽視。50日移動均線正在逼近200日均線,爲潛在的“金叉”做準備——這種金叉在過去僅有少數幾次帶來了大幅上漲。在2012年、2015年和2020年,這一形態都曾在隨後一年之前預示了超過300%的漲幅。
這並不意味着10萬美元是必然的。BTC目前在8月強勁上行之後,正在75,000到82,000之間盤整,但要重新打開通往98,000和100,000的路徑,它仍需要在81,500到84,400這一供應區上方出現果斷突破。“金叉”本身屬於滯後信號,因此價格走勢必須予以確認。
如果BTC能夠守住80,000之上、完成金叉、同時在宏觀壓力緩解的情況下吸引新的ETF資金流入,多頭情形會更有利。空頭風險則是未能突破82,000到84,400,隨後回落至75,000下方,並測試200日均線附近約72,500的位置。
交易者應關注50日與200日的匯聚情況,日線收盤站上84,400作爲突破確認,以及75,000到76,800的支撐能否守住。如果金叉伴隨強勁成交量與機構資金流動,10萬美元就將從“敘事”變爲更現實的目標。若價格在阻力位遭遇強力回絕,這一信號可能會再次證明只是一次“假啓動”。
$BTC
比特幣正試探其最受關注的技術信號之一,而其背後的歷史幾乎無法忽視。50日移動均線正在逼近200日均線,爲潛在的“金叉”做準備——這種金叉在過去僅有少數幾次帶來了大幅上漲。在2012年、2015年和2020年,這一形態都曾在隨後一年之前預示了超過300%的漲幅。
這並不意味着10萬美元是必然的。BTC目前在8月強勁上行之後,正在75,000到82,000之間盤整,但要重新打開通往98,000和100,000的路徑,它仍需要在81,500到84,400這一供應區上方出現果斷突破。“金叉”本身屬於滯後信號,因此價格走勢必須予以確認。
如果BTC能夠守住80,000之上、完成金叉、同時在宏觀壓力緩解的情況下吸引新的ETF資金流入,多頭情形會更有利。空頭風險則是未能突破82,000到84,400,隨後回落至75,000下方,並測試200日均線附近約72,500的位置。
交易者應關注50日與200日的匯聚情況,日線收盤站上84,400作爲突破確認,以及75,000到76,800的支撐能否守住。如果金叉伴隨強勁成交量與機構資金流動,10萬美元就將從“敘事”變爲更現實的目標。若價格在阻力位遭遇強力回絕,這一信號可能會再次證明只是一次“假啓動”。
$BTC
這並不意味着10萬美元是必然的。BTC目前在8月強勁上行之後,正在75,000到82,000之間盤整,但要重新打開通往98,000和100,000的路徑,它仍需要在81,500到84,400這一供應區上方出現果斷突破。“金叉”本身屬於滯後信號,因此價格走勢必須予以確認。
如果BTC能夠守住80,000之上、完成金叉、同時在宏觀壓力緩解的情況下吸引新的ETF資金流入,多頭情形會更有利。空頭風險則是未能突破82,000到84,400,隨後回落至75,000下方,並測試200日均線附近約72,500的位置。
交易者應關注50日與200日的匯聚情況,日線收盤站上84,400作爲突破確認,以及75,000到76,800的支撐能否守住。如果金叉伴隨強勁成交量與機構資金流動,10萬美元就將從“敘事”變爲更現實的目標。若價格在阻力位遭遇強力回絕,這一信號可能會再次證明只是一次“假啓動”。
$BTC

66
·
--
查看翻譯
Dogecoin finished August 2026 at +19%. If you held only the best days, the return jumps to +53.0%, while missing them drops it to -22.0%.
That tells you the month was driven by a handful of outsized sessions rather than smooth trend strength. The biggest upside day was 8/21/26 (+18.5%), and the roughest day was 8/28/26 (-4.4%)
$DOGE
Dogecoin finished August 2026 at +19%. If you held only the best days, the return jumps to +53.0%, while missing them drops it to -22.0%.
That tells you the month was driven by a handful of outsized sessions rather than smooth trend strength. The biggest upside day was 8/21/26 (+18.5%), and the roughest day was 8/28/26 (-4.4%)
$DOGE
That tells you the month was driven by a handful of outsized sessions rather than smooth trend strength. The biggest upside day was 8/21/26 (+18.5%), and the roughest day was 8/28/26 (-4.4%)
$DOGE

93
·
--
查看翻譯
XRP finished August 2026 at +30%. If you held only the best days, the return jumps to +66.6%, while missing them drops it to -21.9%.
That tells you the month was driven by a handful of outsized sessions rather than smooth trend strength. The biggest upside day was 8/21/26 (+15.0%), and the roughest day was 8/28/26 (-4.9%)
$XRP
XRP finished August 2026 at +30%. If you held only the best days, the return jumps to +66.6%, while missing them drops it to -21.9%.
That tells you the month was driven by a handful of outsized sessions rather than smooth trend strength. The biggest upside day was 8/21/26 (+15.0%), and the roughest day was 8/28/26 (-4.9%)
$XRP
That tells you the month was driven by a handful of outsized sessions rather than smooth trend strength. The biggest upside day was 8/21/26 (+15.0%), and the roughest day was 8/28/26 (-4.9%)
$XRP

59
·
--
查看翻譯
Cardano’s August 2026 finished with an 18% gain and an average daily return of 0.64%, but the month’s real story was concentration. Hold through the full stretch and the move reached 66.5%. Miss the 10 best days and the result flipped to -29.0%. That gives ADA’s month a clear character: upside arrived in bursts, not in a smooth climb. The best day hit 18.0% on 8/21/26, while the worst day was -5.6% on 8/28/26, a reminder that the month rewarded staying in place more than trying to time every swing
$ADA
Cardano’s August 2026 finished with an 18% gain and an average daily return of 0.64%, but the month’s real story was concentration. Hold through the full stretch and the move reached 66.5%. Miss the 10 best days and the result flipped to -29.0%. That gives ADA’s month a clear character: upside arrived in bursts, not in a smooth climb. The best day hit 18.0% on 8/21/26, while the worst day was -5.6% on 8/28/26, a reminder that the month rewarded staying in place more than trying to time every swing
$ADA
$ADA

34
·
--
ETH 在這段時間裏一直追趕 BTC,但差距始終沒有完全縮小。
在指數圖表上,BTC 最終比 ETH 高出 0.3%。在這段窗口中,最大差距曾達到 1.4%,這讓臨近收盤時的價差看起來很小,但收盤時 BTC 仍然領先。
$BTC $ETH
ETH 在這段時間裏一直追趕 BTC,但差距始終沒有完全縮小。
在指數圖表上,BTC 最終比 ETH 高出 0.3%。在這段窗口中,最大差距曾達到 1.4%,這讓臨近收盤時的價差看起來很小,但收盤時 BTC 仍然領先。
$BTC $ETH
在指數圖表上,BTC 最終比 ETH 高出 0.3%。在這段窗口中,最大差距曾達到 1.4%,這讓臨近收盤時的價差看起來很小,但收盤時 BTC 仍然領先。
$BTC $ETH

72
·
--
查看翻譯
ZEC and XRP are breaking out, but that does not automatically mean altseason is here.
ZEC is leading the move, up more than 16% in 24 hours and pressing into the $960 to $1,000 zone. If it can close above $1,000 on the daily, $1,200 becomes the next obvious level. For now, support sits near $935.
XRP has also turned higher, climbing from $1.31 to roughly $1.48 before settling around $1.45. A clean break above $1.48 would bring $1.50 into focus first, then $1.66 if momentum holds.
The bigger question is breadth. Bitcoin is still firm above $80,000, and BTC dominance remains elevated around 57% to 58%. That usually is not the backdrop for a full altseason. A broader rotation tends to show up when BTC cools off and dominance starts sliding toward 55% or lower.
For now, this looks more like selective strength in a few names than a full handoff from BTC. If ZEC and XRP keep holding gains while Bitcoin consolidates and dominance starts to fade, the altseason case gets stronger. If not, this was likely a sharp tactical move, not a regime shift.
$XRP
ZEC and XRP are breaking out, but that does not automatically mean altseason is here.
ZEC is leading the move, up more than 16% in 24 hours and pressing into the $960 to $1,000 zone. If it can close above $1,000 on the daily, $1,200 becomes the next obvious level. For now, support sits near $935.
XRP has also turned higher, climbing from $1.31 to roughly $1.48 before settling around $1.45. A clean break above $1.48 would bring $1.50 into focus first, then $1.66 if momentum holds.
The bigger question is breadth. Bitcoin is still firm above $80,000, and BTC dominance remains elevated around 57% to 58%. That usually is not the backdrop for a full altseason. A broader rotation tends to show up when BTC cools off and dominance starts sliding toward 55% or lower.
For now, this looks more like selective strength in a few names than a full handoff from BTC. If ZEC and XRP keep holding gains while Bitcoin consolidates and dominance starts to fade, the altseason case gets stronger. If not, this was likely a sharp tactical move, not a regime shift.
$XRP
ZEC is leading the move, up more than 16% in 24 hours and pressing into the $960 to $1,000 zone. If it can close above $1,000 on the daily, $1,200 becomes the next obvious level. For now, support sits near $935.
XRP has also turned higher, climbing from $1.31 to roughly $1.48 before settling around $1.45. A clean break above $1.48 would bring $1.50 into focus first, then $1.66 if momentum holds.
The bigger question is breadth. Bitcoin is still firm above $80,000, and BTC dominance remains elevated around 57% to 58%. That usually is not the backdrop for a full altseason. A broader rotation tends to show up when BTC cools off and dominance starts sliding toward 55% or lower.
For now, this looks more like selective strength in a few names than a full handoff from BTC. If ZEC and XRP keep holding gains while Bitcoin consolidates and dominance starts to fade, the altseason case gets stronger. If not, this was likely a sharp tactical move, not a regime shift.
$XRP

54
·
--
ETH在24小時的對比榜中贏了(按指數),但領先BTC的幅度僅爲0.6%。
這種微弱差距纔是重點。ETH以+4.56%排名第一,而BTC爲+3.99%,因此差距始終沒有演變成真正的突破。兩者都在上漲,但誰也沒有拉開太多距離。
$ETH $BTC
ETH在24小時的對比榜中贏了(按指數),但領先BTC的幅度僅爲0.6%。
這種微弱差距纔是重點。ETH以+4.56%排名第一,而BTC爲+3.99%,因此差距始終沒有演變成真正的突破。兩者都在上漲,但誰也沒有拉開太多距離。
$ETH $BTC
這種微弱差距纔是重點。ETH以+4.56%排名第一,而BTC爲+3.99%,因此差距始終沒有演變成真正的突破。兩者都在上漲,但誰也沒有拉開太多距離。
$ETH $BTC

69
·
--
查看翻譯
August 2026 was a high-velocity month for Solana, up 42% overall with an average daily return of 1.2%. The range ran from -4.7% on 8/28/26 to +10.9% on 8/19/26. What stands out is how concentrated the move was. The 10 top days drove a +53.7% held-only outcome, while missing the best days turned the month into -7.8%. This was not a slow grind. It was a month where the biggest bursts mattered
$SOL
August 2026 was a high-velocity month for Solana, up 42% overall with an average daily return of 1.2%. The range ran from -4.7% on 8/28/26 to +10.9% on 8/19/26. What stands out is how concentrated the move was. The 10 top days drove a +53.7% held-only outcome, while missing the best days turned the month into -7.8%. This was not a slow grind. It was a month where the biggest bursts mattered
$SOL
$SOL

28
·
--
查看翻譯
XRP did not just outperform BTC in this window, it kept pulling away.
On the indexed 24h chart, XRP closes 4.5% ahead, with the spread reaching 4.8% at its widest. That leaves XRP as the clear leader in this BTC comparison right now
$XRP $BTC
XRP did not just outperform BTC in this window, it kept pulling away.
On the indexed 24h chart, XRP closes 4.5% ahead, with the spread reaching 4.8% at its widest. That leaves XRP as the clear leader in this BTC comparison right now
$XRP $BTC
On the indexed 24h chart, XRP closes 4.5% ahead, with the spread reaching 4.8% at its widest. That leaves XRP as the clear leader in this BTC comparison right now
$XRP $BTC

46
·
--
查看翻譯
Bitcoin is nearing a golden cross, with the 50-day moving average about to move above the 200-day. That setup has only shown up a few times in BTC history, and in 2012 and 2020 it came before major upside runs.
That is the bullish headline, but the real test is price. BTC has been consolidating between 75,000 and 82,000 after a strong August, and the market still needs a clean break through the 81,500 to 84,400 resistance zone before 98,000 and 100,000 come back into view.
If BTC holds 80,000, completes the cross, and sees fresh spot demand, the structure starts to improve. If it gets rejected again in the 82,000 to 84,400 area and loses 75,000, attention shifts back toward the 200-day average near 72,500. The cross matters, but only if price confirms it.
$BTC
Bitcoin is nearing a golden cross, with the 50-day moving average about to move above the 200-day. That setup has only shown up a few times in BTC history, and in 2012 and 2020 it came before major upside runs.
That is the bullish headline, but the real test is price. BTC has been consolidating between 75,000 and 82,000 after a strong August, and the market still needs a clean break through the 81,500 to 84,400 resistance zone before 98,000 and 100,000 come back into view.
If BTC holds 80,000, completes the cross, and sees fresh spot demand, the structure starts to improve. If it gets rejected again in the 82,000 to 84,400 area and loses 75,000, attention shifts back toward the 200-day average near 72,500. The cross matters, but only if price confirms it.
$BTC
That is the bullish headline, but the real test is price. BTC has been consolidating between 75,000 and 82,000 after a strong August, and the market still needs a clean break through the 81,500 to 84,400 resistance zone before 98,000 and 100,000 come back into view.
If BTC holds 80,000, completes the cross, and sees fresh spot demand, the structure starts to improve. If it gets rejected again in the 82,000 to 84,400 area and loses 75,000, attention shifts back toward the 200-day average near 72,500. The cross matters, but only if price confirms it.
$BTC

61
登入以探索更多內容
加入幣安廣場中的全球加密貨幣用戶
⚡️ 獲取加密貨幣的最新和實用資訊。
💬 受到全球最大加密貨幣交易所的信任。
👍 發掘來自經過驗證創作者的真實見解。
電子郵件 / 電話號碼
熱門話題
比特币突破8万美元大关
307,981 次瀏覽
1,018 討論中
$BTC 這次BTC重新站上8萬美元,我反而更關注一個細節:利空這麼多,爲什麼跌不下去?
這周美聯儲加息、美國加密法案受挫,BTC一度跌到7.7萬美元附近,但隨後又快速收復8萬美元,9月18日一度漲到約8.12萬美元。:contentReference[oaicite:0]{index=0}
這說明短線市場的承接明顯增強。
現在我會重點看兩個位置:
8萬美元:從心理關口變成短線多空分界附近,如果回踩後還能站穩,說明買盤仍在。
7.65萬~7.7萬美元:前面的重要支撐區,如果再次跌回這裏,而且放量,就要防止這次反彈變成假突破。:contentReference[oaicite:1]{index=1}
另外,9月18日美國現貨BTC ETF重新出現約1.6億美元淨流入,也是值得關注的資金信號。:contentReference[oaicite:2]{index=2}
所以現在我不會因爲BTC漲了就直接追多。
真正值得觀察的是:BTC站穩8萬之後,資金會不會繼續流向ETH和山寨。
如果BTC強、山寨卻跟不上,反而要小心資金只是迴流BTC,而不是全面進入風險資產。#比特币突破8万美元大关
最後一把
·13 人按讚
·23k 次瀏覽
比特币市值超越特斯拉
7,770 次瀏覽
53 討論中
SOL涨约10%
65,658 次瀏覽
131 討論中