

bitguide
261 貼文

bitguide
舉報
封鎖用戶
Crypto journey shuru ki hai Na expert hoon, na fake tips deta hoon Bas real baat karta hoon 💯
13 關注
50 粉絲
140 點讚數
貼文
·
--
看漲
$SOL 更新 🚀
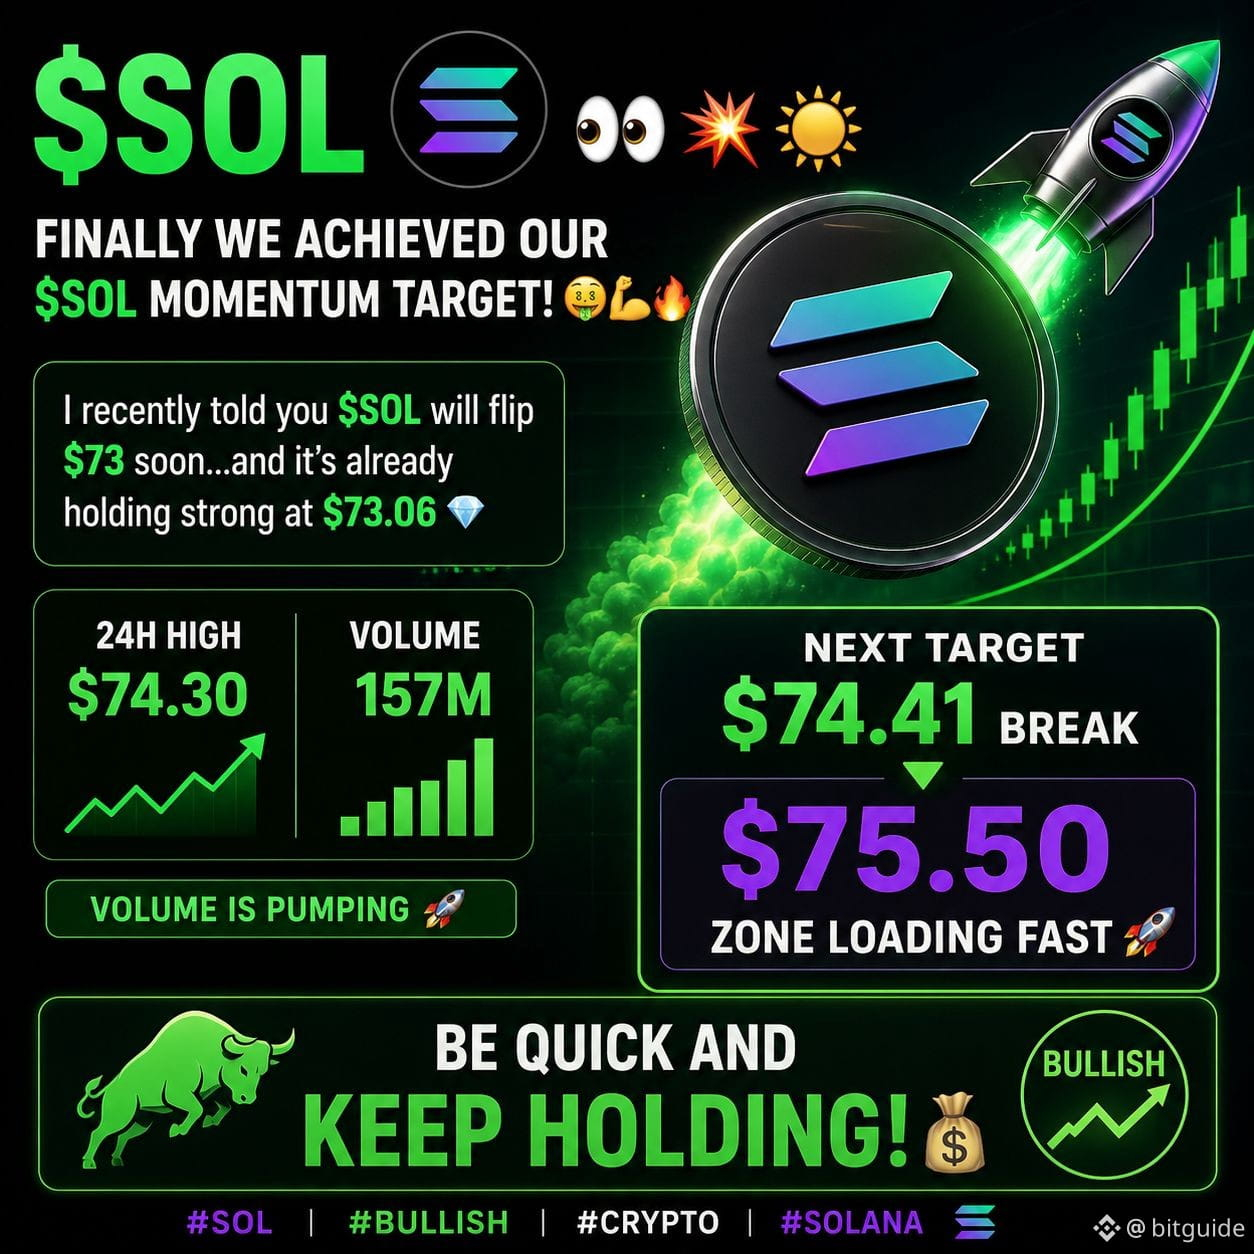
👀🔥 終於,我們的動能目標已經達成!
我最近提到$SOL 將會很快重新站上$73水平,而現在它穩穩地在$73.06之上 💎
📈 24小時高點: $74.30
📊 交易量: 157M 並且仍在上升中
接下來要關注的關鍵水平是$74.41。若能乾淨突破,那將很快打開通往$75.50區域的大門 🚀
目前趨勢仍然是看漲,動能依然在買方那邊。保持警覺,明智地管理你的部位。 💰
#SOL #看漲 #加密貨幣 #Solana 🚀🔥
$SOL
{future}(SOLUSDT)
$SOL 更新 🚀
👀🔥 終於,我們的動能目標已經達成!
我最近提到$SOL 將會很快重新站上$73水平,而現在它穩穩地在$73.06之上 💎
📈 24小時高點: $74.30
📊 交易量: 157M 並且仍在上升中
接下來要關注的關鍵水平是$74.41。若能乾淨突破,那將很快打開通往$75.50區域的大門 🚀
目前趨勢仍然是看漲,動能依然在買方那邊。保持警覺,明智地管理你的部位。 💰
#SOL #看漲 #加密貨幣 #Solana 🚀🔥
$SOL
👀🔥 終於,我們的動能目標已經達成!
我最近提到$SOL 將會很快重新站上$73水平,而現在它穩穩地在$73.06之上 💎
📈 24小時高點: $74.30
📊 交易量: 157M 並且仍在上升中
接下來要關注的關鍵水平是$74.41。若能乾淨突破,那將很快打開通往$75.50區域的大門 🚀
目前趨勢仍然是看漲,動能依然在買方那邊。保持警覺,明智地管理你的部位。 💰
#SOL #看漲 #加密貨幣 #Solana 🚀🔥
$SOL
79
·
--
看漲
RUNE顯示出強勁的復甦跡象。
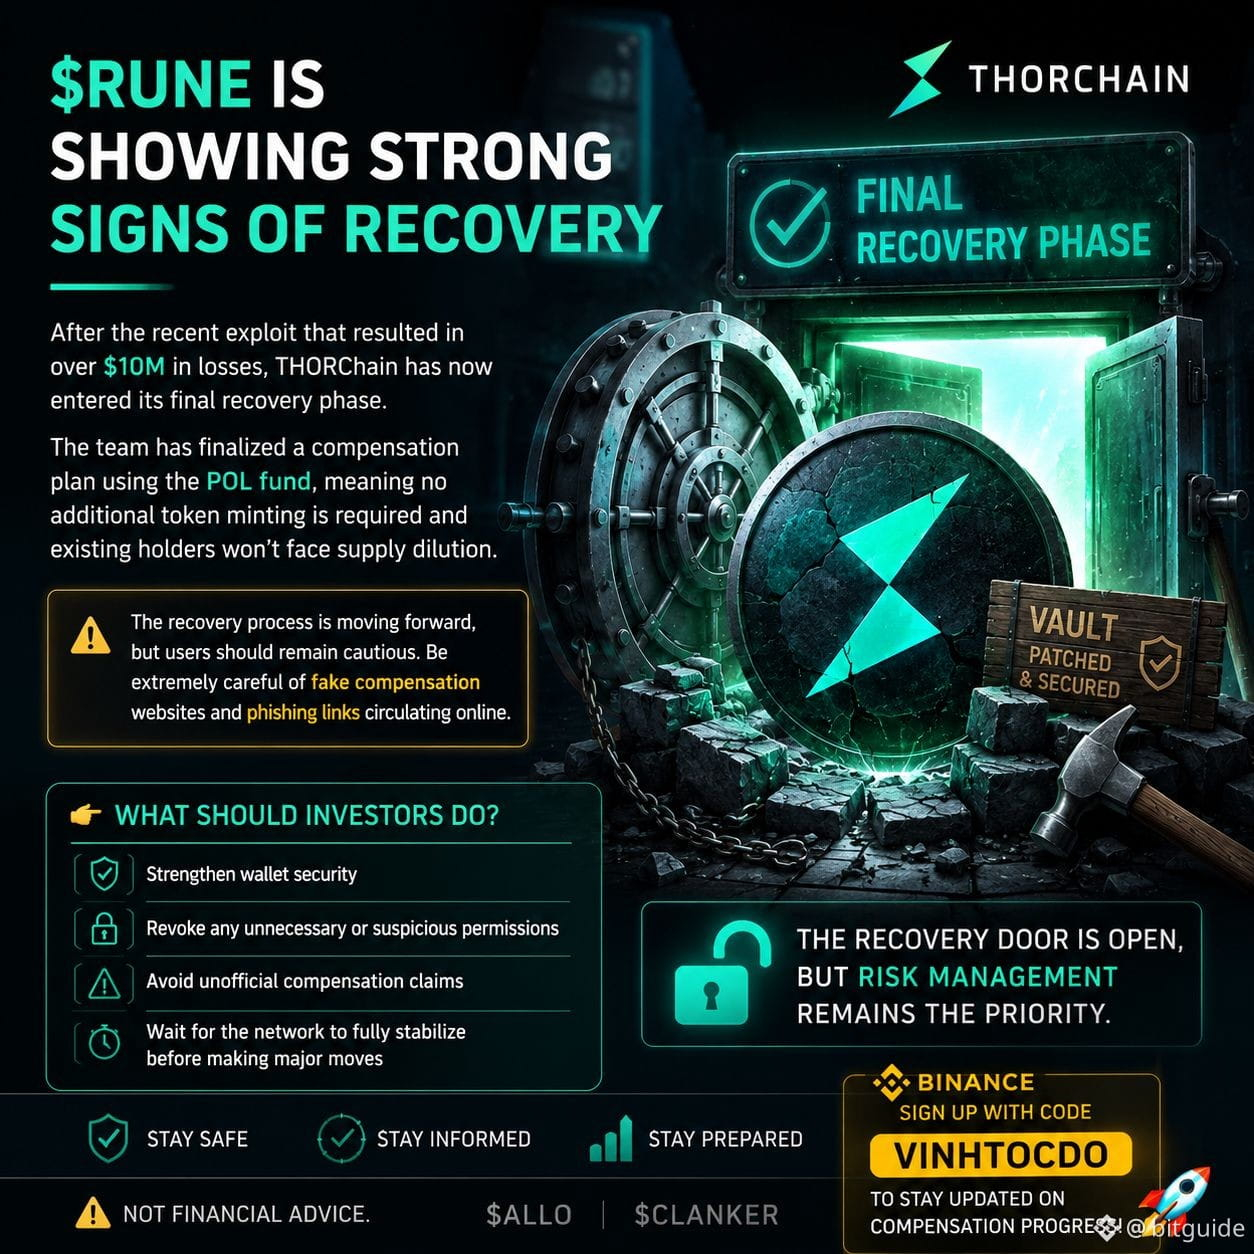
在最近的攻擊導致超過$10M的損失後,THORChain現在已進入最終的復甦階段。團隊已確定使用POL基金的賠償計劃,這意味着不需要額外的代幣鑄造,現有持有者不會面臨供應稀釋。
復甦過程正在推進,但用戶應保持警惕。務必小心網上流傳的假賠償網站和釣魚鏈接。
👉 投資者應該怎麼做?
• 加強錢包安全
• 撤銷任何不必要或可疑的權限
• 避免非官方的賠償請求
• 等待網絡完全穩定後再進行重大操作
復甦之門已打開,但風險管理仍然是首要任務。
⚠️ 這不是財務建議。
#THORChain #RUNE #Crypto #DeFi #Recovery #Blockchain #Hack #CryptoNews #THOR
$RUNE
{future}(RUNEUSDT)
$ALLO
{future}(ALLOUSDT)
$CLANKER
{future}(CLANKERUSDT)
RUNE顯示出強勁的復甦跡象。
在最近的攻擊導致超過$10M的損失後,THORChain現在已進入最終的復甦階段。團隊已確定使用POL基金的賠償計劃,這意味着不需要額外的代幣鑄造,現有持有者不會面臨供應稀釋。
復甦過程正在推進,但用戶應保持警惕。務必小心網上流傳的假賠償網站和釣魚鏈接。
👉 投資者應該怎麼做?
• 加強錢包安全
• 撤銷任何不必要或可疑的權限
• 避免非官方的賠償請求
• 等待網絡完全穩定後再進行重大操作
復甦之門已打開,但風險管理仍然是首要任務。
⚠️ 這不是財務建議。
#THORChain #RUNE #Crypto #DeFi #Recovery #Blockchain #Hack #CryptoNews #THOR
$RUNE
$ALLO
$CLANKER
在最近的攻擊導致超過$10M的損失後,THORChain現在已進入最終的復甦階段。團隊已確定使用POL基金的賠償計劃,這意味着不需要額外的代幣鑄造,現有持有者不會面臨供應稀釋。
復甦過程正在推進,但用戶應保持警惕。務必小心網上流傳的假賠償網站和釣魚鏈接。
👉 投資者應該怎麼做?
• 加強錢包安全
• 撤銷任何不必要或可疑的權限
• 避免非官方的賠償請求
• 等待網絡完全穩定後再進行重大操作
復甦之門已打開,但風險管理仍然是首要任務。
⚠️ 這不是財務建議。
#THORChain #RUNE #Crypto #DeFi #Recovery #Blockchain #Hack #CryptoNews #THOR
$RUNE
$ALLO
$CLANKER
18
·
--
看跌
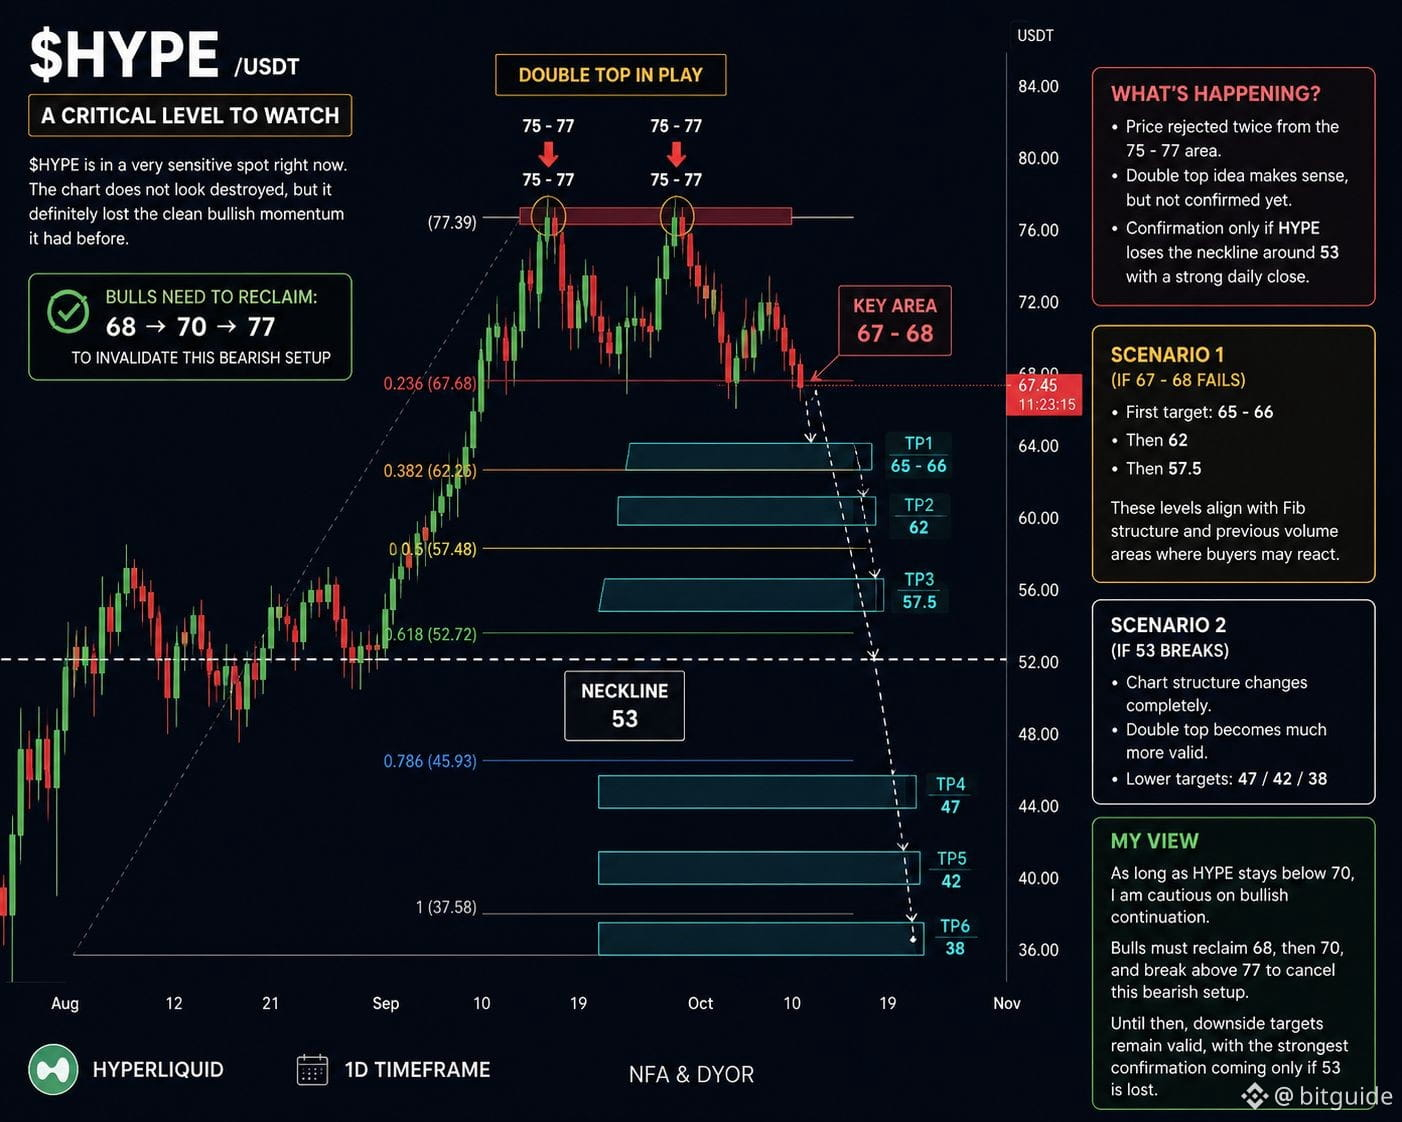
$HYPE 正接近一個關鍵水平,接下來的動作可能會定義未來幾週的趨勢。
目前圖表尚未完全轉為看空,但強勁的看漲動能顯然已經減弱。價格已經在75–77區域遭遇兩次重大拒絕,這讓雙頂模式仍然保持在場。然而,我只有在HYPE強勢日線蠟燭收盤低於53頸線時,才會將該模式視為完全確認。
現在,關鍵區域是67–68。
價格在這個區域附近交易,接近0.236斐波那契水平。如果買方無法迅速收復並推回到70以上,則下行壓力可能會持續。在那種情況下,第一個目標大約在65–66。
在那之下,我會關注62和57.5。
這些水平與重要的斐波那契支撐和之前的高交易量區域對齊,使它們成為買方可能試圖捍衛趨勢的潛在區域。
最重要的水平仍然是53。
跌破53將完全改變圖表結構,並顯著加強雙頂論點。如果那發生,下行目標在47、42,甚至38變得越來越現實。
我的看法很簡單:
只要HYPE保持在70以下,我會對看漲延續保持謹慎。多頭需要收復68,然後是70,最終突破77以使這一看空佈局失效。
在那之前,下行目標仍然活躍,只有當53失守時,才能得到最強的確認。
#NFA. #DYOR.
$HYPE
{future}(HYPEUSDT)
$HYPE 正接近一個關鍵水平,接下來的動作可能會定義未來幾週的趨勢。
目前圖表尚未完全轉為看空,但強勁的看漲動能顯然已經減弱。價格已經在75–77區域遭遇兩次重大拒絕,這讓雙頂模式仍然保持在場。然而,我只有在HYPE強勢日線蠟燭收盤低於53頸線時,才會將該模式視為完全確認。
現在,關鍵區域是67–68。
價格在這個區域附近交易,接近0.236斐波那契水平。如果買方無法迅速收復並推回到70以上,則下行壓力可能會持續。在那種情況下,第一個目標大約在65–66。
在那之下,我會關注62和57.5。
這些水平與重要的斐波那契支撐和之前的高交易量區域對齊,使它們成為買方可能試圖捍衛趨勢的潛在區域。
最重要的水平仍然是53。
跌破53將完全改變圖表結構,並顯著加強雙頂論點。如果那發生,下行目標在47、42,甚至38變得越來越現實。
我的看法很簡單:
只要HYPE保持在70以下,我會對看漲延續保持謹慎。多頭需要收復68,然後是70,最終突破77以使這一看空佈局失效。
在那之前,下行目標仍然活躍,只有當53失守時,才能得到最強的確認。
#NFA. #DYOR.
$HYPE
目前圖表尚未完全轉為看空,但強勁的看漲動能顯然已經減弱。價格已經在75–77區域遭遇兩次重大拒絕,這讓雙頂模式仍然保持在場。然而,我只有在HYPE強勢日線蠟燭收盤低於53頸線時,才會將該模式視為完全確認。
現在,關鍵區域是67–68。
價格在這個區域附近交易,接近0.236斐波那契水平。如果買方無法迅速收復並推回到70以上,則下行壓力可能會持續。在那種情況下,第一個目標大約在65–66。
在那之下,我會關注62和57.5。
這些水平與重要的斐波那契支撐和之前的高交易量區域對齊,使它們成為買方可能試圖捍衛趨勢的潛在區域。
最重要的水平仍然是53。
跌破53將完全改變圖表結構,並顯著加強雙頂論點。如果那發生,下行目標在47、42,甚至38變得越來越現實。
我的看法很簡單:
只要HYPE保持在70以下,我會對看漲延續保持謹慎。多頭需要收復68,然後是70,最終突破77以使這一看空佈局失效。
在那之前,下行目標仍然活躍,只有當53失守時,才能得到最強的確認。
#NFA. #DYOR.
$HYPE
168
·
--
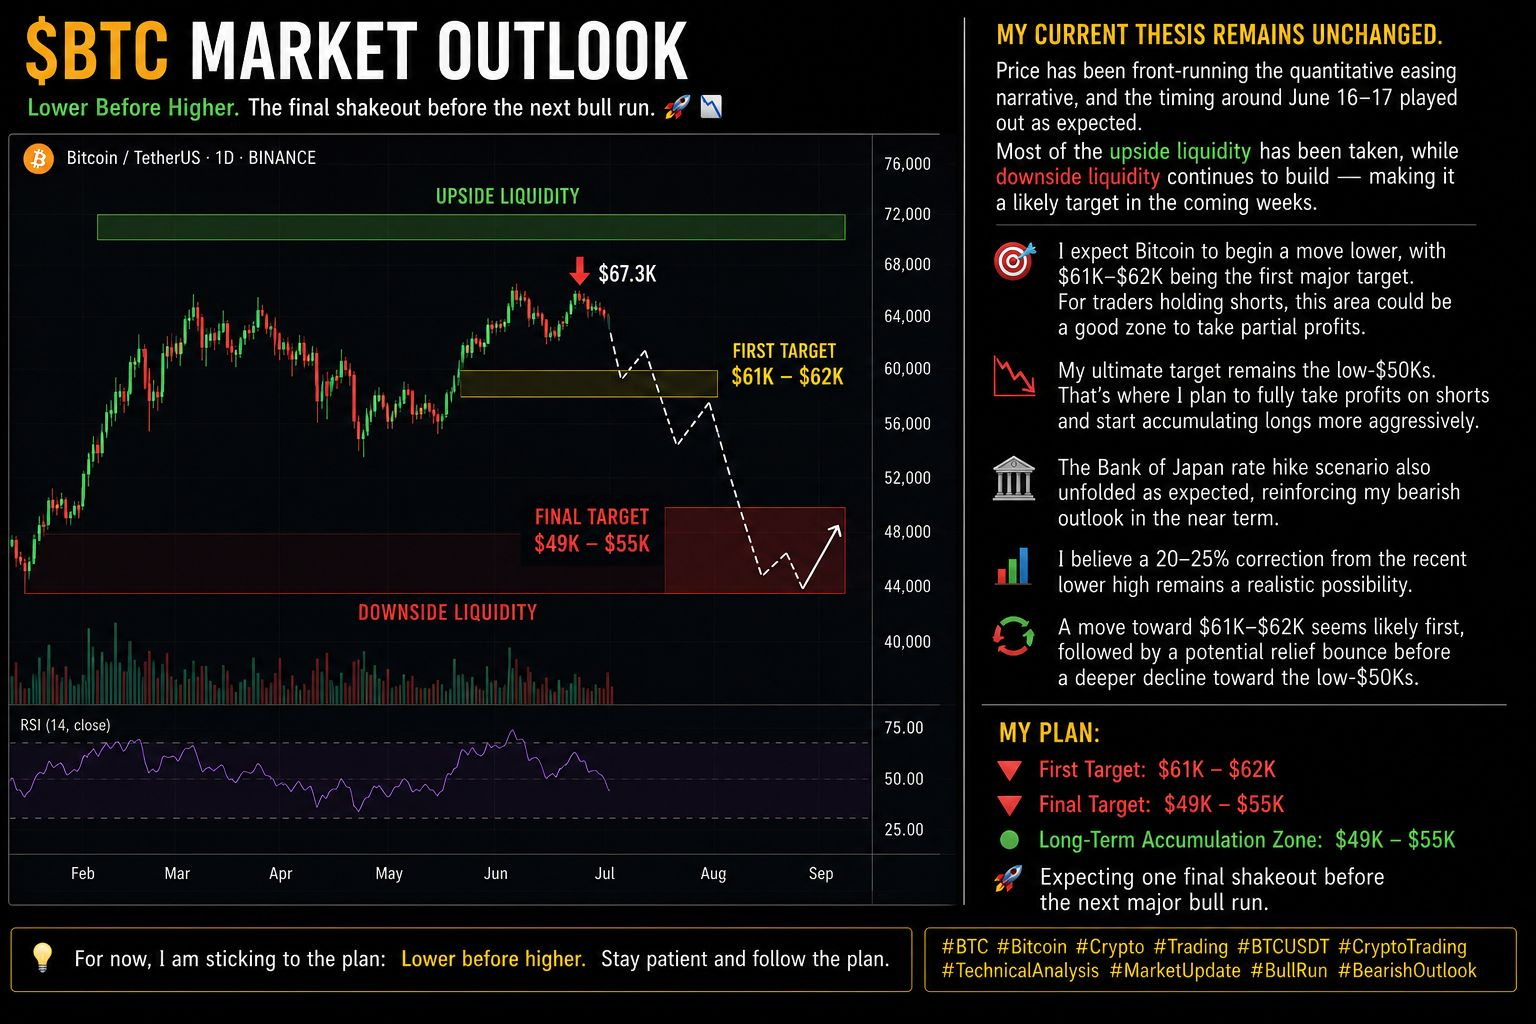
$BTC — 先跌後漲 📉
市場結構沒有變化,我的觀點也沒有改變。
價格已經掃清了大部分的上行流動性,而大量流動性仍在當前水平以下持續積聚。從技術角度來看,這使得下行成爲近期更具吸引力的目標。
從$67.3K區域的拒絕是一個重要信號。只要看跌動能保持不變,我預計$61K–$62K將是第一個主要目標。持有空頭頭寸的交易者可以考慮在這個區域部分獲利了結。
就我個人而言,我的目標是更低的水平。
我的主要積累區間仍然在$49K和$55K之間。如果價格達到該區域,我計劃平掉剩餘的空頭頭寸,並開始爲下一個主要牛市週期建立長期多頭。
最近的宏觀發展,包括日本銀行的政策方向,繼續支持謹慎的前景。因此,從最近的低高點回調20–25%仍然看起來是一個現實的情景。
我的計劃:
🔻 第一個目標:$61K–$62K
🔻 最終目標:$49K–$55K
🟢 長期積累區:$49K–$55K
🚀 預計在下一個主要牛市之前會有一次最後的洗盤。
先跌後漲。保持耐心,遵循計劃。
#BTC #比特幣 #加密 #交易 #BTCUSDT #加密交易 #技術分析 #市場更新 #牛市 #看跌前景 #流動性 #價格行爲 #加密市場 #投資 #BitcoinAnalysis
$BTC
{future}(BTCUSDT)
$BTC — 先跌後漲 📉
市場結構沒有變化,我的觀點也沒有改變。
價格已經掃清了大部分的上行流動性,而大量流動性仍在當前水平以下持續積聚。從技術角度來看,這使得下行成爲近期更具吸引力的目標。
從$67.3K區域的拒絕是一個重要信號。只要看跌動能保持不變,我預計$61K–$62K將是第一個主要目標。持有空頭頭寸的交易者可以考慮在這個區域部分獲利了結。
就我個人而言,我的目標是更低的水平。
我的主要積累區間仍然在$49K和$55K之間。如果價格達到該區域,我計劃平掉剩餘的空頭頭寸,並開始爲下一個主要牛市週期建立長期多頭。
最近的宏觀發展,包括日本銀行的政策方向,繼續支持謹慎的前景。因此,從最近的低高點回調20–25%仍然看起來是一個現實的情景。
我的計劃:
🔻 第一個目標:$61K–$62K
🔻 最終目標:$49K–$55K
🟢 長期積累區:$49K–$55K
🚀 預計在下一個主要牛市之前會有一次最後的洗盤。
先跌後漲。保持耐心,遵循計劃。
#BTC #比特幣 #加密 #交易 #BTCUSDT #加密交易 #技術分析 #市場更新 #牛市 #看跌前景 #流動性 #價格行爲 #加密市場 #投資 #BitcoinAnalysis
$BTC
市場結構沒有變化,我的觀點也沒有改變。
價格已經掃清了大部分的上行流動性,而大量流動性仍在當前水平以下持續積聚。從技術角度來看,這使得下行成爲近期更具吸引力的目標。
從$67.3K區域的拒絕是一個重要信號。只要看跌動能保持不變,我預計$61K–$62K將是第一個主要目標。持有空頭頭寸的交易者可以考慮在這個區域部分獲利了結。
就我個人而言,我的目標是更低的水平。
我的主要積累區間仍然在$49K和$55K之間。如果價格達到該區域,我計劃平掉剩餘的空頭頭寸,並開始爲下一個主要牛市週期建立長期多頭。
最近的宏觀發展,包括日本銀行的政策方向,繼續支持謹慎的前景。因此,從最近的低高點回調20–25%仍然看起來是一個現實的情景。
我的計劃:
🔻 第一個目標:$61K–$62K
🔻 最終目標:$49K–$55K
🟢 長期積累區:$49K–$55K
🚀 預計在下一個主要牛市之前會有一次最後的洗盤。
先跌後漲。保持耐心,遵循計劃。
#BTC #比特幣 #加密 #交易 #BTCUSDT #加密交易 #技術分析 #市場更新 #牛市 #看跌前景 #流動性 #價格行爲 #加密市場 #投資 #BitcoinAnalysis
$BTC
79
·
--
看跌
這是你風格的更清晰版本:
$XAU 看起來準備好進行一次空頭操作。 📉🔥
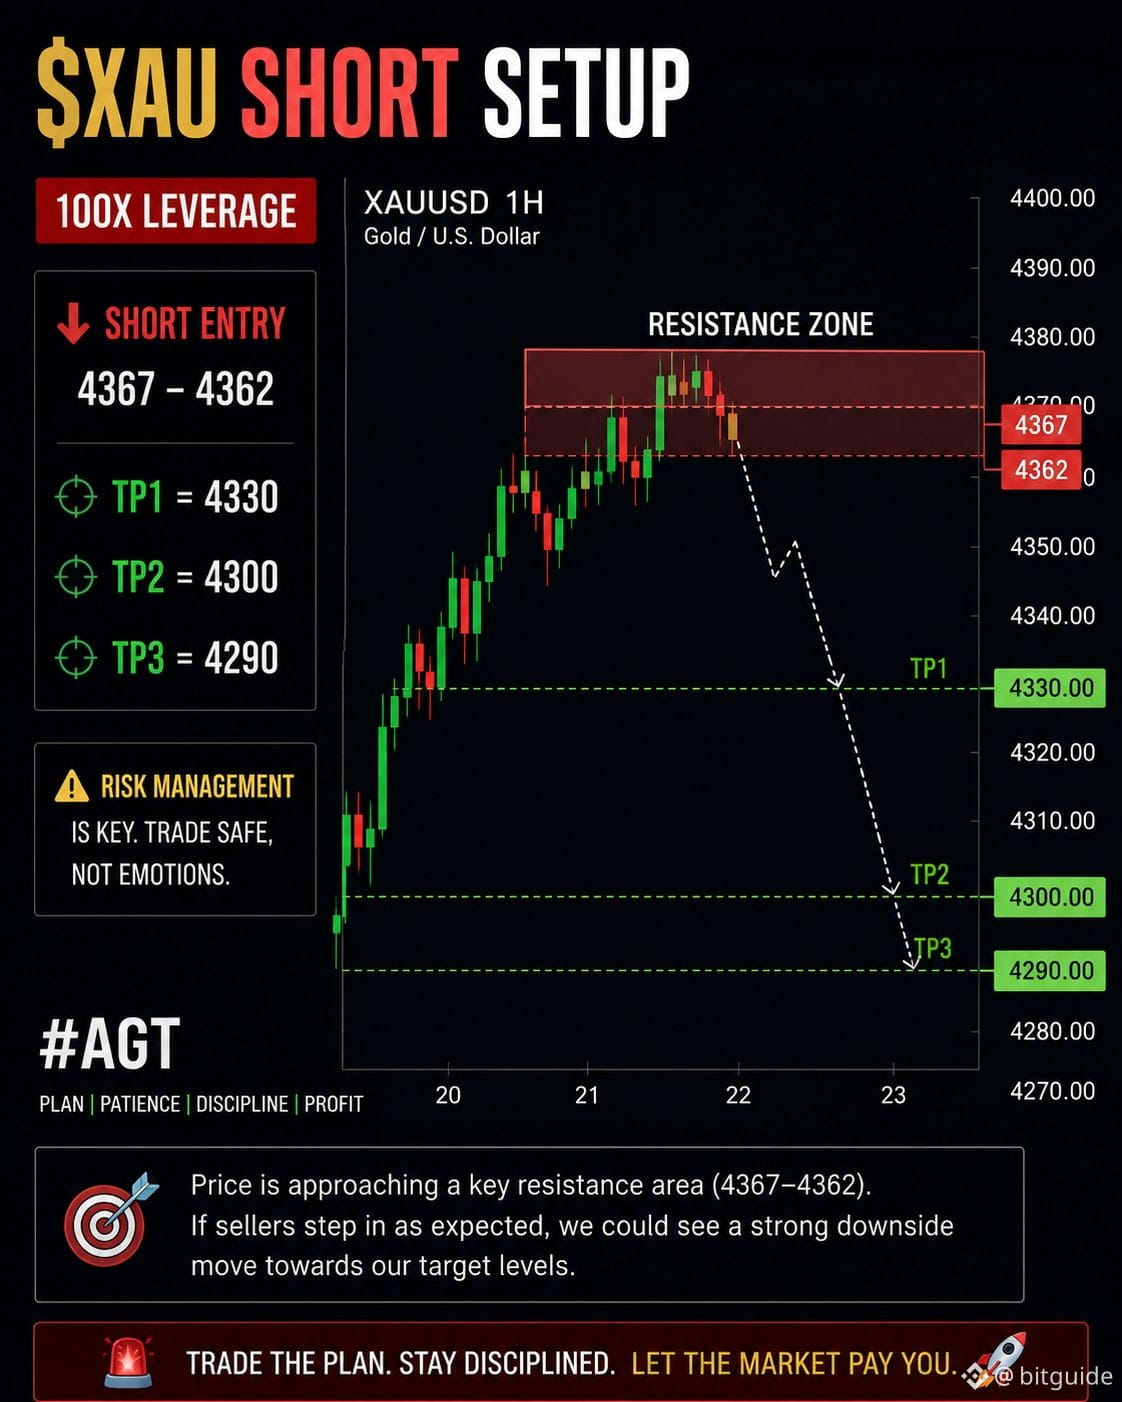
我正在關注4367–4362區間作爲潛在的入場點。
🔴 空頭入場:4367 – 4362
🎯 TP1:4330
🎯 TP2:4300
🎯 TP3:4290
價格正在接近一個關鍵的阻力區,如果賣家如預期般進場,我們可能會看到這個區域的強烈下行反應。
仔細管理風險,不要追漲。只要阻力位保持有效,這個策略就依然成立。
#XAUUSD #黃金 #交易 #空頭策略 #AGT 🚀📊
$XAU
{future}(XAUUSDT)
這是你風格的更清晰版本:
$XAU 看起來準備好進行一次空頭操作。 📉🔥
我正在關注4367–4362區間作爲潛在的入場點。
🔴 空頭入場:4367 – 4362
🎯 TP1:4330
🎯 TP2:4300
🎯 TP3:4290
價格正在接近一個關鍵的阻力區,如果賣家如預期般進場,我們可能會看到這個區域的強烈下行反應。
仔細管理風險,不要追漲。只要阻力位保持有效,這個策略就依然成立。
#XAUUSD #黃金 #交易 #空頭策略 #AGT 🚀📊
$XAU
$XAU 看起來準備好進行一次空頭操作。 📉🔥
我正在關注4367–4362區間作爲潛在的入場點。
🔴 空頭入場:4367 – 4362
🎯 TP1:4330
🎯 TP2:4300
🎯 TP3:4290
價格正在接近一個關鍵的阻力區,如果賣家如預期般進場,我們可能會看到這個區域的強烈下行反應。
仔細管理風險,不要追漲。只要阻力位保持有效,這個策略就依然成立。
#XAUUSD #黃金 #交易 #空頭策略 #AGT 🚀📊
$XAU
154
·
--
看漲
🚨 $DOGE 多頭佈局已激活 🚨
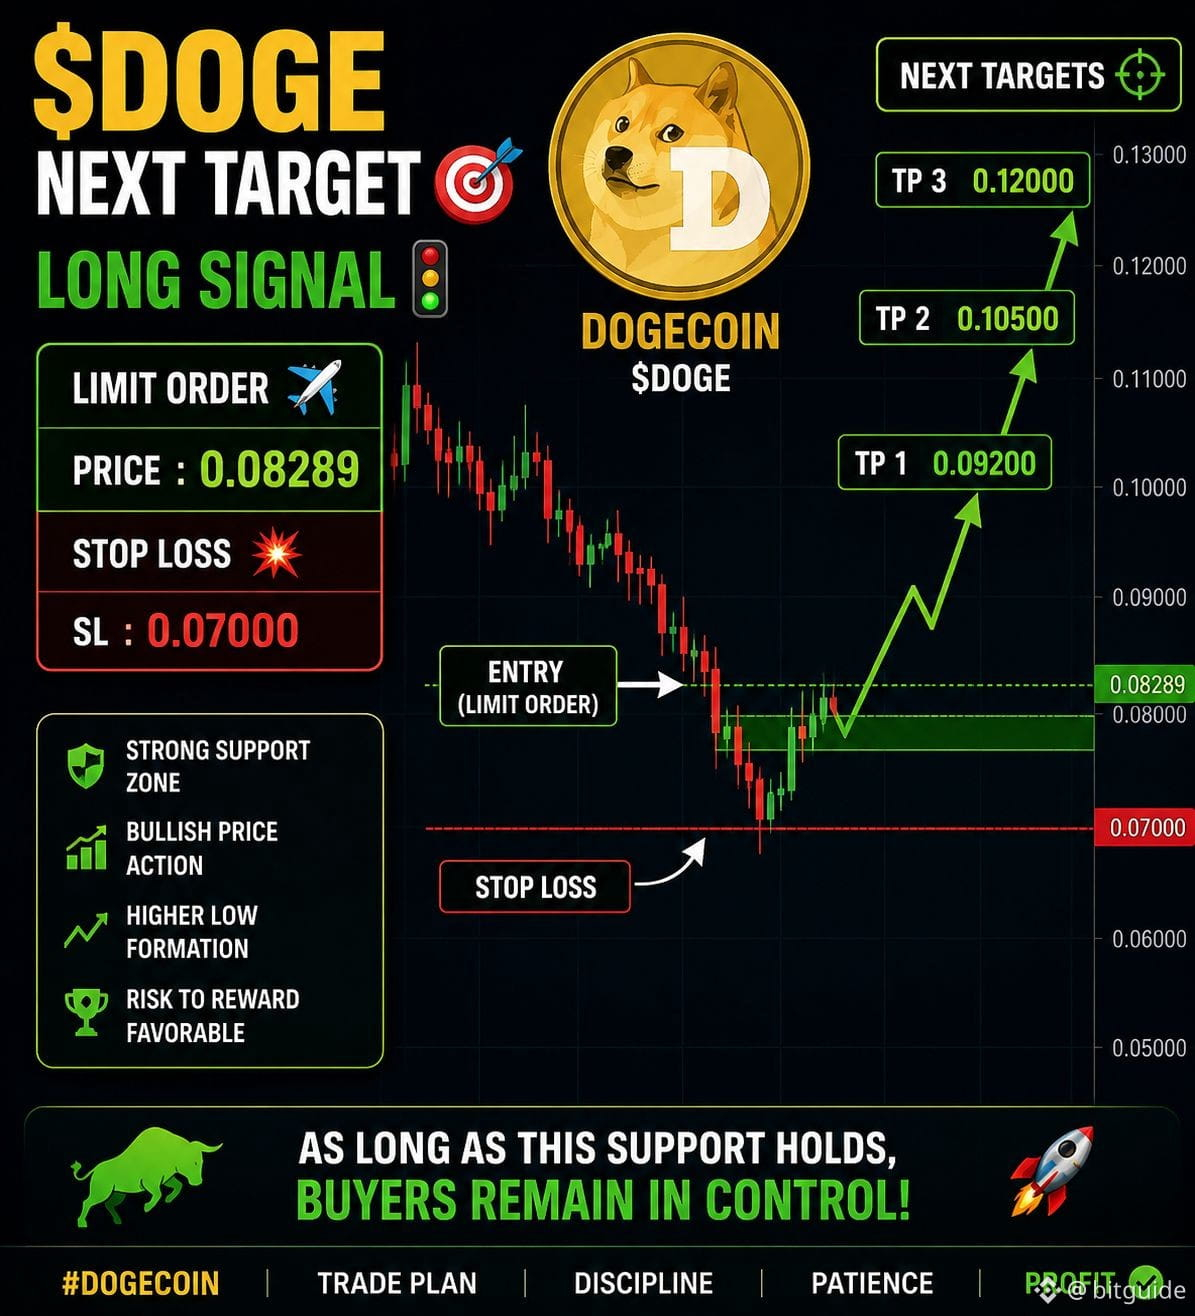
$DOGE 正在接近一個關鍵支撐區,風險與收益看起來很有吸引力。
📍 入場(限價單):0.08289
🎯 目標:前方更高的阻力位
🛑 止損:0.07000
只要這個支撐位保持,買方就會繼續掌控局面,牛市情景依然有效。從這個水平的強烈反應可能會觸發下一波上漲。
#DOGE #狗狗幣 #加密貨幣 #交易 #LongSignal
$DOGE
{future}(DOGEUSDT)
🚨 $DOGE 多頭佈局已激活 🚨
$DOGE 正在接近一個關鍵支撐區,風險與收益看起來很有吸引力。
📍 入場(限價單):0.08289
🎯 目標:前方更高的阻力位
🛑 止損:0.07000
只要這個支撐位保持,買方就會繼續掌控局面,牛市情景依然有效。從這個水平的強烈反應可能會觸發下一波上漲。
#DOGE #狗狗幣 #加密貨幣 #交易 #LongSignal
$DOGE
$DOGE 正在接近一個關鍵支撐區,風險與收益看起來很有吸引力。
📍 入場(限價單):0.08289
🎯 目標:前方更高的阻力位
🛑 止損:0.07000
只要這個支撐位保持,買方就會繼續掌控局面,牛市情景依然有效。從這個水平的強烈反應可能會觸發下一波上漲。
#DOGE #狗狗幣 #加密貨幣 #交易 #LongSignal
$DOGE
91
·
--
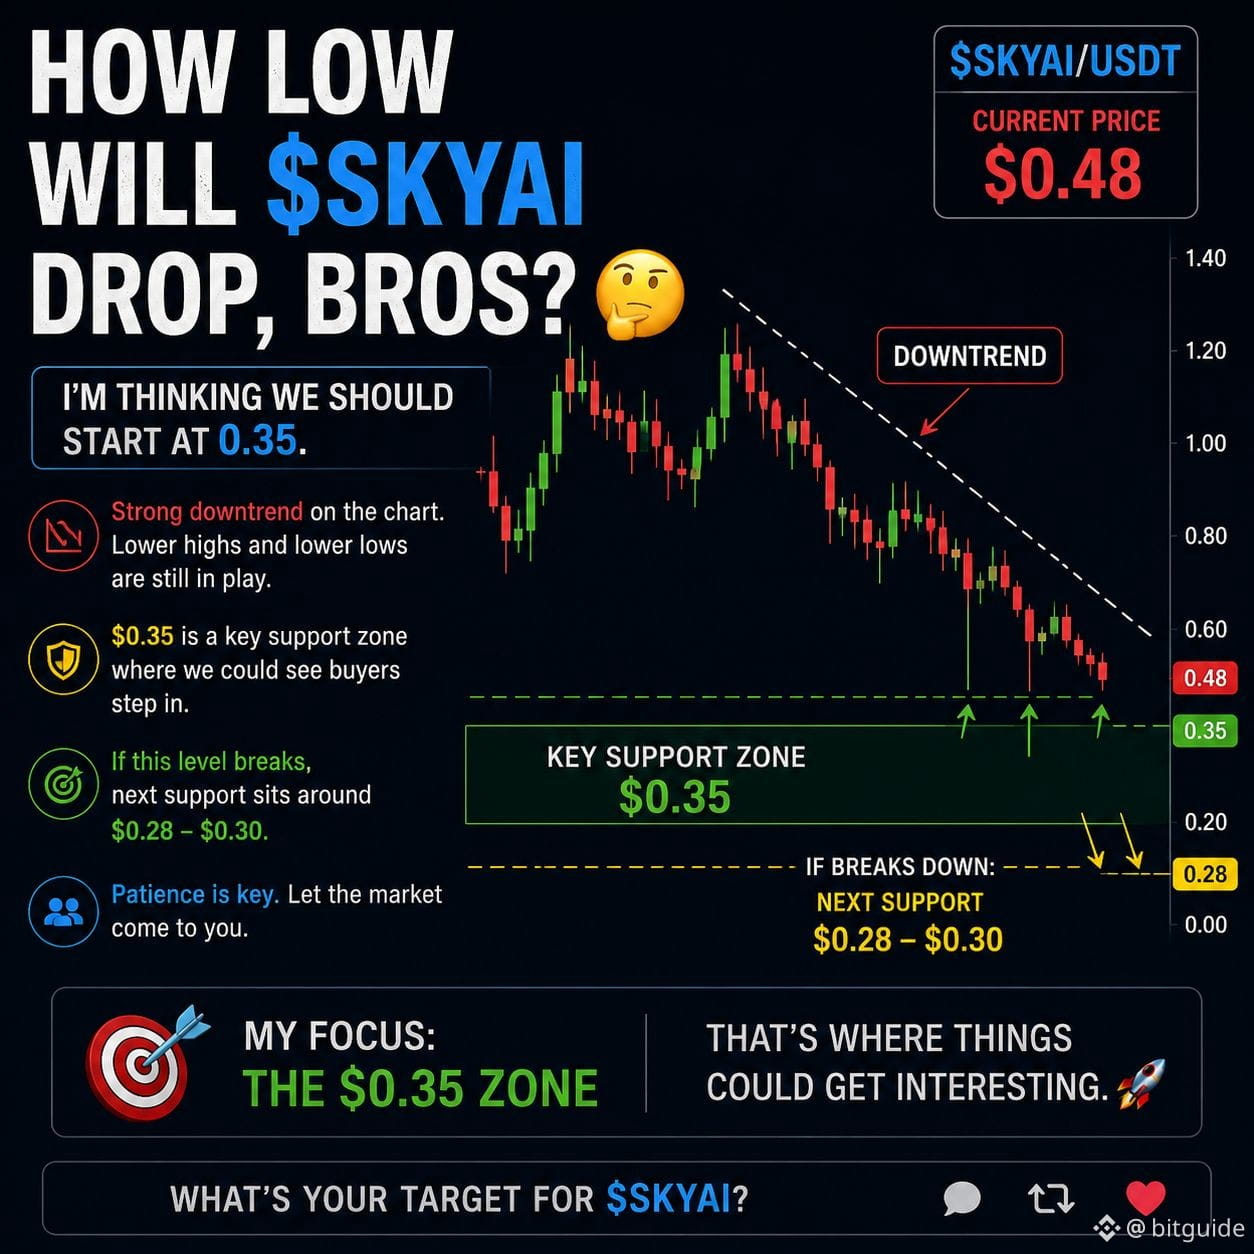
你認爲$SKYAI 能跌到多低?
我在密切關注$0.35這個區域。如果賣壓持續,這看起來是一個買家可能開始入場的現實水平。
目前,耐心是關鍵。讓市場來找你,而不是追逐每一次反彈。
我關注的仍然是$0.35區域——這是事情可能變得有趣的地方。
你對$SKYAI的目標是什麼?
#SKYAI #Crypto #Trading
$SKYAI
{future}(SKYAIUSDT)
你認爲$SKYAI 能跌到多低?
我在密切關注$0.35這個區域。如果賣壓持續,這看起來是一個買家可能開始入場的現實水平。
目前,耐心是關鍵。讓市場來找你,而不是追逐每一次反彈。
我關注的仍然是$0.35區域——這是事情可能變得有趣的地方。
你對$SKYAI 的目標是什麼?
#SKYAI #Crypto #Trading
$SKYAI
我在密切關注$0.35這個區域。如果賣壓持續,這看起來是一個買家可能開始入場的現實水平。
目前,耐心是關鍵。讓市場來找你,而不是追逐每一次反彈。
我關注的仍然是$0.35區域——這是事情可能變得有趣的地方。
你對$SKYAI 的目標是什麼?
#SKYAI #Crypto #Trading
$SKYAI
207
·
--
看漲
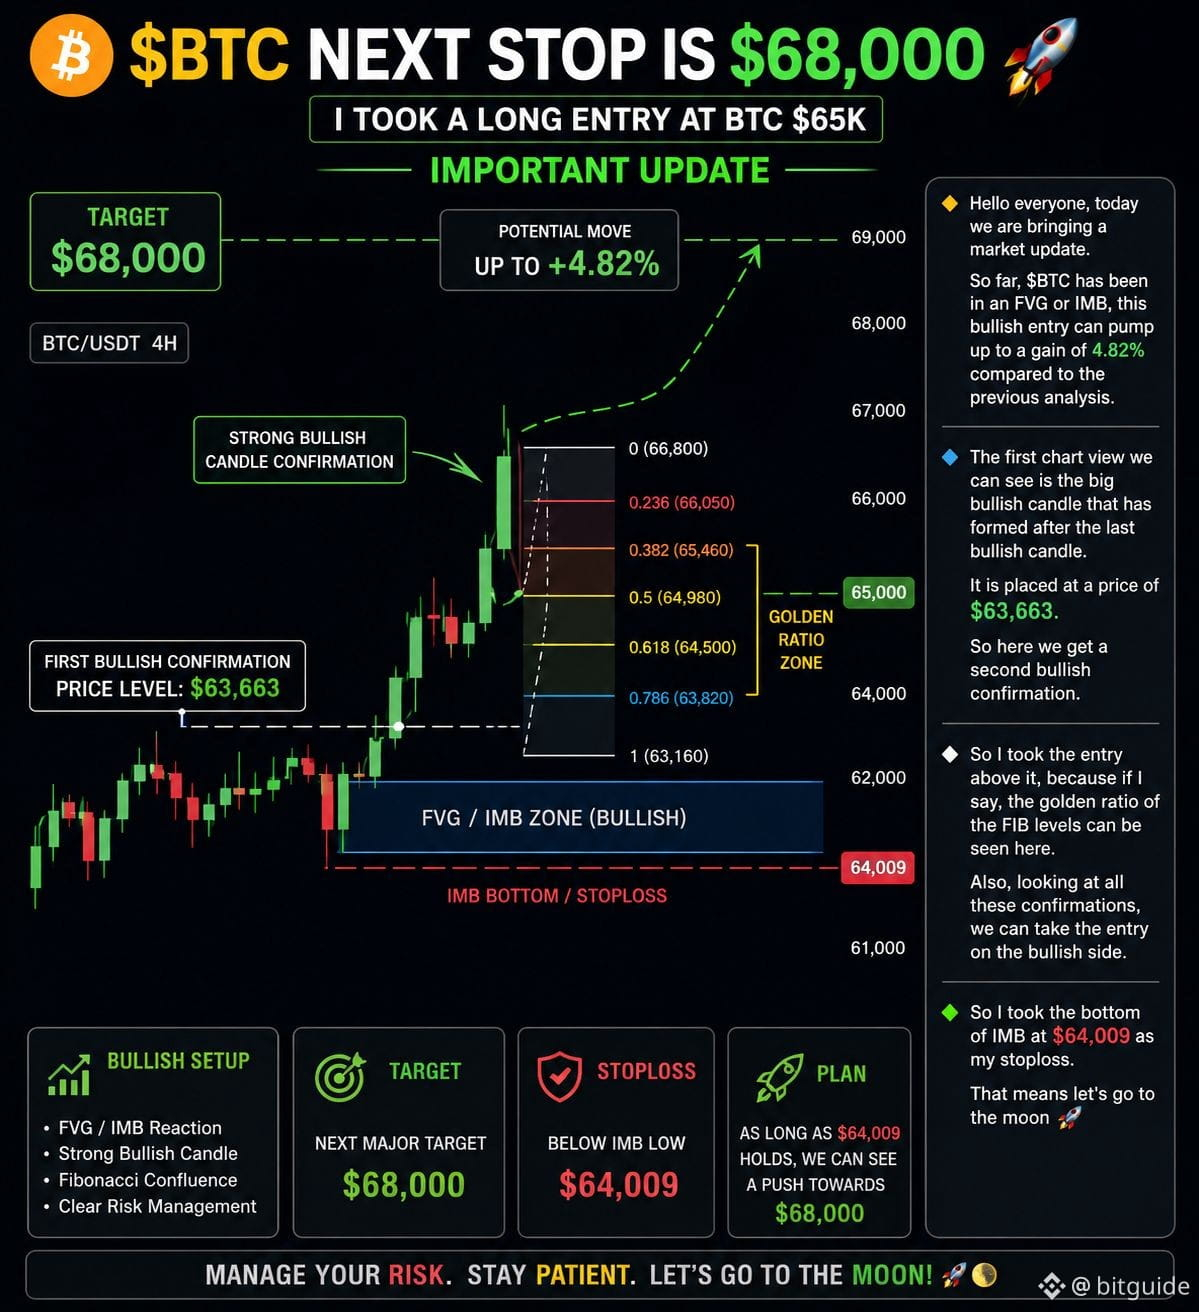
$BTC 看起來真的很看漲。
我在大約$65K時進入了一個多頭頭寸,圖表給出了多個確認信號,表明這波行情可能還沒有結束。
第一個信號是FVG/IMB區域的強烈看漲反應。之後,BTC在前一根蠟燭之上又印刷了一根大陽線,確認買家仍然掌控着市場。
對我來說,關鍵水平在$63,663左右。一旦價格在該區域上方顯示出強勁勢頭,看漲的案例就變得更強了。
從斐波那契結構來看,黃金比例區域也與這個設置一致,增加了另一個確認層。這就是我決定採取多頭入場的原因。
我的無效水平保持在IMB低點下方,約$64,009,這也作爲我的止損位。
只要這個水平保持,下一目標大約在$68,000。
這個設置很簡單:
✅ FVG/IMB反應
✅ 強勁的看漲蠟燭確認
✅ 斐波那契匯聚
✅ 清晰的風險管理
現在讓我們看看BTC是否有足夠的動能向$68K發起衝刺。🚀
你對比特幣的看法是什麼?
#BTC #比特幣 #加密 #交易 #Bullish
$BTC
{future}(BTCUSDT)
$BTC 看起來真的很看漲。
我在大約$65K時進入了一個多頭頭寸,圖表給出了多個確認信號,表明這波行情可能還沒有結束。
第一個信號是FVG/IMB區域的強烈看漲反應。之後,BTC在前一根蠟燭之上又印刷了一根大陽線,確認買家仍然掌控着市場。
對我來說,關鍵水平在$63,663左右。一旦價格在該區域上方顯示出強勁勢頭,看漲的案例就變得更強了。
從斐波那契結構來看,黃金比例區域也與這個設置一致,增加了另一個確認層。這就是我決定採取多頭入場的原因。
我的無效水平保持在IMB低點下方,約$64,009,這也作爲我的止損位。
只要這個水平保持,下一目標大約在$68,000。
這個設置很簡單:
✅ FVG/IMB反應
✅ 強勁的看漲蠟燭確認
✅ 斐波那契匯聚
✅ 清晰的風險管理
現在讓我們看看BTC是否有足夠的動能向$68K發起衝刺。🚀
你對比特幣的看法是什麼?
#BTC #比特幣 #加密 #交易 #Bullish
$BTC
我在大約$65K時進入了一個多頭頭寸,圖表給出了多個確認信號,表明這波行情可能還沒有結束。
第一個信號是FVG/IMB區域的強烈看漲反應。之後,BTC在前一根蠟燭之上又印刷了一根大陽線,確認買家仍然掌控着市場。
對我來說,關鍵水平在$63,663左右。一旦價格在該區域上方顯示出強勁勢頭,看漲的案例就變得更強了。
從斐波那契結構來看,黃金比例區域也與這個設置一致,增加了另一個確認層。這就是我決定採取多頭入場的原因。
我的無效水平保持在IMB低點下方,約$64,009,這也作爲我的止損位。
只要這個水平保持,下一目標大約在$68,000。
這個設置很簡單:
✅ FVG/IMB反應
✅ 強勁的看漲蠟燭確認
✅ 斐波那契匯聚
✅ 清晰的風險管理
現在讓我們看看BTC是否有足夠的動能向$68K發起衝刺。🚀
你對比特幣的看法是什麼?
#BTC #比特幣 #加密 #交易 #Bullish
$BTC
78
·
--
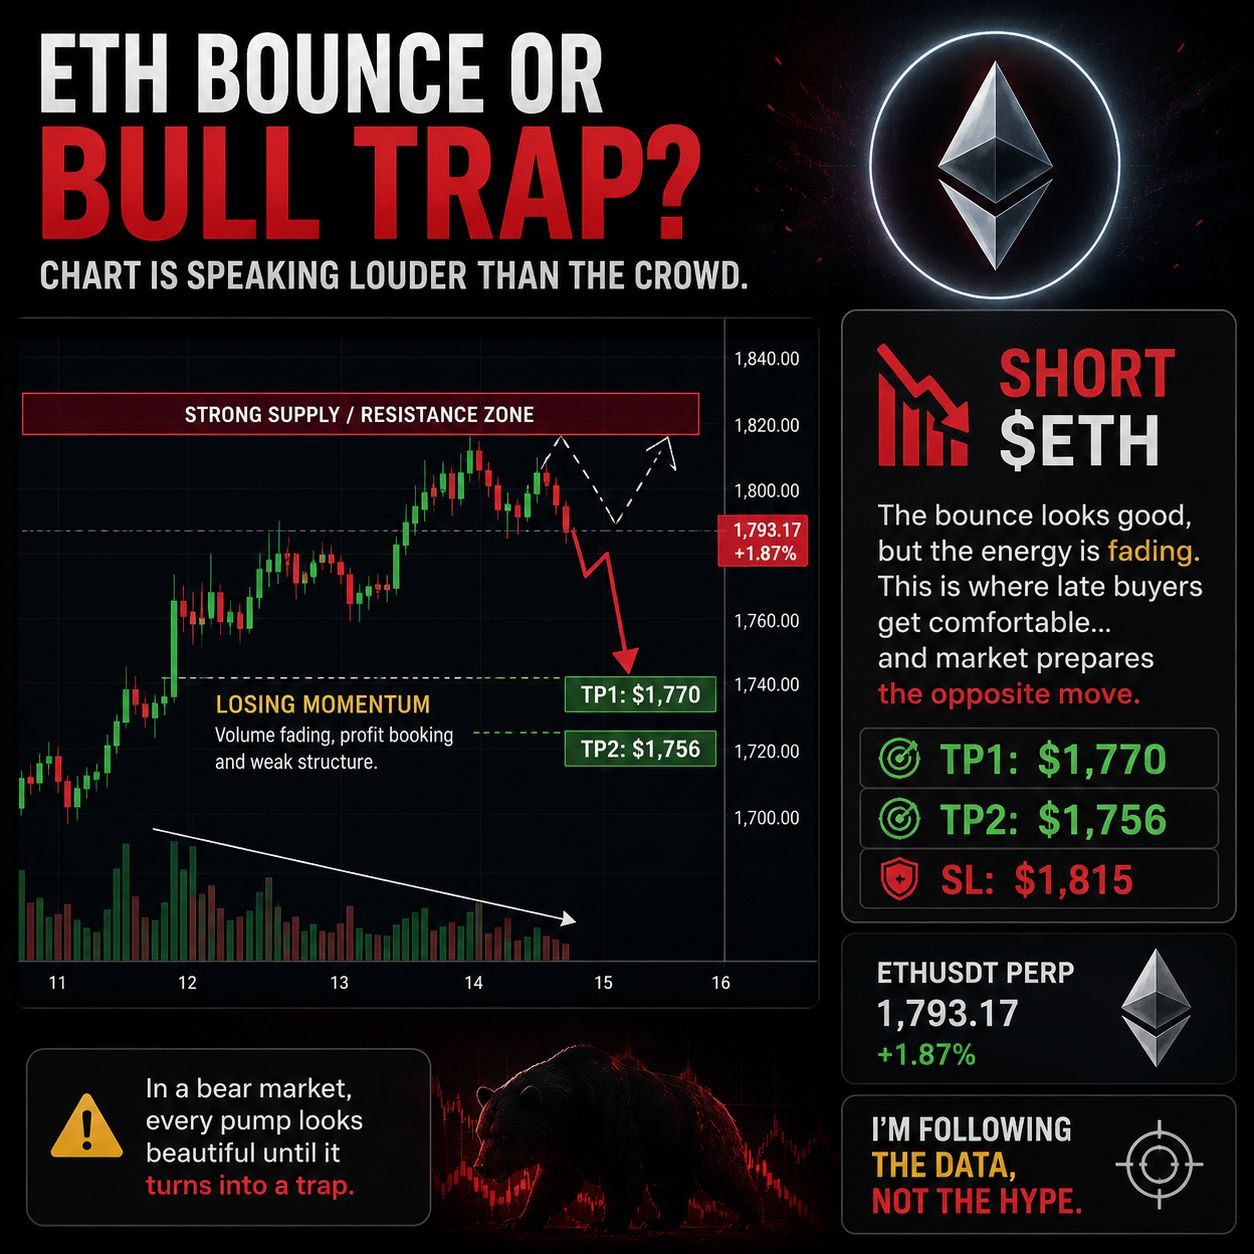
$ETH 處於一個圖表比人羣更重要的水平。
很多交易者稱這是強勁的反彈,但我看到的卻是另一幅圖景。
最開始的反彈看起來不錯,但動能開始減弱。成交量在下降,獲利了結的情況在增加,價格結構並沒有顯示出我希望看到的可持續突破的那種強度。
這通常是後期買家變得舒適的階段……市場開始醞釀相反的走勢。
我並不是說$ETH 已經完了,但我對這次反彈不夠信任,無法追高。
對我來說,目前的風險/收益更傾向於從這個區域做空。
📉 做空 $ETH
🎯 TP1: $1,770
🎯 TP2: $1,756
🛑 SL: $1,815
在熊市中,每一次拉昇看起來都很有說服力,直到它變成一個陷阱。
我在跟蹤數據,而不是嗡嗡聲。
#ETH #以太坊 #ETHUSDT #加密 #交易 #比特幣 #山寨幣 #加密交易 #技術分析 #Binance
$ETH
{future}(ETHUSDT)
$ETH 處於一個圖表比人羣更重要的水平。
很多交易者稱這是強勁的反彈,但我看到的卻是另一幅圖景。
最開始的反彈看起來不錯,但動能開始減弱。成交量在下降,獲利了結的情況在增加,價格結構並沒有顯示出我希望看到的可持續突破的那種強度。
這通常是後期買家變得舒適的階段……市場開始醞釀相反的走勢。
我並不是說$ETH 已經完了,但我對這次反彈不夠信任,無法追高。
對我來說,目前的風險/收益更傾向於從這個區域做空。
📉 做空 $ETH
🎯 TP1: $1,770
🎯 TP2: $1,756
🛑 SL: $1,815
在熊市中,每一次拉昇看起來都很有說服力,直到它變成一個陷阱。
我在跟蹤數據,而不是嗡嗡聲。
#ETH #以太坊 #ETHUSDT #加密 #交易 #比特幣 #山寨幣 #加密交易 #技術分析 #Binance
$ETH
很多交易者稱這是強勁的反彈,但我看到的卻是另一幅圖景。
最開始的反彈看起來不錯,但動能開始減弱。成交量在下降,獲利了結的情況在增加,價格結構並沒有顯示出我希望看到的可持續突破的那種強度。
這通常是後期買家變得舒適的階段……市場開始醞釀相反的走勢。
我並不是說$ETH 已經完了,但我對這次反彈不夠信任,無法追高。
對我來說,目前的風險/收益更傾向於從這個區域做空。
📉 做空 $ETH
🎯 TP1: $1,770
🎯 TP2: $1,756
🛑 SL: $1,815
在熊市中,每一次拉昇看起來都很有說服力,直到它變成一個陷阱。
我在跟蹤數據,而不是嗡嗡聲。
#ETH #以太坊 #ETHUSDT #加密 #交易 #比特幣 #山寨幣 #加密交易 #技術分析 #Binance
$ETH
78
·
--
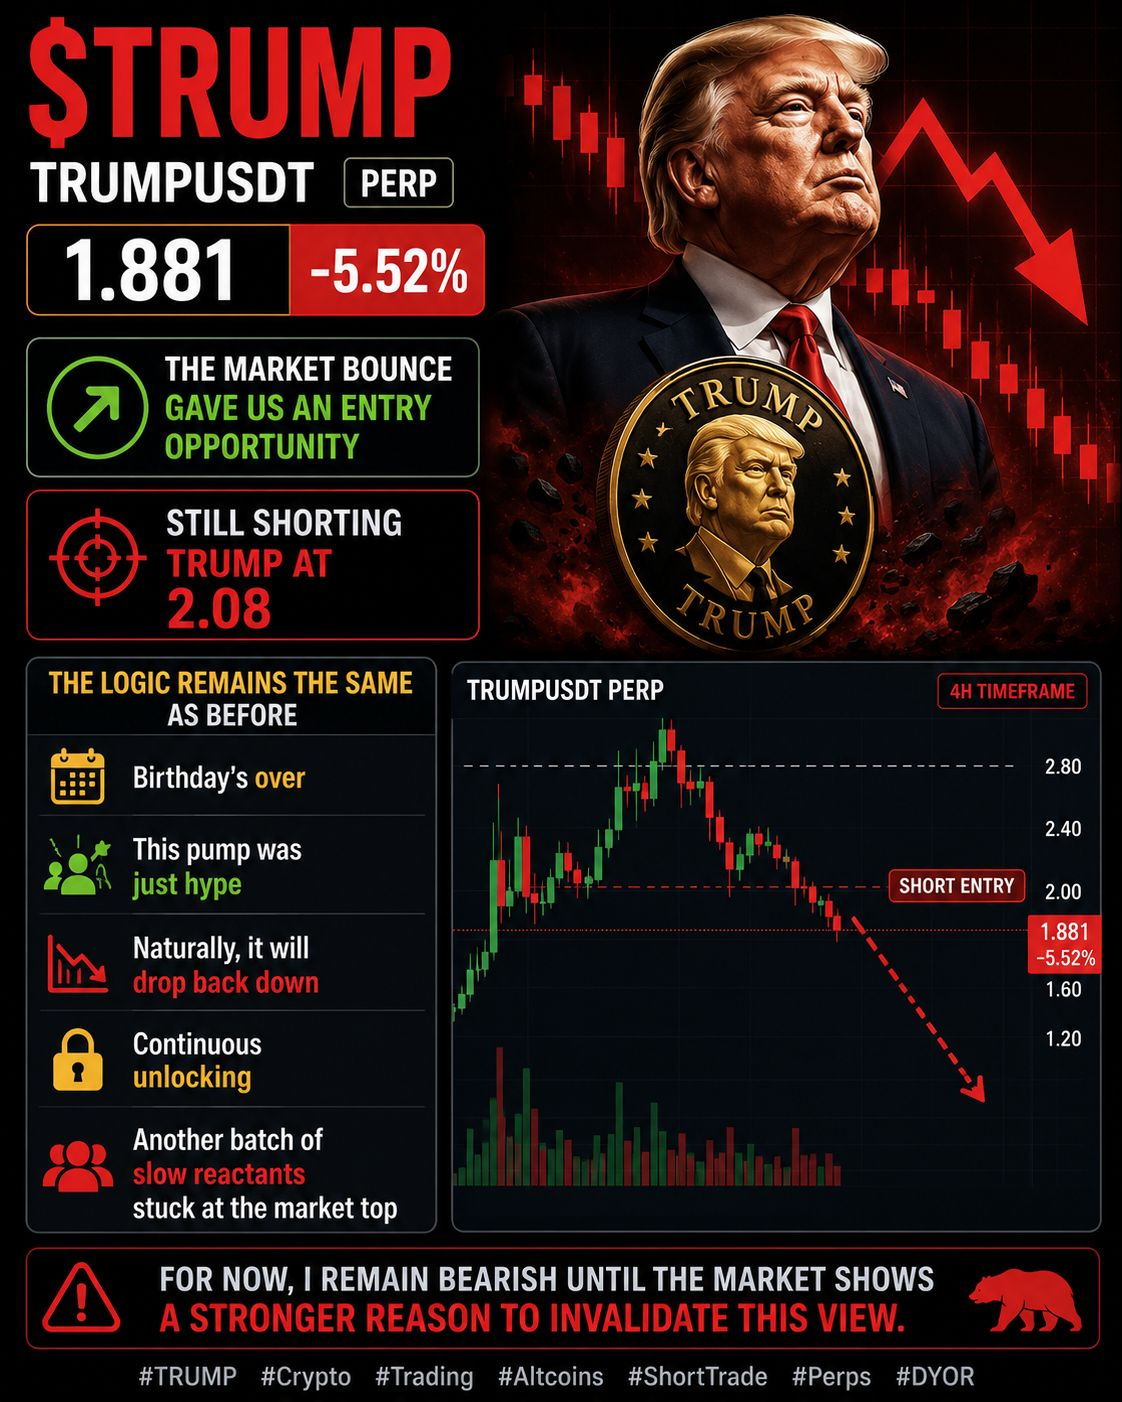
> $TRUMP — 仍然顯得疲軟
最近市場的反彈提供了不錯的進場機會,我仍然在持有大約 $2.08 的空單。
我的觀點沒有改變。
受生日驅動的反彈已經過去,而那次上漲看起來更像是短期的炒作,而非可持續的趨勢。隨着興奮感的減退,價格可能會逐漸回撤到較低的水平。
再加上,持續的代幣解鎖增加了額外的供應壓力,而許多晚買的投資者似乎被困在近期的高點附近。
目前,我仍然看跌,直到市場出現更強的理由來推翻這個觀點。
#特朗普 #加密 #交易 #山寨幣 #空單交易 #幣安廣場 #加密分析 #合約 📉🔥
$TRUMP
{future}(TRUMPUSDT)
> $TRUMP — 仍然顯得疲軟
最近市場的反彈提供了不錯的進場機會,我仍然在持有大約 $2.08 的空單。
我的觀點沒有改變。
受生日驅動的反彈已經過去,而那次上漲看起來更像是短期的炒作,而非可持續的趨勢。隨着興奮感的減退,價格可能會逐漸回撤到較低的水平。
再加上,持續的代幣解鎖增加了額外的供應壓力,而許多晚買的投資者似乎被困在近期的高點附近。
目前,我仍然看跌,直到市場出現更強的理由來推翻這個觀點。
#特朗普 #加密 #交易 #山寨幣 #空單交易 #幣安廣場 #加密分析 #合約 📉🔥
$TRUMP
最近市場的反彈提供了不錯的進場機會,我仍然在持有大約 $2.08 的空單。
我的觀點沒有改變。
受生日驅動的反彈已經過去,而那次上漲看起來更像是短期的炒作,而非可持續的趨勢。隨着興奮感的減退,價格可能會逐漸回撤到較低的水平。
再加上,持續的代幣解鎖增加了額外的供應壓力,而許多晚買的投資者似乎被困在近期的高點附近。
目前,我仍然看跌,直到市場出現更強的理由來推翻這個觀點。
#特朗普 #加密 #交易 #山寨幣 #空單交易 #幣安廣場 #加密分析 #合約 📉🔥
$TRUMP
180
·
--
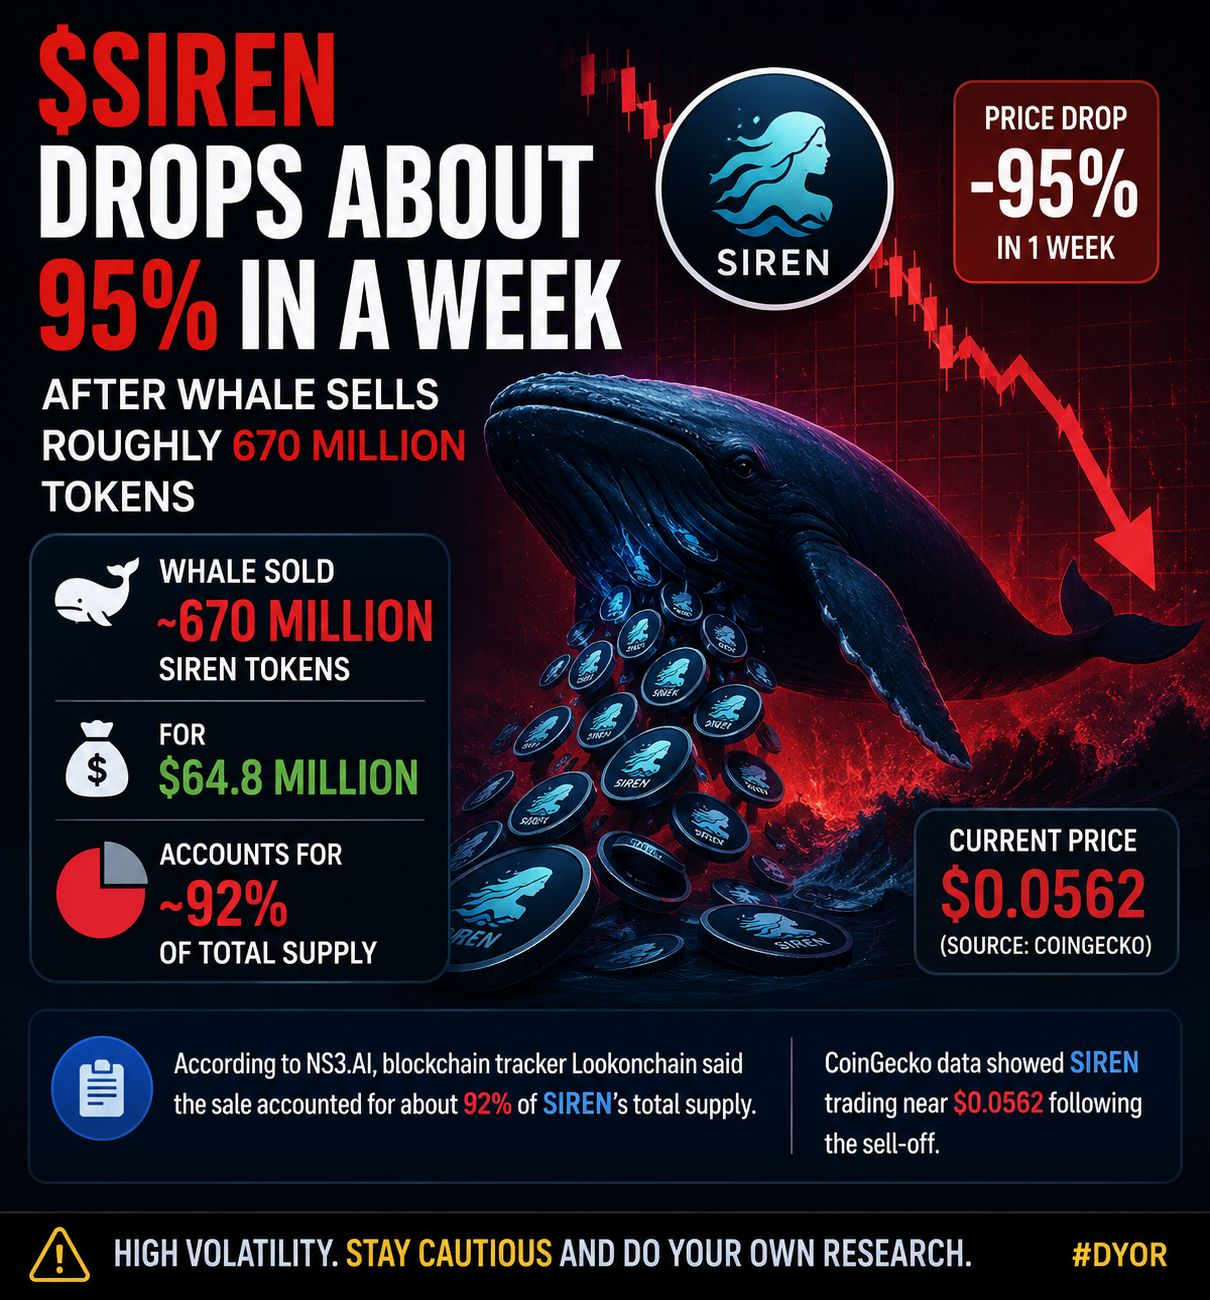
$SIREN 剛被打擊了。
該代幣在一週內暴跌約95%,原因是一位大戶拋售了大約670百萬SIREN,套現近6480萬美元。
根據區塊鏈數據,這筆交易代表了流通供應量的92%,造成了巨大的賣壓,徹底改變了市場情緒。
$SIREN 現在的交易價格接近$0.056,這一走勢提醒我們,當供應集中度極高時,單個錢包可以對價格產生巨大影響。
目前,交易者應保持謹慎,觀察買方是否能建立新的支撐區,之後再考慮任何反彈的敘事。
#SIREN #加密貨幣 #山寨幣 #鯨魚警報 #幣安廣場 #交易 #加密新聞 #區塊鏈 🚨📉$SIREN
{future}(SIRENUSDT)
$SIREN 剛被打擊了。
該代幣在一週內暴跌約95%,原因是一位大戶拋售了大約670百萬SIREN,套現近6480萬美元。
根據區塊鏈數據,這筆交易代表了流通供應量的92%,造成了巨大的賣壓,徹底改變了市場情緒。
$SIREN 現在的交易價格接近$0.056,這一走勢提醒我們,當供應集中度極高時,單個錢包可以對價格產生巨大影響。
目前,交易者應保持謹慎,觀察買方是否能建立新的支撐區,之後再考慮任何反彈的敘事。
#SIREN #加密貨幣 #山寨幣 #鯨魚警報 #幣安廣場 #交易 #加密新聞 #區塊鏈 🚨📉$SIREN
該代幣在一週內暴跌約95%,原因是一位大戶拋售了大約670百萬SIREN,套現近6480萬美元。
根據區塊鏈數據,這筆交易代表了流通供應量的92%,造成了巨大的賣壓,徹底改變了市場情緒。
$SIREN 現在的交易價格接近$0.056,這一走勢提醒我們,當供應集中度極高時,單個錢包可以對價格產生巨大影響。
目前,交易者應保持謹慎,觀察買方是否能建立新的支撐區,之後再考慮任何反彈的敘事。
#SIREN #加密貨幣 #山寨幣 #鯨魚警報 #幣安廣場 #交易 #加密新聞 #區塊鏈 🚨📉$SIREN
95
·
--
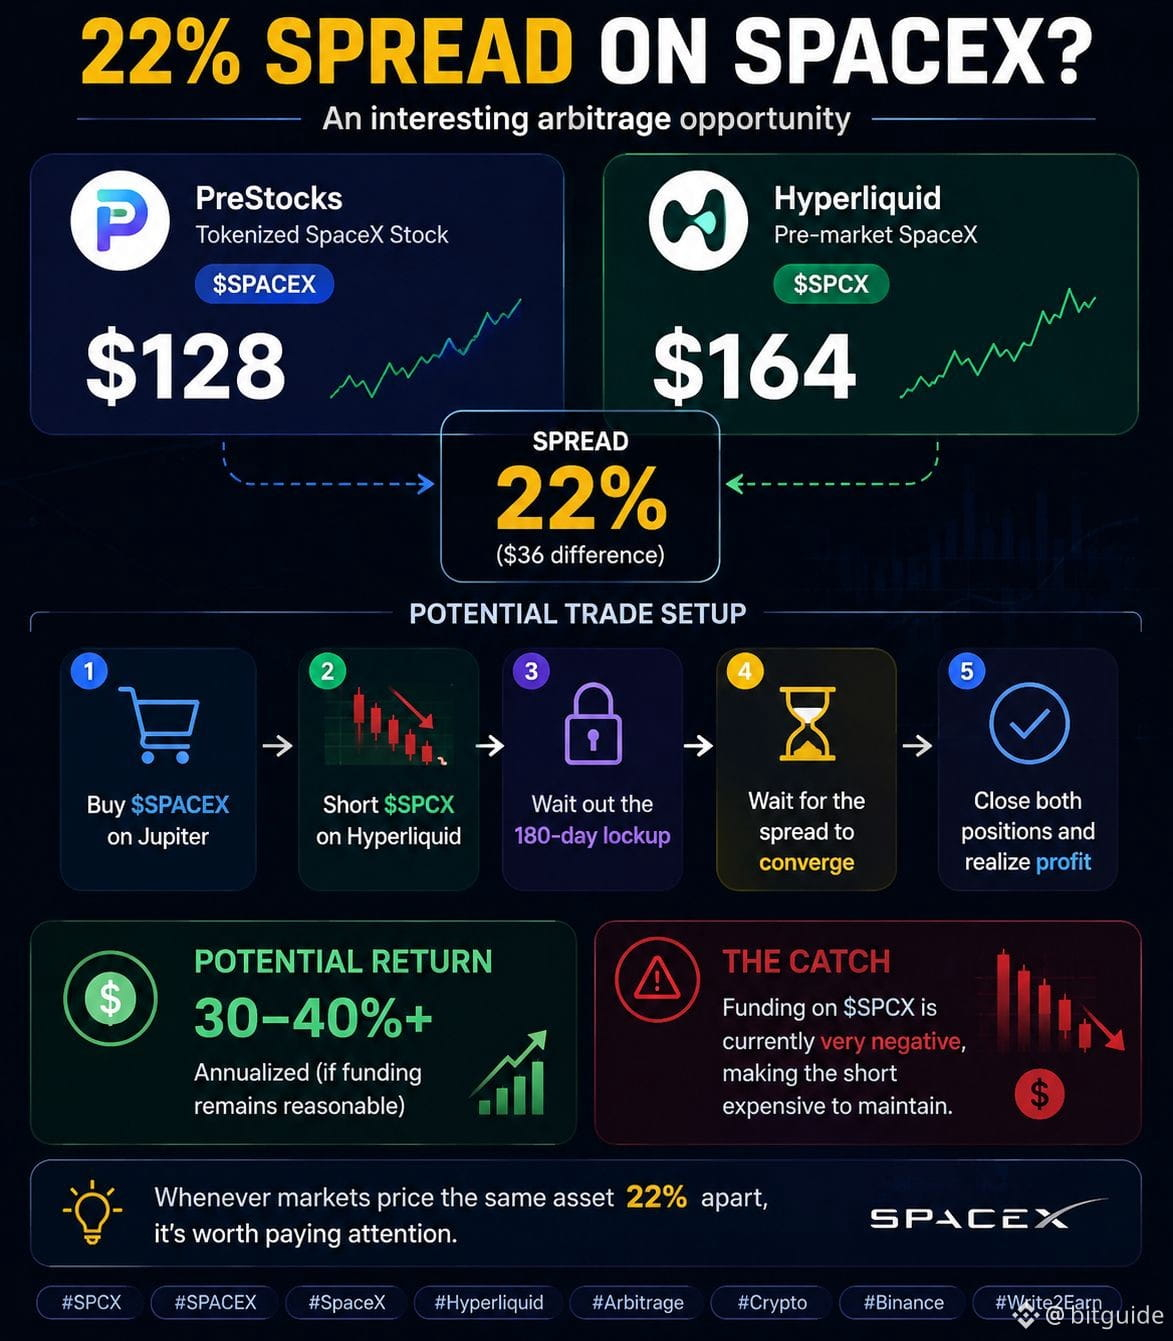
圍繞SpaceX的盤前估值正在形成有趣的佈局。
• PreStocks 的代幣化 SpaceX ($SPACEX) 交易價格約爲 $128
• Hyperliquid 的盤前 SpaceX ($SPCX) 交易價格接近 $164
這幾乎有 22% 的巨大價差。
一個潛在的策略:
→ 買入 $SPACEX
→ 對衝做空 $SPCX
→ 在鎖定期內持有
→ 當估值差縮小時退出
如果融資成本正常化,目前的折扣可能轉化爲非常有吸引力的年化收益。
主要風險?融資在 $SPCX 上仍然非常負面,使得做空的成本昂貴。
不過,每當兩個市場對同一資產的定價相差如此之大時,這都是值得密切關注的事情。
#SPCX #SPACEX #SpaceX #Hyperliquid #Crypto #Arbitrage #Binance #Write2Earn
$SPCX
{future}(SPCXUSDT)
圍繞SpaceX的盤前估值正在形成有趣的佈局。
• PreStocks 的代幣化 SpaceX ($SPACEX) 交易價格約爲 $128
• Hyperliquid 的盤前 SpaceX ($SPCX ) 交易價格接近 $164
這幾乎有 22% 的巨大價差。
一個潛在的策略:
→ 買入 $SPACEX
→ 對衝做空 $SPCX
→ 在鎖定期內持有
→ 當估值差縮小時退出
如果融資成本正常化,目前的折扣可能轉化爲非常有吸引力的年化收益。
主要風險?融資在 $SPCX 上仍然非常負面,使得做空的成本昂貴。
不過,每當兩個市場對同一資產的定價相差如此之大時,這都是值得密切關注的事情。
#SPCX #SPACEX #SpaceX #Hyperliquid #Crypto #Arbitrage #Binance #Write2Earn
$SPCX
• PreStocks 的代幣化 SpaceX ($SPACEX) 交易價格約爲 $128
• Hyperliquid 的盤前 SpaceX ($SPCX ) 交易價格接近 $164
這幾乎有 22% 的巨大價差。
一個潛在的策略:
→ 買入 $SPACEX
→ 對衝做空 $SPCX
→ 在鎖定期內持有
→ 當估值差縮小時退出
如果融資成本正常化,目前的折扣可能轉化爲非常有吸引力的年化收益。
主要風險?融資在 $SPCX 上仍然非常負面,使得做空的成本昂貴。
不過,每當兩個市場對同一資產的定價相差如此之大時,這都是值得密切關注的事情。
#SPCX #SPACEX #SpaceX #Hyperliquid #Crypto #Arbitrage #Binance #Write2Earn
$SPCX
80
·
--
看漲
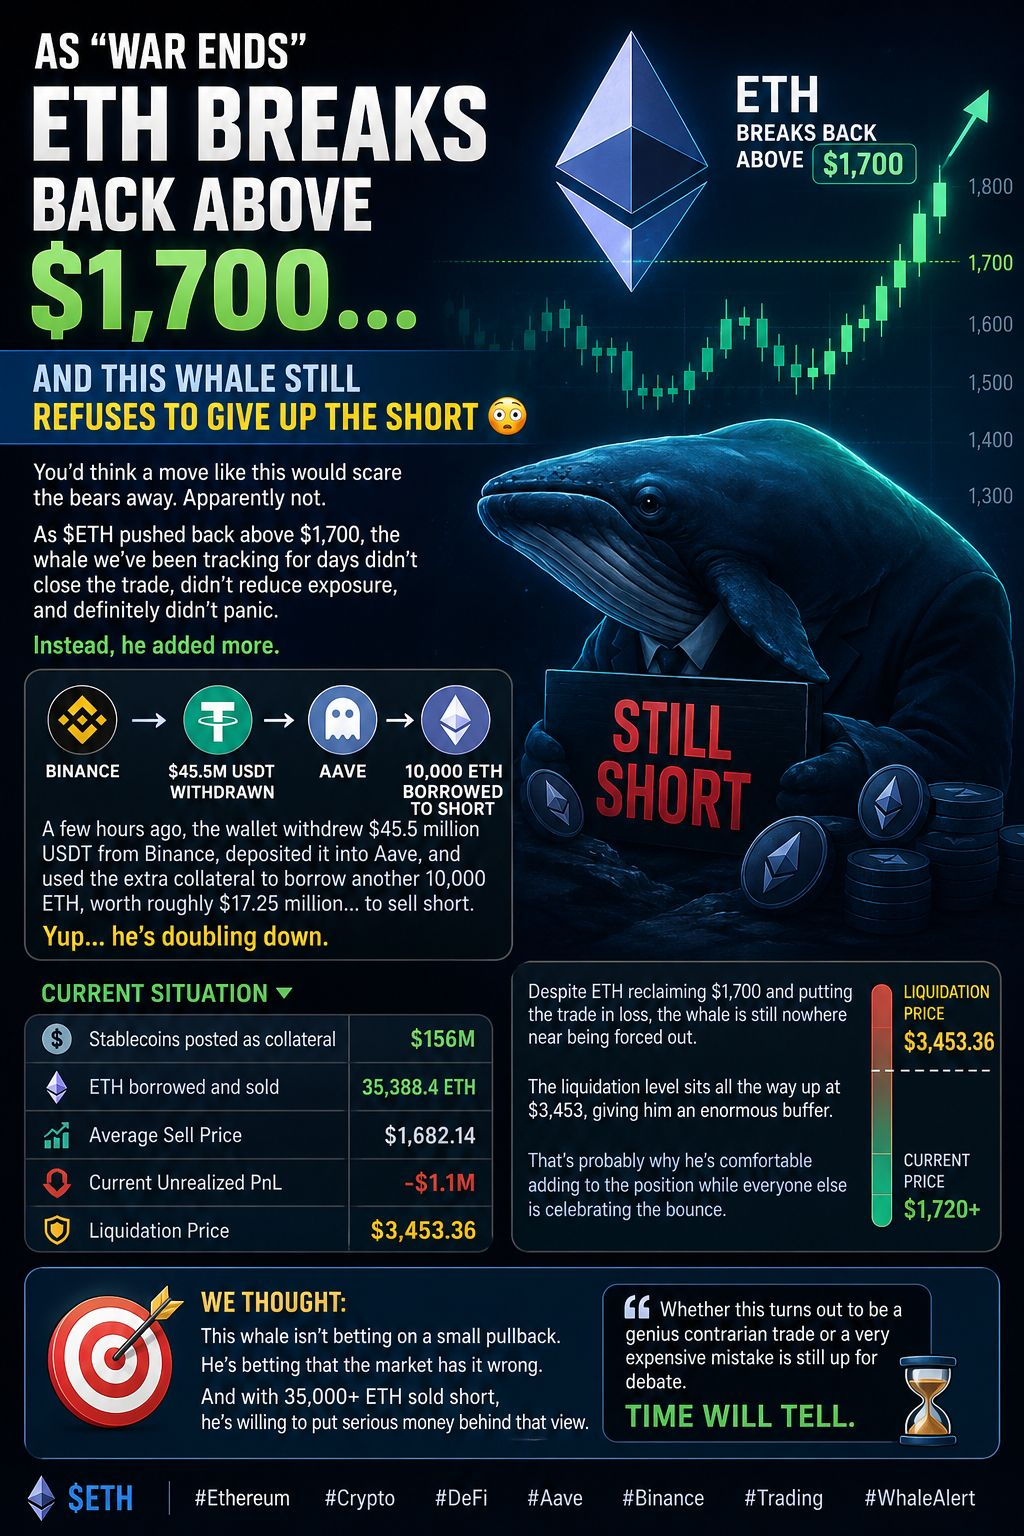
🚨 ETH 回升至 $1,700... 但這條鯨魚依然不退縮
當市場慶祝 ETH 重回 $1,700 時,一條鯨魚卻做出了與大多數交易者預期完全相反的舉動。
這條鯨魚沒有平倉或降低風險,而是加倍下注。
幾小時前,該錢包從 Binance 提取了 $45.5M USDT,作爲額外抵押物存入 Aave,並借入了另外 10,000 ETH(約 $17.25M),以增加空頭頭寸。
📊 當前頭寸:
• 抵押物:$156M 的穩定幣
• 借入並出售的 ETH:35,388.4 ETH
• 平均賣出價格:$1,682.14
• 未實現盈虧:-$1.1M
• 清算價格:$3,453.36
儘管 ETH 的交易價格高於平均入場價,且頭寸處於虧損狀態,這條鯨魚仍然遠未面臨清算。由於清算水平在 $3,400 以上,這筆交易仍有充足的喘息空間。
這不是對小幅回調的押注。
這是對市場錯誤定價 ETH 的高信心押注,背後有超過 35,000 ETH 的空頭支撐。
這會成爲傳奇的逆向交易... 還是一次非常昂貴的教訓?
時間會證明一切。
$ETH #以太坊 #加密貨幣 #去中心化金融 #Aave #幣安 #交易 #WhaleAlert
$ETH
{future}(ETHUSDT)
🚨 ETH 回升至 $1,700... 但這條鯨魚依然不退縮
當市場慶祝 ETH 重回 $1,700 時,一條鯨魚卻做出了與大多數交易者預期完全相反的舉動。
這條鯨魚沒有平倉或降低風險,而是加倍下注。
幾小時前,該錢包從 Binance 提取了 $45.5M USDT,作爲額外抵押物存入 Aave,並借入了另外 10,000 ETH(約 $17.25M),以增加空頭頭寸。
📊 當前頭寸:
• 抵押物:$156M 的穩定幣
• 借入並出售的 ETH:35,388.4 ETH
• 平均賣出價格:$1,682.14
• 未實現盈虧:-$1.1M
• 清算價格:$3,453.36
儘管 ETH 的交易價格高於平均入場價,且頭寸處於虧損狀態,這條鯨魚仍然遠未面臨清算。由於清算水平在 $3,400 以上,這筆交易仍有充足的喘息空間。
這不是對小幅回調的押注。
這是對市場錯誤定價 ETH 的高信心押注,背後有超過 35,000 ETH 的空頭支撐。
這會成爲傳奇的逆向交易... 還是一次非常昂貴的教訓?
時間會證明一切。
$ETH #以太坊 #加密貨幣 #去中心化金融 #Aave #幣安 #交易 #WhaleAlert
$ETH
當市場慶祝 ETH 重回 $1,700 時,一條鯨魚卻做出了與大多數交易者預期完全相反的舉動。
這條鯨魚沒有平倉或降低風險,而是加倍下注。
幾小時前,該錢包從 Binance 提取了 $45.5M USDT,作爲額外抵押物存入 Aave,並借入了另外 10,000 ETH(約 $17.25M),以增加空頭頭寸。
📊 當前頭寸:
• 抵押物:$156M 的穩定幣
• 借入並出售的 ETH:35,388.4 ETH
• 平均賣出價格:$1,682.14
• 未實現盈虧:-$1.1M
• 清算價格:$3,453.36
儘管 ETH 的交易價格高於平均入場價,且頭寸處於虧損狀態,這條鯨魚仍然遠未面臨清算。由於清算水平在 $3,400 以上,這筆交易仍有充足的喘息空間。
這不是對小幅回調的押注。
這是對市場錯誤定價 ETH 的高信心押注,背後有超過 35,000 ETH 的空頭支撐。
這會成爲傳奇的逆向交易... 還是一次非常昂貴的教訓?
時間會證明一切。
$ETH #以太坊 #加密貨幣 #去中心化金融 #Aave #幣安 #交易 #WhaleAlert
$ETH
65
·
--
⚠️ 現在購買 VELVET 可能極其風險
我以前見過這種情況。
幾個月前,許多交易員 rushed 進入 SIREN 和 RAVE 的拋售,堅信會有大幅反彈。但事情並沒有按照大多數人的預期發展。
現實很簡單:當一個代幣經歷爆炸性上漲後又遭遇慘烈回調,立即回到新高並不是必然的。
歷史表明,許多代幣能夠實現 50x、100x,甚至 200x 的漲幅,但往往難以重新奪回之前的高點。動能消退,敘事輪換,流動性流向其他地方。
這並不意味着代幣不能恢復——但盲目買入只是因爲“它跌得很厲害”並不是一種策略。
📊 專注於市場結構。
📊 觀察成交量和流動性。
📊 讓圖表確認強勢後再假設反轉。
耐心往往勝過 FOMO。
DYOR。NFA。
#VELVET #加密 #交易 #另類幣 #BinanceAlpha #市場分析 #DYOR
$VELVET
{future}(VELVETUSDT)
$SIREN
{future}(SIRENUSDT)
$RAVE
{future}(RAVEUSDT)
⚠️ 現在購買 VELVET 可能極其風險
我以前見過這種情況。
幾個月前,許多交易員 rushed 進入 SIREN 和 RAVE 的拋售,堅信會有大幅反彈。但事情並沒有按照大多數人的預期發展。
現實很簡單:當一個代幣經歷爆炸性上漲後又遭遇慘烈回調,立即回到新高並不是必然的。
歷史表明,許多代幣能夠實現 50x、100x,甚至 200x 的漲幅,但往往難以重新奪回之前的高點。動能消退,敘事輪換,流動性流向其他地方。
這並不意味着代幣不能恢復——但盲目買入只是因爲“它跌得很厲害”並不是一種策略。
📊 專注於市場結構。
📊 觀察成交量和流動性。
📊 讓圖表確認強勢後再假設反轉。
耐心往往勝過 FOMO。
DYOR。NFA。
#VELVET #加密 #交易 #另類幣 #BinanceAlpha #市場分析 #DYOR
$VELVET
$SIREN
$RAVE
我以前見過這種情況。
幾個月前,許多交易員 rushed 進入 SIREN 和 RAVE 的拋售,堅信會有大幅反彈。但事情並沒有按照大多數人的預期發展。
現實很簡單:當一個代幣經歷爆炸性上漲後又遭遇慘烈回調,立即回到新高並不是必然的。
歷史表明,許多代幣能夠實現 50x、100x,甚至 200x 的漲幅,但往往難以重新奪回之前的高點。動能消退,敘事輪換,流動性流向其他地方。
這並不意味着代幣不能恢復——但盲目買入只是因爲“它跌得很厲害”並不是一種策略。
📊 專注於市場結構。
📊 觀察成交量和流動性。
📊 讓圖表確認強勢後再假設反轉。
耐心往往勝過 FOMO。
DYOR。NFA。
#VELVET #加密 #交易 #另類幣 #BinanceAlpha #市場分析 #DYOR
$VELVET
$SIREN
$RAVE
752
·
--
🚀 $42,604 可能馬上就要進我的口袋了。🤑
我在密切關注 $VELVET ,因爲看起來大動作快要來了,而大多數人仍然沒有注意到。
🎯 目標價格 (TP): $0.80
讓我們看看市場在爲時已晚之前是否能跟上。
#VELVET #加密貨幣 #山寨幣 #加密交易 #交易設置 #看漲 #加密社區 #DYOR #山寨季 #CryptoGems
$VELVET
{future}(VELVETUSDT)
🚀 $42,604 可能馬上就要進我的口袋了。🤑
我在密切關注 $VELVET ,因爲看起來大動作快要來了,而大多數人仍然沒有注意到。
🎯 目標價格 (TP): $0.80
讓我們看看市場在爲時已晚之前是否能跟上。
#VELVET #加密貨幣 #山寨幣 #加密交易 #交易設置 #看漲 #加密社區 #DYOR #山寨季 #CryptoGems
$VELVET
我在密切關注 $VELVET ,因爲看起來大動作快要來了,而大多數人仍然沒有注意到。
🎯 目標價格 (TP): $0.80
讓我們看看市場在爲時已晚之前是否能跟上。
#VELVET #加密貨幣 #山寨幣 #加密交易 #交易設置 #看漲 #加密社區 #DYOR #山寨季 #CryptoGems
$VELVET
156
·
--
📈 韓國股市正朝着一個重大里程碑邁進。
在近幾年最動盪的一週之後,韓國股票正在朝着滿足MSCI升級爲發達市場狀態的要求邁進。這種晉升可能會吸引大量全球投資流入,並進一步增強對該國金融市場的信心。
最近的市場波動並沒有 derail 進展,投資者密切關注韓國是否能最終實現他們多年來追求的發達市場分類。
#SouthKorea #Stocks #MSCI #StockMarket #Investing #GlobalMarkets #Finance #Trading #MarketNews #Equities
$EWY
{future}(EWYUSDT)
📈 韓國股市正朝着一個重大里程碑邁進。
在近幾年最動盪的一週之後,韓國股票正在朝着滿足MSCI升級爲發達市場狀態的要求邁進。這種晉升可能會吸引大量全球投資流入,並進一步增強對該國金融市場的信心。
最近的市場波動並沒有 derail 進展,投資者密切關注韓國是否能最終實現他們多年來追求的發達市場分類。
#SouthKorea #Stocks #MSCI #StockMarket #Investing #GlobalMarkets #Finance #Trading #MarketNews #Equities
$EWY
在近幾年最動盪的一週之後,韓國股票正在朝着滿足MSCI升級爲發達市場狀態的要求邁進。這種晉升可能會吸引大量全球投資流入,並進一步增強對該國金融市場的信心。
最近的市場波動並沒有 derail 進展,投資者密切關注韓國是否能最終實現他們多年來追求的發達市場分類。
#SouthKorea #Stocks #MSCI #StockMarket #Investing #GlobalMarkets #Finance #Trading #MarketNews #Equities
$EWY
72
·
--
比特幣強勁反彈!宏觀緩解和SpaceX熱潮將BTC推回$64K以上 📈🔥🚨 比特幣幾個月來的最差一週... 但多頭倖存。
從大約$73K崩跌至$60K以下,震盪了弱手,導致市場恐慌。拋售始於策略賣出32 BTC,引發了即使是最大的比特幣信徒也可能改變策略的擔憂。
但真正的壓力來自宏觀不確定性:
📉 伊朗緊張局勢加劇
📉 油價上漲
📉 市場風險偏好疲弱
然後一切都翻轉了。
✅ 伊朗緊張局勢緩解
✅ 油價降溫
比特幣強勁反彈!宏觀緩解和SpaceX熱潮將BTC推回$64K以上 📈🔥
🚨 比特幣幾個月來的最差一週... 但多頭倖存。
從大約$73K崩跌至$60K以下,震盪了弱手,導致市場恐慌。拋售始於策略賣出32 BTC,引發了即使是最大的比特幣信徒也可能改變策略的擔憂。
但真正的壓力來自宏觀不確定性:
📉 伊朗緊張局勢加劇
📉 油價上漲
📉 市場風險偏好疲弱
然後一切都翻轉了。
✅ 伊朗緊張局勢緩解
✅ 油價降溫
從大約$73K崩跌至$60K以下,震盪了弱手,導致市場恐慌。拋售始於策略賣出32 BTC,引發了即使是最大的比特幣信徒也可能改變策略的擔憂。
但真正的壓力來自宏觀不確定性:
📉 伊朗緊張局勢加劇
📉 油價上漲
📉 市場風險偏好疲弱
然後一切都翻轉了。
✅ 伊朗緊張局勢緩解
✅ 油價降溫
51
·
--
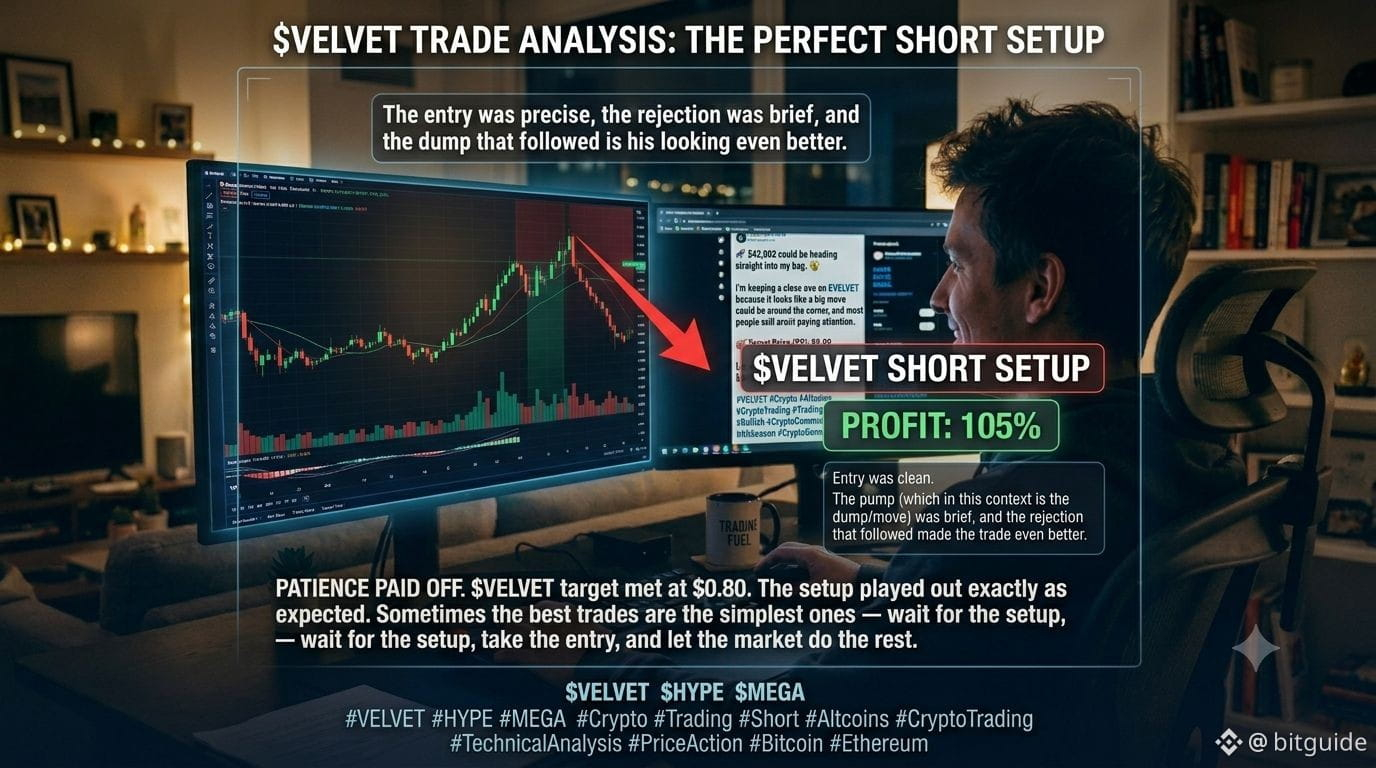
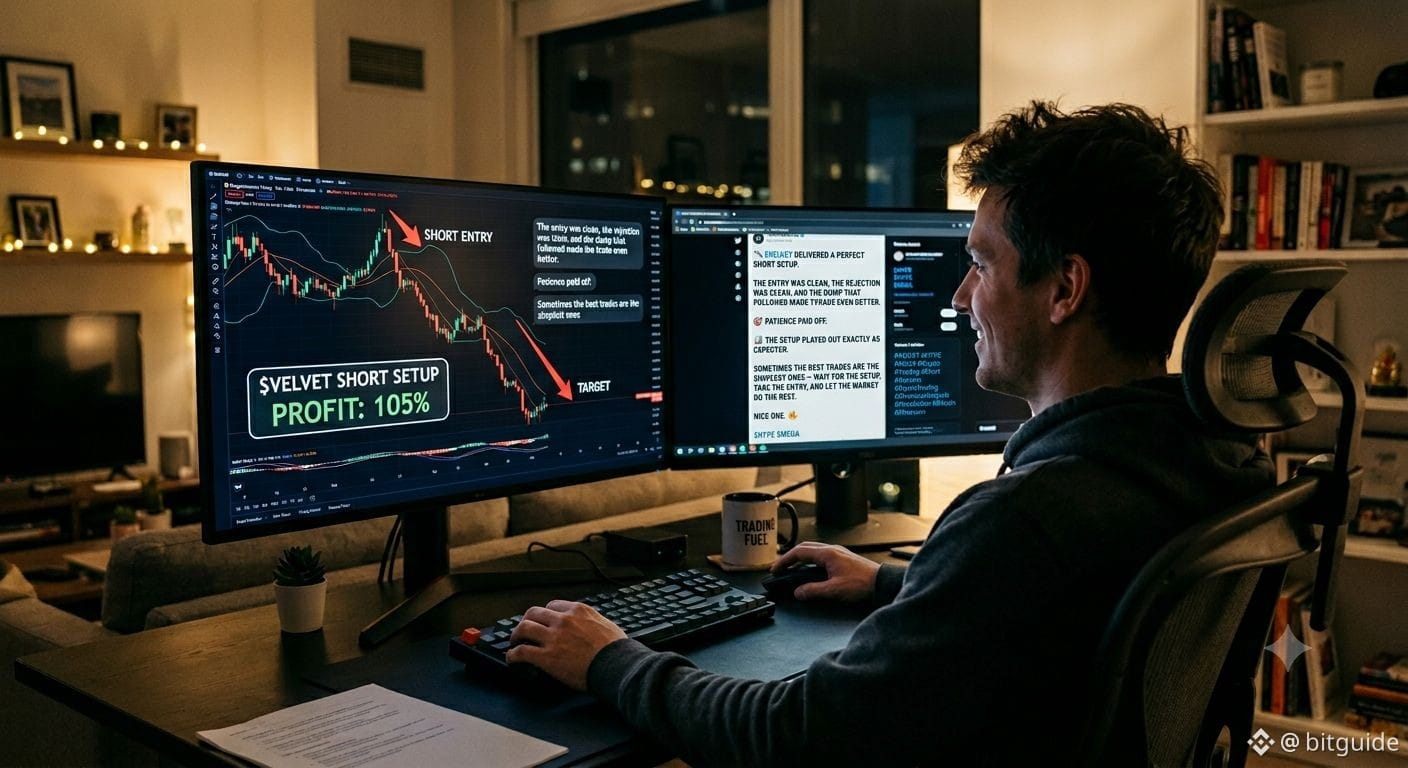
📉 $VELVET 提供了一個完美的空頭佈局。
進場點很乾淨,拒絕信號很明顯,隨後的下跌讓這筆交易更加出色。
🎯 耐心得到了回報。
📊 這個佈局如預期般順利展開。
有時候,最好的交易就是最簡單的——等待佈局,進場,然後讓市場自行發展。
幹得好。🔥
HYPE MEGA
#VELVET #HYPE #MEGA #加密 #交易 #空頭 #另類幣 #加密交易 #技術分析 #價格行爲 #比特幣 #Ethereum
{future}(VELVETUSDT)
$HYPE
{future}(HYPEUSDT)
$MEGA
{future}(MEGAUSDT)
📉 $VELVET 提供了一個完美的空頭佈局。
進場點很乾淨,拒絕信號很明顯,隨後的下跌讓這筆交易更加出色。
🎯 耐心得到了回報。
📊 這個佈局如預期般順利展開。
有時候,最好的交易就是最簡單的——等待佈局,進場,然後讓市場自行發展。
幹得好。🔥
HYPE MEGA
#VELVET #HYPE #MEGA #加密 #交易 #空頭 #另類幣 #加密交易 #技術分析 #價格行爲 #比特幣 #Ethereum
$HYPE
$MEGA
進場點很乾淨,拒絕信號很明顯,隨後的下跌讓這筆交易更加出色。
🎯 耐心得到了回報。
📊 這個佈局如預期般順利展開。
有時候,最好的交易就是最簡單的——等待佈局,進場,然後讓市場自行發展。
幹得好。🔥
HYPE MEGA
#VELVET #HYPE #MEGA #加密 #交易 #空頭 #另類幣 #加密交易 #技術分析 #價格行爲 #比特幣 #Ethereum
$HYPE
$MEGA
266
·
--
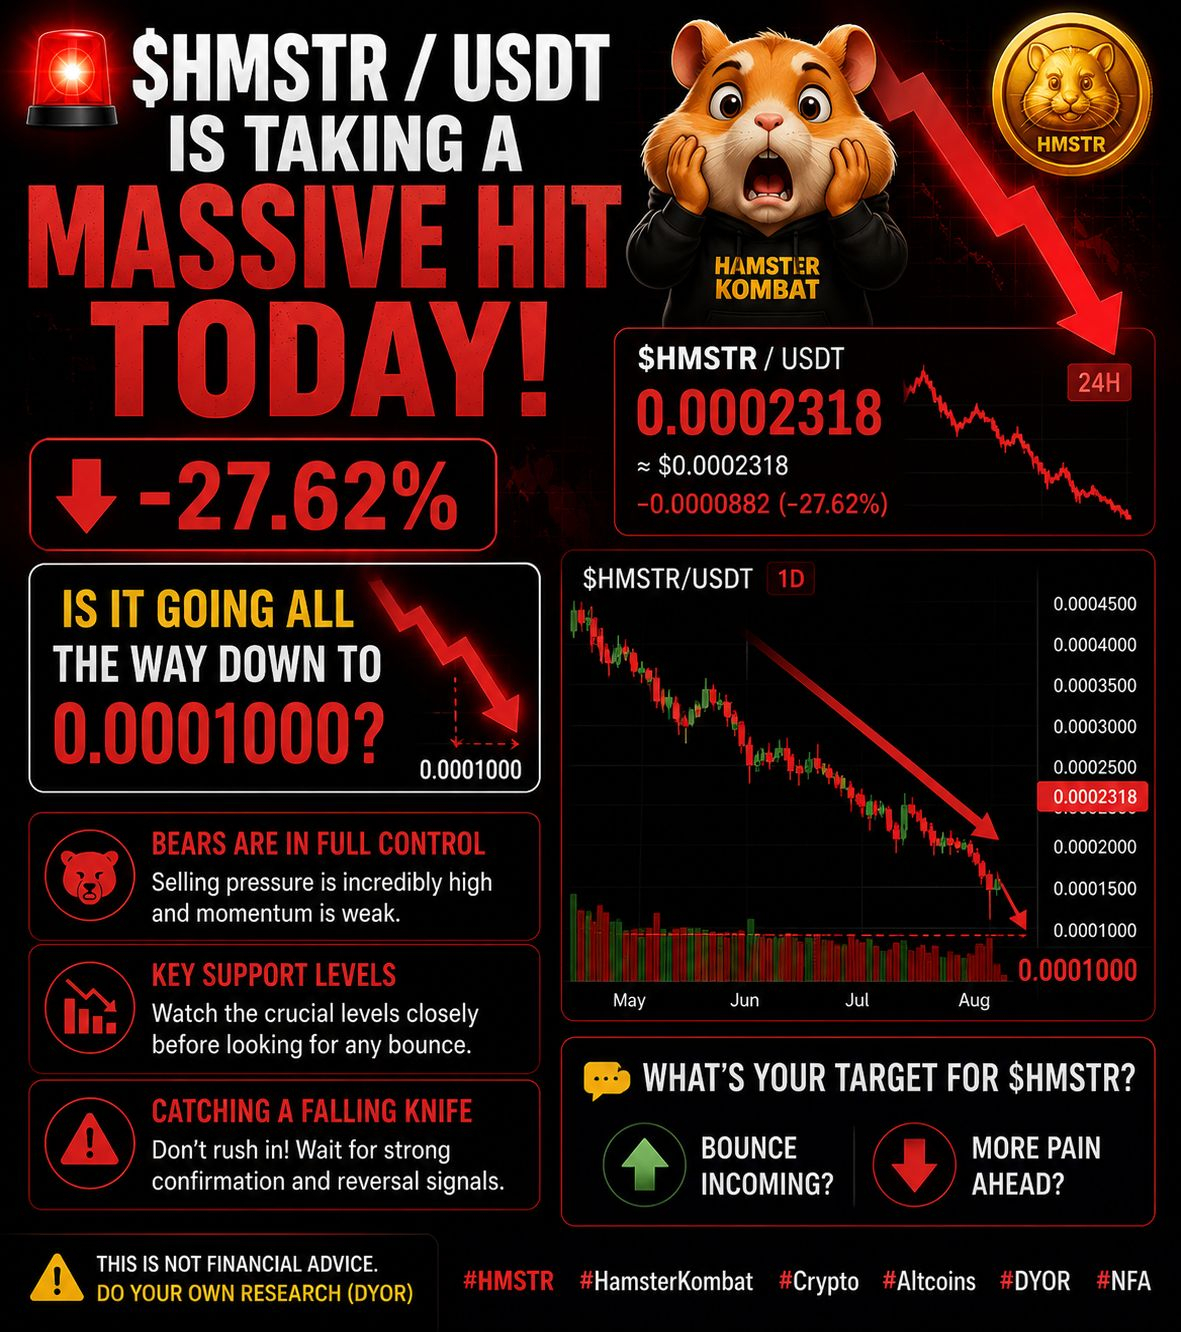
🚨 $HMSTR / USDT 今天被狠狠打壓,跌幅超過 27%! 📉
現在的大問題是:
❓ 這只是一次洗盤,還是我們要一路跌到 0.0001000 呢?
空頭現在牢牢掌控局面,拋售壓力似乎還在加大。交易者們在企圖接住這把掉落的刀之前,應該密切關注關鍵支撐位。
👀 你對 $HMSTR 的目標是什麼?
📊 會反彈還是還有更多痛苦在前面?
DYOR & NFA。
#HMSTR #Crypto #HamsterKombat #Trading #Altcoins #Bitcoin #Ethereum #CryptoTrading #BearMarket #MarketCrash
$HMSTR
{future}(HMSTRUSDT)
🚨 $HMSTR / USDT 今天被狠狠打壓,跌幅超過 27%! 📉
現在的大問題是:
❓ 這只是一次洗盤,還是我們要一路跌到 0.0001000 呢?
空頭現在牢牢掌控局面,拋售壓力似乎還在加大。交易者們在企圖接住這把掉落的刀之前,應該密切關注關鍵支撐位。
👀 你對 $HMSTR 的目標是什麼?
📊 會反彈還是還有更多痛苦在前面?
DYOR & NFA。
#HMSTR #Crypto #HamsterKombat #Trading #Altcoins #Bitcoin #Ethereum #CryptoTrading #BearMarket #MarketCrash
$HMSTR
現在的大問題是:
❓ 這只是一次洗盤,還是我們要一路跌到 0.0001000 呢?
空頭現在牢牢掌控局面,拋售壓力似乎還在加大。交易者們在企圖接住這把掉落的刀之前,應該密切關注關鍵支撐位。
👀 你對 $HMSTR 的目標是什麼?
📊 會反彈還是還有更多痛苦在前面?
DYOR & NFA。
#HMSTR #Crypto #HamsterKombat #Trading #Altcoins #Bitcoin #Ethereum #CryptoTrading #BearMarket #MarketCrash
$HMSTR
130
登入以探索更多內容
加入幣安廣場中的全球加密貨幣用戶
⚡️ 獲取加密貨幣的最新和實用資訊。
💬 受到全球最大加密貨幣交易所的信任。
👍 發掘來自經過驗證創作者的真實見解。
電子郵件 / 電話號碼
熱門話題
Anthropic滚动12个月营收增长约1200%
33,529 次瀏覽
143 討論中
Anthropic 的招股書今天公開了。營收曲線長這樣。
2023 年 4100 萬美元,2024 年 3.86 億,2025 年 45.9 億,2026 年上半年 162.9 億。
二季度單季同比 1368%。市面上流傳的「滾動 12 個月增長約 1200%」是另一個口徑,量級對得上。
三年時間,從四千萬做到年化三百億。
同一份文件裏還有另一個數。上半年淨虧損 807 億美元,去年同期 130 億,擴大了六倍。
這兩件事是連着的。企業客戶在搶 Claude,公司就得搶算力,算力要提前付錢。招股書裏那筆最高 7500 億美元的算力承諾,不可取消。
錢先花出去,收入後到賬。$ANTHROPIC
#anthropic滚动12个月营收增长约1200%
层楼bnb
·3 人按讚
·15.2k 次瀏覽
Anthropic预计今日公布S1招股书
26,816 次瀏覽
134 討論中
据报韩国考虑第四次推迟加密税
53,249 次瀏覽
323 討論中