

Kamile Uray 1
61 貼文

Kamile Uray 1
舉報
封鎖用戶
Economist, Halkbank Financial Analysis Expert, Strategic Planning Manager of the Ministry of Commerce, Trader & Investor & Trainer
0 關注
2 粉絲
4 點讚數
貼文
我們已經很久沒有查看 BTC 與 USDT 的主導率了。
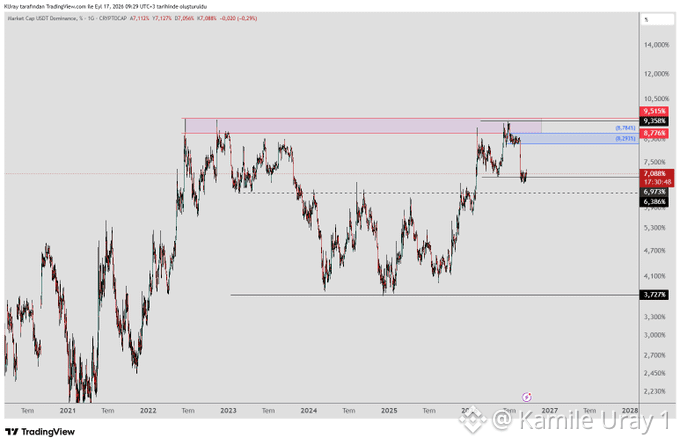
#USDT 主導率 已透出第一個訊號:當天收盤跌破 6.97,表示下跌已開始。從這裡出現的任何上漲,都應被視為對下跌趨勢的短暫反應。若價格收盤高於 9.36,這種看空觀點將被否定。USDT 主導率下滑,意味著投資人正在把資金轉向 BTC 或山寨幣。
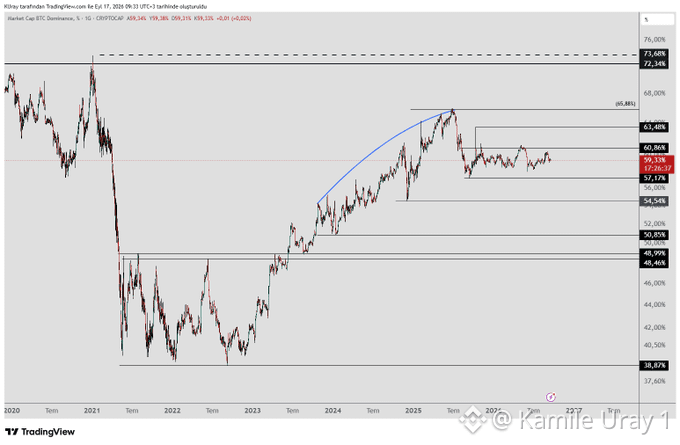
當我們檢視 #BTC 主導率 時,看空的形態已經浮現;如果它仍低於 57,跌勢很可能會持續。
對這兩項主導率指標所形成的形態進行分析後,最可能的結果是下跌。這也提高了資金輪動至山寨幣的可能性。
當然,我並不預期這會適用於*所有*山寨幣;我認為主要會有獲利落在那些盤面較有利、團隊活躍、且專案扎實的標的上。
我們已經很久沒有查看 BTC 與 USDT 的主導率了。
#USDT 主導率 已透出第一個訊號:當天收盤跌破 6.97,表示下跌已開始。從這裡出現的任何上漲,都應被視為對下跌趨勢的短暫反應。若價格收盤高於 9.36,這種看空觀點將被否定。USDT 主導率下滑,意味著投資人正在把資金轉向 BTC 或山寨幣。
當我們檢視 #BTC 主導率 時,看空的形態已經浮現;如果它仍低於 57,跌勢很可能會持續。
對這兩項主導率指標所形成的形態進行分析後,最可能的結果是下跌。這也提高了資金輪動至山寨幣的可能性。
當然,我並不預期這會適用於*所有*山寨幣;我認為主要會有獲利落在那些盤面較有利、團隊活躍、且專案扎實的標的上。
#USDT 主導率 已透出第一個訊號:當天收盤跌破 6.97,表示下跌已開始。從這裡出現的任何上漲,都應被視為對下跌趨勢的短暫反應。若價格收盤高於 9.36,這種看空觀點將被否定。USDT 主導率下滑,意味著投資人正在把資金轉向 BTC 或山寨幣。
當我們檢視 #BTC 主導率 時,看空的形態已經浮現;如果它仍低於 57,跌勢很可能會持續。
對這兩項主導率指標所形成的形態進行分析後,最可能的結果是下跌。這也提高了資金輪動至山寨幣的可能性。
當然,我並不預期這會適用於*所有*山寨幣;我認為主要會有獲利落在那些盤面較有利、團隊活躍、且專案扎實的標的上。
54
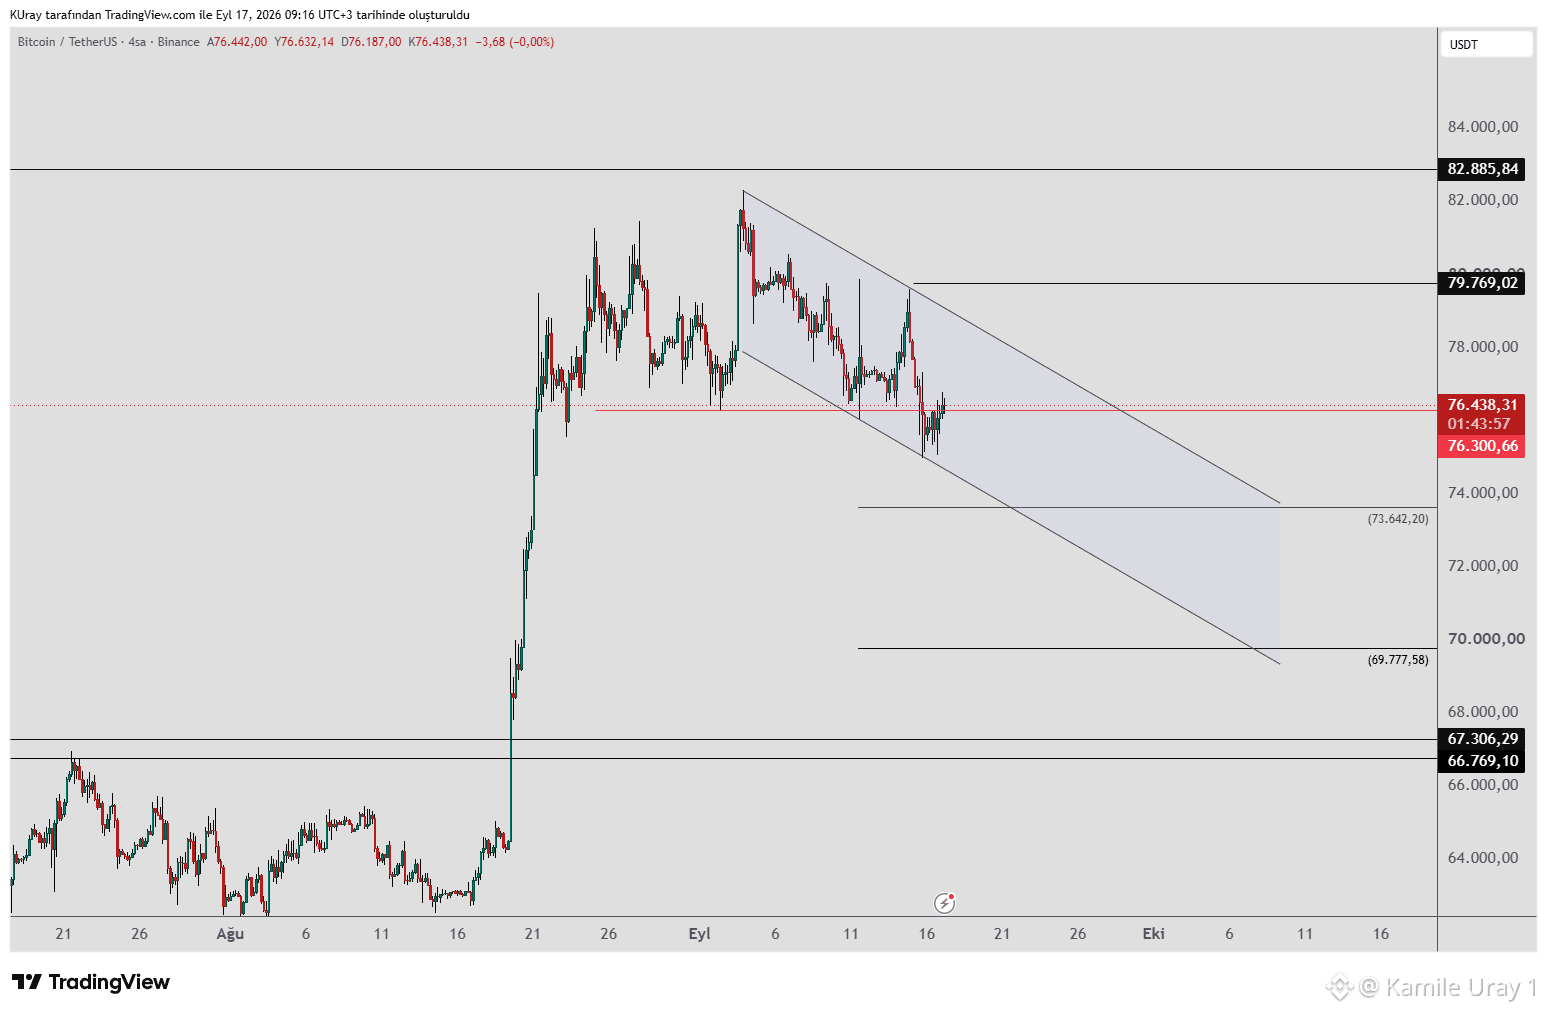
#BTC 下行浪潮正在通道內移動。該通道的上軌可能充當阻力,而下軌則充當支撐。只要上軌未被跌破(突破需要日線收在約 79,800 附近),下跌仍有可能持續。
在下跌期間,我們將監控支撐位:73,642、69,777、67,306 和 66,769。若在任一這些價位出現買盤壓力,預期將出現新一輪上漲。此次下跌可能會構成反向頭肩(Inverse Head and Shoulders, IH&S)形態的最後一個肩部;若價格守在 83,000 之上,該形態將被觸發,並預期價格將持續上攻至更高的上方阻力區。
若出現日線或週線收在 82,885 之上,將代表相對於近期下行浪的第一個更高高點。這將進一步提供上升趨勢可能延續的訊號,之後我們可以再觀察上方阻力位。
#BTC 下行浪潮正在通道內移動。該通道的上軌可能充當阻力,而下軌則充當支撐。只要上軌未被跌破(突破需要日線收在約 79,800 附近),下跌仍有可能持續。
在下跌期間,我們將監控支撐位:73,642、69,777、67,306 和 66,769。若在任一這些價位出現買盤壓力,預期將出現新一輪上漲。此次下跌可能會構成反向頭肩(Inverse Head and Shoulders, IH&S)形態的最後一個肩部;若價格守在 83,000 之上,該形態將被觸發,並預期價格將持續上攻至更高的上方阻力區。
若出現日線或週線收在 82,885 之上,將代表相對於近期下行浪的第一個更高高點。這將進一步提供上升趨勢可能延續的訊號,之後我們可以再觀察上方阻力位。
在下跌期間,我們將監控支撐位:73,642、69,777、67,306 和 66,769。若在任一這些價位出現買盤壓力,預期將出現新一輪上漲。此次下跌可能會構成反向頭肩(Inverse Head and Shoulders, IH&S)形態的最後一個肩部;若價格守在 83,000 之上,該形態將被觸發,並預期價格將持續上攻至更高的上方阻力區。
若出現日線或週線收在 82,885 之上,將代表相對於近期下行浪的第一個更高高點。這將進一步提供上升趨勢可能延續的訊號,之後我們可以再觀察上方阻力位。
55
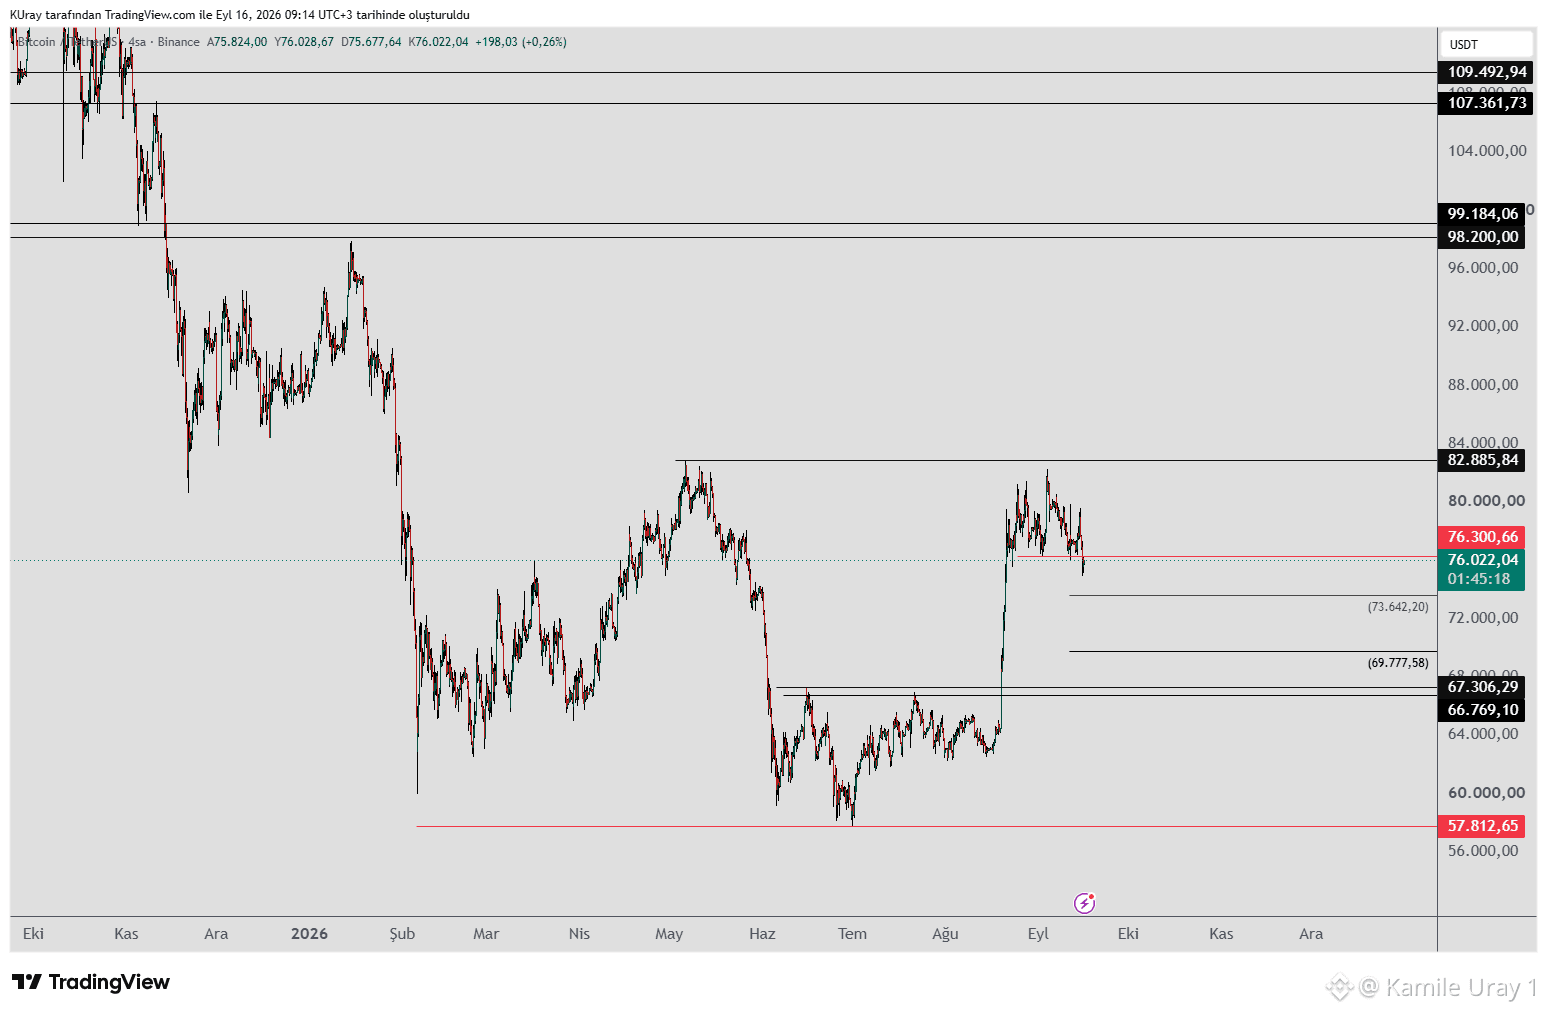
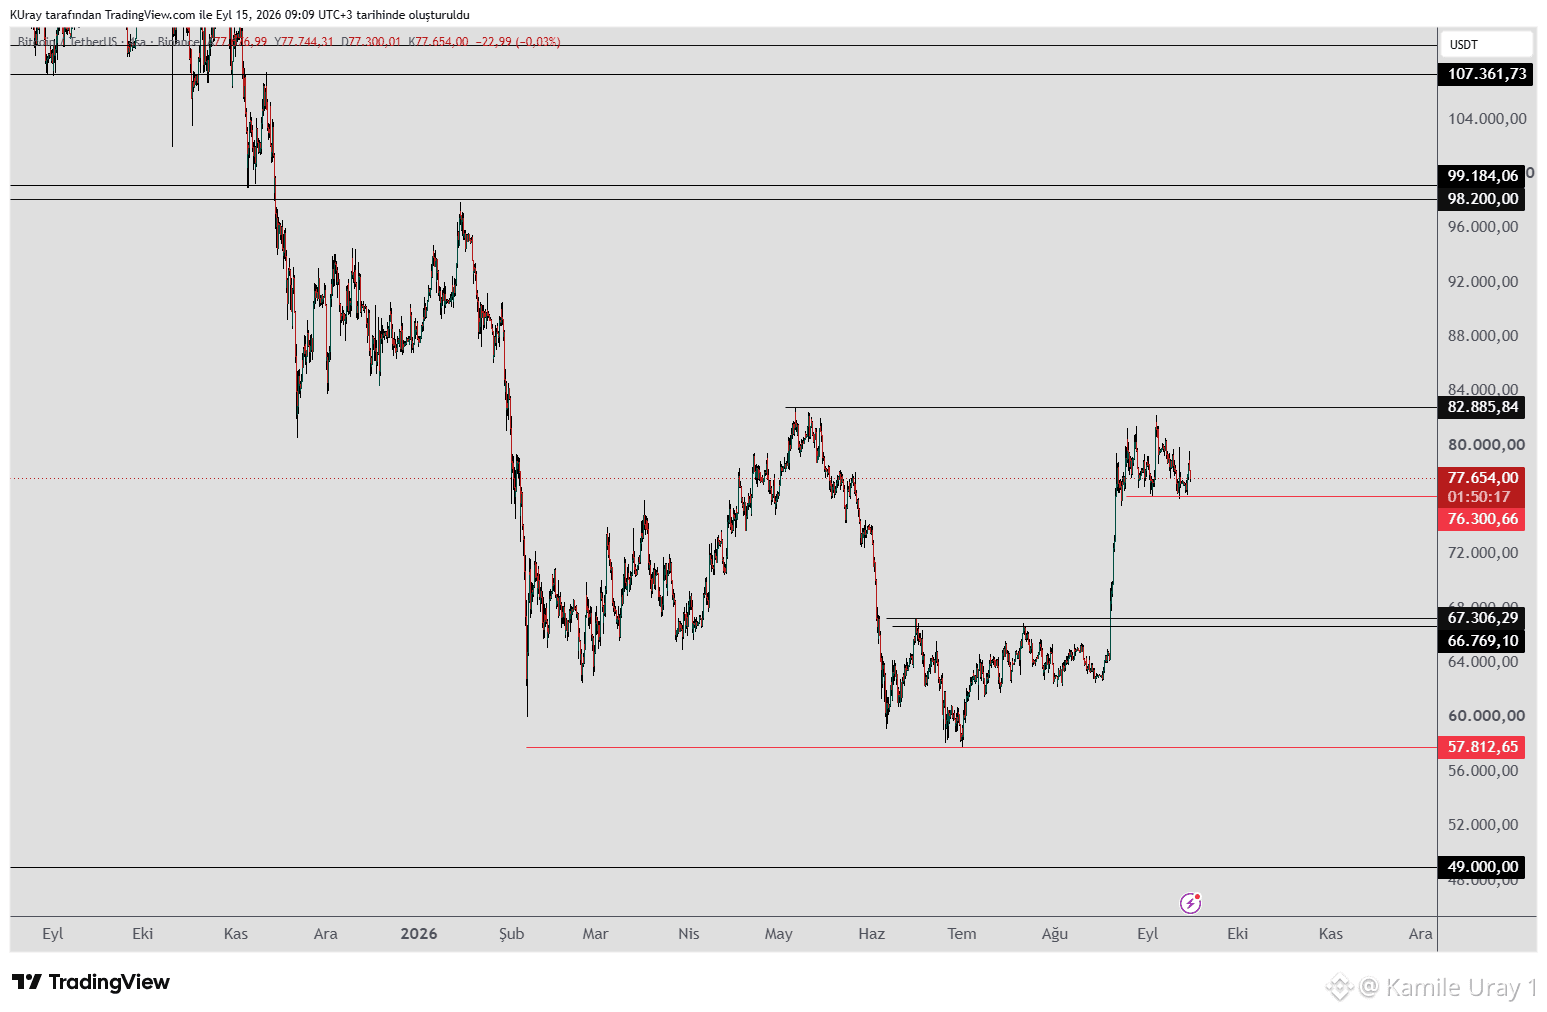
#BTC 在美聯儲利率決策公告前收盤跌破 76,300 水平。這引發了可能持續下跌的疑慮。
在下跌期間,我們將監測支撐位:73,642、69,777、67,306 與 66,769。
若在任一這些水平特別出現買盤活動,預期將出現重新上漲。
下跌可能會形成反向頭肩(H&S)型態的最後一個肩部。若價格能守在 83,000 之上,該型態將被觸發,並預期價格將持續上行至上方阻力區。
若出現日線或週線收盤價高於 82,885,這將代表相較於最近一次向下波段的第一個更高高點。這將進一步成為上升趨勢可能持續的訊號,之後即可監測上方阻力位。
#BTC 在美聯儲利率決策公告前收盤跌破 76,300 水平。這引發了可能持續下跌的疑慮。
在下跌期間,我們將監測支撐位:73,642、69,777、67,306 與 66,769。
若在任一這些水平特別出現買盤活動,預期將出現重新上漲。
下跌可能會形成反向頭肩(H&S)型態的最後一個肩部。若價格能守在 83,000 之上,該型態將被觸發,並預期價格將持續上行至上方阻力區。
若出現日線或週線收盤價高於 82,885,這將代表相較於最近一次向下波段的第一個更高高點。這將進一步成為上升趨勢可能持續的訊號,之後即可監測上方阻力位。
在下跌期間,我們將監測支撐位:73,642、69,777、67,306 與 66,769。
若在任一這些水平特別出現買盤活動,預期將出現重新上漲。
下跌可能會形成反向頭肩(H&S)型態的最後一個肩部。若價格能守在 83,000 之上,該型態將被觸發,並預期價格將持續上行至上方阻力區。
若出現日線或週線收盤價高於 82,885,這將代表相較於最近一次向下波段的第一個更高高點。這將進一步成為上升趨勢可能持續的訊號,之後即可監測上方阻力位。
63
#BTC 似乎將在同一區間內交易,直到美聯儲在 16 日公布利率決策。
決策當天—不論走向哪一方—都可能出現劇烈的價格波動。我們正在密切關注 76,300 這一水位;不管波動多大,4 小時K線收盤仍是我們的關鍵指標。
只要價格在 4 小時圖表上仍守在 76,300 之上,上漲的可能性就仍然存在。
如果價格收盤跌破 76,300,則可能測試約 67,000–66,000 附近的支撐區。這種下跌可能會形成潛在反向頭肩(H&S)型態的最後一個肩部。若後續價格能守住 83,000 之上,該型態將被啟動,並預期價格將持續上行,朝向上方的壓力區。
如果日線或週線收在 82,885 之上,將代表相對於最近一次下跌波的首個更高高點。這也將進一步確認上漲趨勢很可能會持續,使我們能在之後持續留意上方壓力區水位。
#BTC 似乎將在同一區間內交易,直到美聯儲在 16 日公布利率決策。
決策當天—不論走向哪一方—都可能出現劇烈的價格波動。我們正在密切關注 76,300 這一水位;不管波動多大,4 小時K線收盤仍是我們的關鍵指標。
只要價格在 4 小時圖表上仍守在 76,300 之上,上漲的可能性就仍然存在。
如果價格收盤跌破 76,300,則可能測試約 67,000–66,000 附近的支撐區。這種下跌可能會形成潛在反向頭肩(H&S)型態的最後一個肩部。若後續價格能守住 83,000 之上,該型態將被啟動,並預期價格將持續上行,朝向上方的壓力區。
如果日線或週線收在 82,885 之上,將代表相對於最近一次下跌波的首個更高高點。這也將進一步確認上漲趨勢很可能會持續,使我們能在之後持續留意上方壓力區水位。
決策當天—不論走向哪一方—都可能出現劇烈的價格波動。我們正在密切關注 76,300 這一水位;不管波動多大,4 小時K線收盤仍是我們的關鍵指標。
只要價格在 4 小時圖表上仍守在 76,300 之上,上漲的可能性就仍然存在。
如果價格收盤跌破 76,300,則可能測試約 67,000–66,000 附近的支撐區。這種下跌可能會形成潛在反向頭肩(H&S)型態的最後一個肩部。若後續價格能守住 83,000 之上,該型態將被啟動,並預期價格將持續上行,朝向上方的壓力區。
如果日線或週線收在 82,885 之上,將代表相對於最近一次下跌波的首個更高高點。這也將進一步確認上漲趨勢很可能會持續,使我們能在之後持續留意上方壓力區水位。
61
我發現了一個可能的天秤座型態。🙂
讓我把它分享給你。
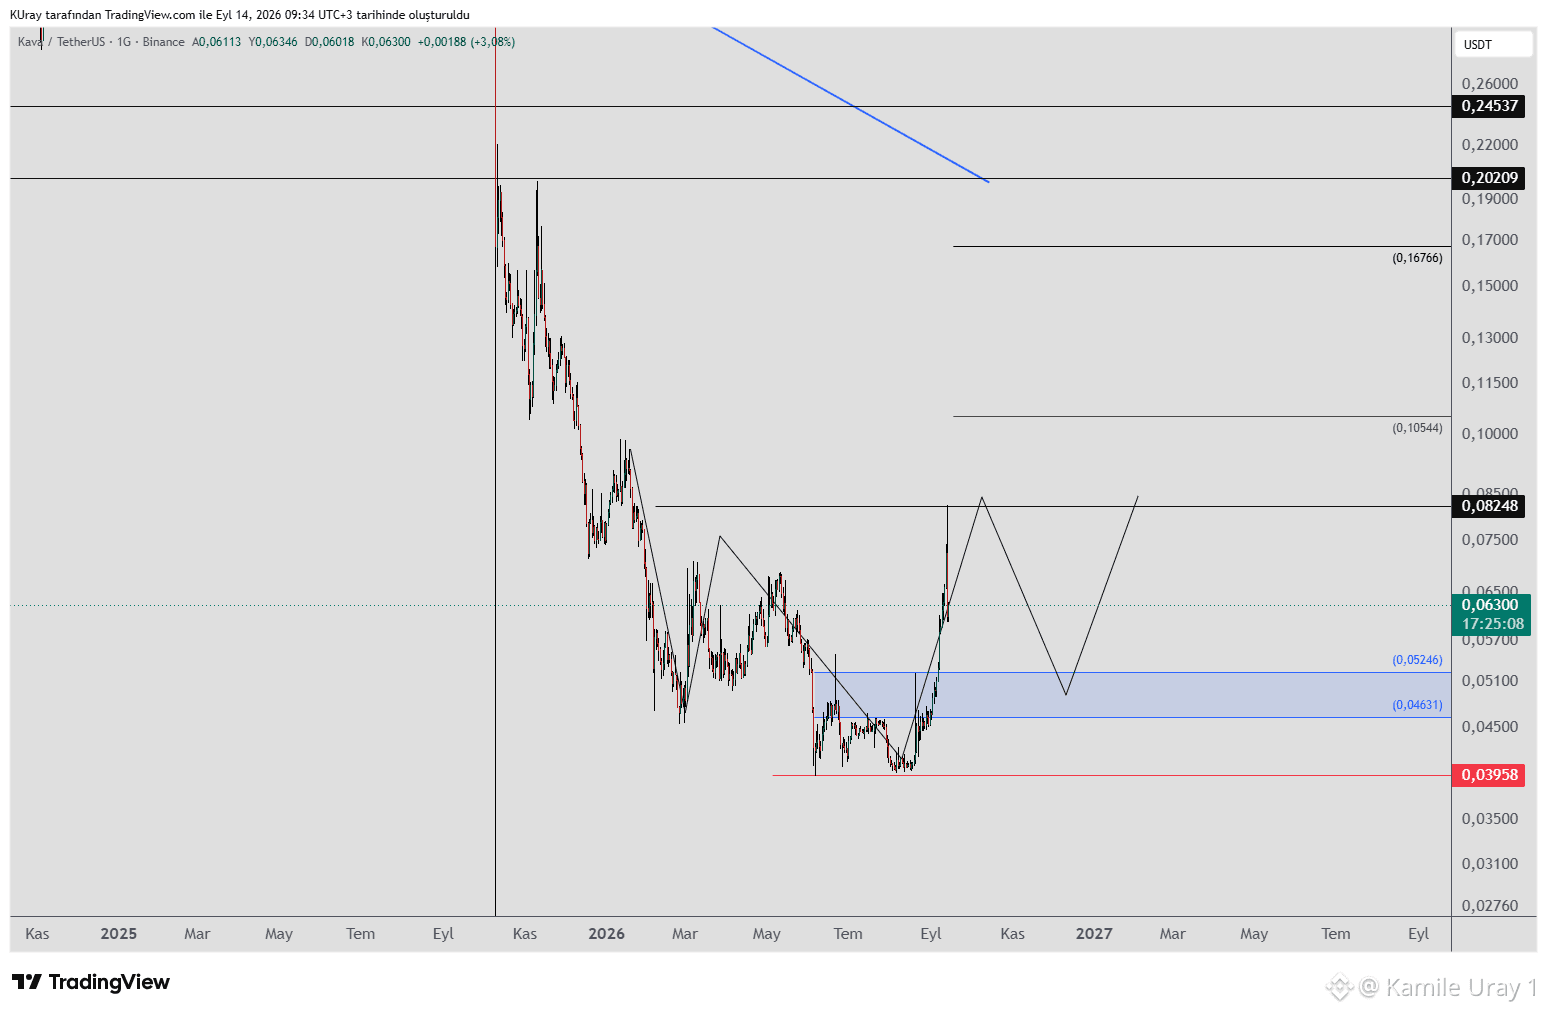
#KAVA:如果價格下跌,可能會形成天秤座型態。
進場區:0.05246–0.04631
停損:0.03958
目標:0.08248–0.10544–0.16766
你可以根據自己的風險承受能力來決定交易策略。我建議在追蹤交易時使用停損。
我發現了一個可能的天秤座型態。🙂
讓我把它分享給你。
#KAVA:如果價格下跌,可能會形成天秤座型態。
進場區:0.05246–0.04631
停損:0.03958
目標:0.08248–0.10544–0.16766
你可以根據自己的風險承受能力來決定交易策略。我建議在追蹤交易時使用停損。
讓我把它分享給你。
#KAVA:如果價格下跌,可能會形成天秤座型態。
進場區:0.05246–0.04631
停損:0.03958
目標:0.08248–0.10544–0.16766
你可以根據自己的風險承受能力來決定交易策略。我建議在追蹤交易時使用停損。
52
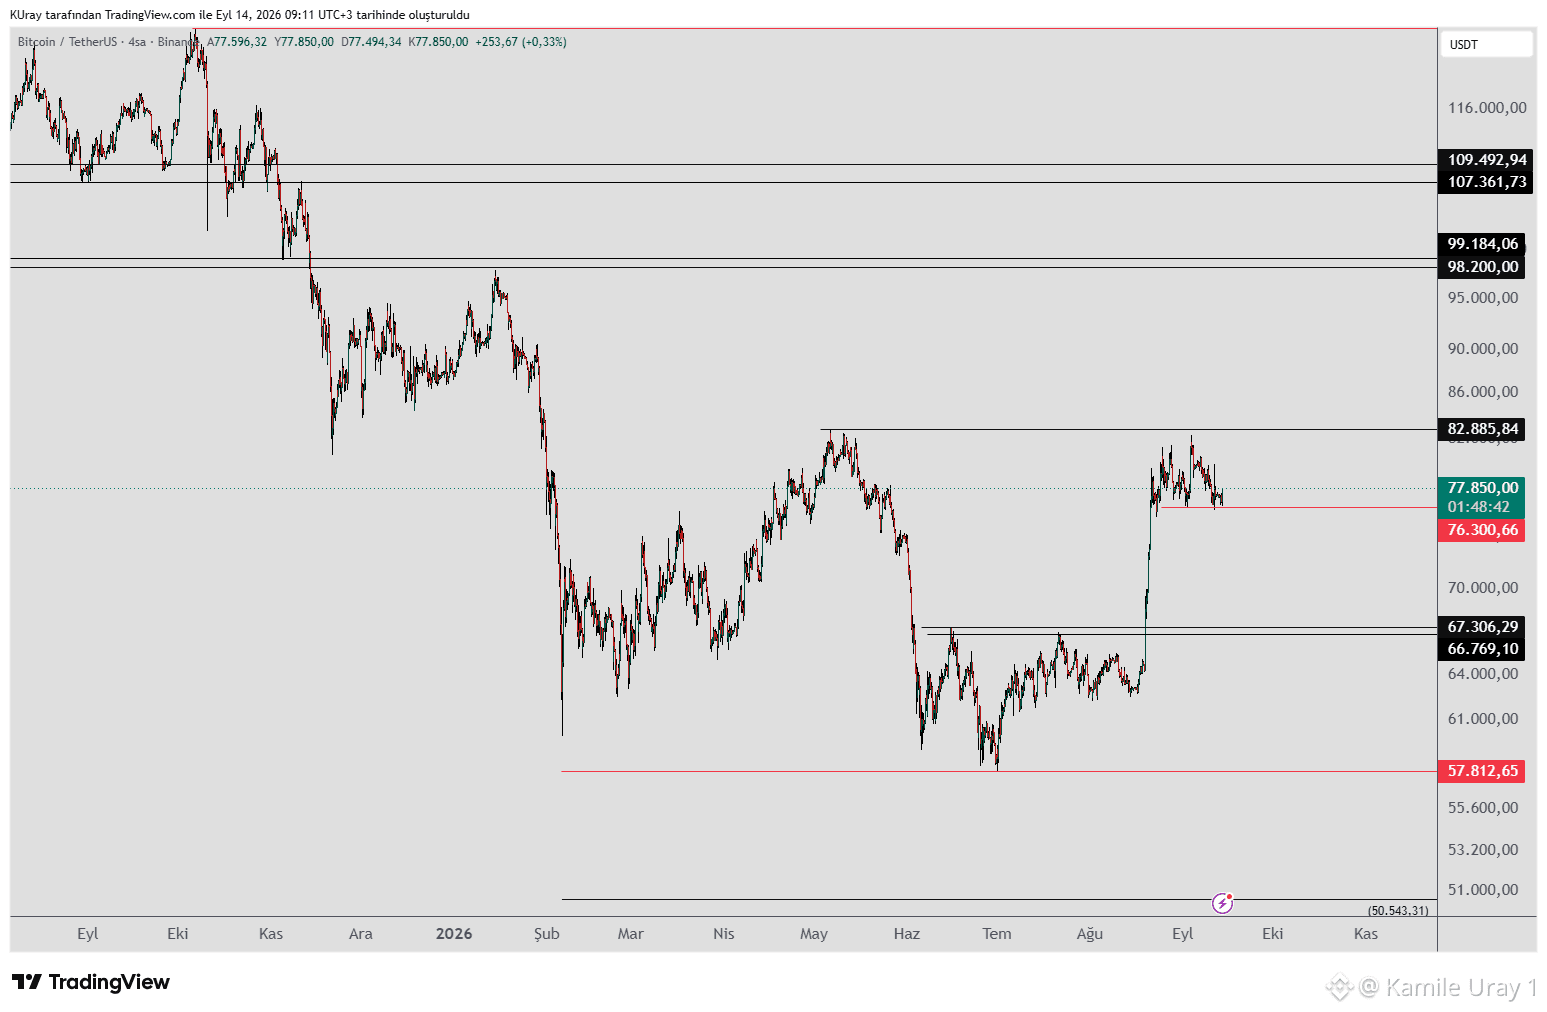
我們正在監控 #BTC 的 76,300 水平。只要它守在此區之上,上漲走勢的潛力仍將維持。
如果價格收盤跌破 76,300,則可能測試約 67,000–66,000 的支撐區。下跌可能導致形成潛在反向頭肩(H&S)形態的最後一個肩部;若價格守在 83,000 之上,該形態將被觸發,並預期價格將持續上行,挑戰更高的壓力區。
若日線或週線收盤出現於 82,885 之上,這將標誌相較於最近一次下跌波段的首次更高高點。這將提供另一個訊號,表明上升趨勢很可能會延續,之後即可持續監控更高的壓力水位。
我們正在監控 #BTC 的 76,300 水平。只要它守在此區之上,上漲走勢的潛力仍將維持。
如果價格收盤跌破 76,300,則可能測試約 67,000–66,000 的支撐區。下跌可能導致形成潛在反向頭肩(H&S)形態的最後一個肩部;若價格守在 83,000 之上,該形態將被觸發,並預期價格將持續上行,挑戰更高的壓力區。
若日線或週線收盤出現於 82,885 之上,這將標誌相較於最近一次下跌波段的首次更高高點。這將提供另一個訊號,表明上升趨勢很可能會延續,之後即可持續監控更高的壓力水位。
如果價格收盤跌破 76,300,則可能測試約 67,000–66,000 的支撐區。下跌可能導致形成潛在反向頭肩(H&S)形態的最後一個肩部;若價格守在 83,000 之上,該形態將被觸發,並預期價格將持續上行,挑戰更高的壓力區。
若日線或週線收盤出現於 82,885 之上,這將標誌相較於最近一次下跌波段的首次更高高點。這將提供另一個訊號,表明上升趨勢很可能會延續,之後即可持續監控更高的壓力水位。
70
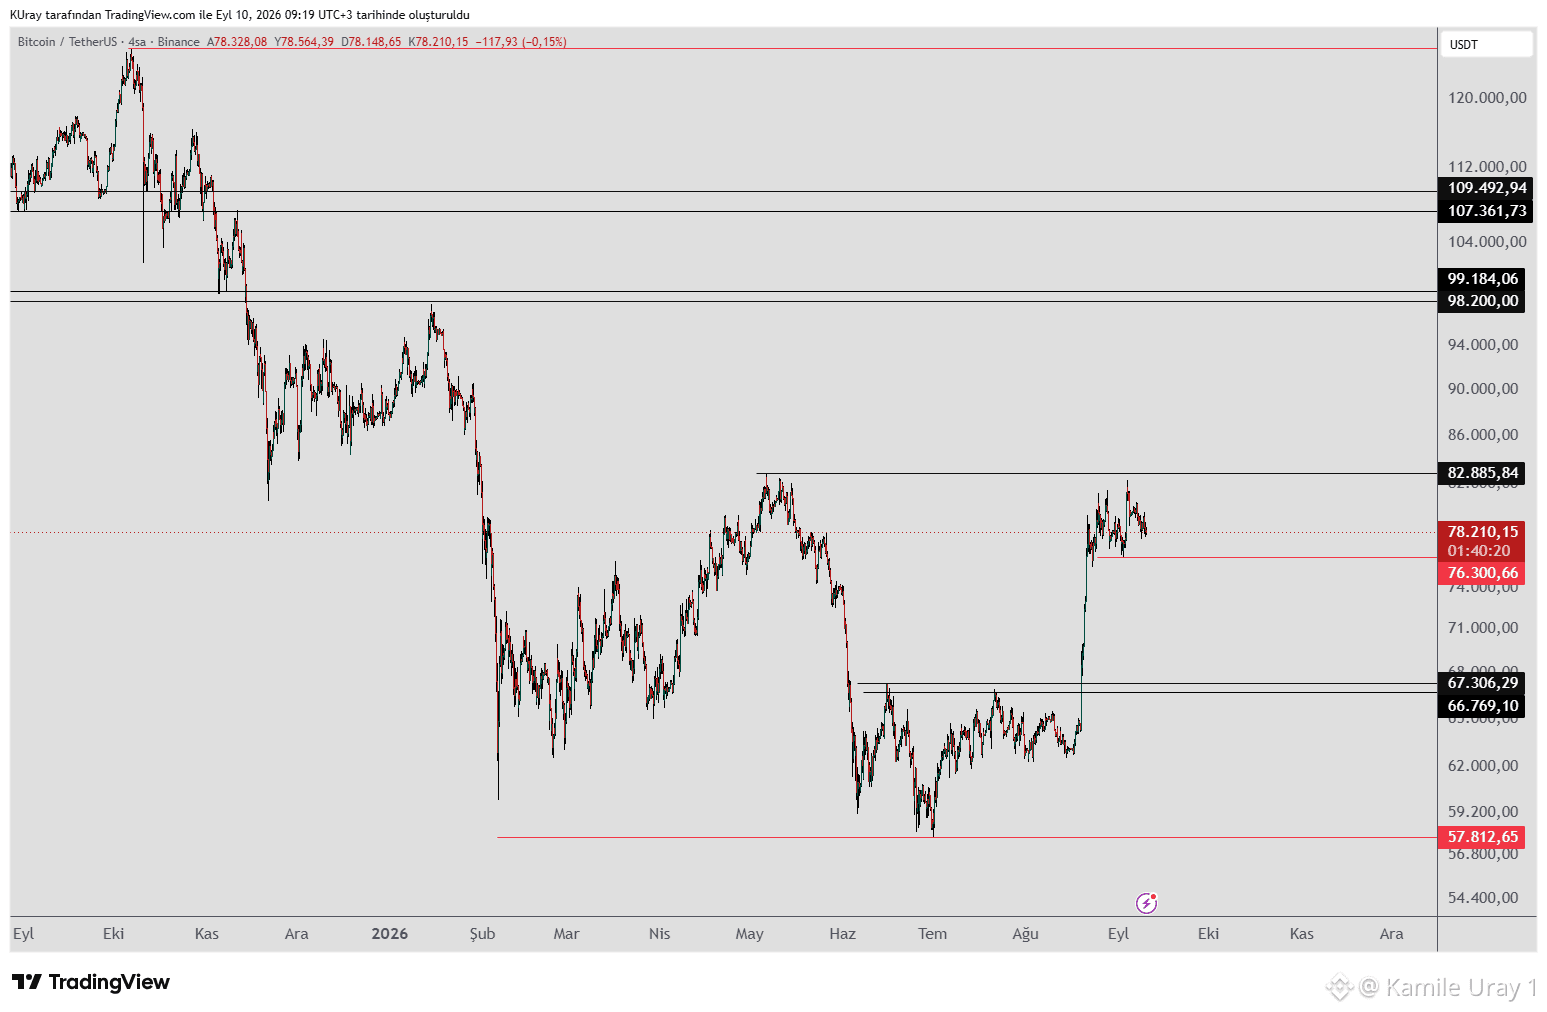
#BTC 美國PPI上升,且CPI數據今日即將公布;這預示著市場又將是另一個波動的一天。我們將保持審慎,特別是在短線交易方面。
數據公布後,市場將趨於穩定並恢復其走勢。
我們正在關注BTC的76,300美元水位。只要價格維持在該水位之上,上行的潛力仍然存在。
若日線或週線收盤出現高於82,885美元,將代表相對於近期下跌波段的第一個更高峰值。這將提供另一個訊號,顯示反彈很可能仍將延續;之後我們可以再觀察更高的阻力位。
若價格收盤跌破76,300美元,則可能測試66,000–67,000美元附近的支撐區間。這種下跌可能形成潛在反向頭肩(H&S)形態的最後一個肩部。若價格守在83,000美元之上,該形態將被啟動,並預期價格將持續上行、朝向更高阻力位方向移動。
#BTC 美國PPI上升,且CPI數據今日即將公布;這預示著市場又將是另一個波動的一天。我們將保持審慎,特別是在短線交易方面。
數據公布後,市場將趨於穩定並恢復其走勢。
我們正在關注BTC的76,300美元水位。只要價格維持在該水位之上,上行的潛力仍然存在。
若日線或週線收盤出現高於82,885美元,將代表相對於近期下跌波段的第一個更高峰值。這將提供另一個訊號,顯示反彈很可能仍將延續;之後我們可以再觀察更高的阻力位。
若價格收盤跌破76,300美元,則可能測試66,000–67,000美元附近的支撐區間。這種下跌可能形成潛在反向頭肩(H&S)形態的最後一個肩部。若價格守在83,000美元之上,該形態將被啟動,並預期價格將持續上行、朝向更高阻力位方向移動。
數據公布後,市場將趨於穩定並恢復其走勢。
我們正在關注BTC的76,300美元水位。只要價格維持在該水位之上,上行的潛力仍然存在。
若日線或週線收盤出現高於82,885美元,將代表相對於近期下跌波段的第一個更高峰值。這將提供另一個訊號,顯示反彈很可能仍將延續;之後我們可以再觀察更高的阻力位。
若價格收盤跌破76,300美元,則可能測試66,000–67,000美元附近的支撐區間。這種下跌可能形成潛在反向頭肩(H&S)形態的最後一個肩部。若價格守在83,000美元之上,該形態將被啟動,並預期價格將持續上行、朝向更高阻力位方向移動。

55
#BTC 美國生產者通膨數據今日即將公布;市場往往會在數據發布日謹慎觀望,並在數據公布後出現明顯的劇烈波動。
因此,特別是短線交易者,應當提高警惕。
至於BTC,我們關注的關鍵水位很清楚:只要價格仍維持在76,300上方,上漲的潛力就仍然存在。
若日線或週線收盤站上82,885,將代表相對於最近一次下跌波段出現了第一個更高的高點。這將進一步作為上升趨勢可能延續的信號,之後我們即可持續留意更高的阻力水位。
若價格收盤跌破76,300,則可能測試支撐區約在67,000–66,000。這樣的下跌可能會形成潛在「反向頭肩」(H\u0026S)型態的最後一個肩部。若隨後價格能守住83,000上方,該型態將被啟動,並預期價格將持續上行、朝更高的阻力水位邁進。
#BTC 美國生產者通膨數據今日即將公布;市場往往會在數據發布日謹慎觀望,並在數據公布後出現明顯的劇烈波動。
因此,特別是短線交易者,應當提高警惕。
至於BTC,我們關注的關鍵水位很清楚:只要價格仍維持在76,300上方,上漲的潛力就仍然存在。
若日線或週線收盤站上82,885,將代表相對於最近一次下跌波段出現了第一個更高的高點。這將進一步作為上升趨勢可能延續的信號,之後我們即可持續留意更高的阻力水位。
若價格收盤跌破76,300,則可能測試支撐區約在67,000–66,000。這樣的下跌可能會形成潛在「反向頭肩」(H\u0026S)型態的最後一個肩部。若隨後價格能守住83,000上方,該型態將被啟動,並預期價格將持續上行、朝更高的阻力水位邁進。
因此,特別是短線交易者,應當提高警惕。
至於BTC,我們關注的關鍵水位很清楚:只要價格仍維持在76,300上方,上漲的潛力就仍然存在。
若日線或週線收盤站上82,885,將代表相對於最近一次下跌波段出現了第一個更高的高點。這將進一步作為上升趨勢可能延續的信號,之後我們即可持續留意更高的阻力水位。
若價格收盤跌破76,300,則可能測試支撐區約在67,000–66,000。這樣的下跌可能會形成潛在「反向頭肩」(H\u0026S)型態的最後一個肩部。若隨後價格能守住83,000上方,該型態將被啟動,並預期價格將持續上行、朝更高的阻力水位邁進。
65
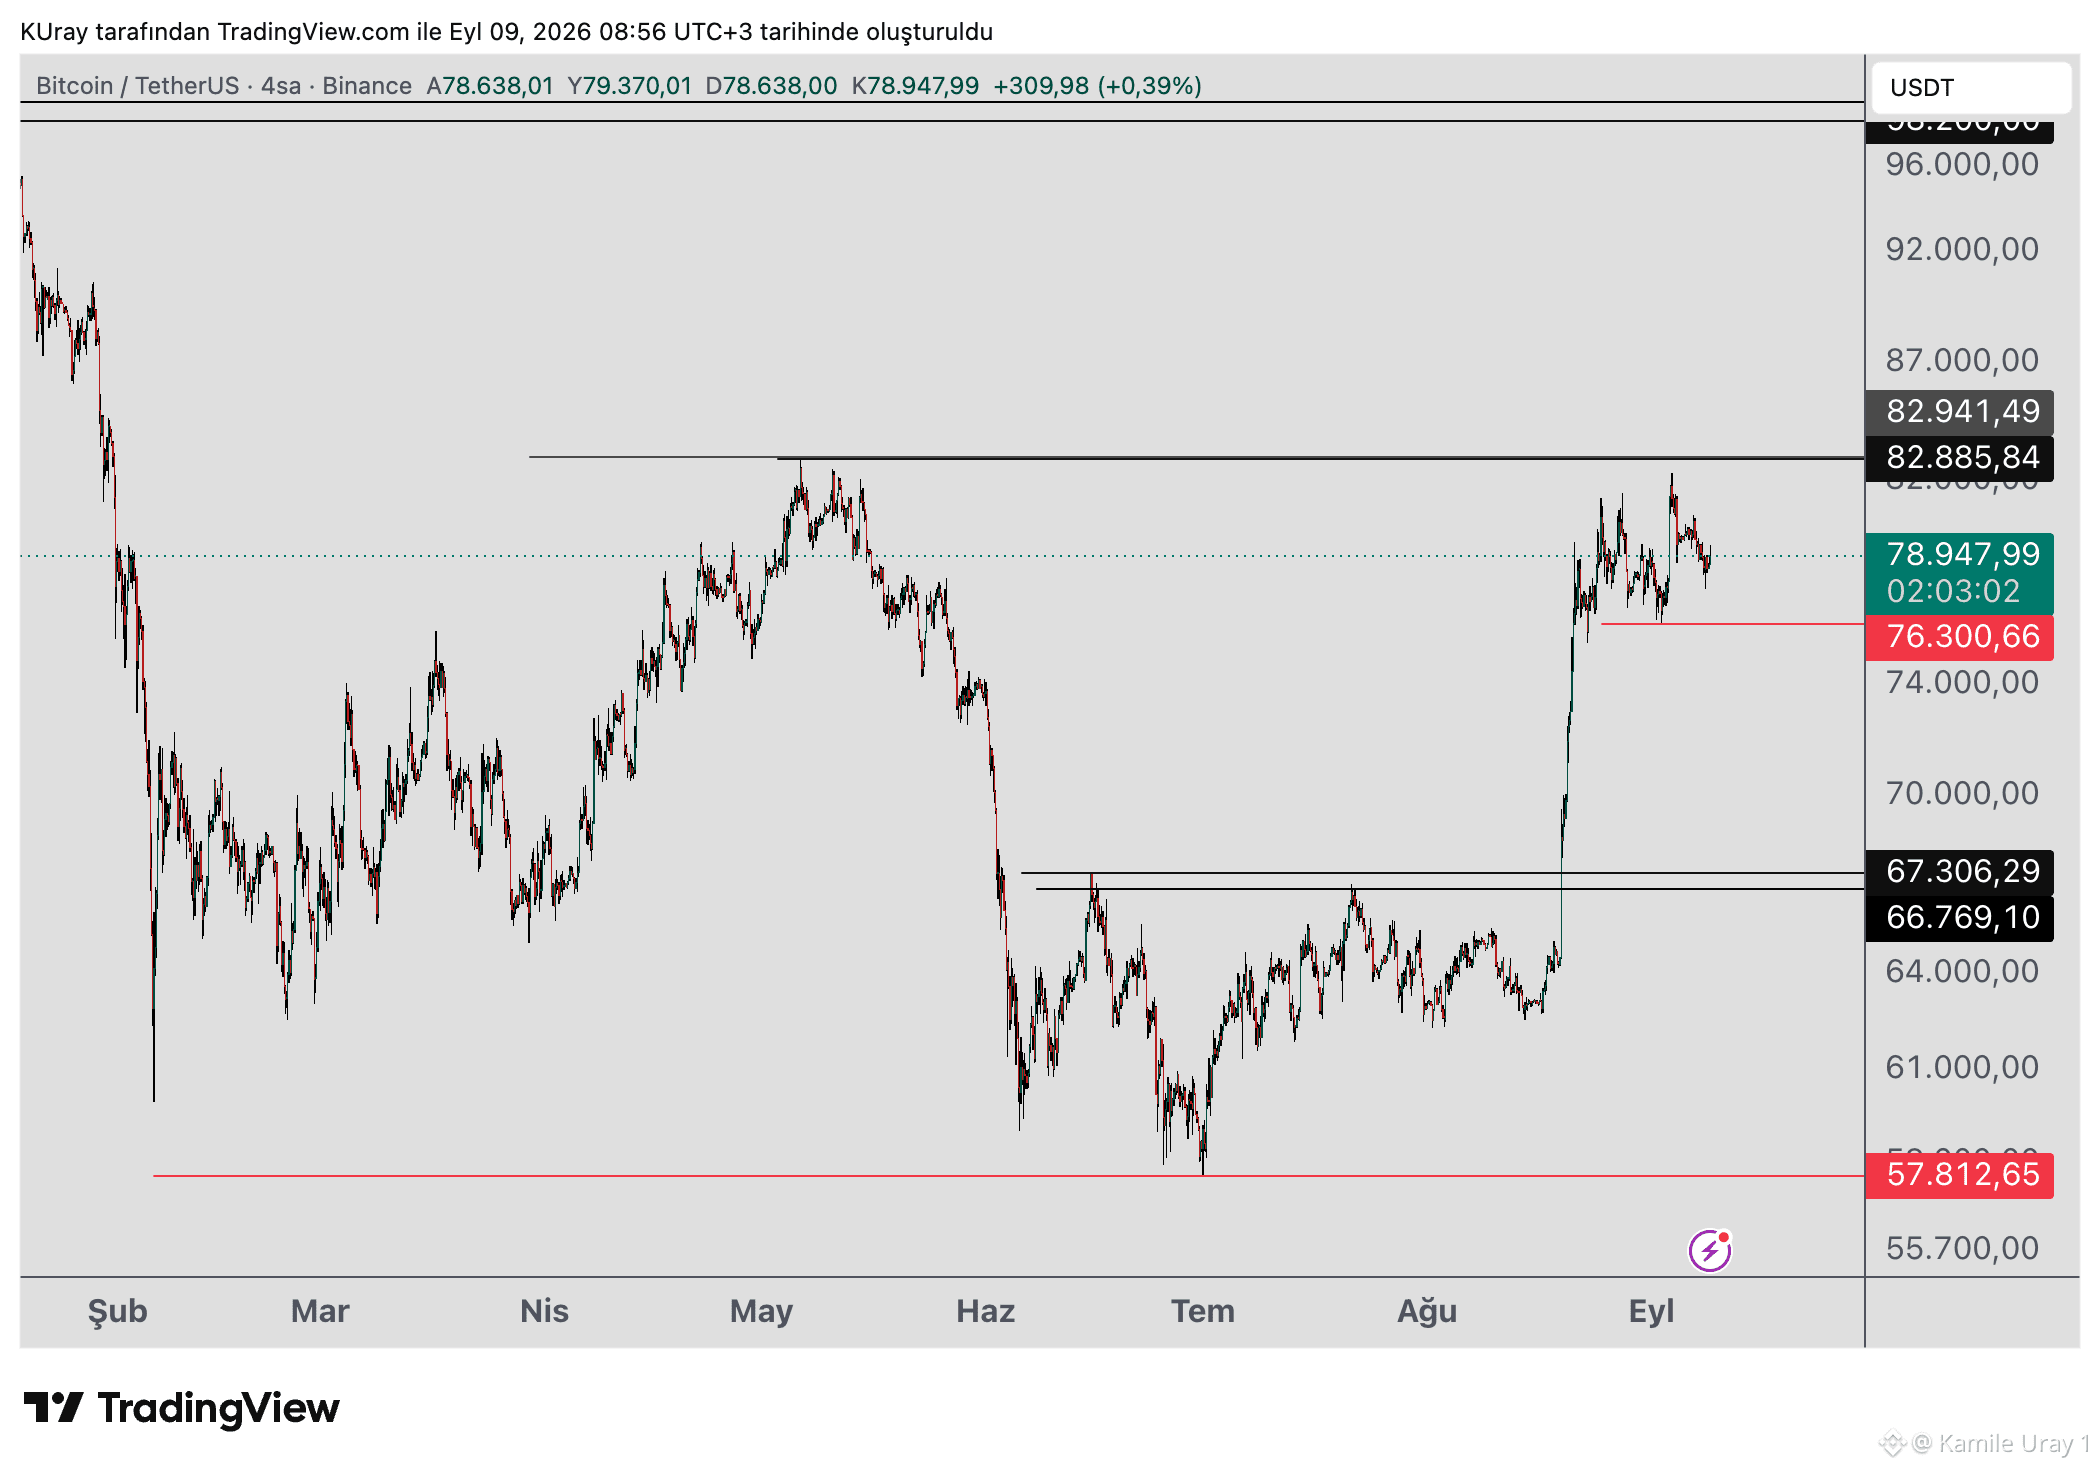
#BTC 只要價格保持在76,300上方,上行走勢的潛力就依然存在。若日線或周線收盤出現在82,885之上,這將標誌相較於最近一次下跌波段的首次更高峯值。隨後將進一步表明上升趨勢可能仍將延續,此時可繼續關注更高的阻力位。若價格收盤跌破76,300,則可能會測試67,000–66,000附近的支撐區域。這樣的下跌可能會構成潛在反向頭肩形態(H&S)的最後一個肩部。如果價格能守住83,000之上,該形態將被激活,預計價格將繼續上行並向更高阻力位靠近。
#BTC 只要價格保持在76,300上方,上行走勢的潛力就依然存在。若日線或周線收盤出現在82,885之上,這將標誌相較於最近一次下跌波段的首次更高峯值。隨後將進一步表明上升趨勢可能仍將延續,此時可繼續關注更高的阻力位。若價格收盤跌破76,300,則可能會測試67,000–66,000附近的支撐區域。這樣的下跌可能會構成潛在反向頭肩形態(H&S)的最後一個肩部。如果價格能守住83,000之上,該形態將被激活,預計價格將繼續上行並向更高阻力位靠近。
58
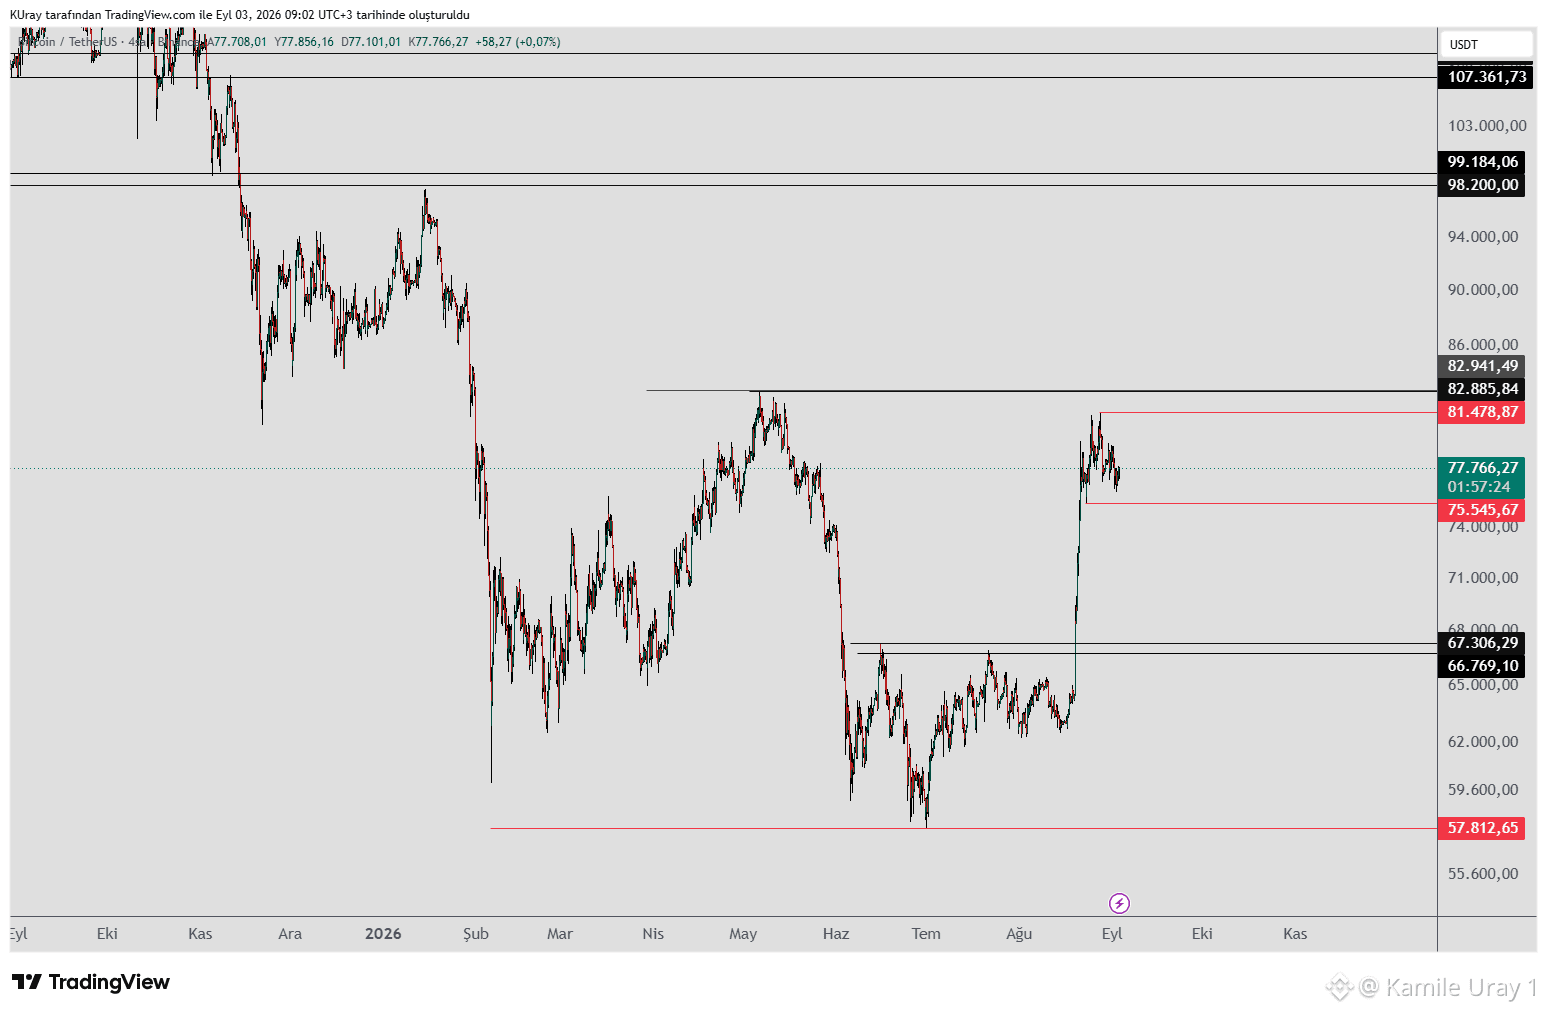
#BTC 過去八天一直在 81,478–75,545 區間內波動——價差達 6,000 美元。
如果價格收盤跌破 75,545,則可能測試 67,000–66,000 附近的支撐區域。這樣的回落可能會形成潛在反向頭肩(Inverse Head and Shoulders,IH&S)形態的最終“肩部”。儘管預期會出現下跌,但更大級別看漲 IH&S 形態的可能性正在浮現;若價格守在 83,000 上方,該形態將被激活,並預計價格將繼續上行、挑戰更高的阻力位。
如果日線與周線收盤價均在 82,885 上方,將意味着相較於最近那一段下跌波動出現了首個更高的高點,從而發出另一個積極信號:上升趨勢很可能會繼續。
#BTC 過去八天一直在 81,478–75,545 區間內波動——價差達 6,000 美元。
如果價格收盤跌破 75,545,則可能測試 67,000–66,000 附近的支撐區域。這樣的回落可能會形成潛在反向頭肩(Inverse Head and Shoulders,IH&S)形態的最終“肩部”。儘管預期會出現下跌,但更大級別看漲 IH&S 形態的可能性正在浮現;若價格守在 83,000 上方,該形態將被激活,並預計價格將繼續上行、挑戰更高的阻力位。
如果日線與周線收盤價均在 82,885 上方,將意味着相較於最近那一段下跌波動出現了首個更高的高點,從而發出另一個積極信號:上升趨勢很可能會繼續。
如果價格收盤跌破 75,545,則可能測試 67,000–66,000 附近的支撐區域。這樣的回落可能會形成潛在反向頭肩(Inverse Head and Shoulders,IH&S)形態的最終“肩部”。儘管預期會出現下跌,但更大級別看漲 IH&S 形態的可能性正在浮現;若價格守在 83,000 上方,該形態將被激活,並預計價格將繼續上行、挑戰更高的阻力位。
如果日線與周線收盤價均在 82,885 上方,將意味着相較於最近那一段下跌波動出現了首個更高的高點,從而發出另一個積極信號:上升趨勢很可能會繼續。
72
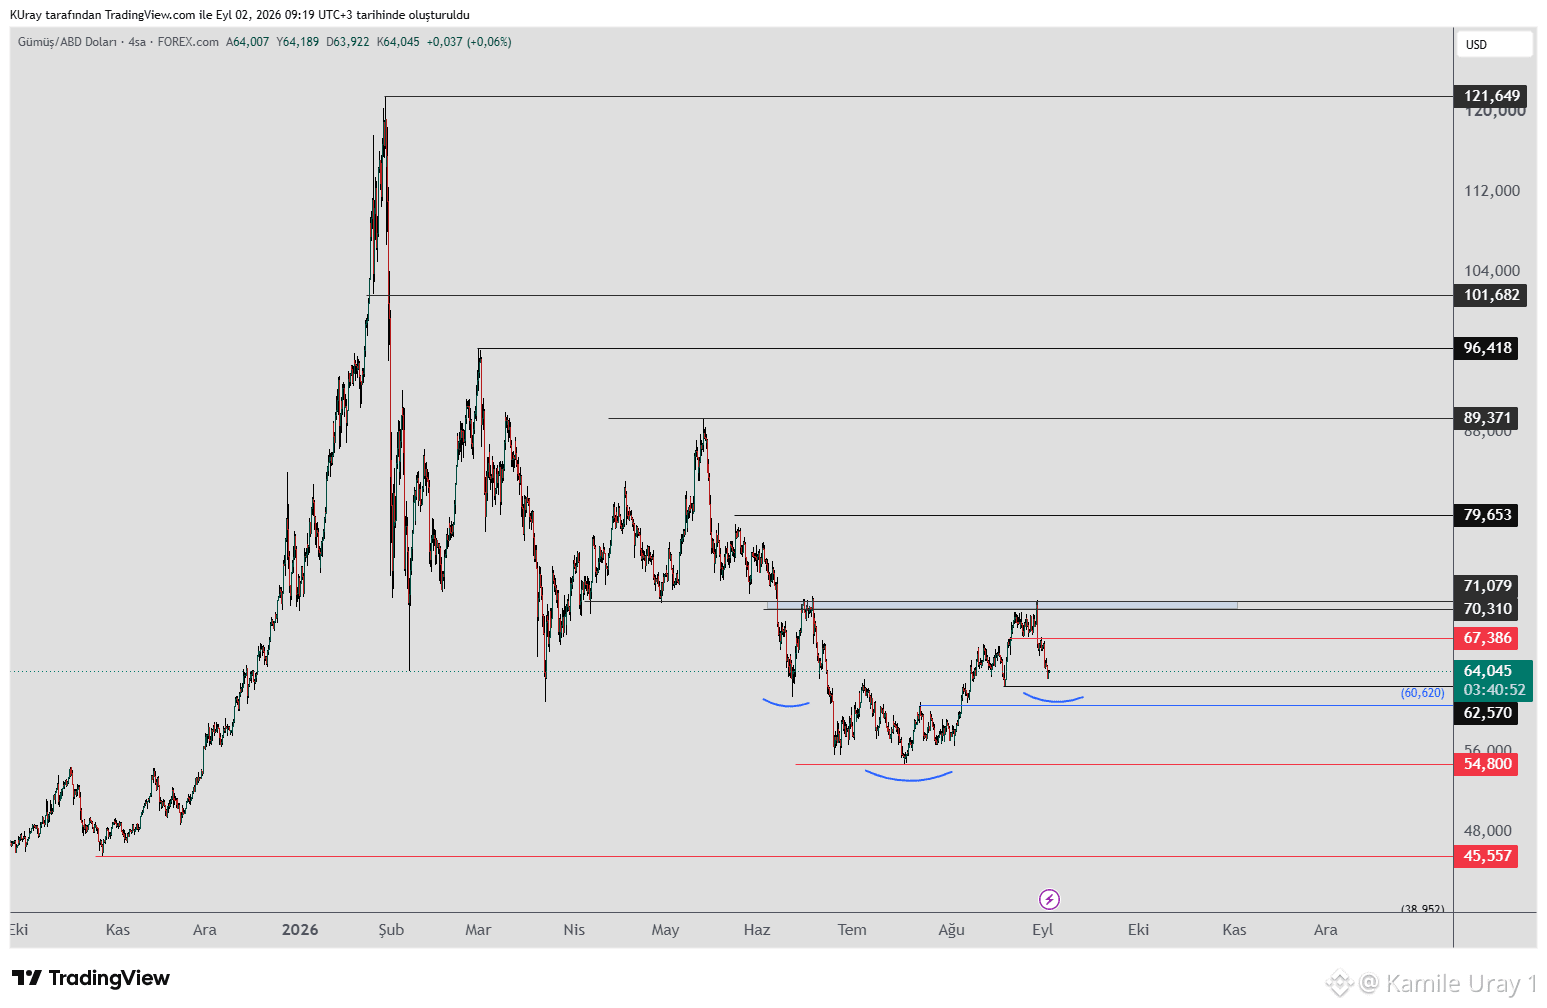
對於#XAG(銀),我們將監測日線圖中“藍色方框”處的阻力。具體而言,如果價格突破位於70–71區間內的藍色方框並在其上方收盤,則預計將進一步上行;隨後我們可以關注79和89這兩個阻力位。
只要價格仍保持在62上方,上行的可能性就依然存在。如果跌破62,我們將監測更低的支撐位。若在下跌過程中價格找到支撐,則預計將重新上攻。
從價格波動來看,向下的走勢仍持續呈現爲對整體上升趨勢的回調。
對於#XAG(銀),我們將監測日線圖中“藍色方框”處的阻力。具體而言,如果價格突破位於70–71區間內的藍色方框並在其上方收盤,則預計將進一步上行;隨後我們可以關注79和89這兩個阻力位。
只要價格仍保持在62上方,上行的可能性就依然存在。如果跌破62,我們將監測更低的支撐位。若在下跌過程中價格找到支撐,則預計將重新上攻。
從價格波動來看,向下的走勢仍持續呈現爲對整體上升趨勢的回調。
只要價格仍保持在62上方,上行的可能性就依然存在。如果跌破62,我們將監測更低的支撐位。若在下跌過程中價格找到支撐,則預計將重新上攻。
從價格波動來看,向下的走勢仍持續呈現爲對整體上升趨勢的回調。
61
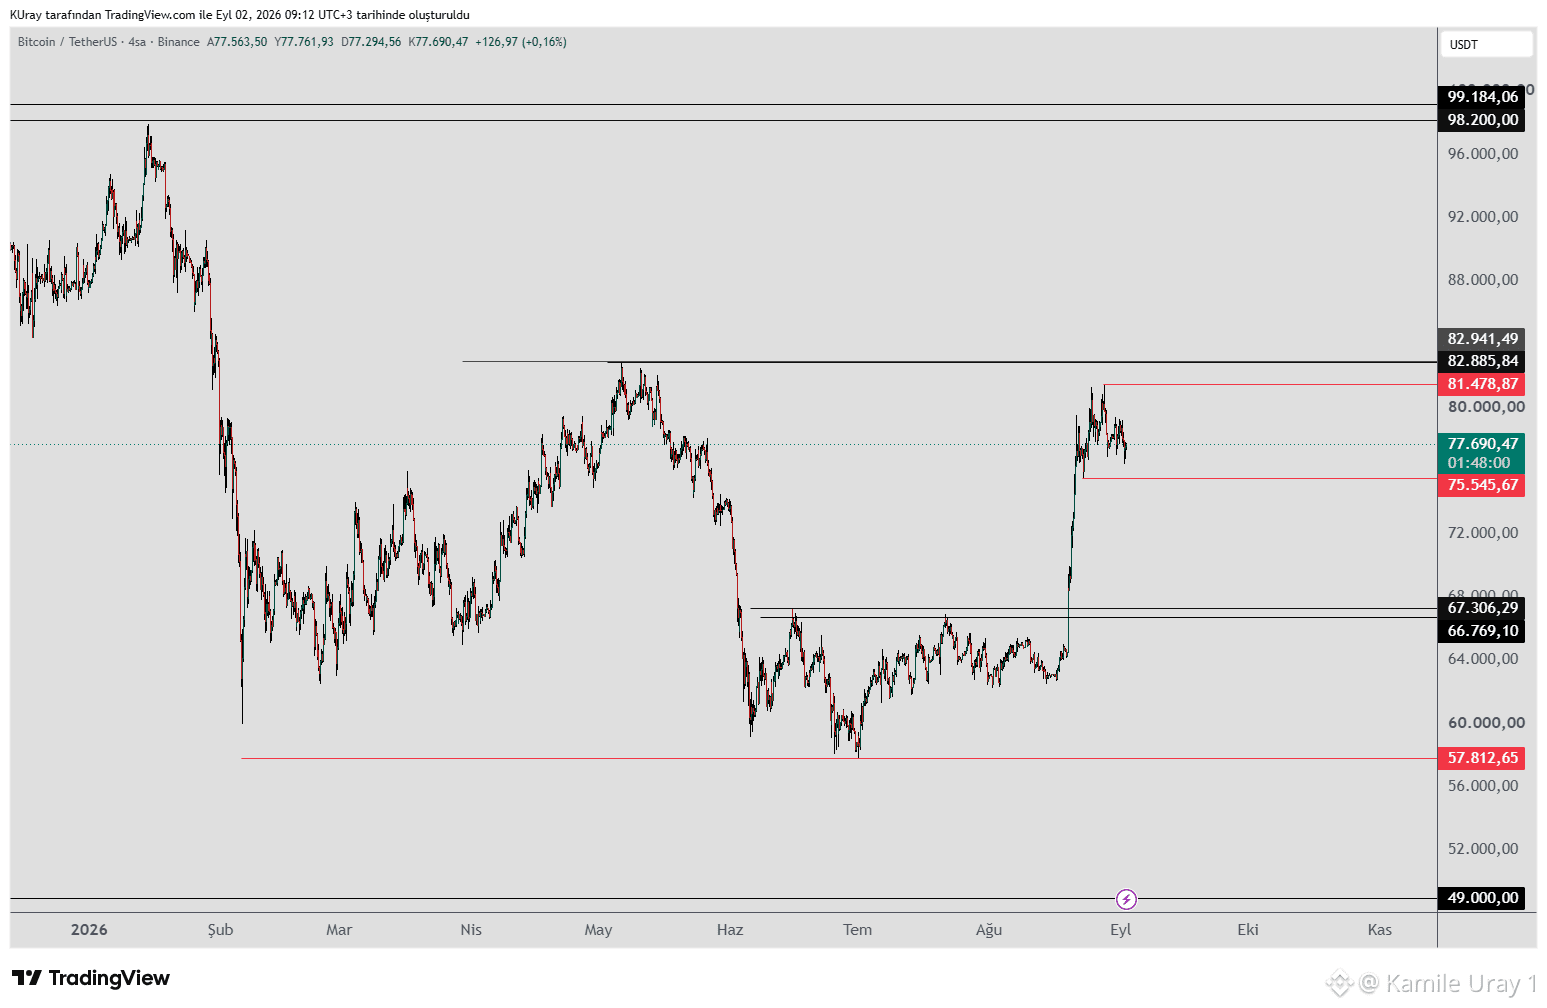
#BTC 保持不變,在 81,478–75,545 區間內震盪。目前的結構強化了進一步下跌的可能性;值得注意的是,上一次下跌波的反彈未能收盤站上前一波峯值。
若價格跌破 75,545,可能會測試支撐區域約 67,000–66,000。
這些下跌可能構成反向頭肩(H&S)形態的最後一個肩部。
雖然預期會下跌,但更大級別的看漲反向 H&S 形態的可能性正在出現。
若價格守在 83,000 上方,該形態將被觸發,並預計價格將繼續上漲,向上方阻力區域延伸。
若日線或周線收盤高於 82,885,將形成相對近期下跌波的第一個更高峯值,並作爲看漲趨勢可能繼續的正面信號。
#BTC 保持不變,在 81,478–75,545 區間內震盪。目前的結構強化了進一步下跌的可能性;值得注意的是,上一次下跌波的反彈未能收盤站上前一波峯值。
若價格跌破 75,545,可能會測試支撐區域約 67,000–66,000。
這些下跌可能構成反向頭肩(H&S)形態的最後一個肩部。
雖然預期會下跌,但更大級別的看漲反向 H&S 形態的可能性正在出現。
若價格守在 83,000 上方,該形態將被觸發,並預計價格將繼續上漲,向上方阻力區域延伸。
若日線或周線收盤高於 82,885,將形成相對近期下跌波的第一個更高峯值,並作爲看漲趨勢可能繼續的正面信號。
若價格跌破 75,545,可能會測試支撐區域約 67,000–66,000。
這些下跌可能構成反向頭肩(H&S)形態的最後一個肩部。
雖然預期會下跌,但更大級別的看漲反向 H&S 形態的可能性正在出現。
若價格守在 83,000 上方,該形態將被觸發,並預計價格將繼續上漲,向上方阻力區域延伸。
若日線或周線收盤高於 82,885,將形成相對近期下跌波的第一個更高峯值,並作爲看漲趨勢可能繼續的正面信號。
71
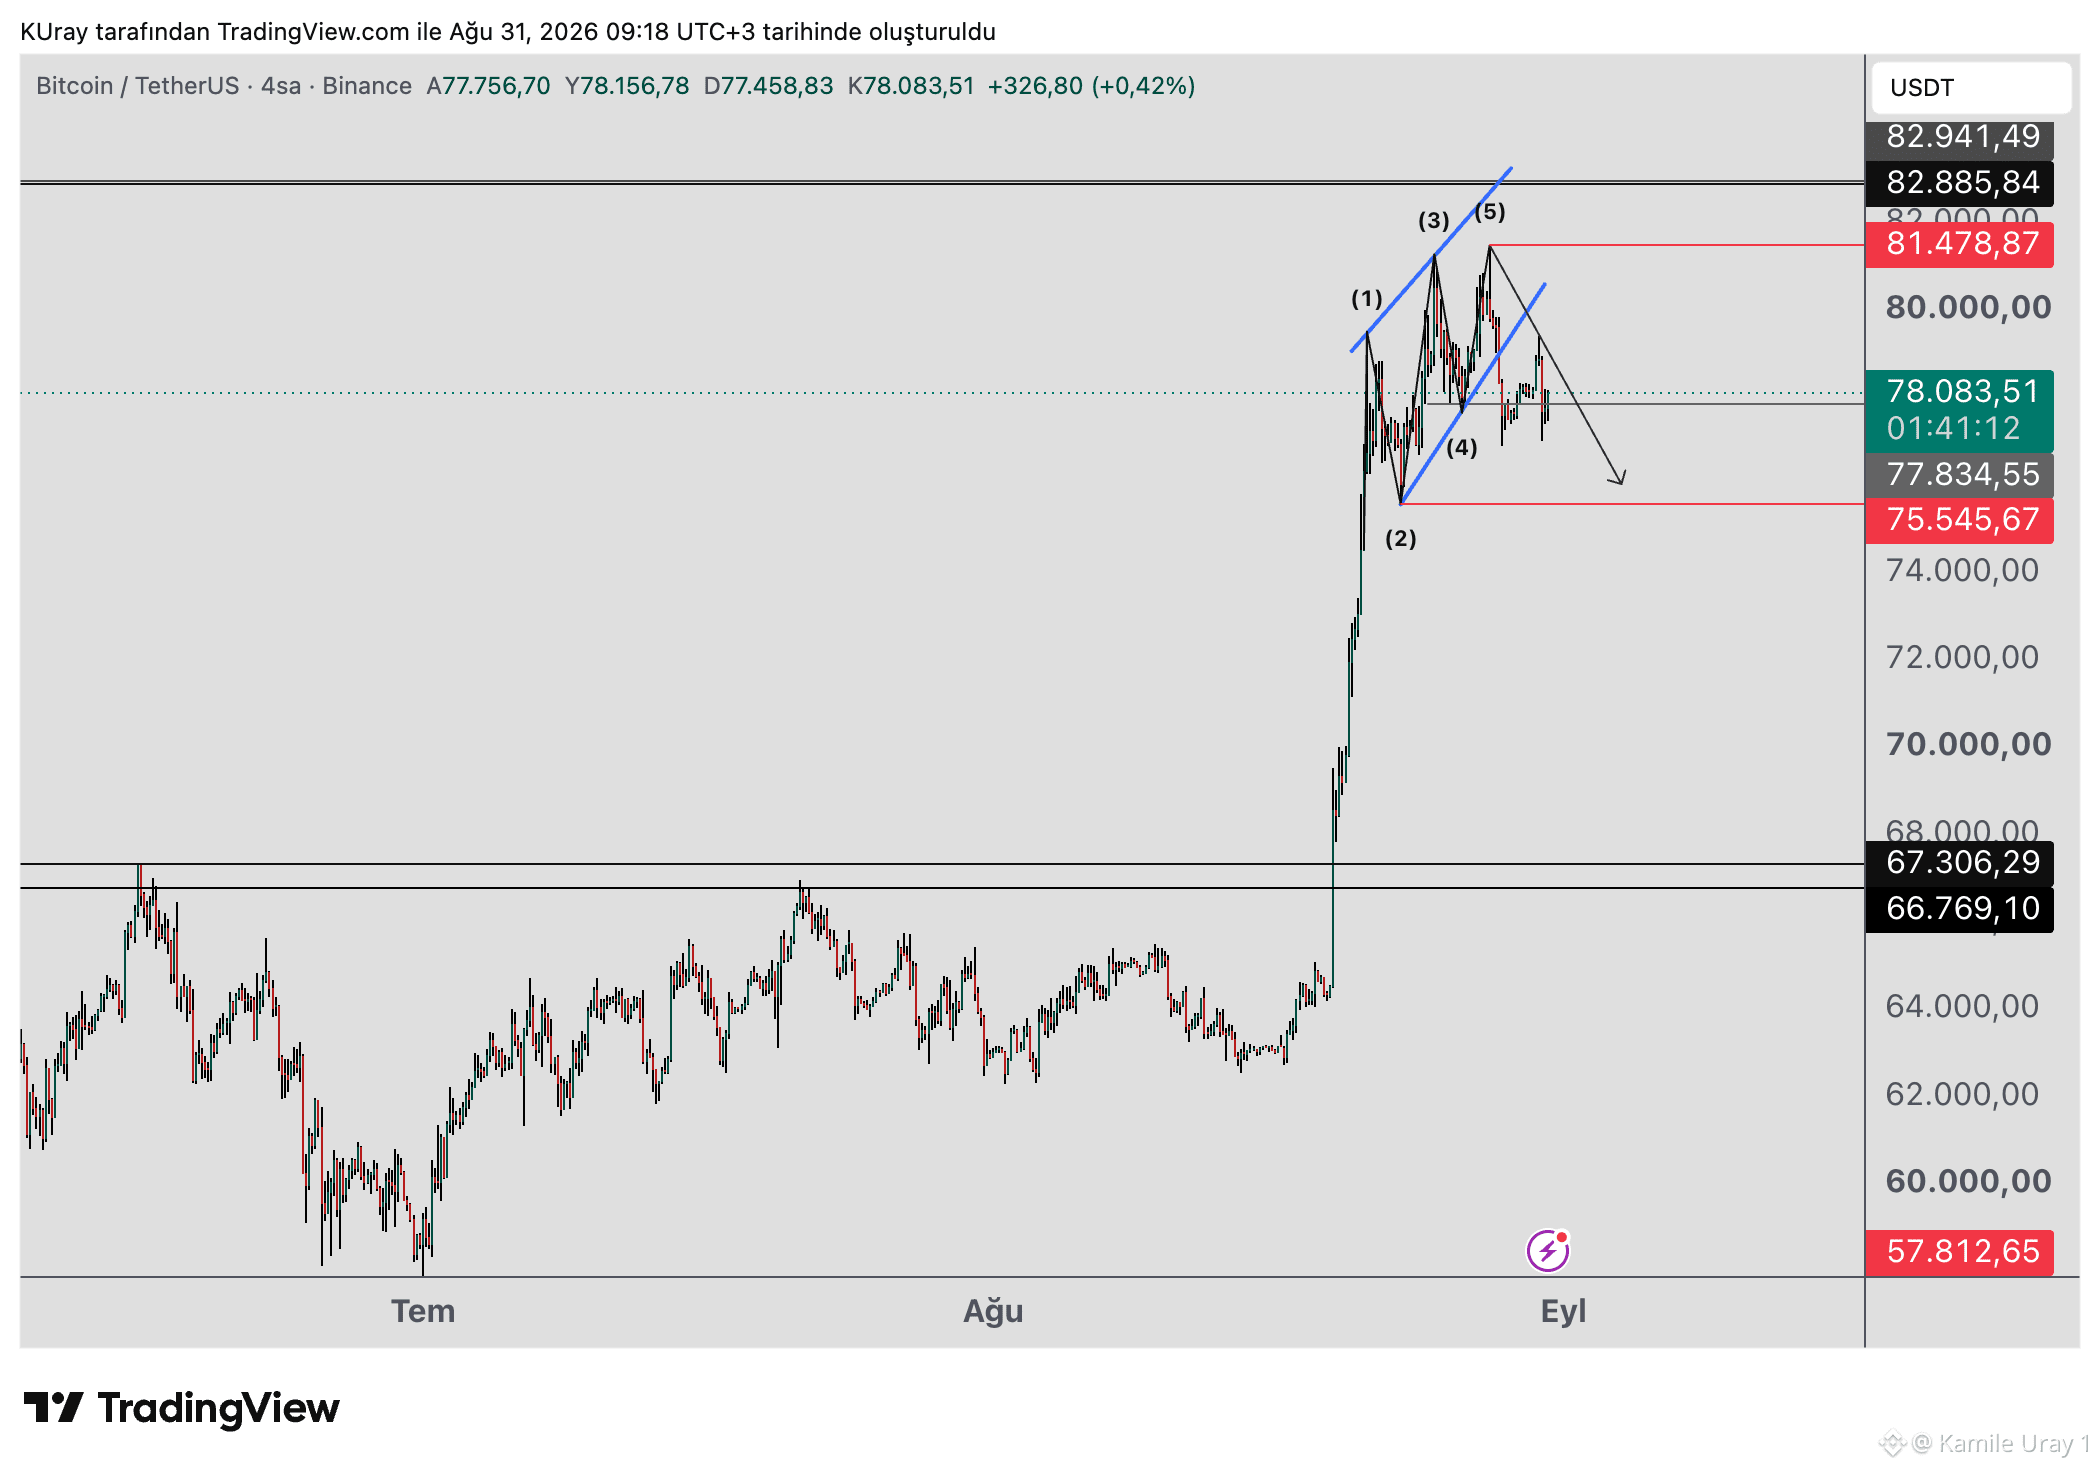
#BTC 在完成 Wolfe Wave(伍爾夫波浪)形態之前就下跌了;楔形結構隨後發揮作用。在楔形內部,賣壓已在標註爲“3”和“5”的高點逐步累積。高點出現了帶有長上影線的K線——這是該結構很可能觸發行情的關鍵指標。此外,在上漲過程中出現的 RSI 背離提供了第二個看跌信號,進一步確認了楔形的有效性。接下來我們將關注 81,478 這一峯值;若無法在 4 小時K線上方收盤於該水平之上,則下跌將繼續。下跌過程中 75,545 作爲首個支撐位;如果價格跌破並站不回該水平,跌勢可能進一步延伸,屆時或將測試 67,000–66,000 附近的支撐區域。此次下跌很可能構成反向頭肩(Inverse Head and Shoulders,IH&S)形態的最後一個肩部;如果價格守在 83,000 上方,形態將被觸發,並預計價格將繼續上行、指向更高的阻力區域。若價格在日線和周線兩個時間框架上都能收盤於 82,885 之上,這將相對近期的看跌波形成第一個更高的高點,釋放出利好信號,表明上升趨勢有望繼續。
#BTC 在完成 Wolfe Wave(伍爾夫波浪)形態之前就下跌了;楔形結構隨後發揮作用。在楔形內部,賣壓已在標註爲“3”和“5”的高點逐步累積。高點出現了帶有長上影線的K線——這是該結構很可能觸發行情的關鍵指標。此外,在上漲過程中出現的 RSI 背離提供了第二個看跌信號,進一步確認了楔形的有效性。接下來我們將關注 81,478 這一峯值;若無法在 4 小時K線上方收盤於該水平之上,則下跌將繼續。下跌過程中 75,545 作爲首個支撐位;如果價格跌破並站不回該水平,跌勢可能進一步延伸,屆時或將測試 67,000–66,000 附近的支撐區域。此次下跌很可能構成反向頭肩(Inverse Head and Shoulders,IH&S)形態的最後一個肩部;如果價格守在 83,000 上方,形態將被觸發,並預計價格將繼續上行、指向更高的阻力區域。若價格在日線和周線兩個時間框架上都能收盤於 82,885 之上,這將相對近期的看跌波形成第一個更高的高點,釋放出利好信號,表明上升趨勢有望繼續。
53
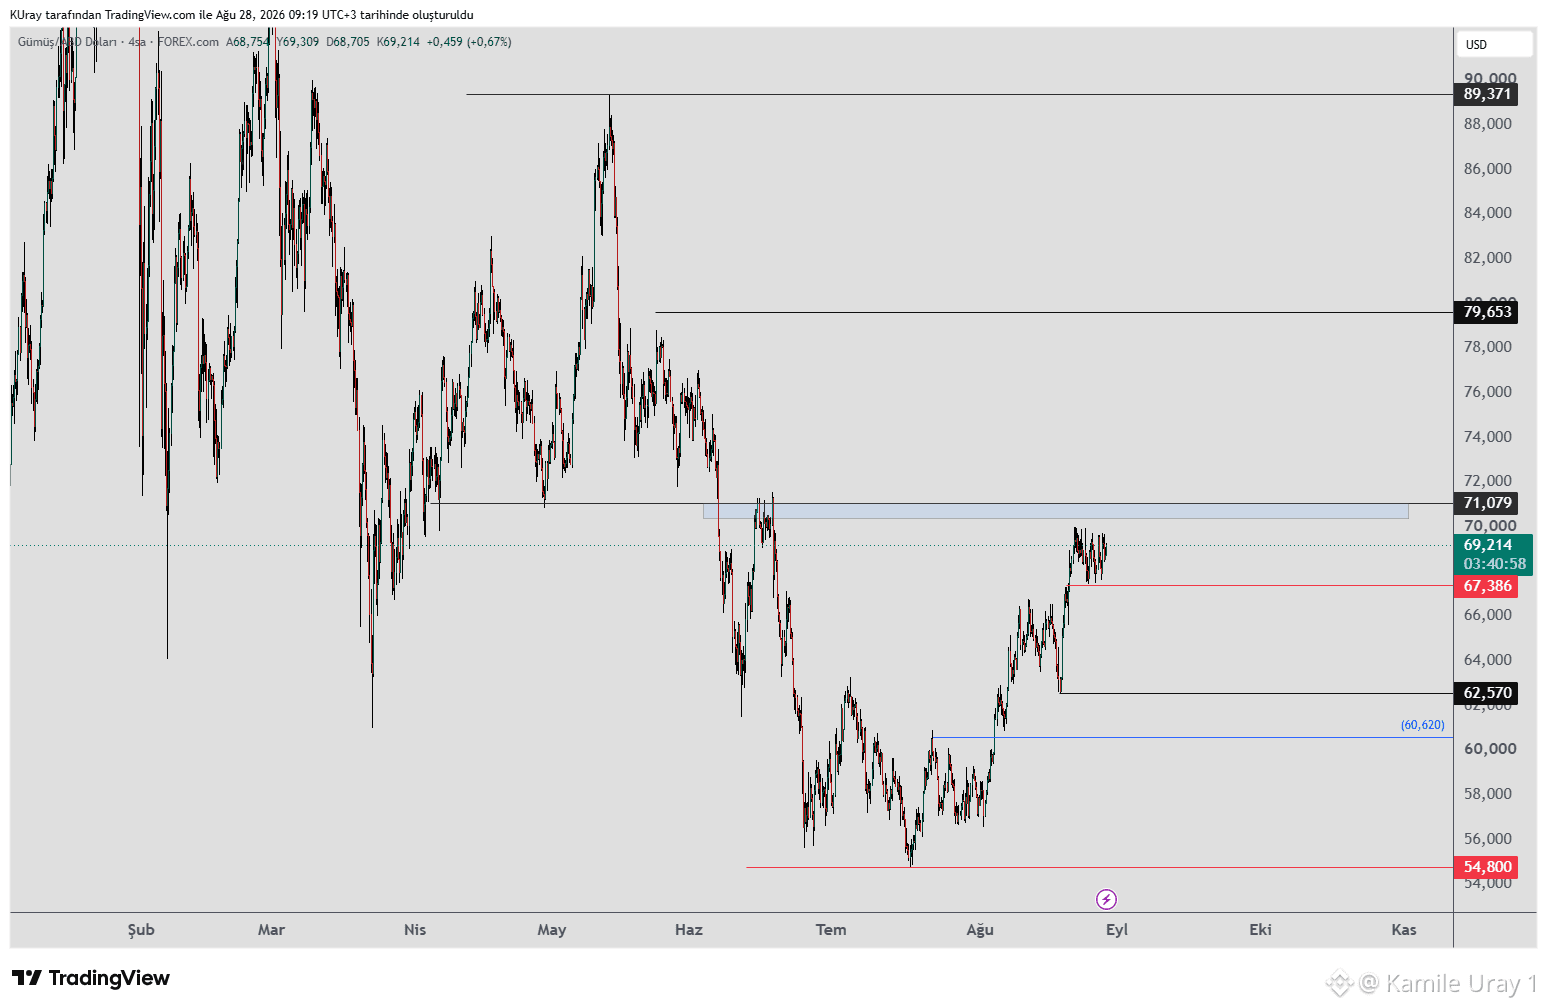
#xag #Silver 正在窄幅區間內交易。
它持守 67 點位,但未能收盤站上 71;目前處於整理階段。只要仍在 67 上方,就保留上行走勢的可能性。
如果它能夠在 71 這一藍色框上方維持倉位,我們將關注 79–89 的阻力位。
然而,如果它未能突破藍色框阻力並且收盤跌破 67,那麼下跌可能會繼續。
至於下行方面,只要價格在 4 小時圖表上仍保持在 62 上方,上行的潛在空間就依然存在。如果跌破 62,我們將轉而關注更低的支撐位。
#xag #Silver 正在窄幅區間內交易。
它持守 67 點位,但未能收盤站上 71;目前處於整理階段。只要仍在 67 上方,就保留上行走勢的可能性。
如果它能夠在 71 這一藍色框上方維持倉位,我們將關注 79–89 的阻力位。
然而,如果它未能突破藍色框阻力並且收盤跌破 67,那麼下跌可能會繼續。
至於下行方面,只要價格在 4 小時圖表上仍保持在 62 上方,上行的潛在空間就依然存在。如果跌破 62,我們將轉而關注更低的支撐位。
它持守 67 點位,但未能收盤站上 71;目前處於整理階段。只要仍在 67 上方,就保留上行走勢的可能性。
如果它能夠在 71 這一藍色框上方維持倉位,我們將關注 79–89 的阻力位。
然而,如果它未能突破藍色框阻力並且收盤跌破 67,那麼下跌可能會繼續。
至於下行方面,只要價格在 4 小時圖表上仍保持在 62 上方,上行的潛在空間就依然存在。如果跌破 62,我們將轉而關注更低的支撐位。
62
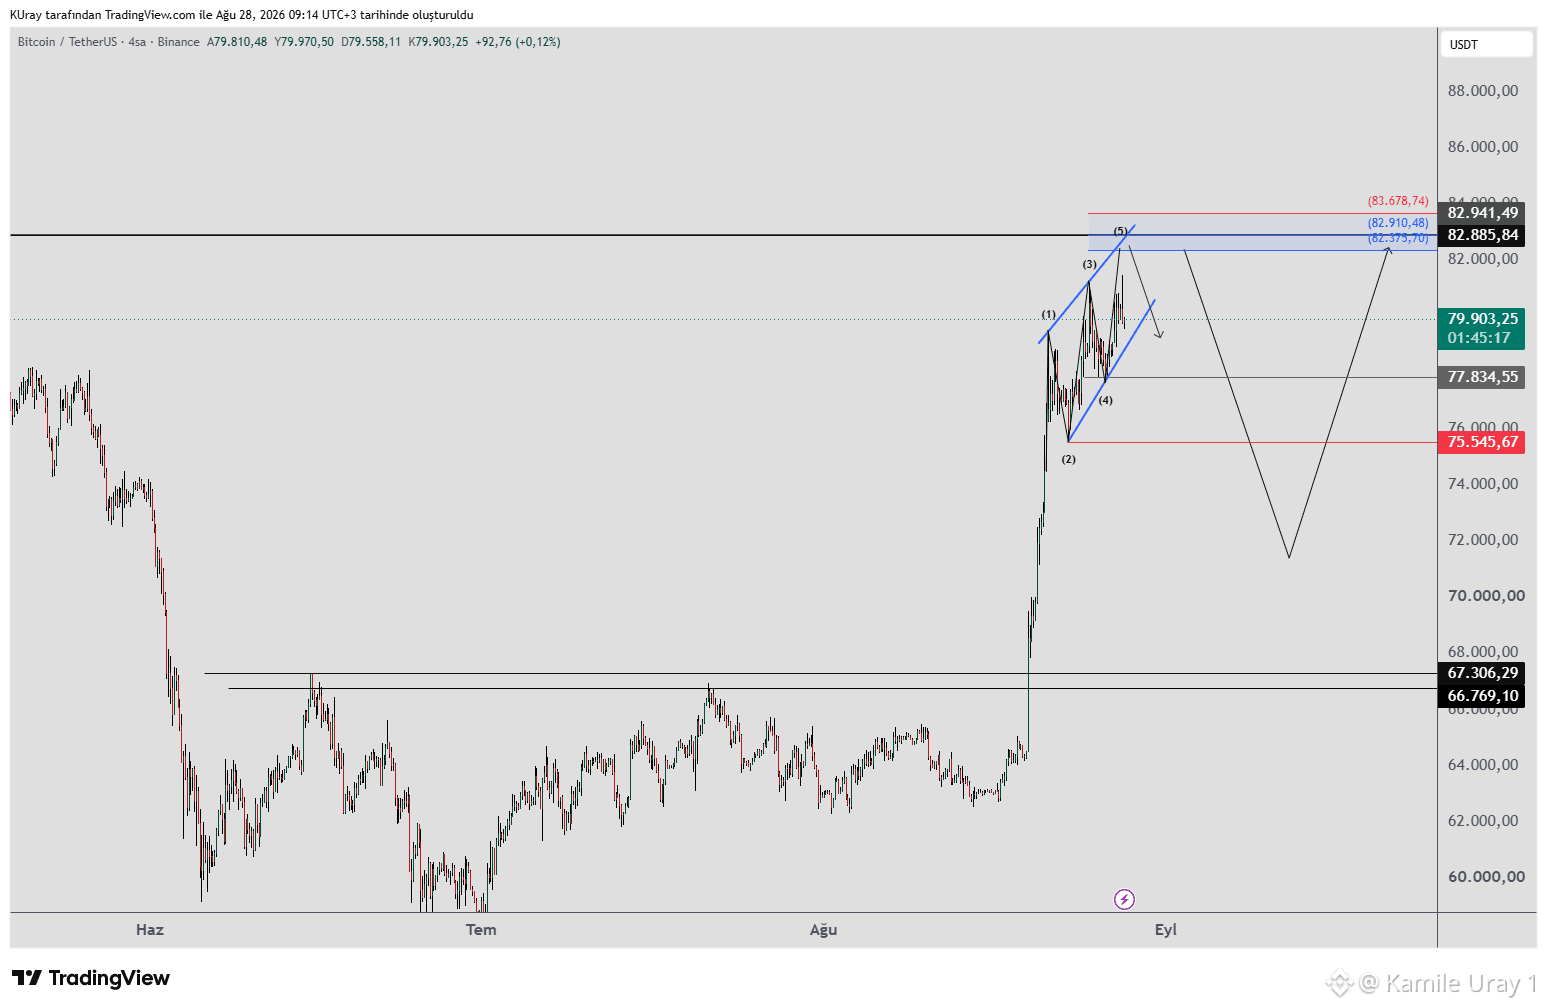
我們正在監測 #BTC 出現 Wolfe Wave(沃爾夫波)形態的可能性。如果價格上探至 82,400–82,900 區域,那裏可能會從下行動作開始。
該形態的止損條件爲:出現 4 小時K線收盤價高於 83,769;若發生這種情況,該形態將被否定。
在下行方面,75,545 是初始目標。如果價格跌破該水平,跌勢可能會進一步延伸。此次下跌很可能會構成反向頭肩(H&S)結構的最終肩部;如果隨後價格在 83,000 上方企穩,該形態將被激活,並預計價格將繼續上行,測試更高的阻力位。
如果日線或周線收盤價出現在 82,885 之上,這將形成相較於最近一次下跌波段的首個更高峯值。這是一個積極信號,表明上升趨勢很可能會繼續。
我們正在監測 #BTC 出現 Wolfe Wave(沃爾夫波)形態的可能性。如果價格上探至 82,400–82,900 區域,那裏可能會從下行動作開始。
該形態的止損條件爲:出現 4 小時K線收盤價高於 83,769;若發生這種情況,該形態將被否定。
在下行方面,75,545 是初始目標。如果價格跌破該水平,跌勢可能會進一步延伸。此次下跌很可能會構成反向頭肩(H&S)結構的最終肩部;如果隨後價格在 83,000 上方企穩,該形態將被激活,並預計價格將繼續上行,測試更高的阻力位。
如果日線或周線收盤價出現在 82,885 之上,這將形成相較於最近一次下跌波段的首個更高峯值。這是一個積極信號,表明上升趨勢很可能會繼續。
該形態的止損條件爲:出現 4 小時K線收盤價高於 83,769;若發生這種情況,該形態將被否定。
在下行方面,75,545 是初始目標。如果價格跌破該水平,跌勢可能會進一步延伸。此次下跌很可能會構成反向頭肩(H&S)結構的最終肩部;如果隨後價格在 83,000 上方企穩,該形態將被激活,並預計價格將繼續上行,測試更高的阻力位。
如果日線或周線收盤價出現在 82,885 之上,這將形成相較於最近一次下跌波段的首個更高峯值。這是一個積極信號,表明上升趨勢很可能會繼續。
76
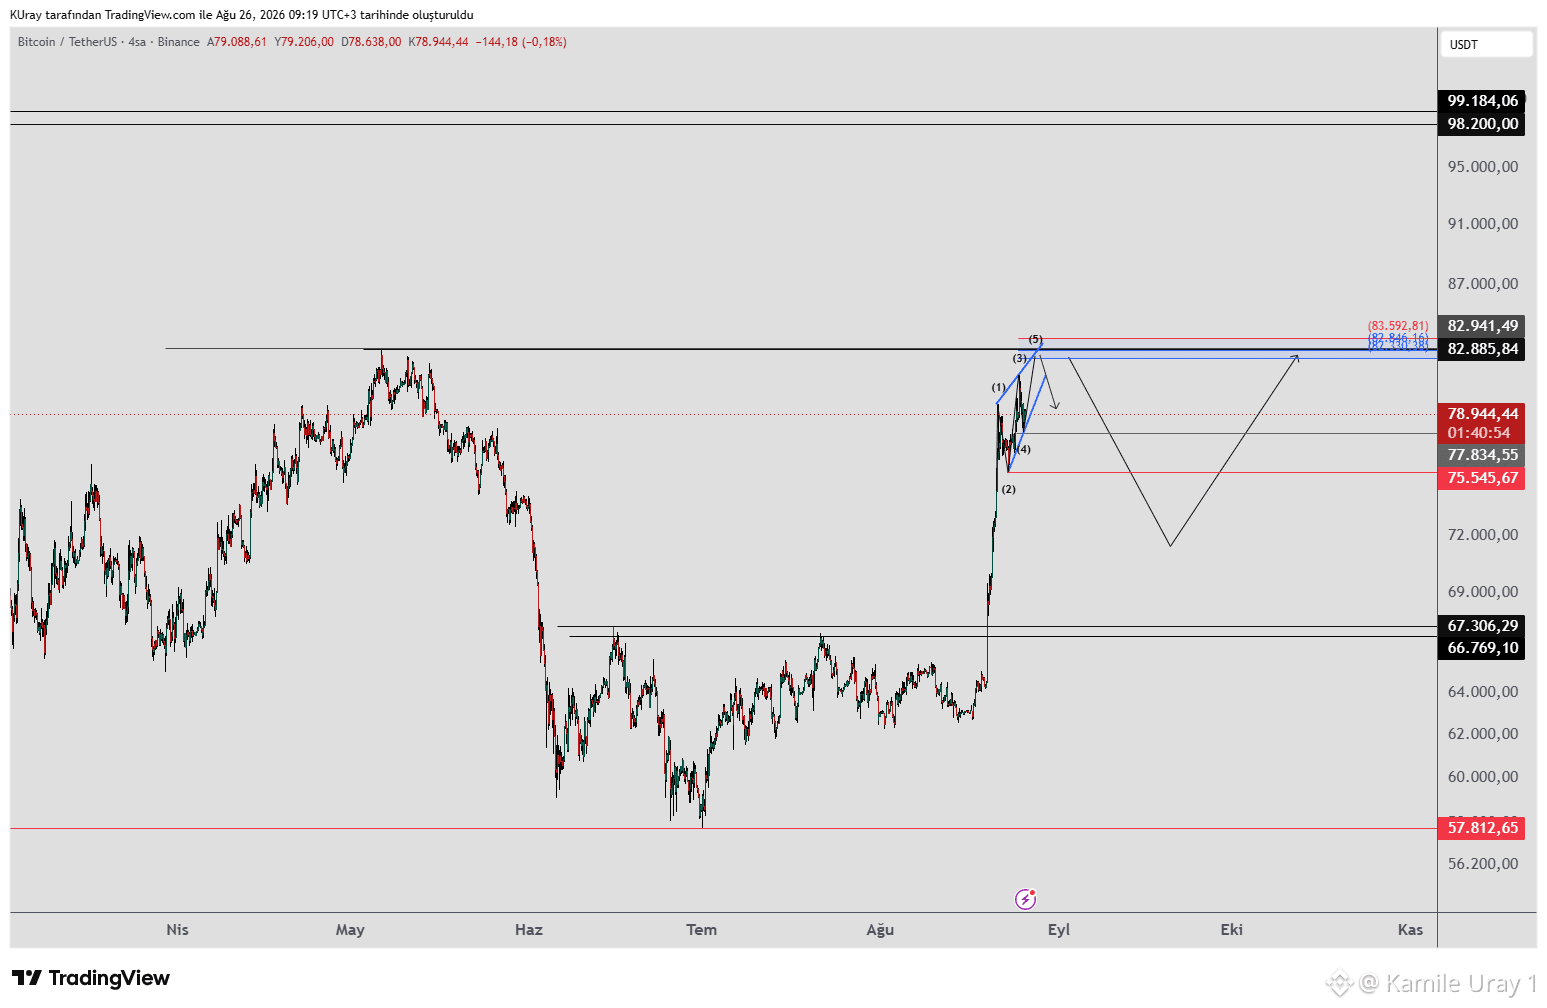
BTC繼續在4小時週期內守住75,545水平。然而在上漲過程中,波幅已經開始收縮,並且RSI上形成了背離。上行動能開始呈現Wolfe Wave(狼波)形態的特徵。該形態的結構如下:如果價格保持在77,834低點之上,可能還會出現一輪向上的波動。82,330–82,846區間在上漲過程中充當阻力位;自該區域可能會出現向下走勢。該形態的止損位爲:4小時K線收盤價高於83,592。向下方面,75,545水平是首要目標;如果價格跌破該水平,下跌可能會進一步延伸。此次下跌很可能構成“反向頭肩”(Inverse Head and Shoulders,H&S)結構的最後一個肩部;若價格守在83,000之上,形態將被確認,並預計將繼續上行至更高的阻力區域。若在日線和周線圖上出現收盤價高於82,885的情況,這將相對於最近一次下跌波形構成更高的高點。這是一個積極信號,表明上漲趨勢很可能會繼續。
BTC繼續在4小時週期內守住75,545水平。然而在上漲過程中,波幅已經開始收縮,並且RSI上形成了背離。上行動能開始呈現Wolfe Wave(狼波)形態的特徵。該形態的結構如下:如果價格保持在77,834低點之上,可能還會出現一輪向上的波動。82,330–82,846區間在上漲過程中充當阻力位;自該區域可能會出現向下走勢。該形態的止損位爲:4小時K線收盤價高於83,592。向下方面,75,545水平是首要目標;如果價格跌破該水平,下跌可能會進一步延伸。此次下跌很可能構成“反向頭肩”(Inverse Head and Shoulders,H&S)結構的最後一個肩部;若價格守在83,000之上,形態將被確認,並預計將繼續上行至更高的阻力區域。若在日線和周線圖上出現收盤價高於82,885的情況,這將相對於最近一次下跌波形構成更高的高點。這是一個積極信號,表明上漲趨勢很可能會繼續。
77
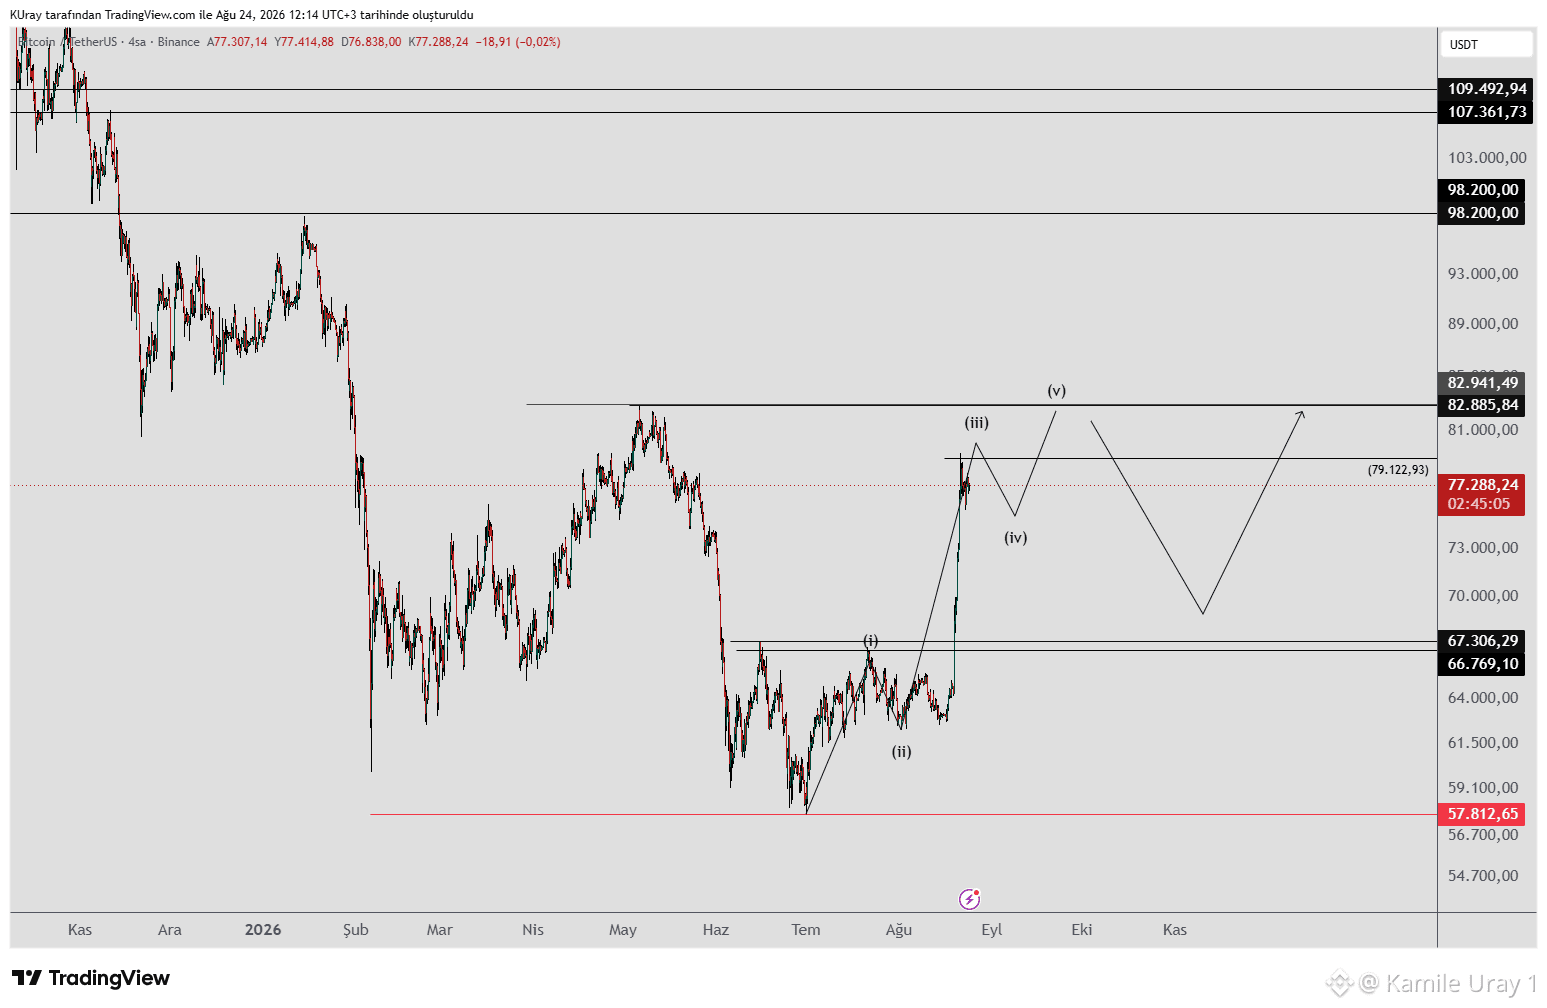
只要 #BTC 維持在 62,275 之上,我們就保持看漲展望;我預期在 67,000 可能會出現反向頭肩(H&S)形態。該形態已經實現並觸及目標。雖然我沒有分享新的圖表,但我標註了關鍵價位,我認爲可以通過圖表來跟蹤這段走勢。
71,000–75,000 的阻力位也已經被突破。觀察 4 小時結構,存在出現五浪走勢的可能。第 3 浪似乎已經結束,我們目前處在第 4 浪;在這裏進行短暫整固之後,可能會再次上攻。
這也提高了在反彈過程中測試 82,885 阻力位的概率。如果價格在日線和周線兩個時間框架上都收在 82,885 之上,這將標誌相對於最近那波看跌浪的首個更高高點——這是一個偏正面的信號,表明上漲趨勢很可能繼續。
如果價格按照我所描繪的波浪模式運行,可能會形成有利於進一步上漲的結構——例如反向 H&S 或 煮杯形態/杯柄形態(cup-and-handle)——一旦突破 82,885,價格可能會進一步走高。
我們將繼續密切監測波浪結構。
只要 #BTC 維持在 62,275 之上,我們就保持看漲展望;我預期在 67,000 可能會出現反向頭肩(H&S)形態。該形態已經實現並觸及目標。雖然我沒有分享新的圖表,但我標註了關鍵價位,我認爲可以通過圖表來跟蹤這段走勢。
71,000–75,000 的阻力位也已經被突破。觀察 4 小時結構,存在出現五浪走勢的可能。第 3 浪似乎已經結束,我們目前處在第 4 浪;在這裏進行短暫整固之後,可能會再次上攻。
這也提高了在反彈過程中測試 82,885 阻力位的概率。如果價格在日線和周線兩個時間框架上都收在 82,885 之上,這將標誌相對於最近那波看跌浪的首個更高高點——這是一個偏正面的信號,表明上漲趨勢很可能繼續。
如果價格按照我所描繪的波浪模式運行,可能會形成有利於進一步上漲的結構——例如反向 H&S 或 煮杯形態/杯柄形態(cup-and-handle)——一旦突破 82,885,價格可能會進一步走高。
我們將繼續密切監測波浪結構。
71,000–75,000 的阻力位也已經被突破。觀察 4 小時結構,存在出現五浪走勢的可能。第 3 浪似乎已經結束,我們目前處在第 4 浪;在這裏進行短暫整固之後,可能會再次上攻。
這也提高了在反彈過程中測試 82,885 阻力位的概率。如果價格在日線和周線兩個時間框架上都收在 82,885 之上,這將標誌相對於最近那波看跌浪的首個更高高點——這是一個偏正面的信號,表明上漲趨勢很可能繼續。
如果價格按照我所描繪的波浪模式運行,可能會形成有利於進一步上漲的結構——例如反向 H&S 或 煮杯形態/杯柄形態(cup-and-handle)——一旦突破 82,885,價格可能會進一步走高。
我們將繼續密切監測波浪結構。
75
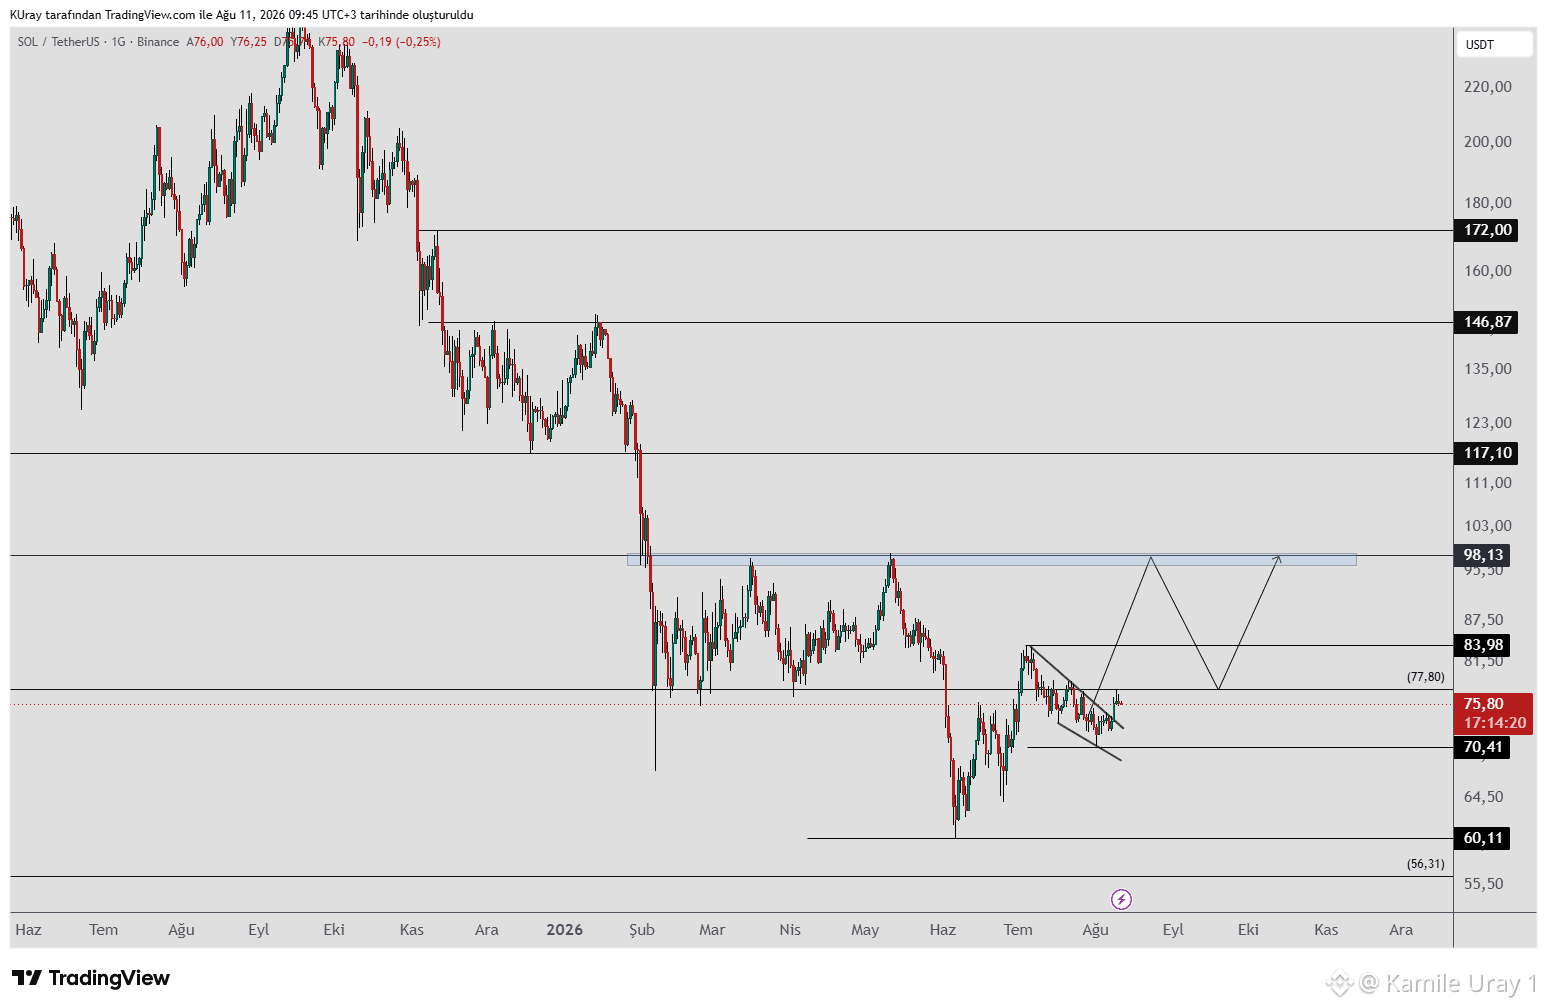
它已打破左側楔形結構。只要守住 70 關口(低點),就有上漲的可能;可以留意 83 與 93 的阻力位。若它依照我用箭頭所指示的走勢前進,將會形成反向頭肩(H&S)形態;一旦突破藍色區塊並使價格在其上方站穩,可能會測試 117–146 的阻力區間。
它已打破左側楔形結構。只要守住 70 關口(低點),就有上漲的可能;可以留意 83 與 93 的阻力位。若它依照我用箭頭所指示的走勢前進,將會形成反向頭肩(H&S)形態;一旦突破藍色區塊並使價格在其上方站穩,可能會測試 117–146 的阻力區間。
58
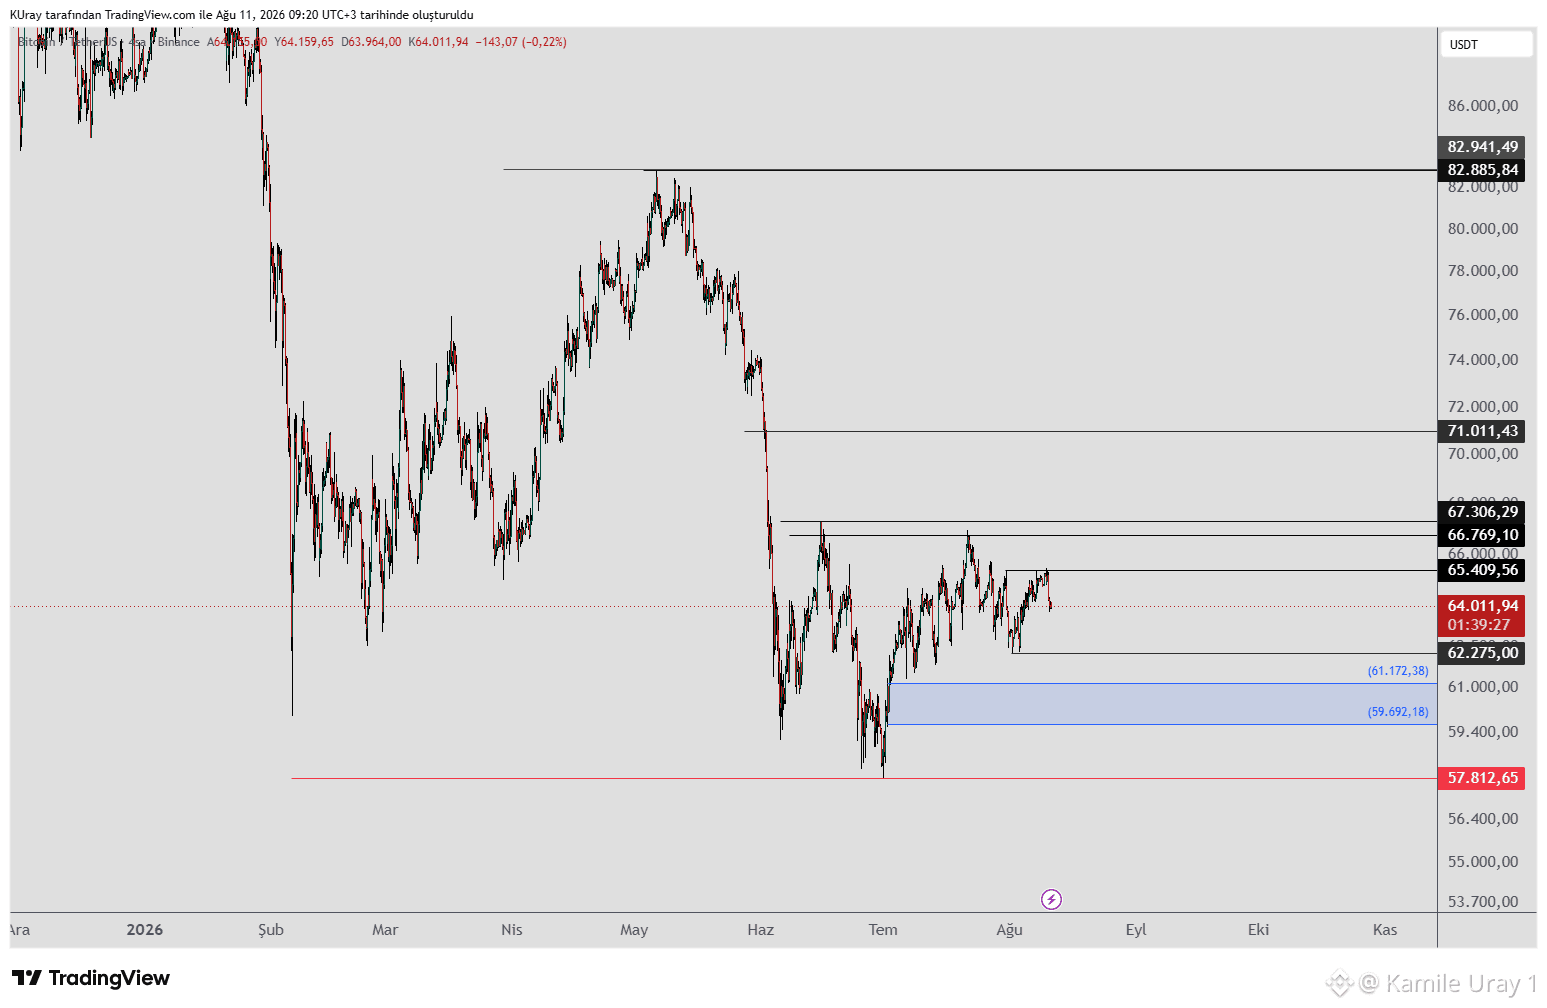
#BTC 只要站穩 62,275 之上的區間,就能維持偏多的情境。若收盤站上 65,409,反向頭肩(H&S)形態的「肩部」可能會被完成;收盤站上 67,000 則會啟動該形態,並可望延續上升趨勢。
只要維持在 67,000 之上,就存在測試阻力位 71,000、75,000 與 82,885 的可能。
若在日線與週線兩個週期中都出現站上 82,885 的收盤,將代表相較於最近一波下行走勢出現了首次更高的高點。這是一個正面的訊號,顯示上升趨勢很可能仍將延續。
在 4 小時圖上若未能收盤站上 65,409,可能會導致下跌;若收盤跌破 62,275,則近期反彈將被重新歸類為下跌趨勢中的單純修正反彈,並預期仍會持續下行。
在下跌期間,59,000–61,000 區間會作為支撐區(與 0.618–0.786 的斐波那契區間一致)。這裡可能會成為買方介入的區域;若價格在此企穩,可能接著迎來下一次上攻嘗試。
若下跌進一步加深,且週線收盤跌破 57,000,價格可能會測試 49,000–50,000 區間的支撐位。
#BTC 只要站穩 62,275 之上的區間,就能維持偏多的情境。若收盤站上 65,409,反向頭肩(H&S)形態的「肩部」可能會被完成;收盤站上 67,000 則會啟動該形態,並可望延續上升趨勢。
只要維持在 67,000 之上,就存在測試阻力位 71,000、75,000 與 82,885 的可能。
若在日線與週線兩個週期中都出現站上 82,885 的收盤,將代表相較於最近一波下行走勢出現了首次更高的高點。這是一個正面的訊號,顯示上升趨勢很可能仍將延續。
在 4 小時圖上若未能收盤站上 65,409,可能會導致下跌;若收盤跌破 62,275,則近期反彈將被重新歸類為下跌趨勢中的單純修正反彈,並預期仍會持續下行。
在下跌期間,59,000–61,000 區間會作為支撐區(與 0.618–0.786 的斐波那契區間一致)。這裡可能會成為買方介入的區域;若價格在此企穩,可能接著迎來下一次上攻嘗試。
若下跌進一步加深,且週線收盤跌破 57,000,價格可能會測試 49,000–50,000 區間的支撐位。
只要維持在 67,000 之上,就存在測試阻力位 71,000、75,000 與 82,885 的可能。
若在日線與週線兩個週期中都出現站上 82,885 的收盤,將代表相較於最近一波下行走勢出現了首次更高的高點。這是一個正面的訊號,顯示上升趨勢很可能仍將延續。
在 4 小時圖上若未能收盤站上 65,409,可能會導致下跌;若收盤跌破 62,275,則近期反彈將被重新歸類為下跌趨勢中的單純修正反彈,並預期仍會持續下行。
在下跌期間,59,000–61,000 區間會作為支撐區(與 0.618–0.786 的斐波那契區間一致)。這裡可能會成為買方介入的區域;若價格在此企穩,可能接著迎來下一次上攻嘗試。
若下跌進一步加深,且週線收盤跌破 57,000,價格可能會測試 49,000–50,000 區間的支撐位。
77
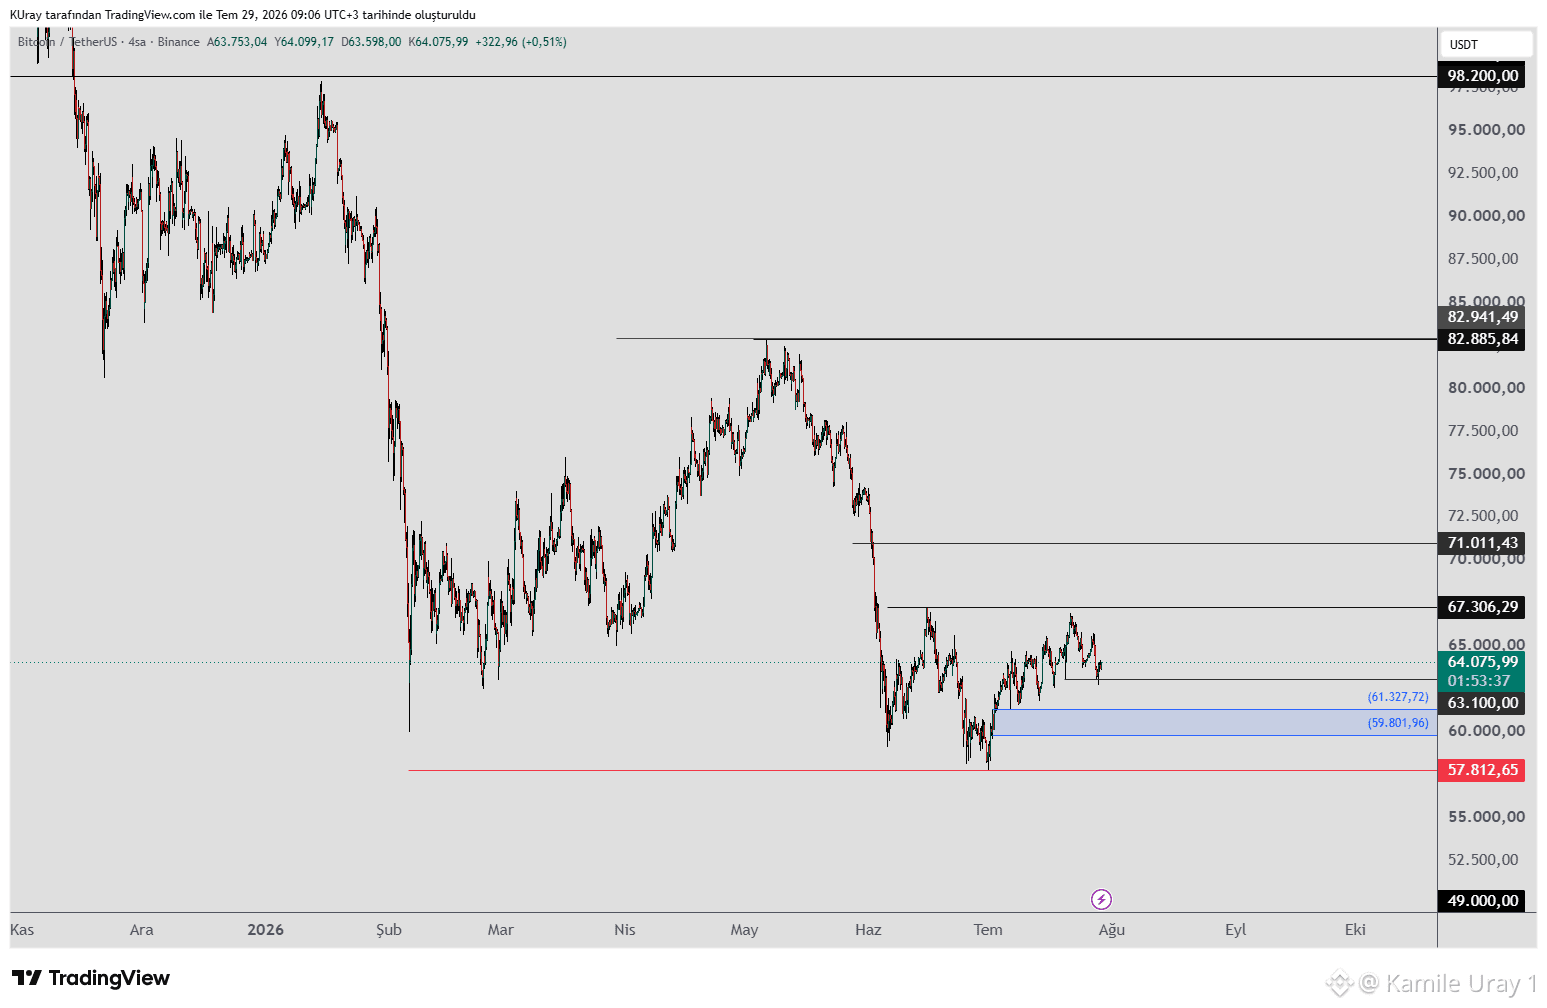
#BTC 正在守住 63,100 這個關鍵位置;向上朝 67,500 阻力推進的走勢可能仍會延續。若其能夠維持在該阻力之上,則有可能測試 71,000、75,000 以及 82,885 這些阻力位。
若日線或週線收盤出現在 82,885 之上,將標誌著相對於近期下跌波的第一個更高高點。這是一個偏正面的訊號,顯示上升趨勢很可能仍會延續。
若跌破 63,100,59,000–61,000 區間將充當斐波那契支撐區。若能守住此水準,隨後可能會再嘗試向上推進。
若回落持續,且週線收盤跌破 57,000,則持續下跌趨勢的可能性會提高,進而可能下探至 49,000–50,000 的支撐位。
#BTC 正在守住 63,100 這個關鍵位置;向上朝 67,500 阻力推進的走勢可能仍會延續。若其能夠維持在該阻力之上,則有可能測試 71,000、75,000 以及 82,885 這些阻力位。
若日線或週線收盤出現在 82,885 之上,將標誌著相對於近期下跌波的第一個更高高點。這是一個偏正面的訊號,顯示上升趨勢很可能仍會延續。
若跌破 63,100,59,000–61,000 區間將充當斐波那契支撐區。若能守住此水準,隨後可能會再嘗試向上推進。
若回落持續,且週線收盤跌破 57,000,則持續下跌趨勢的可能性會提高,進而可能下探至 49,000–50,000 的支撐位。
若日線或週線收盤出現在 82,885 之上,將標誌著相對於近期下跌波的第一個更高高點。這是一個偏正面的訊號,顯示上升趨勢很可能仍會延續。
若跌破 63,100,59,000–61,000 區間將充當斐波那契支撐區。若能守住此水準,隨後可能會再嘗試向上推進。
若回落持續,且週線收盤跌破 57,000,則持續下跌趨勢的可能性會提高,進而可能下探至 49,000–50,000 的支撐位。
70
登入以探索更多內容
加入幣安廣場中的全球加密貨幣用戶
⚡️ 獲取加密貨幣的最新和實用資訊。
💬 受到全球最大加密貨幣交易所的信任。
👍 發掘來自經過驗證創作者的真實見解。
電子郵件 / 電話號碼
熱門話題
韩国拟将股票债券纳入代币化证券
14,956 次瀏覽
72 討論中
$SAMSUNG 韓國擬將股票債券納入代幣化證券🔥
════════════════════
🔴 $SAMSUNG 韓國擬將股票債券納入代幣化證券 短期偏多
⚠️技術面:SAMSUNG報199.59,日線在177.88支撐與211.24壓力間震盪,1h均線剛形成多頭排列發散向上,短線偏強;但4h成交量比僅0.35,金叉後放量不明顯,若能放量突破211.24壓力則打開上行空間,否則回踩177.88支撐概率大,KDJ若K上穿D且未進入超買區則動能可延續。
📢市場動態:韓國擬將股票債券納入代幣化證券,傳統資產上鍊預期升溫,三星作爲韓國核心藍籌直接受益於代幣化證券概念;另平臺發佈SAMSUNGUSDT永續合約分紅調整公告,合約交易活躍度有望提升。
════════════════════
🔔 關注獲取第一手行情異動 🔔
#技术分析 #韩国拟将股票债券纳入代币化证券 #SAMSUNG
📌 交易時注意k線形態是否符合
Crypo量化
·0 人按讚
·321 次瀏覽
MetaMask安全事件后撤出Lido验证节点
49,536 次瀏覽
141 討論中
美光业绩超预期并上调指引
41,876 次瀏覽
103 討論中