

Mr Bullish 🚀
67 貼文

Mr Bullish 🚀
舉報
封鎖用戶
Sharing technical analysis, market insights, and trading perspectives to help the community better understand crypto market structure and price action.
0 關注
2 粉絲
7 點讚數
貼文
·
--
🚀 $BCH 更新:看這個走勢!當價格站在約 220 附近時,我就告訴你們,這裡可能會展開一波看漲反轉。現在看看結果。👀 $BCH 已一路推升至 251 附近,讓我們從進場區域獲得約 +18% 的漲幅。📈 🎯 我們原本的目標仍然是 305。這就是為什麼耐心和正確的佈局很重要。不要追漲。等反轉出現,抓住它。🔥
🚀 $BCH 更新:看這個走勢!當價格站在約 220 附近時,我就告訴你們,這裡可能會展開一波看漲反轉。現在看看結果。👀 $BCH 已一路推升至 251 附近,讓我們從進場區域獲得約 +18% 的漲幅。📈 🎯 我們原本的目標仍然是 305。這就是為什麼耐心和正確的佈局很重要。不要追漲。等反轉出現,抓住它。🔥
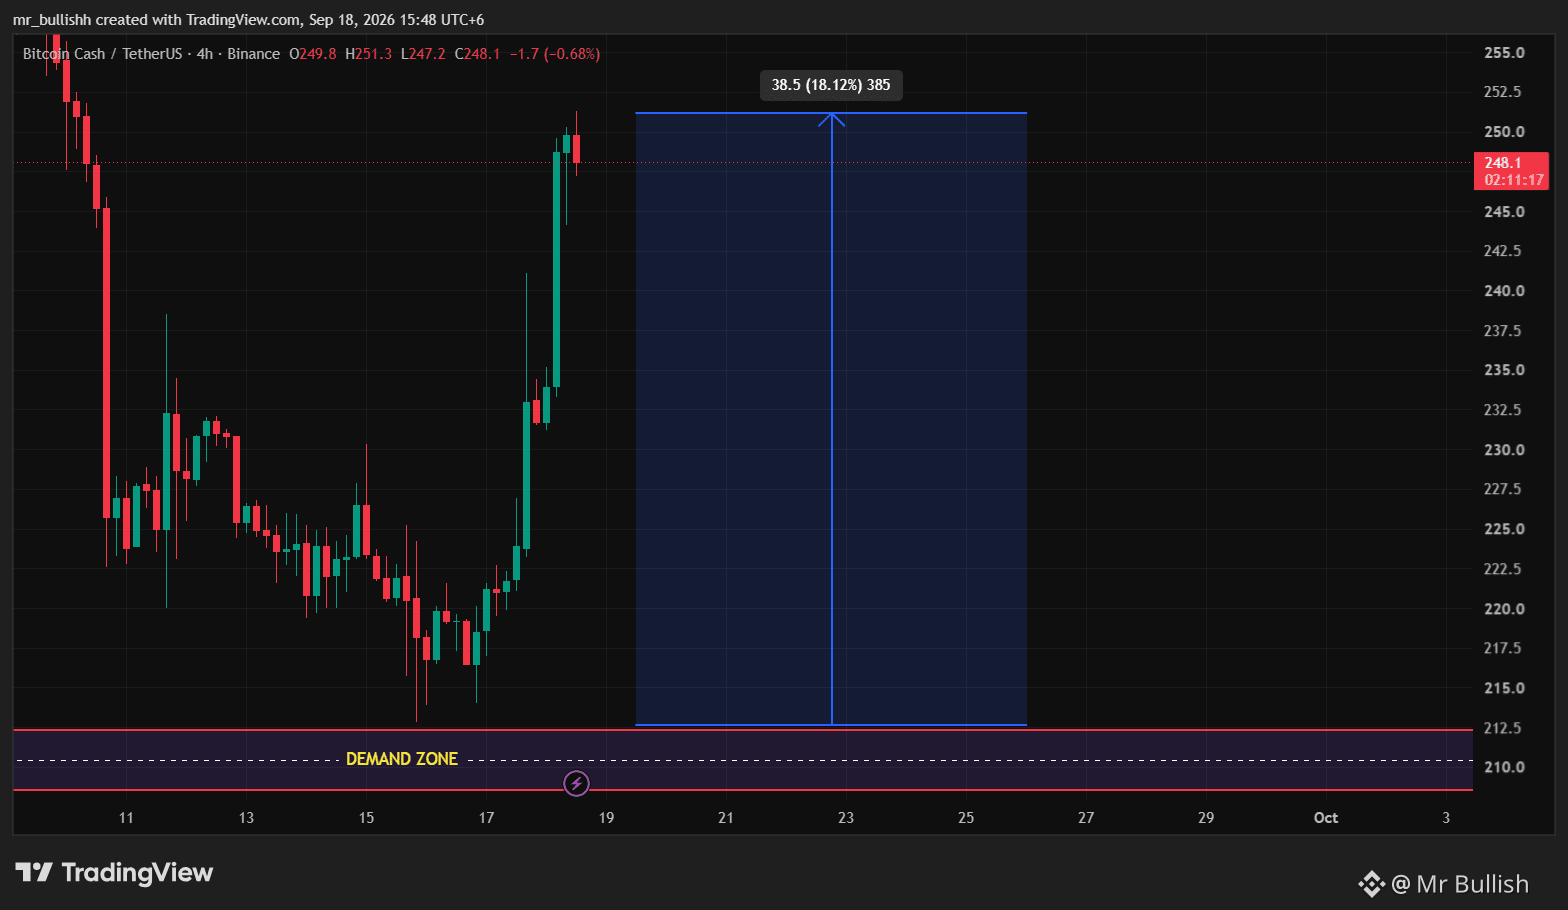
56
·
--
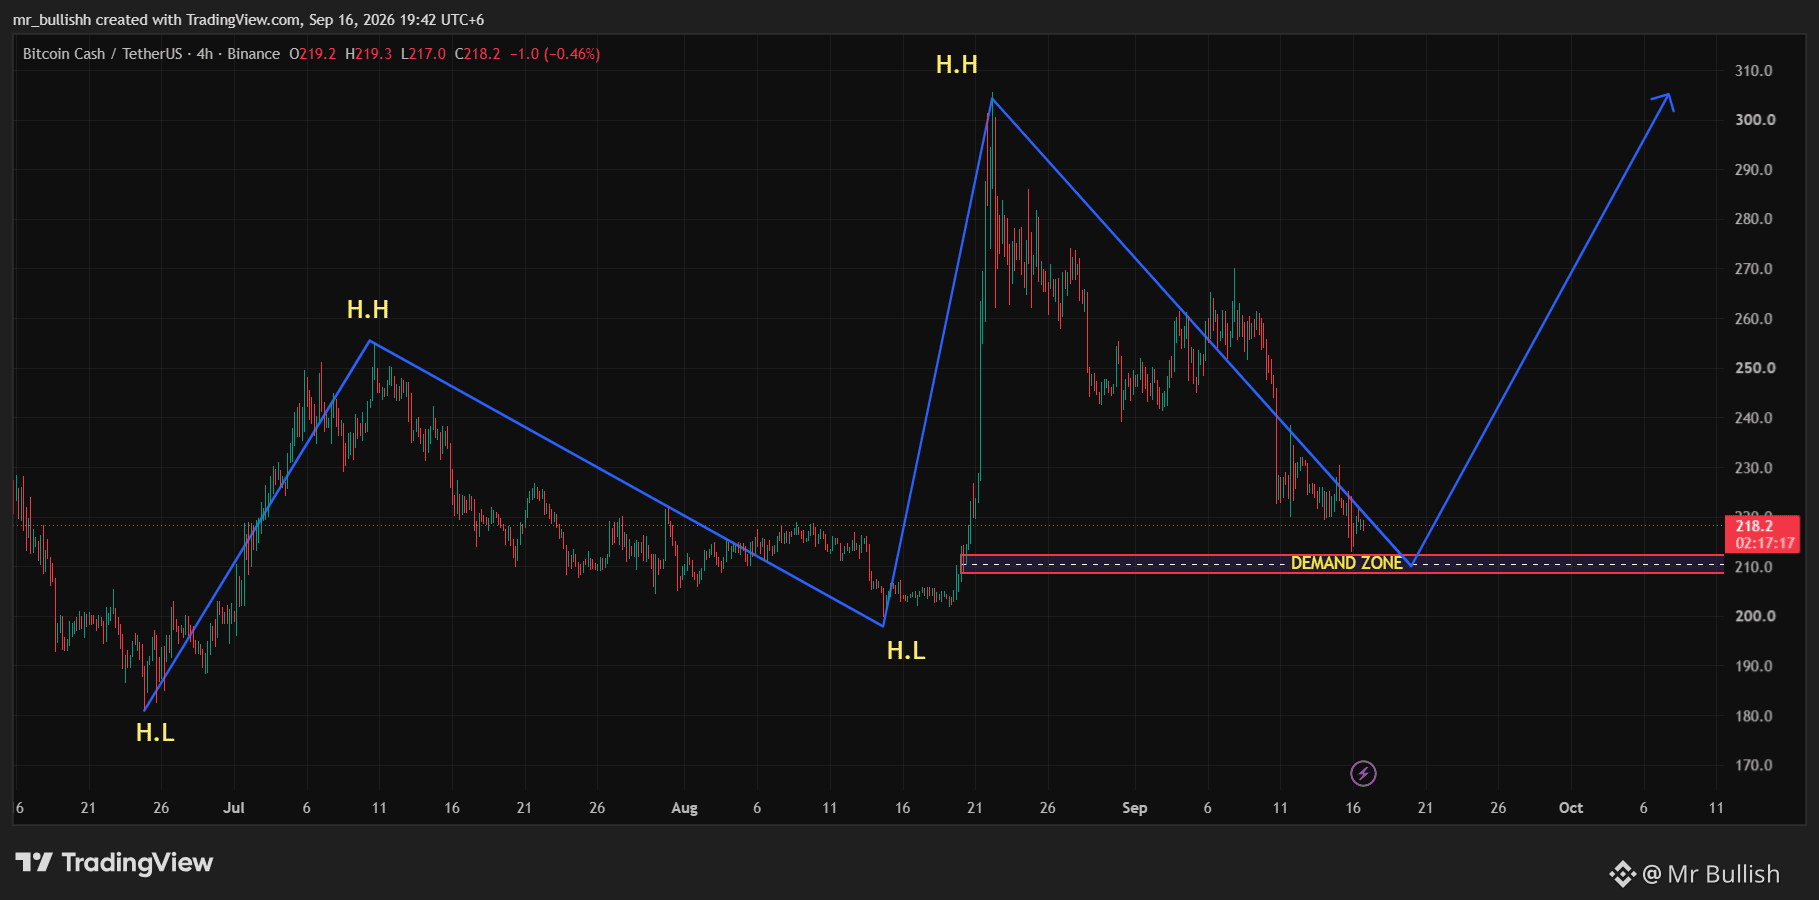
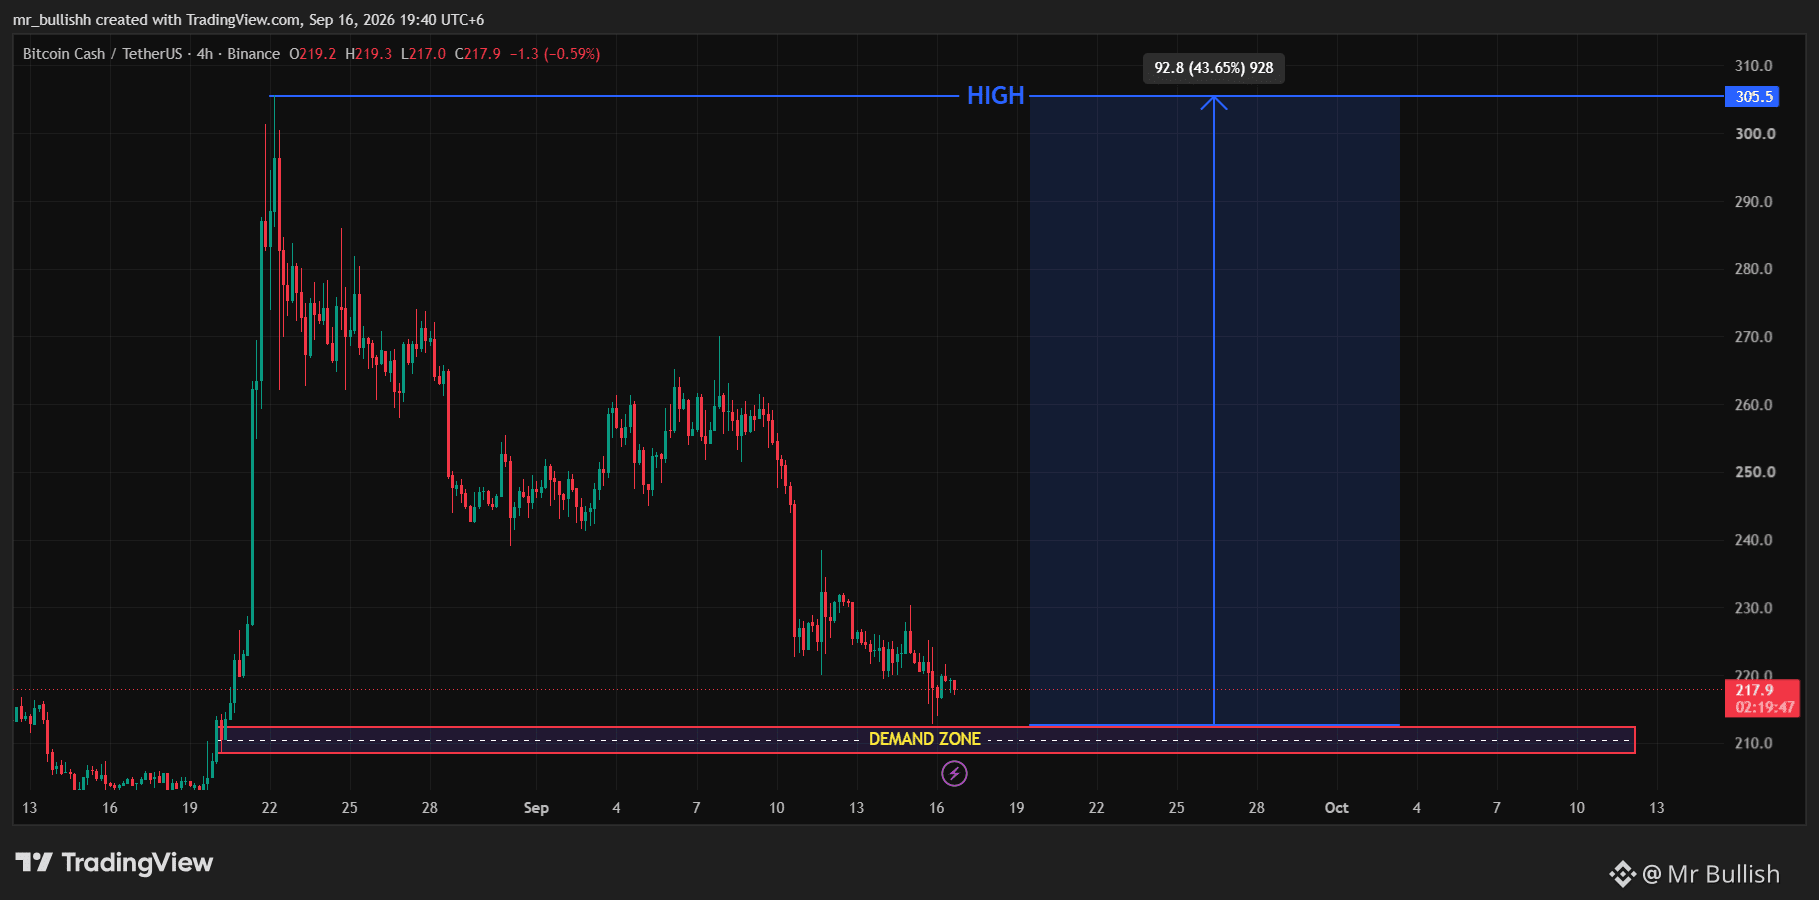
$BCH 即將爆發!正如你在第二張圖表所看到的,價格正明顯形成更高高點與更高低點(Higher High & Higher Low)的結構,呈現出強勁的多頭市場結構。📈 目前價格大約在 220 附近。 如果你仔細看第一張圖表,212 - 208 之間有一個關鍵的需求區(demand zone)。這裡就是我會尋找潛在多單(long position)的地方。 ⚠️ 重要提醒:不要在區域內盲目進場。請等待需求區域出現明確的看漲反應(bullish rejection)後再進行布局。 如果確認成立,305 將是我們用來捕捉的目標。🎯 先看結構。再看確認。最後進場。
$BCH 即將爆發!正如你在第二張圖表所看到的,價格正明顯形成更高高點與更高低點(Higher High & Higher Low)的結構,呈現出強勁的多頭市場結構。📈 目前價格大約在 220 附近。 如果你仔細看第一張圖表,212 - 208 之間有一個關鍵的需求區(demand zone)。這裡就是我會尋找潛在多單(long position)的地方。 ⚠️ 重要提醒:不要在區域內盲目進場。請等待需求區域出現明確的看漲反應(bullish rejection)後再進行布局。 如果確認成立,305 將是我們用來捕捉的目標。🎯 先看結構。再看確認。最後進場。
60
·
--
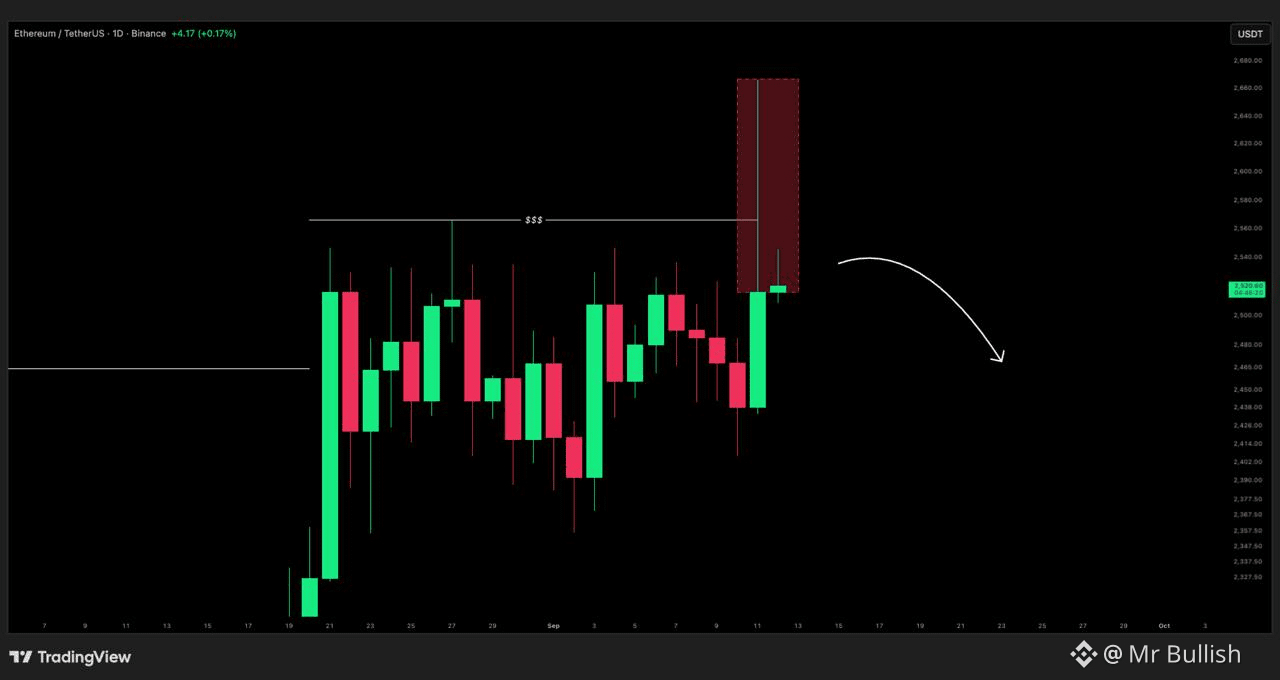
$ETH 過去3週一直在盤整區間內波動。如今,由於波動性極高的CPI反應,出現了巨大的長下影線,掃過先前的流動性水平。這種走勢可能會清洗過度槓桿的空單,並重新調整倉位,使資金費率與保證金條件更接近中性。隨著價格目前從區間上緣附近開始反應,這可能是尋找ETH做空(SHORT)進場的高機率區域。📉
$ETH 過去3週一直在盤整區間內波動。如今,由於波動性極高的CPI反應,出現了巨大的長下影線,掃過先前的流動性水平。這種走勢可能會清洗過度槓桿的空單,並重新調整倉位,使資金費率與保證金條件更接近中性。隨著價格目前從區間上緣附近開始反應,這可能是尋找ETH做空(SHORT)進場的高機率區域。📉
63
·
--
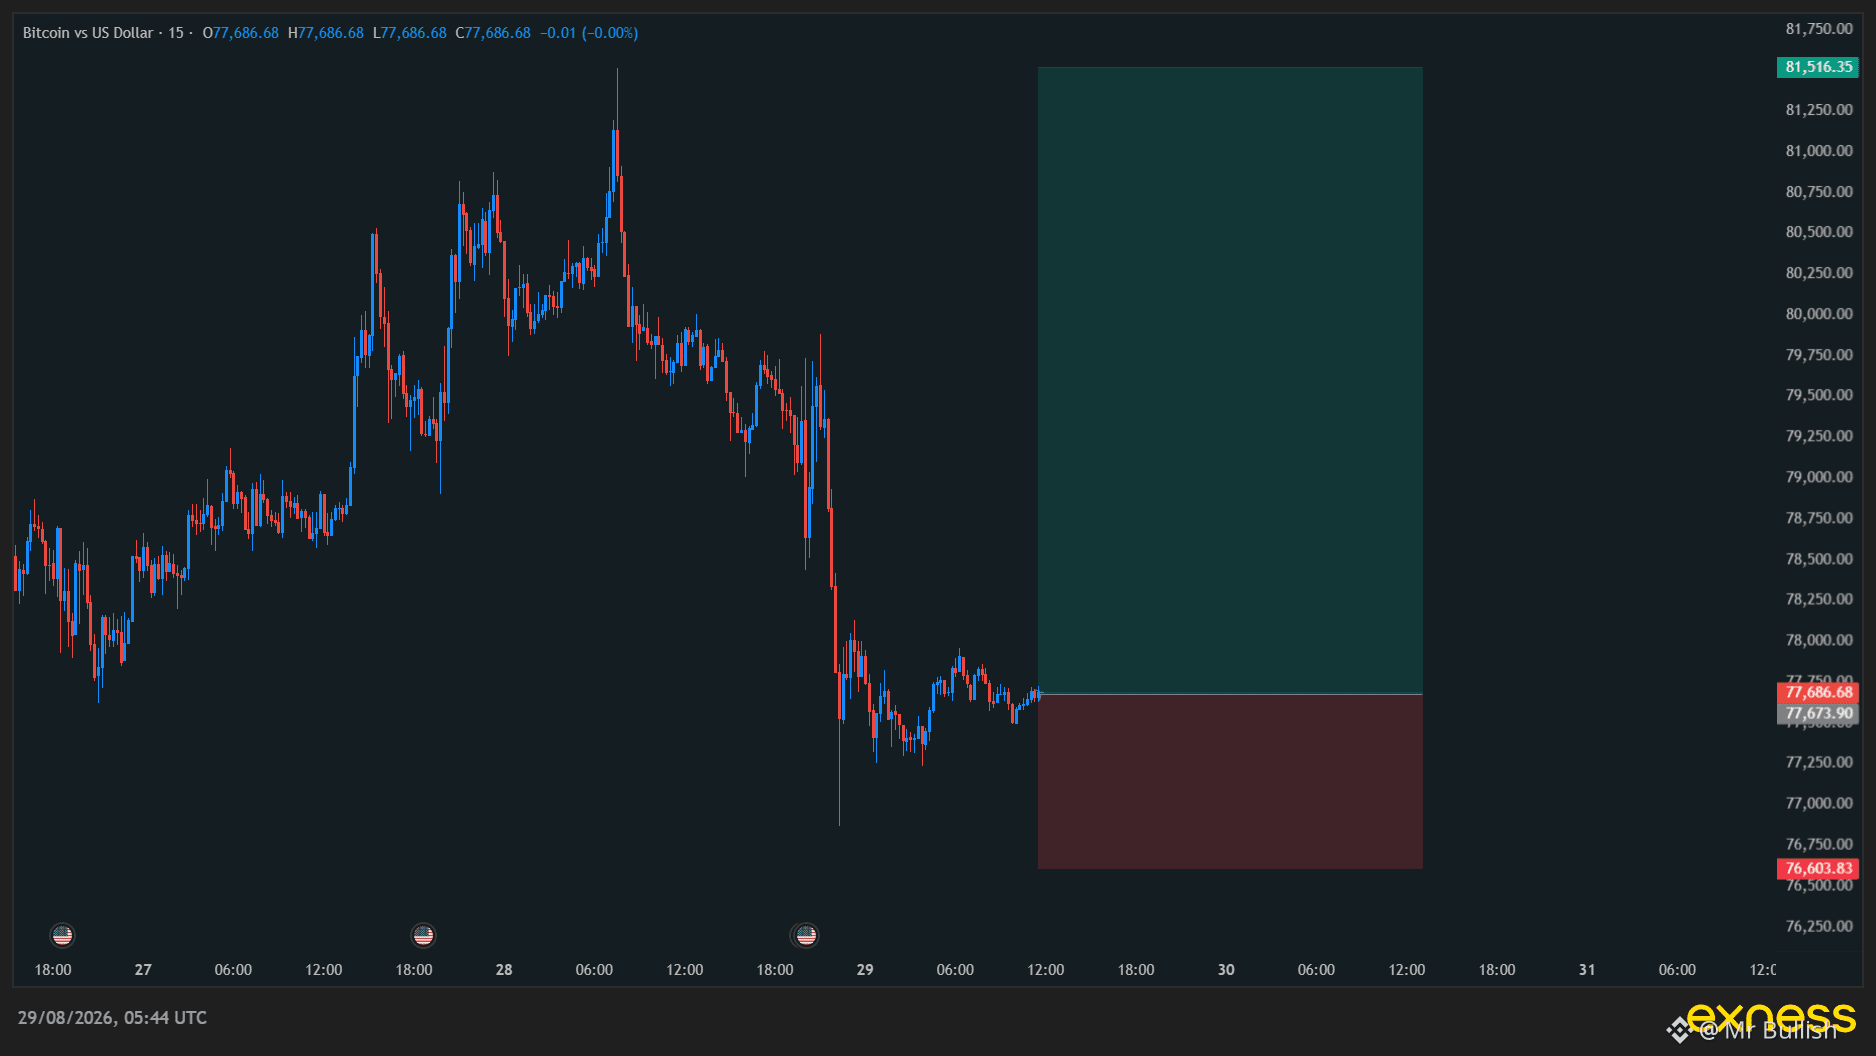
📈 $BTC USDT 多單 📍 入場區:77,600 – 77,700 🎯 止盈:81,500 🛑 止損:76,600 已從前一次回調中捕獲誘導信號,目前價格在觸及看漲訂單區後出現看漲拒絕反應。 ⚠️ 請務必遵循合理的風險管理。
📈 $BTC USDT 多單 📍 入場區:77,600 – 77,700 🎯 止盈:81,500 🛑 止損:76,600 已從前一次回調中捕獲誘導信號,目前價格在觸及看漲訂單區後出現看漲拒絕反應。 ⚠️ 請務必遵循合理的風險管理。
65
·
--
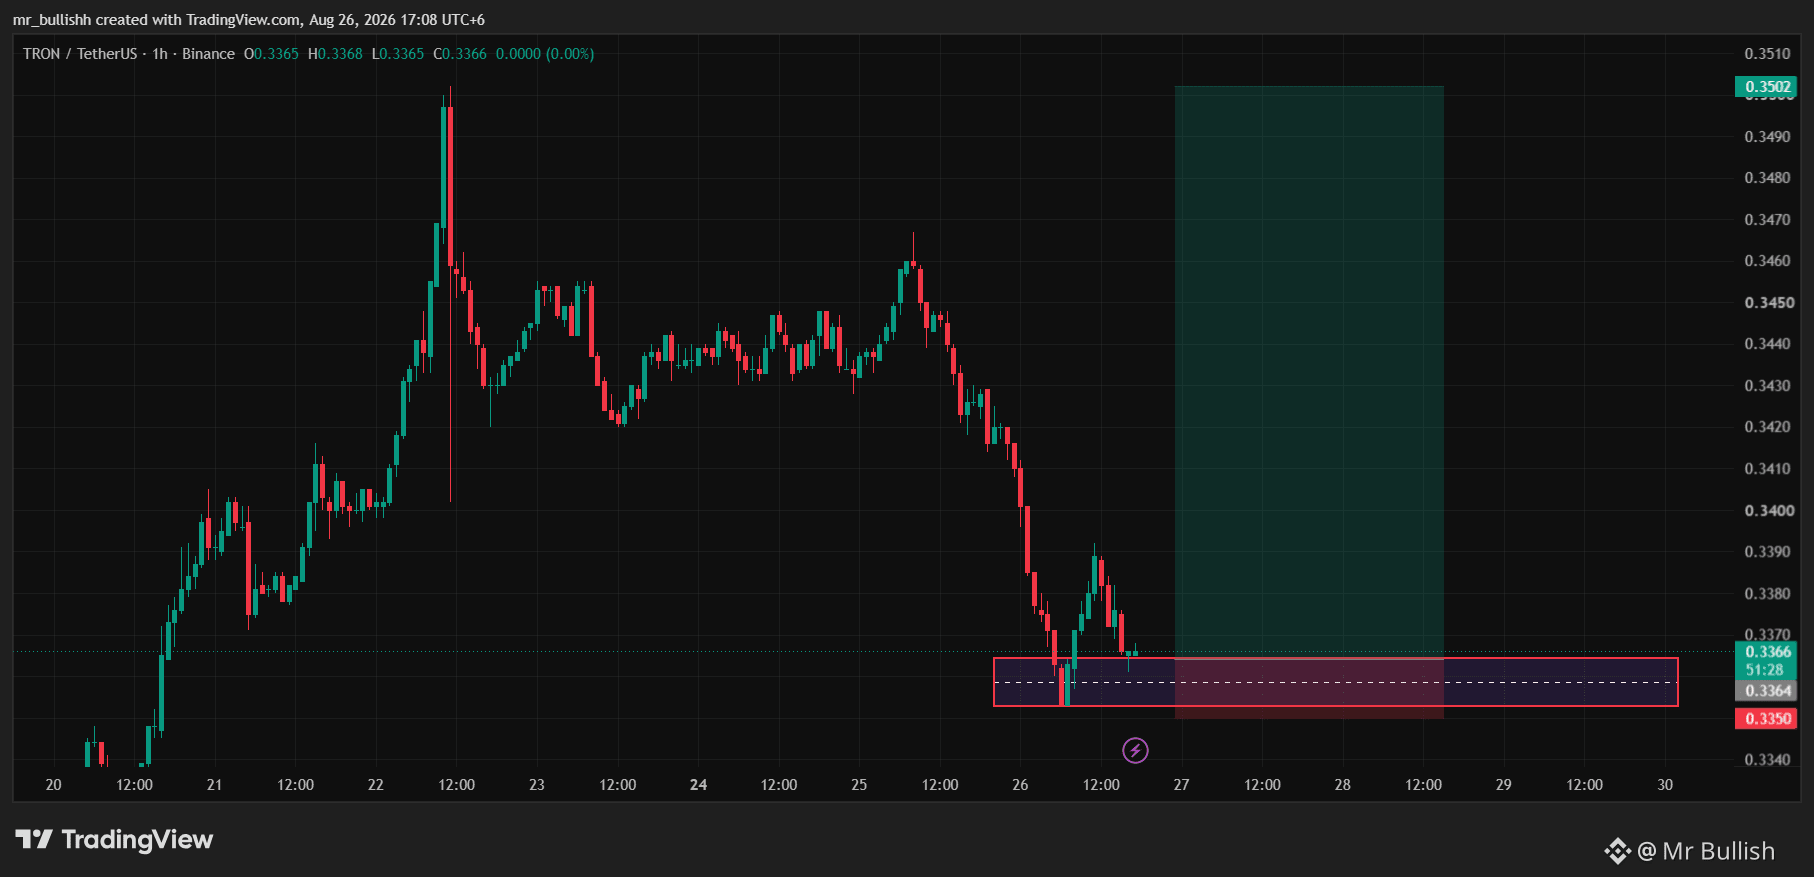
📈 $TRX USDT 做多 📍 入場區:0.3360 – 0.3370 🎯 止盈:0.3500 🛑 止損:0.3350 ⚠️ 請務必遵循嚴格的風控管理。僅使用你資金中的小部分進行交易;一旦行情朝對你有利的方向運行,就將止損跟隨上移,以保護你的利潤。
📈 $TRX USDT 做多 📍 入場區:0.3360 – 0.3370 🎯 止盈:0.3500 🛑 止損:0.3350 ⚠️ 請務必遵循嚴格的風控管理。僅使用你資金中的小部分進行交易;一旦行情朝對你有利的方向運行,就將止損跟隨上移,以保護你的利潤。
72
·
--
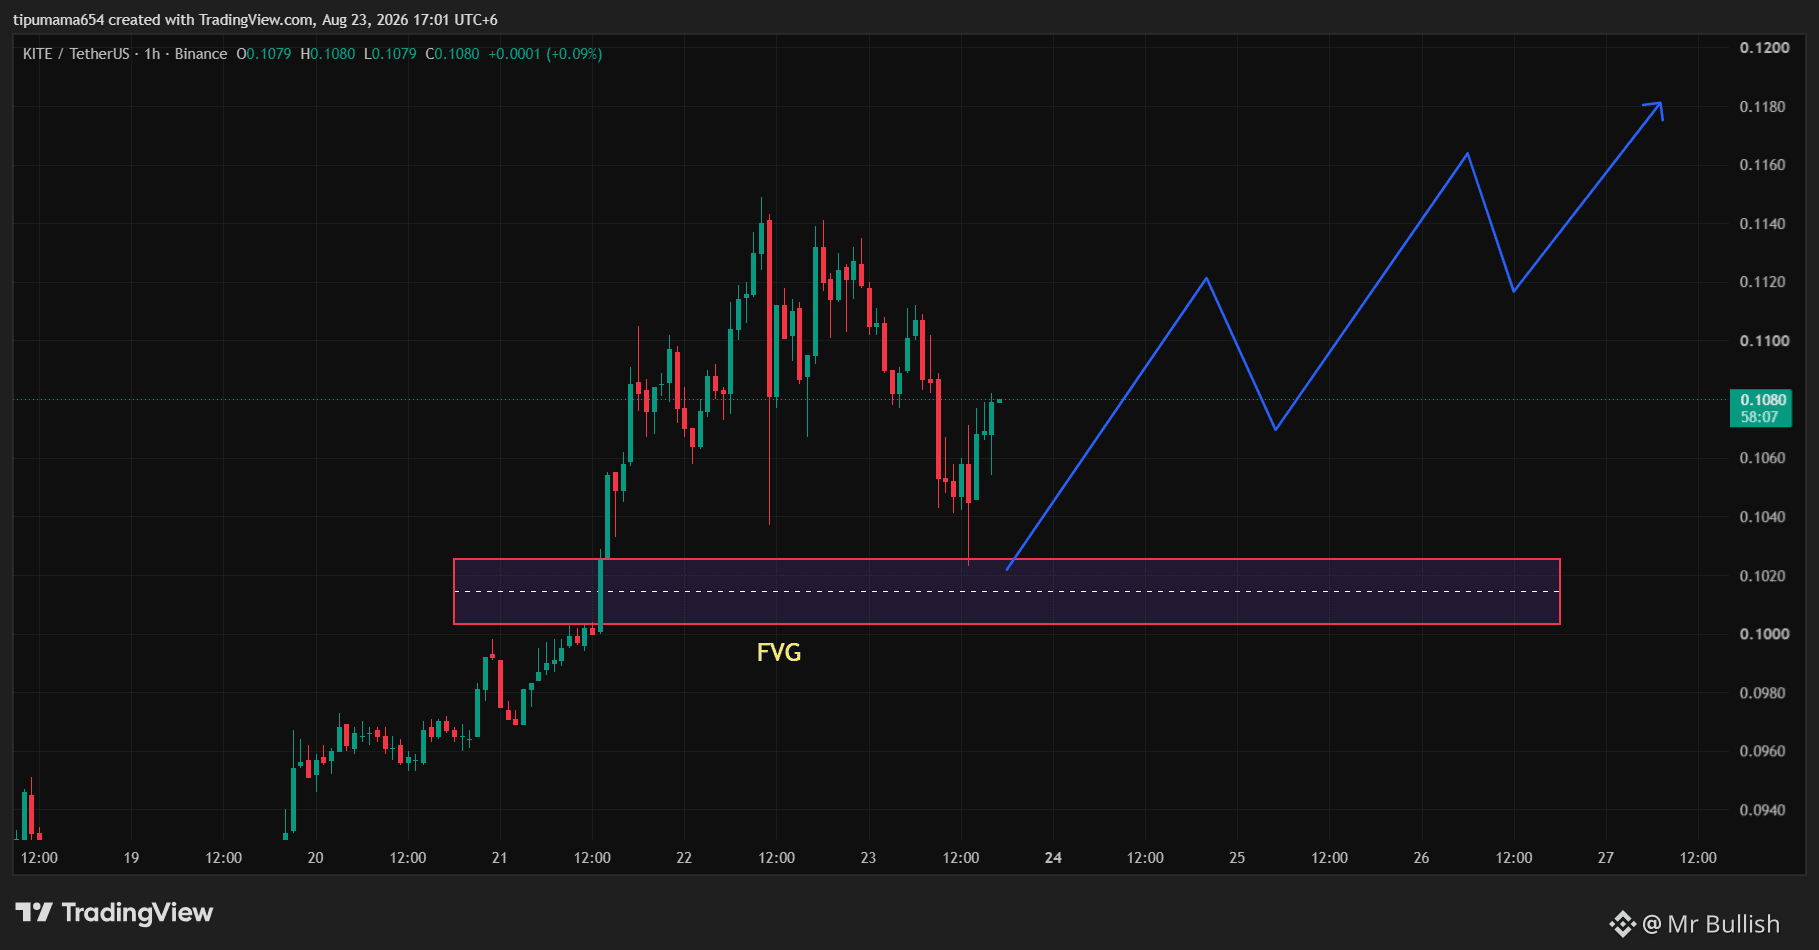
如果你正在尋找下一個潛在的領跑者,
$KITE
應該出現在你的關注列表裏。👀
我們都知道 KITE 距離其 ATH 已經下跌了約 70%,但從技術面來看,當前價格正處於一個關鍵 POI(關注點)。
在這個區域附近,價格已經開始形成清晰的上升趨勢結構。
在更低的時間週期裏,KITE 目前正在回調,並從 0.1000 – 0.1020 的 FVG 區域出現反應。
如果該 POI 能繼續守住且看漲結構保持完整,我們可能會從這裏看到一波強勁的上行走勢。📈
如果你正在尋找下一個潛在的領跑者,
$KITE
應該出現在你的關注列表裏。👀
我們都知道 KITE 距離其 ATH 已經下跌了約 70%,但從技術面來看,當前價格正處於一個關鍵 POI(關注點)。
在這個區域附近,價格已經開始形成清晰的上升趨勢結構。
在更低的時間週期裏,KITE 目前正在回調,並從 0.1000 – 0.1020 的 FVG 區域出現反應。
如果該 POI 能繼續守住且看漲結構保持完整,我們可能會從這裏看到一波強勁的上行走勢。📈
$KITE
應該出現在你的關注列表裏。👀
我們都知道 KITE 距離其 ATH 已經下跌了約 70%,但從技術面來看,當前價格正處於一個關鍵 POI(關注點)。
在這個區域附近,價格已經開始形成清晰的上升趨勢結構。
在更低的時間週期裏,KITE 目前正在回調,並從 0.1000 – 0.1020 的 FVG 區域出現反應。
如果該 POI 能繼續守住且看漲結構保持完整,我們可能會從這裏看到一波強勁的上行走勢。📈
59
·
--
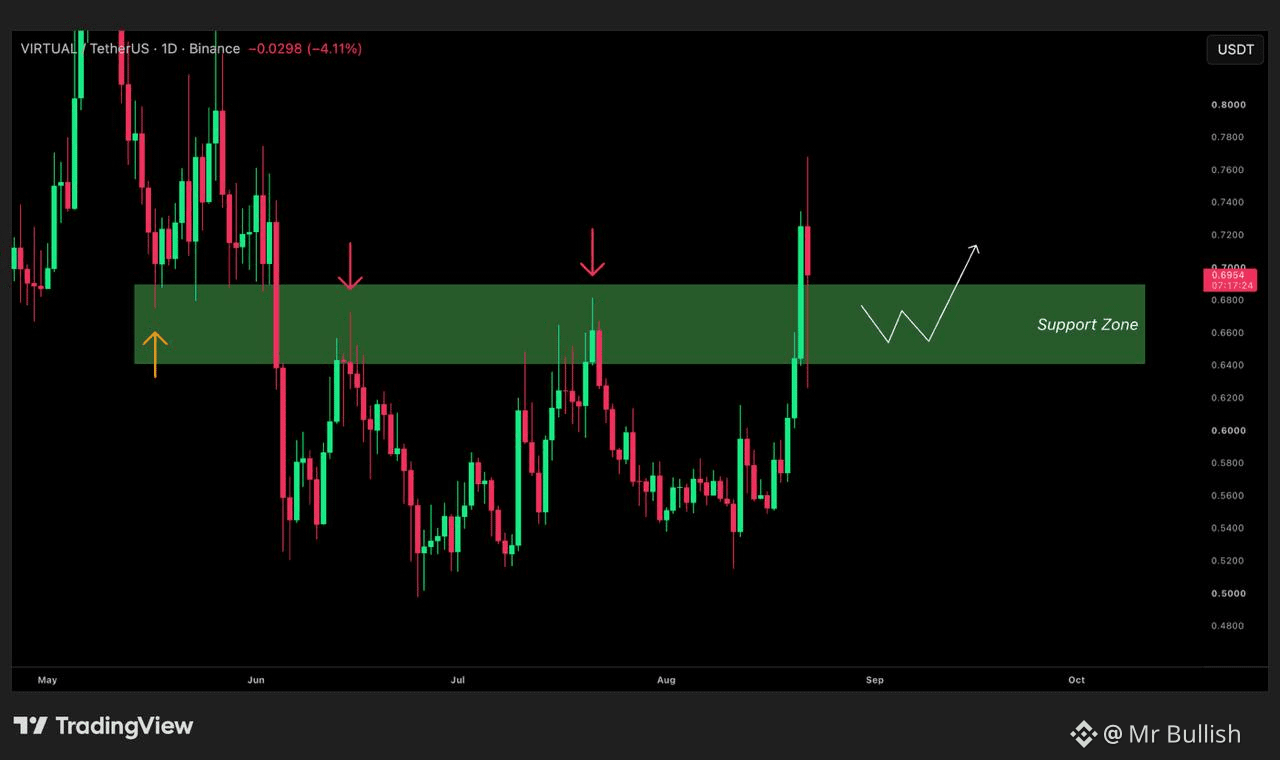
$VIRTUAL - 交易想法
VIRTUAL 正在突破其雙底形態,並已將先前的阻力翻轉爲支撐。
對 Virtual 來說,一個良好信號是 Robinhood 與 Virtual 的 AI 代理近期達成的合作。
結合起來,這應該是一個穩健的“突破-回踩”設置。
$VIRTUAL - 交易想法
VIRTUAL 正在突破其雙底形態,並已將先前的阻力翻轉爲支撐。
對 Virtual 來說,一個良好信號是 Robinhood 與 Virtual 的 AI 代理近期達成的合作。
結合起來,這應該是一個穩健的“突破-回踩”設置。
VIRTUAL 正在突破其雙底形態,並已將先前的阻力翻轉爲支撐。
對 Virtual 來說,一個良好信號是 Robinhood 與 Virtual 的 AI 代理近期達成的合作。
結合起來,這應該是一個穩健的“突破-回踩”設置。
70
·
--
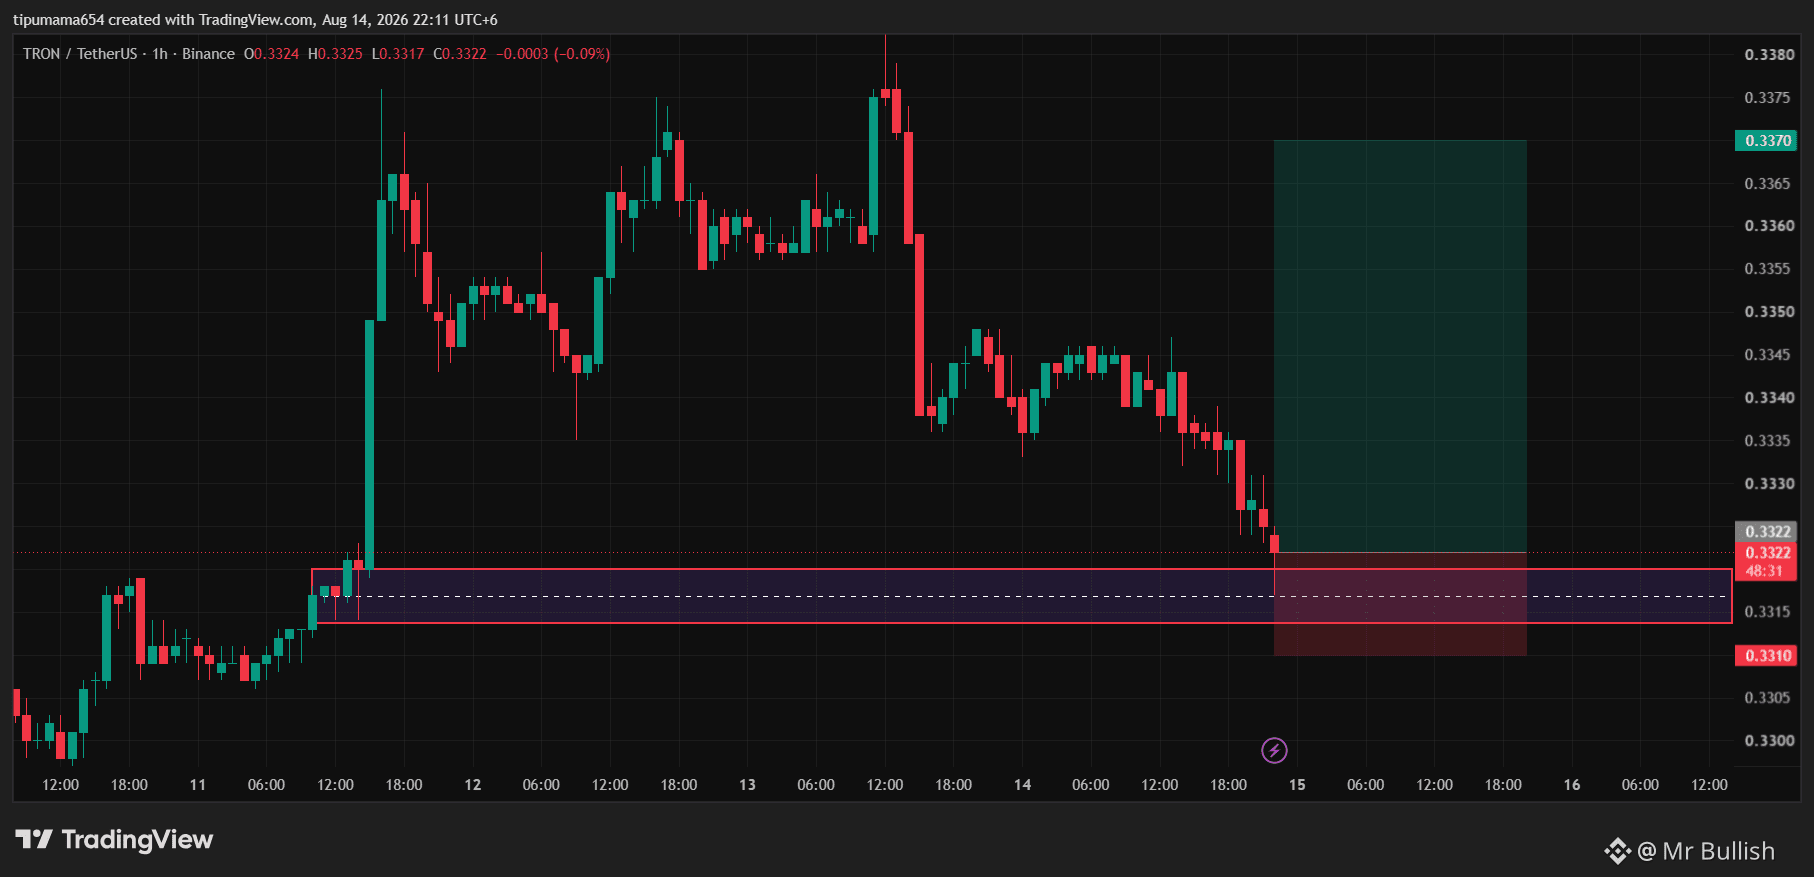
📈 $TRX USDT 做多 📍 入場區域:0.3320 – 0.3325 🎯 止盈:0.3370 🛑 止損:0.3310 ⚠️ 始終遵循合理的風險管理。只在你的資金中承擔一小部分風險,並且一旦交易開始對你有利,就將止損上移/跟蹤止損,以保護你的利潤。
📈 $TRX USDT 做多 📍 入場區域:0.3320 – 0.3325 🎯 止盈:0.3370 🛑 止損:0.3310 ⚠️ 始終遵循合理的風險管理。只在你的資金中承擔一小部分風險,並且一旦交易開始對你有利,就將止損上移/跟蹤止損,以保護你的利潤。
53
·
--
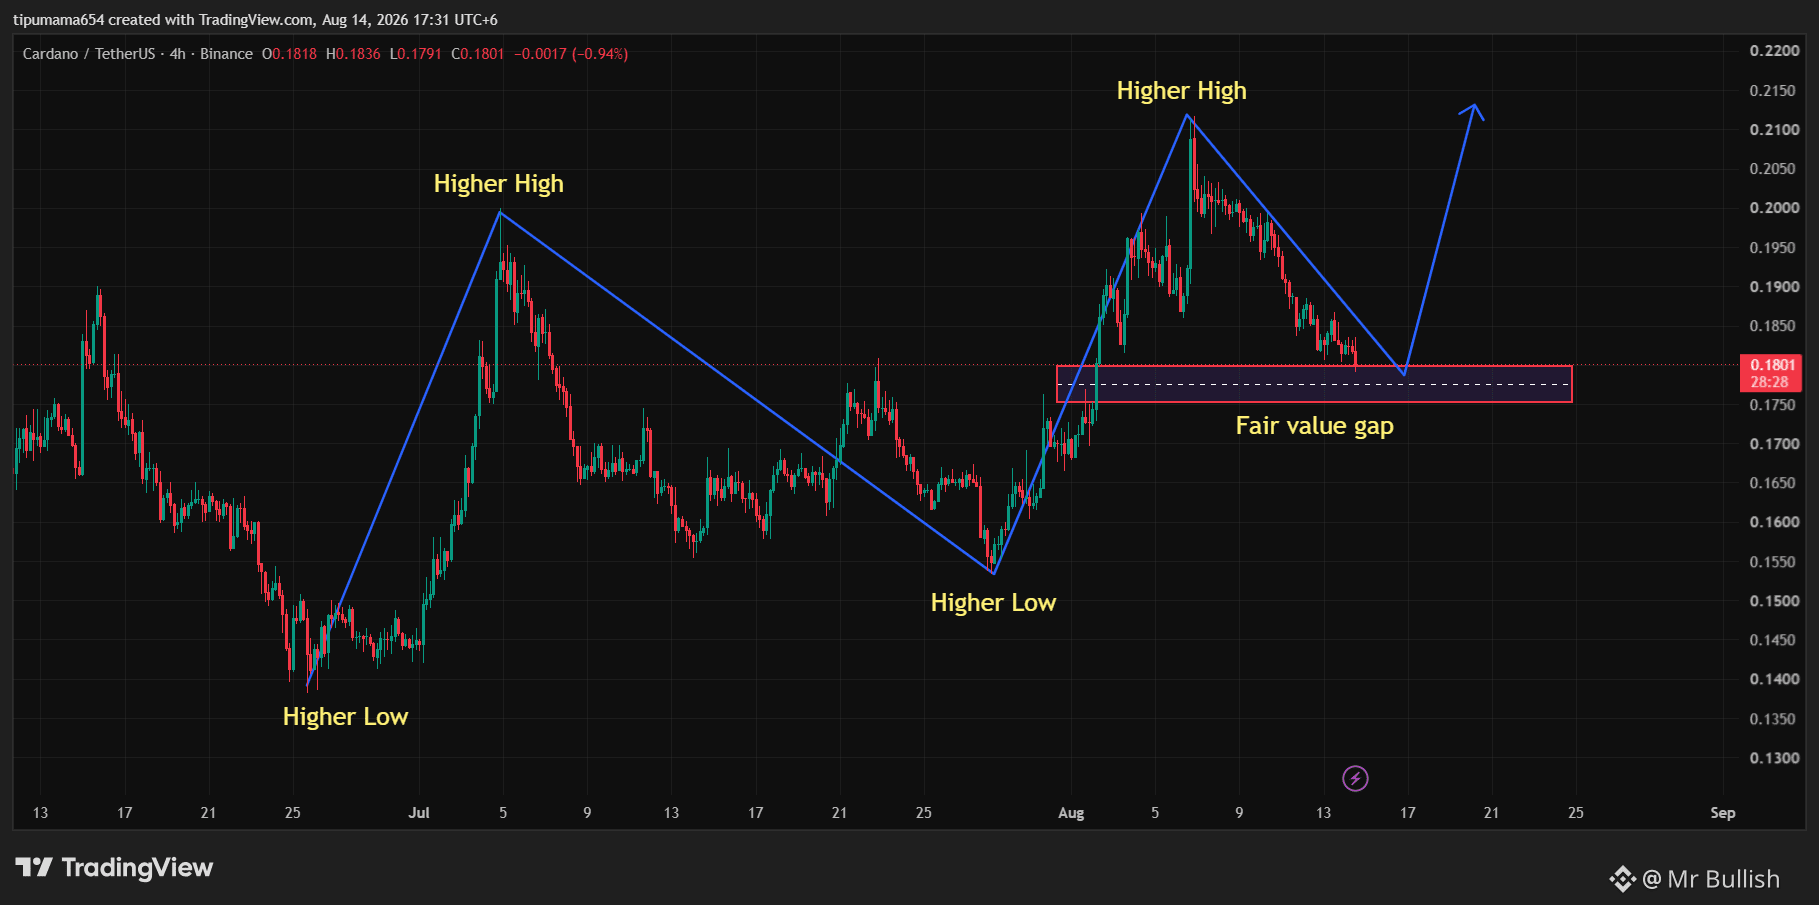
這一週即將結束,但 $ADA 即將啓動。🔥 $ADA 是 Cardano 生態系統中最知名的原生幣之一,在上一輪牛市中帶來了巨大的回報。但現在,圖表正在顯示一些有趣的信號。在形成清晰的 H.H & H.L 結構之後,ADA 正在呈現短期上升趨勢,並且正在觸及 0.1800 FVG——這是一個關鍵區域,我們可能會在這裏看到反應。不過別急着進場。等待出現明確的看漲走勢作爲確認,然後這個設置就會變得很有意思。📍 入場:看漲確認後 🛑 止損:FVG 下方 🎯 目標:前一個 H.H 讓我們看看 $ADA 是否準備迎來下一波行情。👀📈
這一週即將結束,但 $ADA 即將啓動。🔥 $ADA 是 Cardano 生態系統中最知名的原生幣之一,在上一輪牛市中帶來了巨大的回報。但現在,圖表正在顯示一些有趣的信號。在形成清晰的 H.H & H.L 結構之後,ADA 正在呈現短期上升趨勢,並且正在觸及 0.1800 FVG——這是一個關鍵區域,我們可能會在這裏看到反應。不過別急着進場。等待出現明確的看漲走勢作爲確認,然後這個設置就會變得很有意思。📍 入場:看漲確認後 🛑 止損:FVG 下方 🎯 目標:前一個 H.H 讓我們看看 $ADA 是否準備迎來下一波行情。👀📈
85
·
--
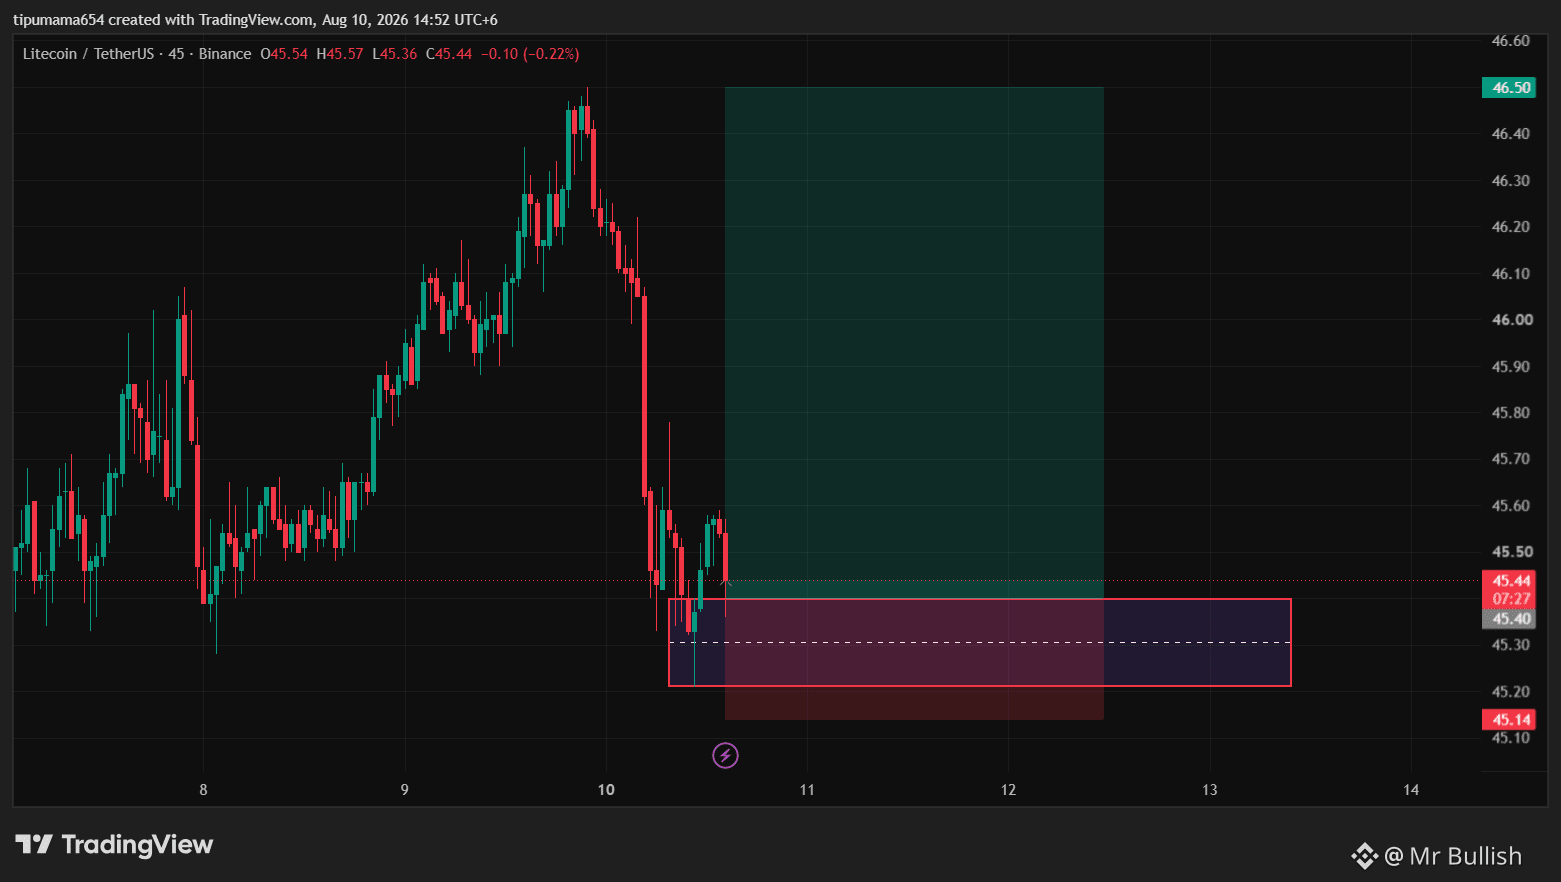
📈 $LTC USDT 做多 📍 入場區間:45.40 – 45.50 🎯 止盈:46.50 🛑 止損:45.10 ⚠️ 請始終遵循嚴格的風險管理。只承擔你資金中很小的一部分風險,並且一旦交易開始朝有利方向運行,就將止損跟單上移以保護你的利潤。
📈 $LTC USDT 做多 📍 入場區間:45.40 – 45.50 🎯 止盈:46.50 🛑 止損:45.10 ⚠️ 請始終遵循嚴格的風險管理。只承擔你資金中很小的一部分風險,並且一旦交易開始朝有利方向運行,就將止損跟單上移以保護你的利潤。
66
·
--
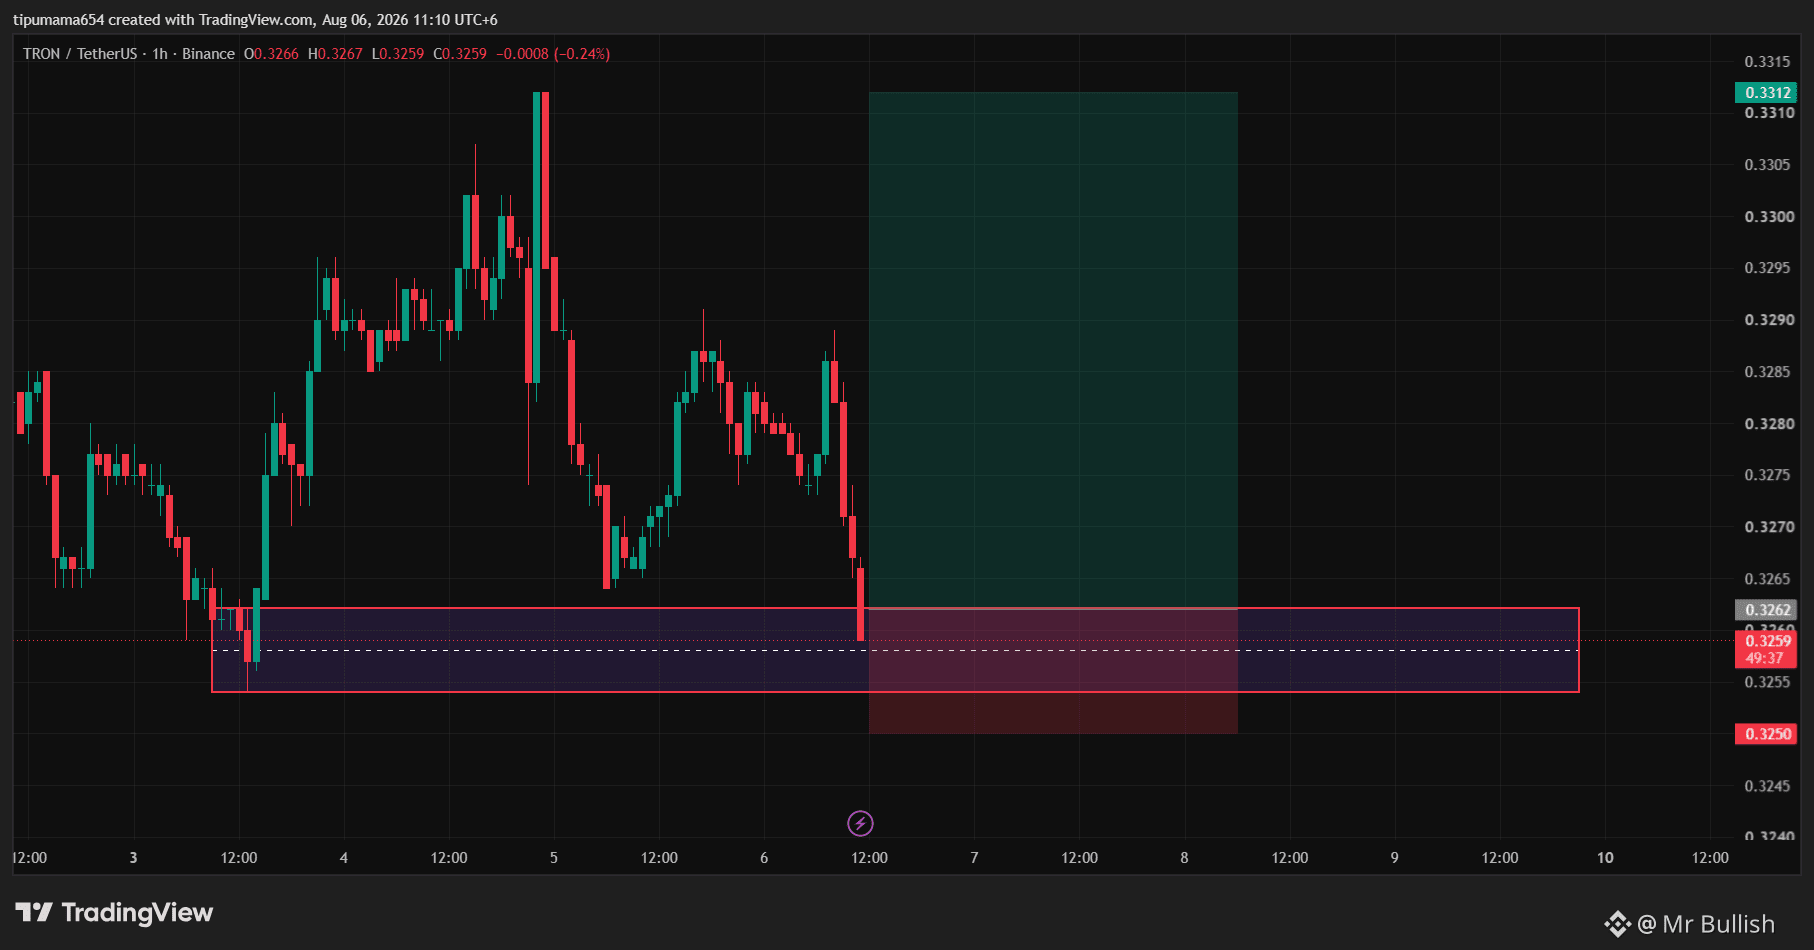
📈 $TRX USDT 多單 📍 入場區:0.3260 – 0.3265 🎯 止盈:0.3312 🛑 止損:0.3250 ⚠️ 請始終遵循正確的風險管理。只承擔你資金的一小部分風險,並且一旦交易開始朝有利方向運行,就將止損跟隨上移,以保護你的利潤。
📈 $TRX USDT 多單 📍 入場區:0.3260 – 0.3265 🎯 止盈:0.3312 🛑 止損:0.3250 ⚠️ 請始終遵循正確的風險管理。只承擔你資金的一小部分風險,並且一旦交易開始朝有利方向運行,就將止損跟隨上移,以保護你的利潤。
84
·
--
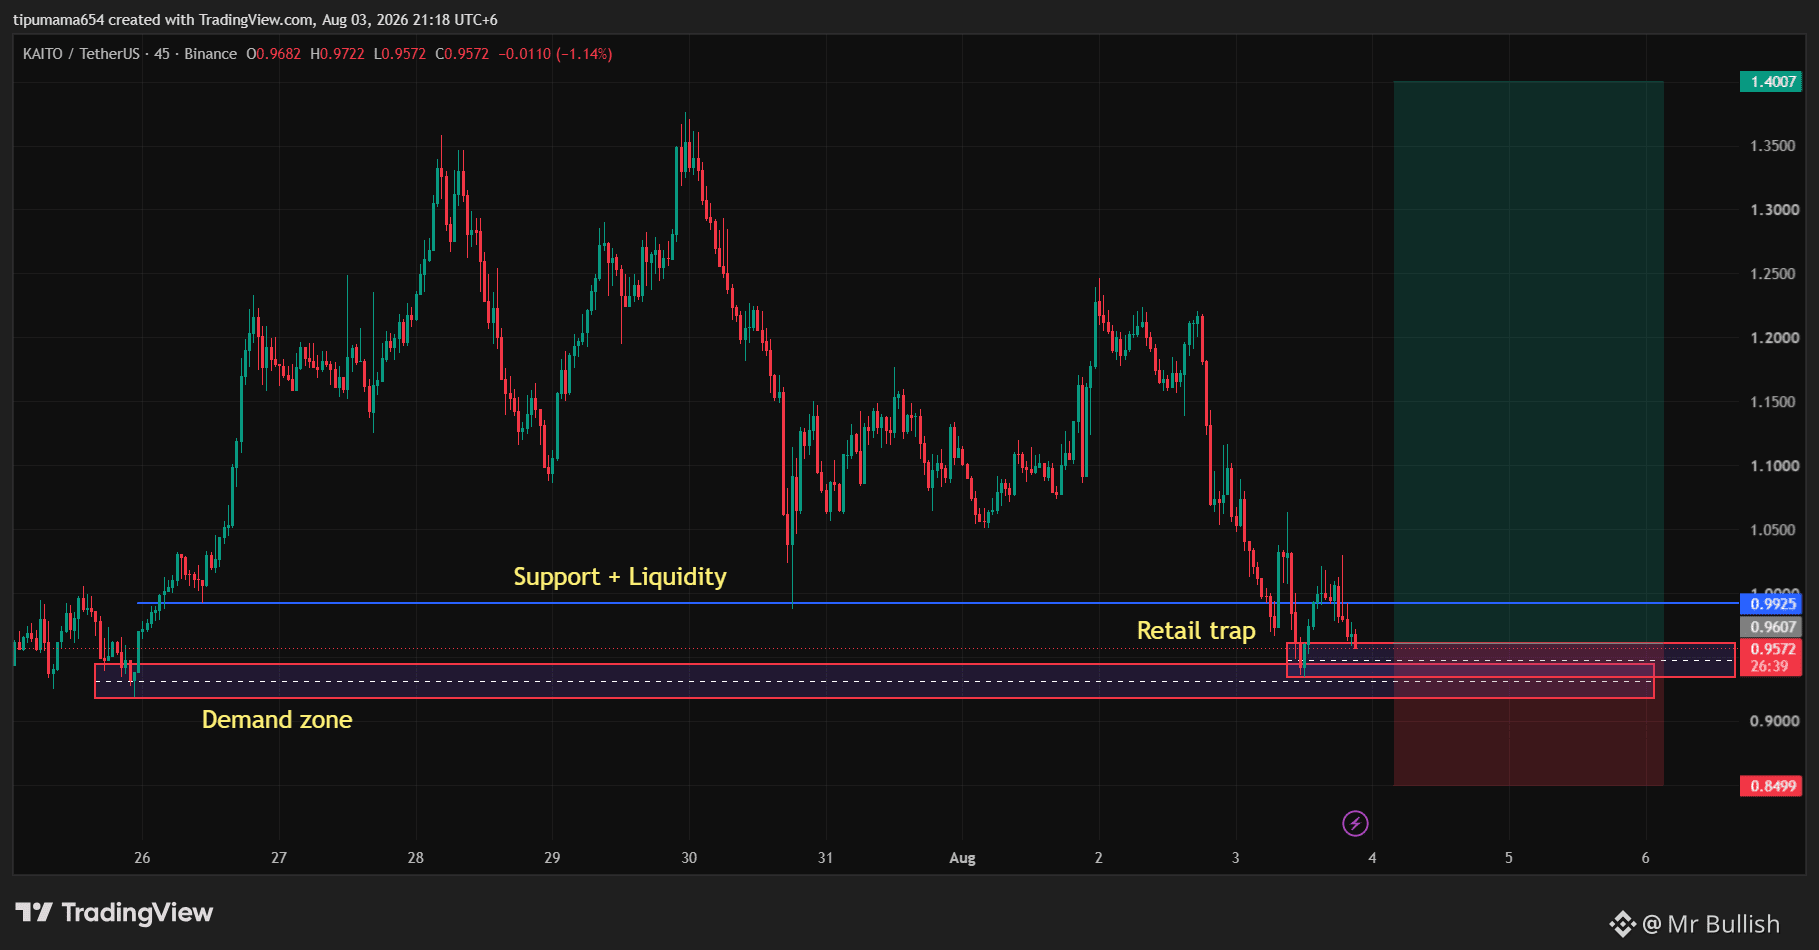
我聽說 $KAITO 要回歸了?好吧,圖表也在說同樣的事。經過一次有效的回調,價格困住了散戶買家,然後進入了需求區。我們都知道 $KAITO 現在完全看漲。所以槍已經裝滿了子彈。價格已經觸發了該區域,你也知道接下來會發生什麼。🔥
我聽說 $KAITO 要回歸了?好吧,圖表也在說同樣的事。經過一次有效的回調,價格困住了散戶買家,然後進入了需求區。我們都知道 $KAITO 現在完全看漲。所以槍已經裝滿了子彈。價格已經觸發了該區域,你也知道接下來會發生什麼。🔥
79
·
--
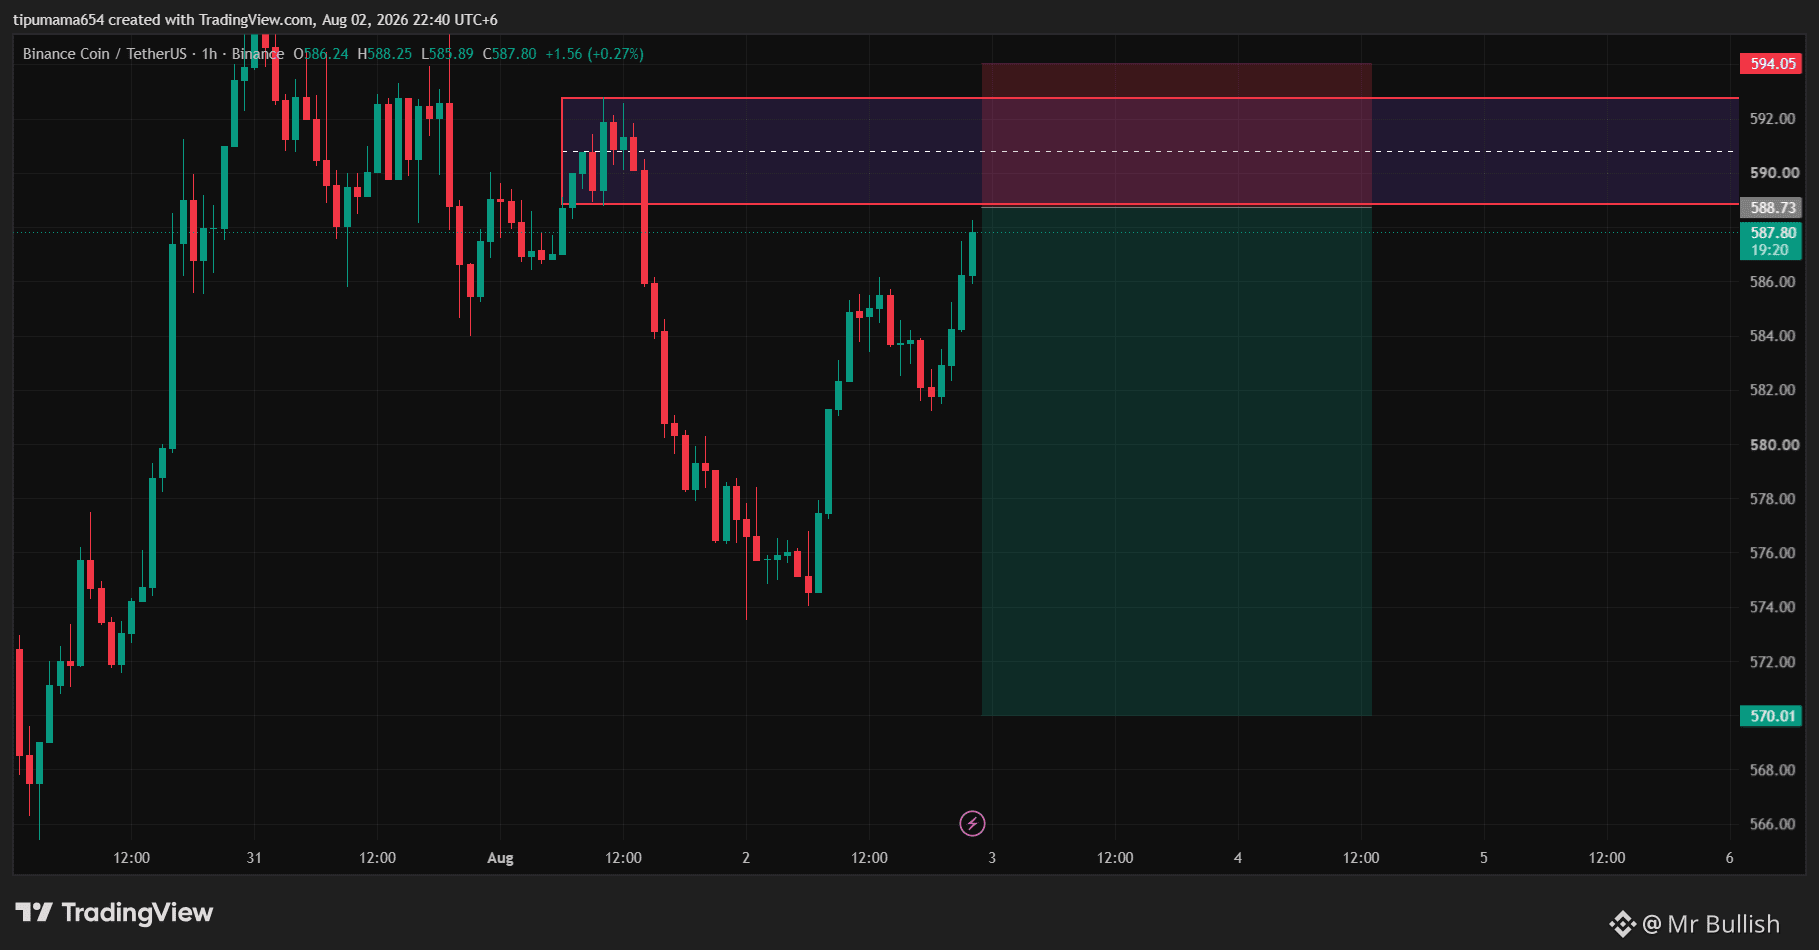
📉 $BNB USDT 做空 📍 入場區:589 – 591 🎯 止盈:570 🛑 止損:594 價格正在回調進入一個供給區,並顯示出一個指向先前“較低低點”的做空機會。
📉 $BNB USDT 做空 📍 入場區:589 – 591 🎯 止盈:570 🛑 止損:594 價格正在回調進入一個供給區,並顯示出一個指向先前“較低低點”的做空機會。
74
·
--
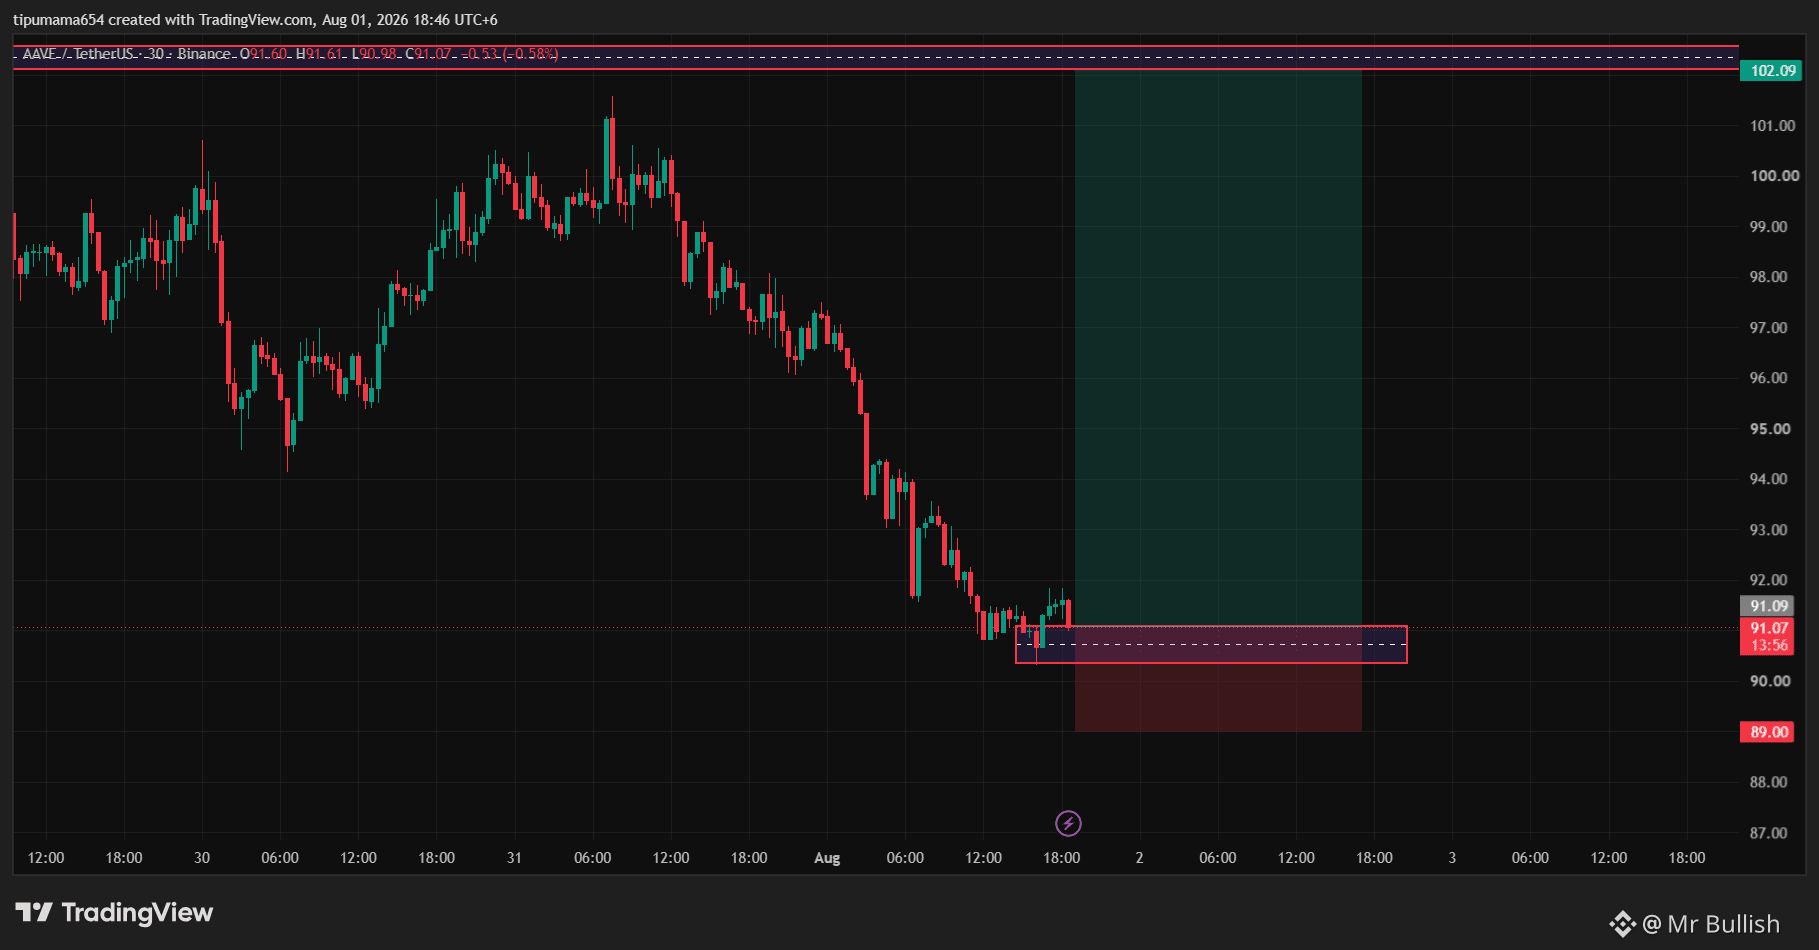
📈 AAVE USDT 多單 📍 入場區:91 – 92 🎯 止盈:102 🛑 止損:89 ⚠️ 請始終遵循正確的風險管理。只在你的資金中投入一小部分風險;一旦交易朝有利方向運行,就將止損跟進以保護你的利潤。
📈 AAVE USDT 多單 📍 入場區:91 – 92 🎯 止盈:102 🛑 止損:89 ⚠️ 請始終遵循正確的風險管理。只在你的資金中投入一小部分風險;一旦交易朝有利方向運行,就將止損跟進以保護你的利潤。
79
·
--
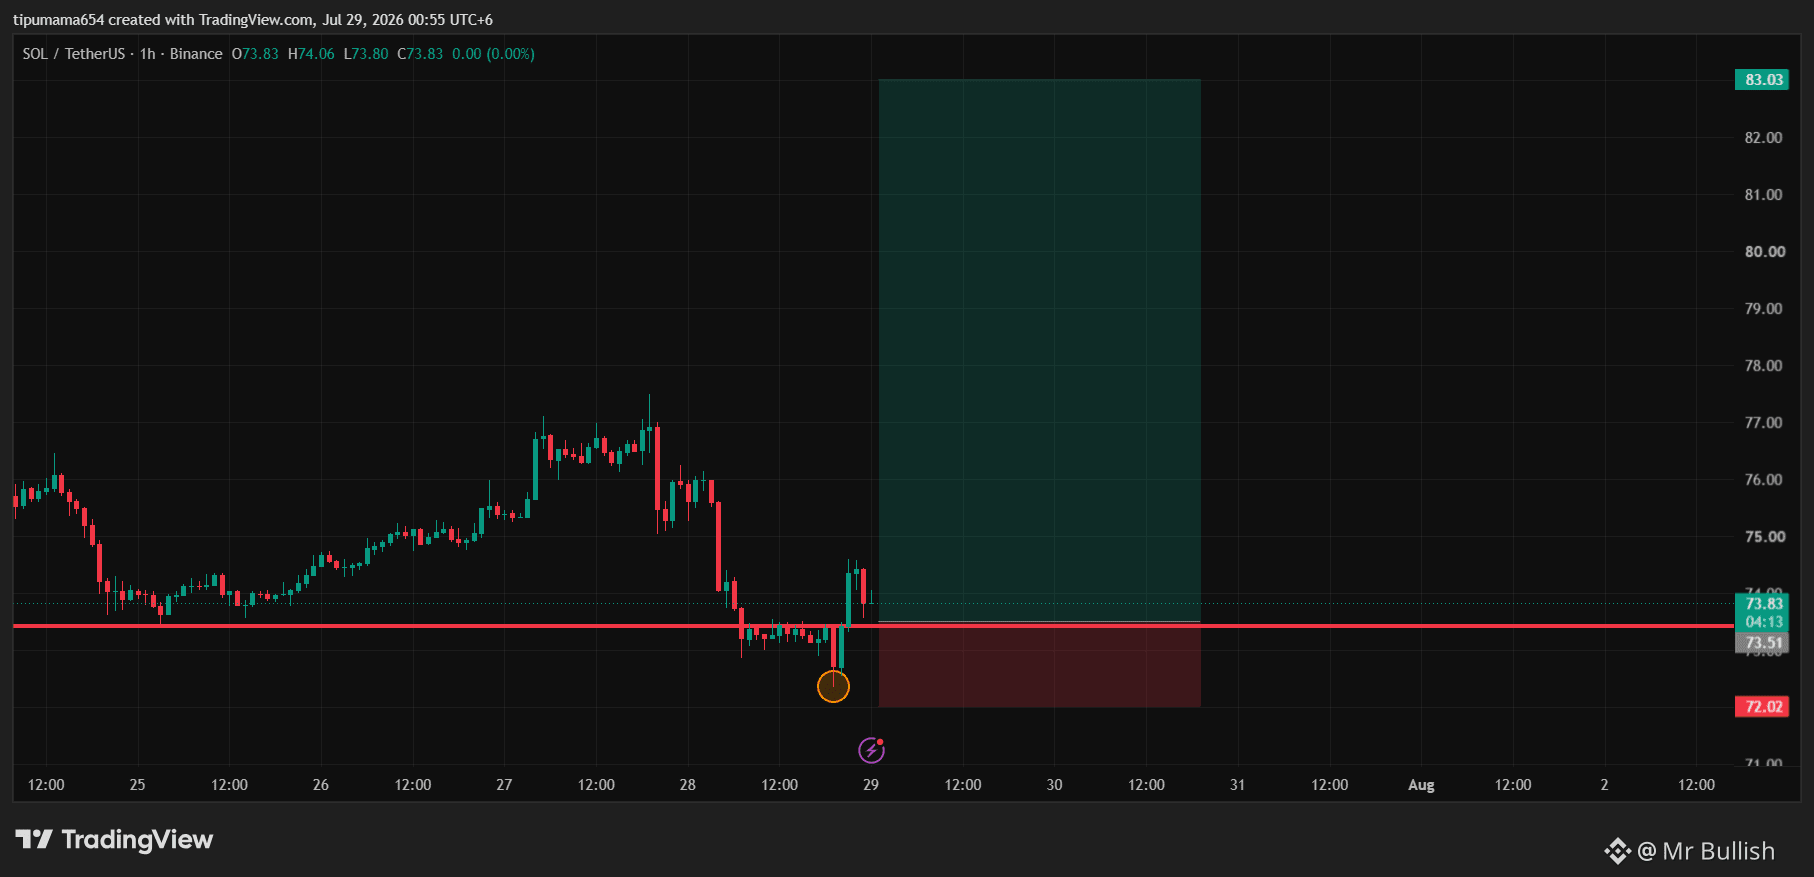
📈 $SOL USDT 多單 📍 入場區間:73.50 – 73.00 🎯 止盈:83(6X)🛑 止損:72 ⚠️ 請務必遵循正確的風險管理。只承擔你資金中很小的一部分風險;一旦交易開始朝對你有利的方向發展,就將止損跟隨上移以保護你的利潤。
📈 $SOL USDT 多單 📍 入場區間:73.50 – 73.00 🎯 止盈:83(6X)🛑 止損:72 ⚠️ 請務必遵循正確的風險管理。只承擔你資金中很小的一部分風險;一旦交易開始朝對你有利的方向發展,就將止損跟隨上移以保護你的利潤。
71
·
--
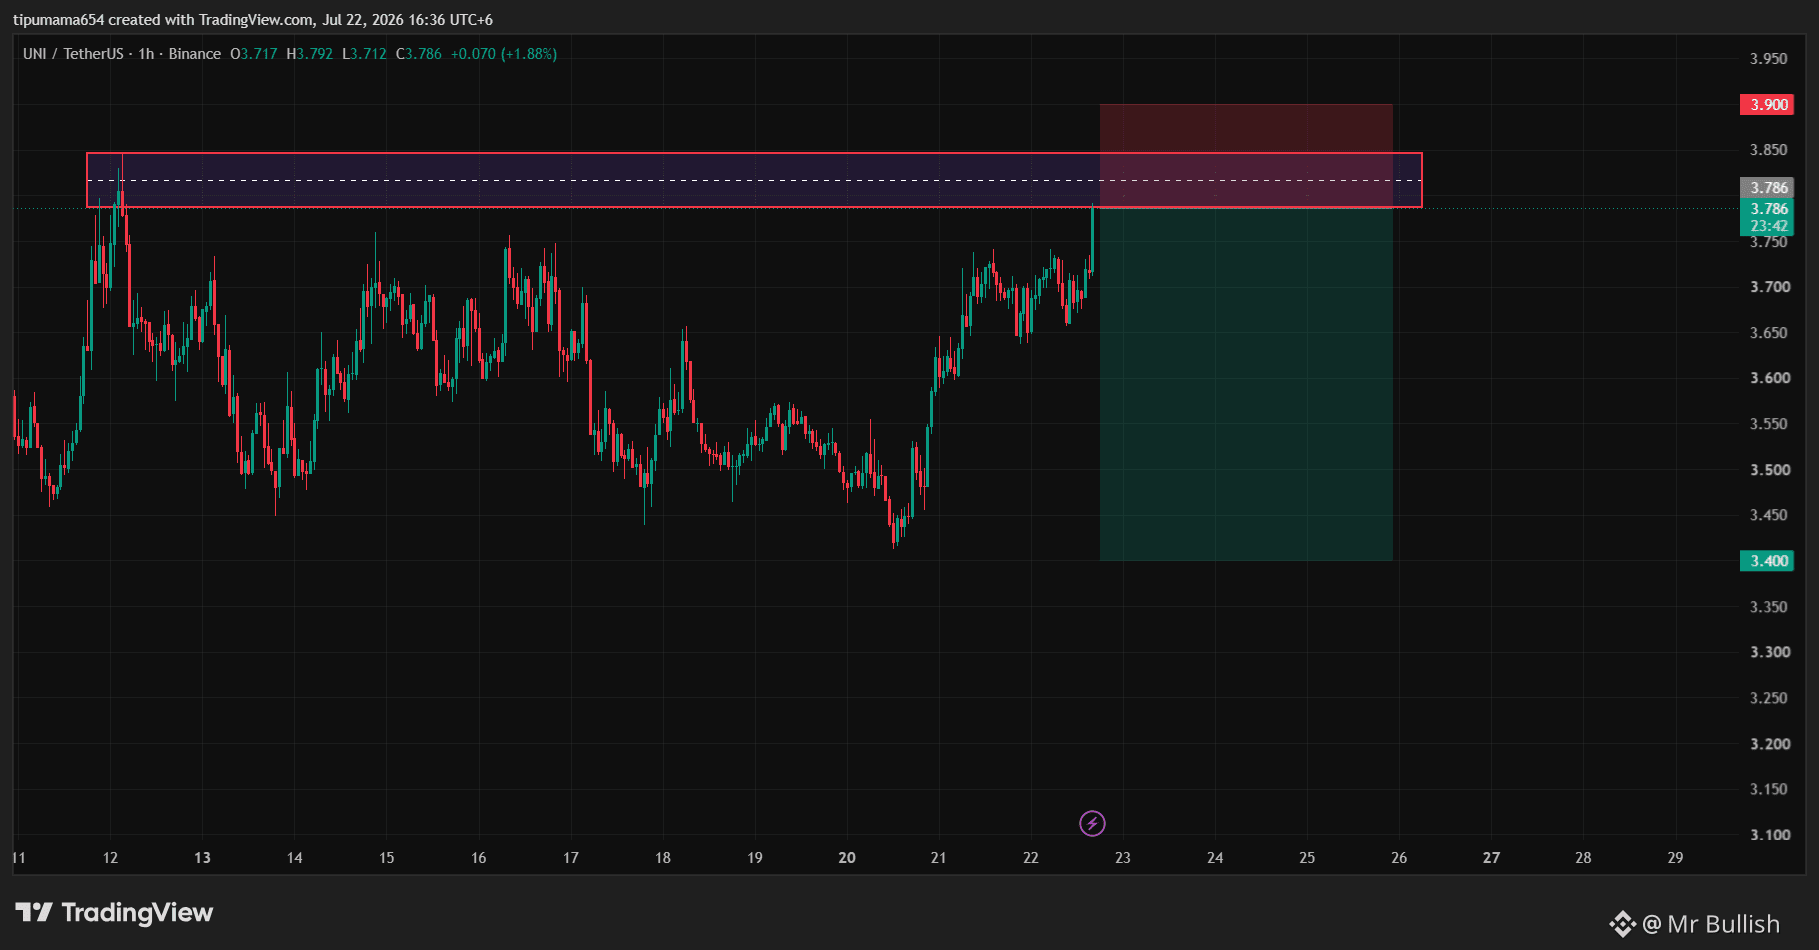
📉 $UNI USDT 做空 📍 入場區間:3.780 – 3.820 🎯 止盈:3.400 🛑 止損:3.900 更高週期仍處於明確的下跌趨勢。價格掃掉了重要阻力上方的流動性,觸及關鍵供給區,並且已經顯示出強烈的看跌拒絕。 ⚠️ 請務必遵循嚴格的風險管理。僅冒你資金中很小的一部分風險,當交易開始朝有利方向運行時,將止損跟隨移動以保護你的利潤。
📉 $UNI USDT 做空 📍 入場區間:3.780 – 3.820 🎯 止盈:3.400 🛑 止損:3.900 更高週期仍處於明確的下跌趨勢。價格掃掉了重要阻力上方的流動性,觸及關鍵供給區,並且已經顯示出強烈的看跌拒絕。 ⚠️ 請務必遵循嚴格的風險管理。僅冒你資金中很小的一部分風險,當交易開始朝有利方向運行時,將止損跟隨移動以保護你的利潤。
77
·
--
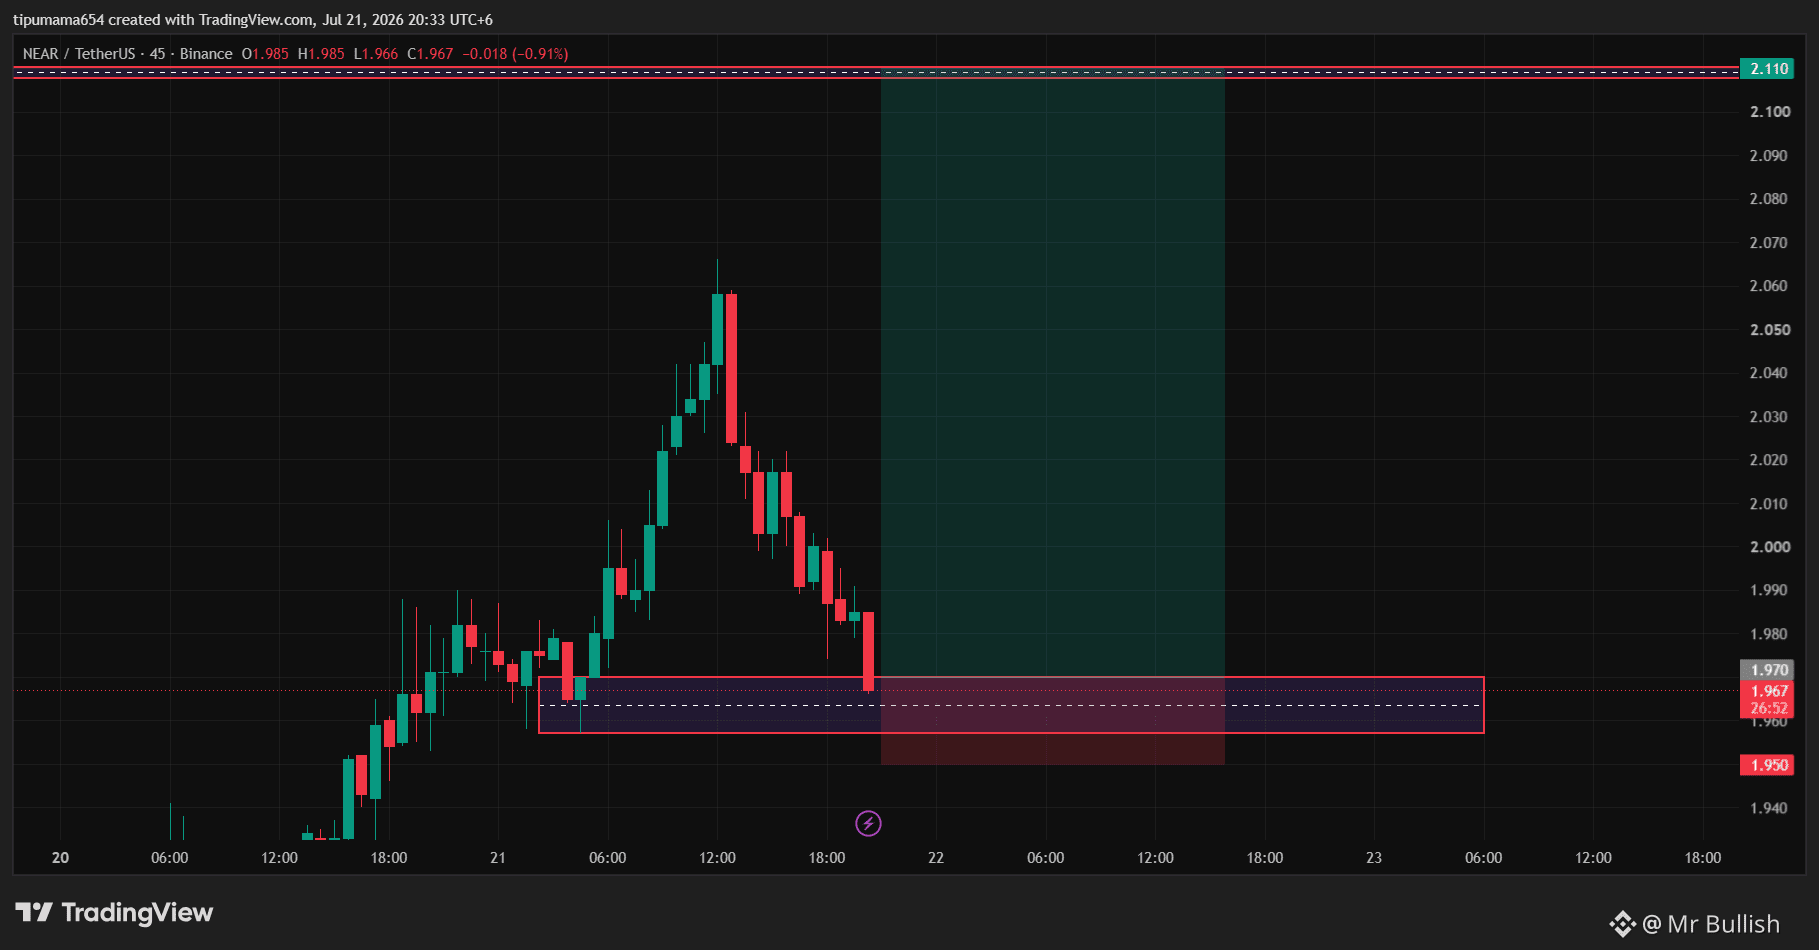
📈 $NEAR USDT 多單 📍 入場區域:1.965 – 1.970 🎯 止盈:2.110 🛑 止損:1.950 價格已突破一個重要阻力位,並正在從該阻力上方的需求區域進行健康回測,從而提供一個潛在的做多機會。 ⚠️ 請只承擔你資金中的少量風險;一旦交易開始朝有利方向運行,就將止損跟進調整以保護你的利潤。
📈 $NEAR USDT 多單 📍 入場區域:1.965 – 1.970 🎯 止盈:2.110 🛑 止損:1.950 價格已突破一個重要阻力位,並正在從該阻力上方的需求區域進行健康回測,從而提供一個潛在的做多機會。 ⚠️ 請只承擔你資金中的少量風險;一旦交易開始朝有利方向運行,就將止損跟進調整以保護你的利潤。
75
·
--
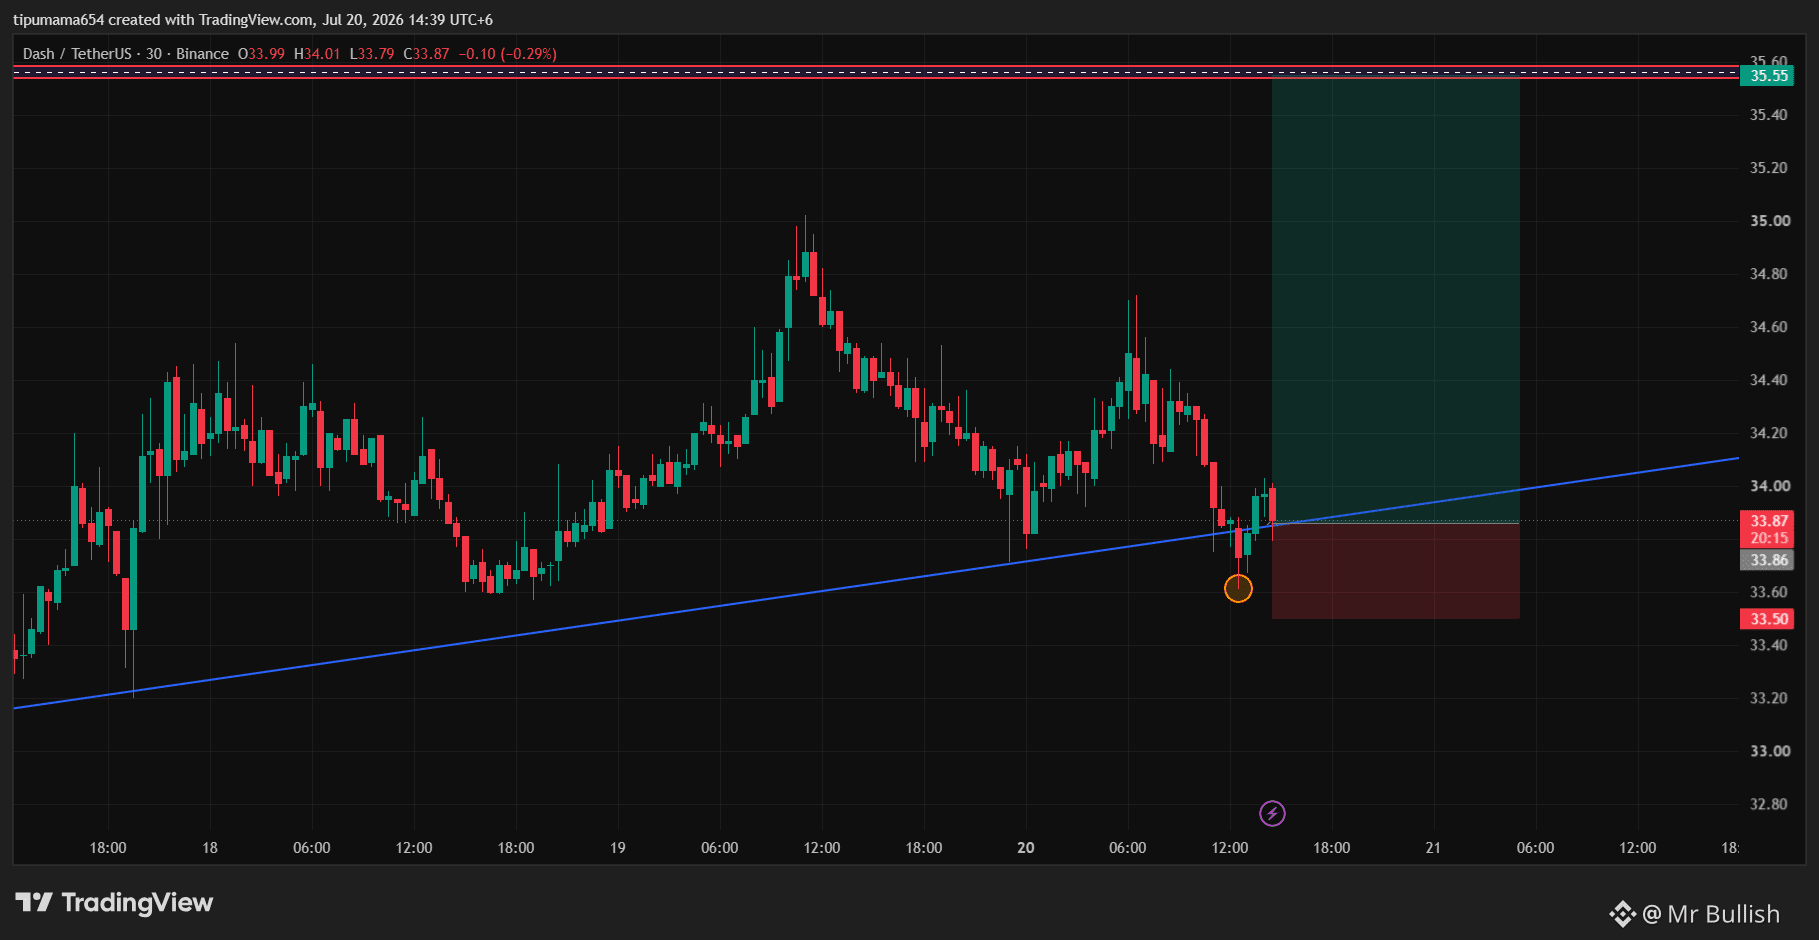
📈 $DASH USDT 做多 📍 入場區:33.80 – 33.90 🎯 止盈:35.60 🛑 止損:33.50 ⚠️ 務必遵循正確的風險管理。只承擔你資金中很小的一部分風險;一旦交易開始朝有利方向運行,就將止損上移以保護你的利潤。
📈 $DASH USDT 做多 📍 入場區:33.80 – 33.90 🎯 止盈:35.60 🛑 止損:33.50 ⚠️ 務必遵循正確的風險管理。只承擔你資金中很小的一部分風險;一旦交易開始朝有利方向運行,就將止損上移以保護你的利潤。
76
·
--
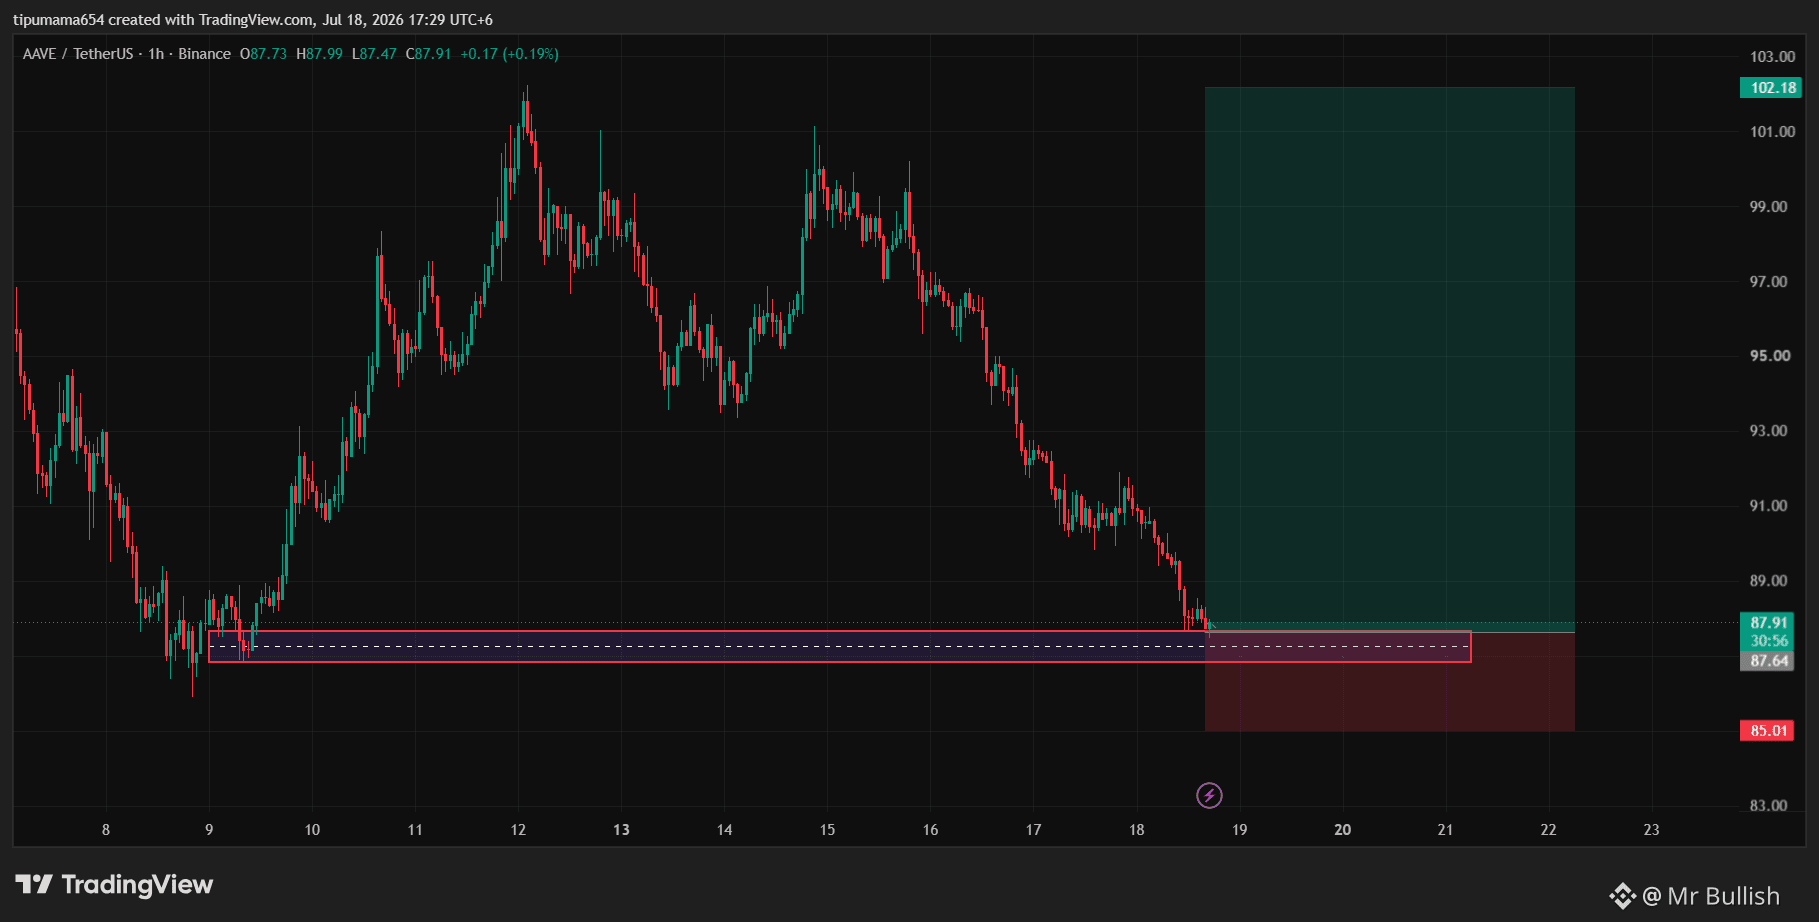
📈 $AAVE USDT 做多 📍 入場區:87 – 88 🎯 止盈:102 🛑 止損:85 ⚠️ 請務必遵循嚴格的風險管理。只承擔你資金中很小的一部分風險,並且一旦交易朝着有利方向運行,就將止損止盈進行跟蹤上移以保護你的收益。
📈 $AAVE USDT 做多 📍 入場區:87 – 88 🎯 止盈:102 🛑 止損:85 ⚠️ 請務必遵循嚴格的風險管理。只承擔你資金中很小的一部分風險,並且一旦交易朝着有利方向運行,就將止損止盈進行跟蹤上移以保護你的收益。
69
·
--
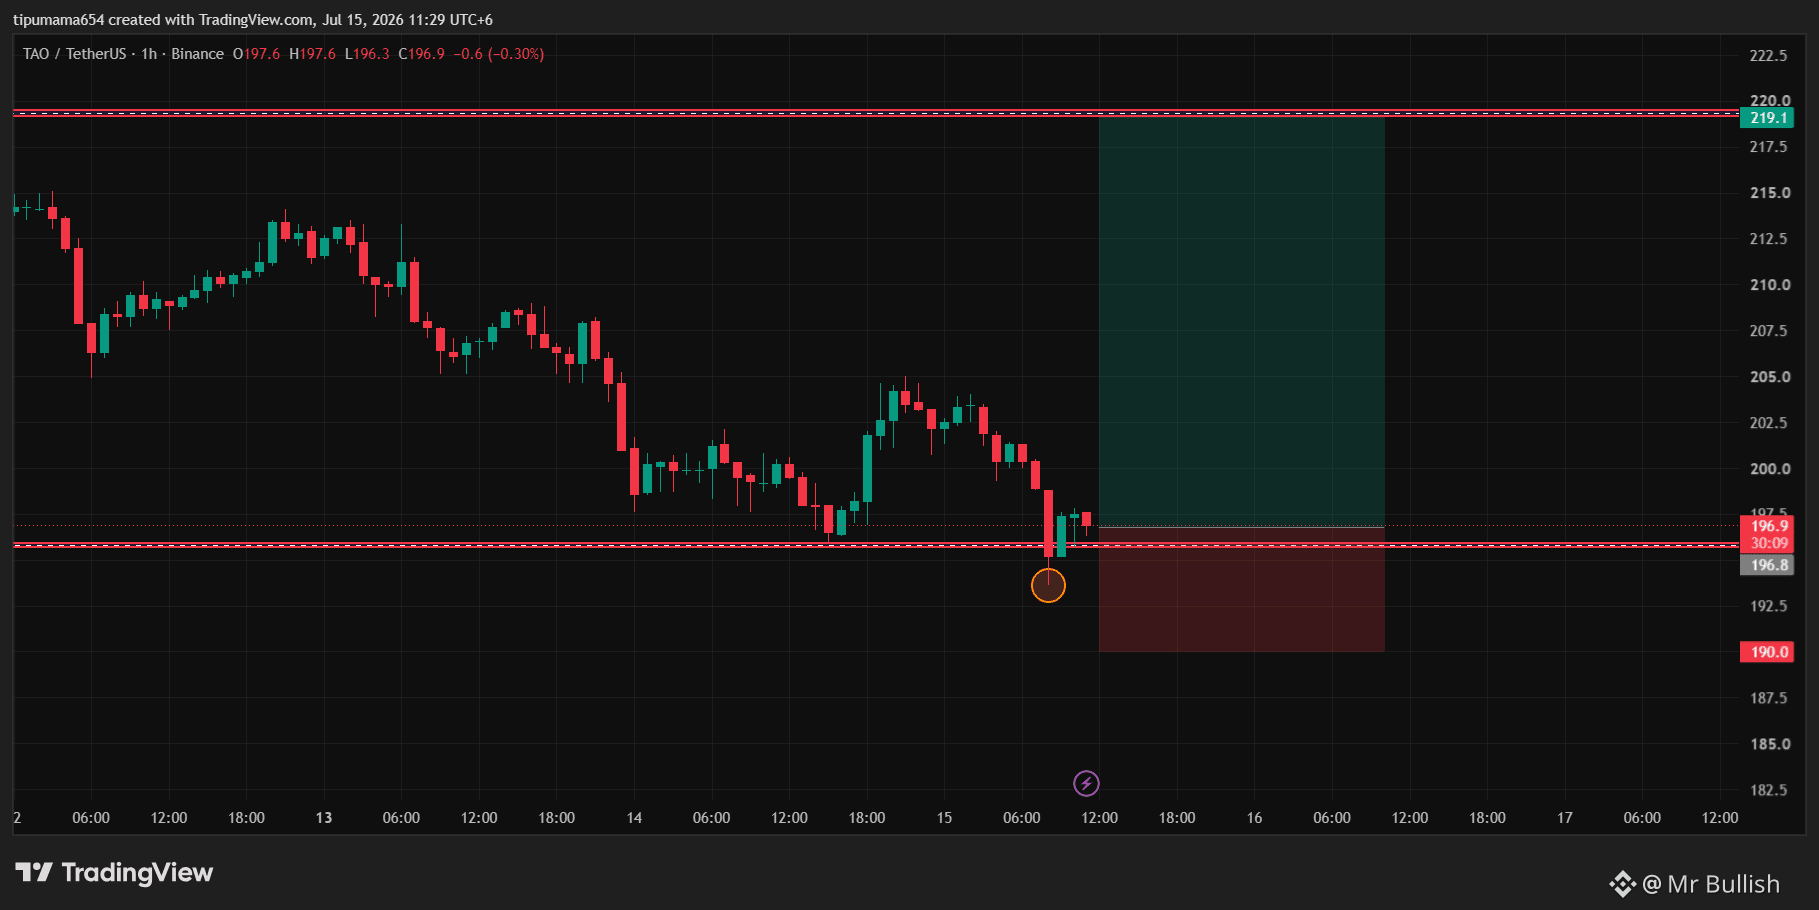
📈 $TAO USDT 多單 📍 入場區間:196 – 198 🎯 止盈:220 🛑 止損:190 ⚠️ 請務必遵循正確的風險管理。只用你資金中的一小部分進行交易,並且一旦交易開始對你有利,就將止損移動(跟蹤止損),以保護你的利潤。
📈 $TAO USDT 多單 📍 入場區間:196 – 198 🎯 止盈:220 🛑 止損:190 ⚠️ 請務必遵循正確的風險管理。只用你資金中的一小部分進行交易,並且一旦交易開始對你有利,就將止損移動(跟蹤止損),以保護你的利潤。
76
登入以探索更多內容
加入幣安廣場中的全球加密貨幣用戶
⚡️ 獲取加密貨幣的最新和實用資訊。
💬 受到全球最大加密貨幣交易所的信任。
👍 發掘來自經過驗證創作者的真實見解。
電子郵件 / 電話號碼
熱門話題
CFTC更新受监管机构代币化资产指引
5,822 次瀏覽
46 討論中
幣界網消息,美國聯邦儲備委員會(Fed)和商品期貨交易委員會(CFTC)於9月24日開始制定鏈上金融的相關規則。美聯儲提出了針對支付穩定幣發行者的首個儲備、資本和審批規則,而CFTC則進一步開放現有衍生品基礎設施以支持代幣化投資和區塊鏈記錄保存。美聯儲的提案要求支付穩定幣必須有足夠的資產支持,以滿足贖回需求,並引入標準化的資本要求,涵蓋特定的信用和操作風險。CFTC則更新了其關於客戶資金、保證金和記錄保存的指導,允許期貨委員會商和衍生品清算組織在代幣化投資中使用客戶資金。
币界网
·0 人按讚
·3.6k 次瀏覽
Bitget遭黑客攻击损失3.52亿美元
10,372 次瀏覽
45 討論中
纽约与Polymarket互诉预测市场合法性
9,093 次瀏覽
47 討論中