Binance Square
BeginWithBTC
7 貼文

BeginWithBTC

🚀 Crypto Research & Market Insights 📉 Bitcoin • Alt coins • Technical Analysis 📊 Daily market updates & educational content💡 Helping traders . learn . grow
0 關注
0 粉絲
2 點讚數
貼文
投資組合
·
--
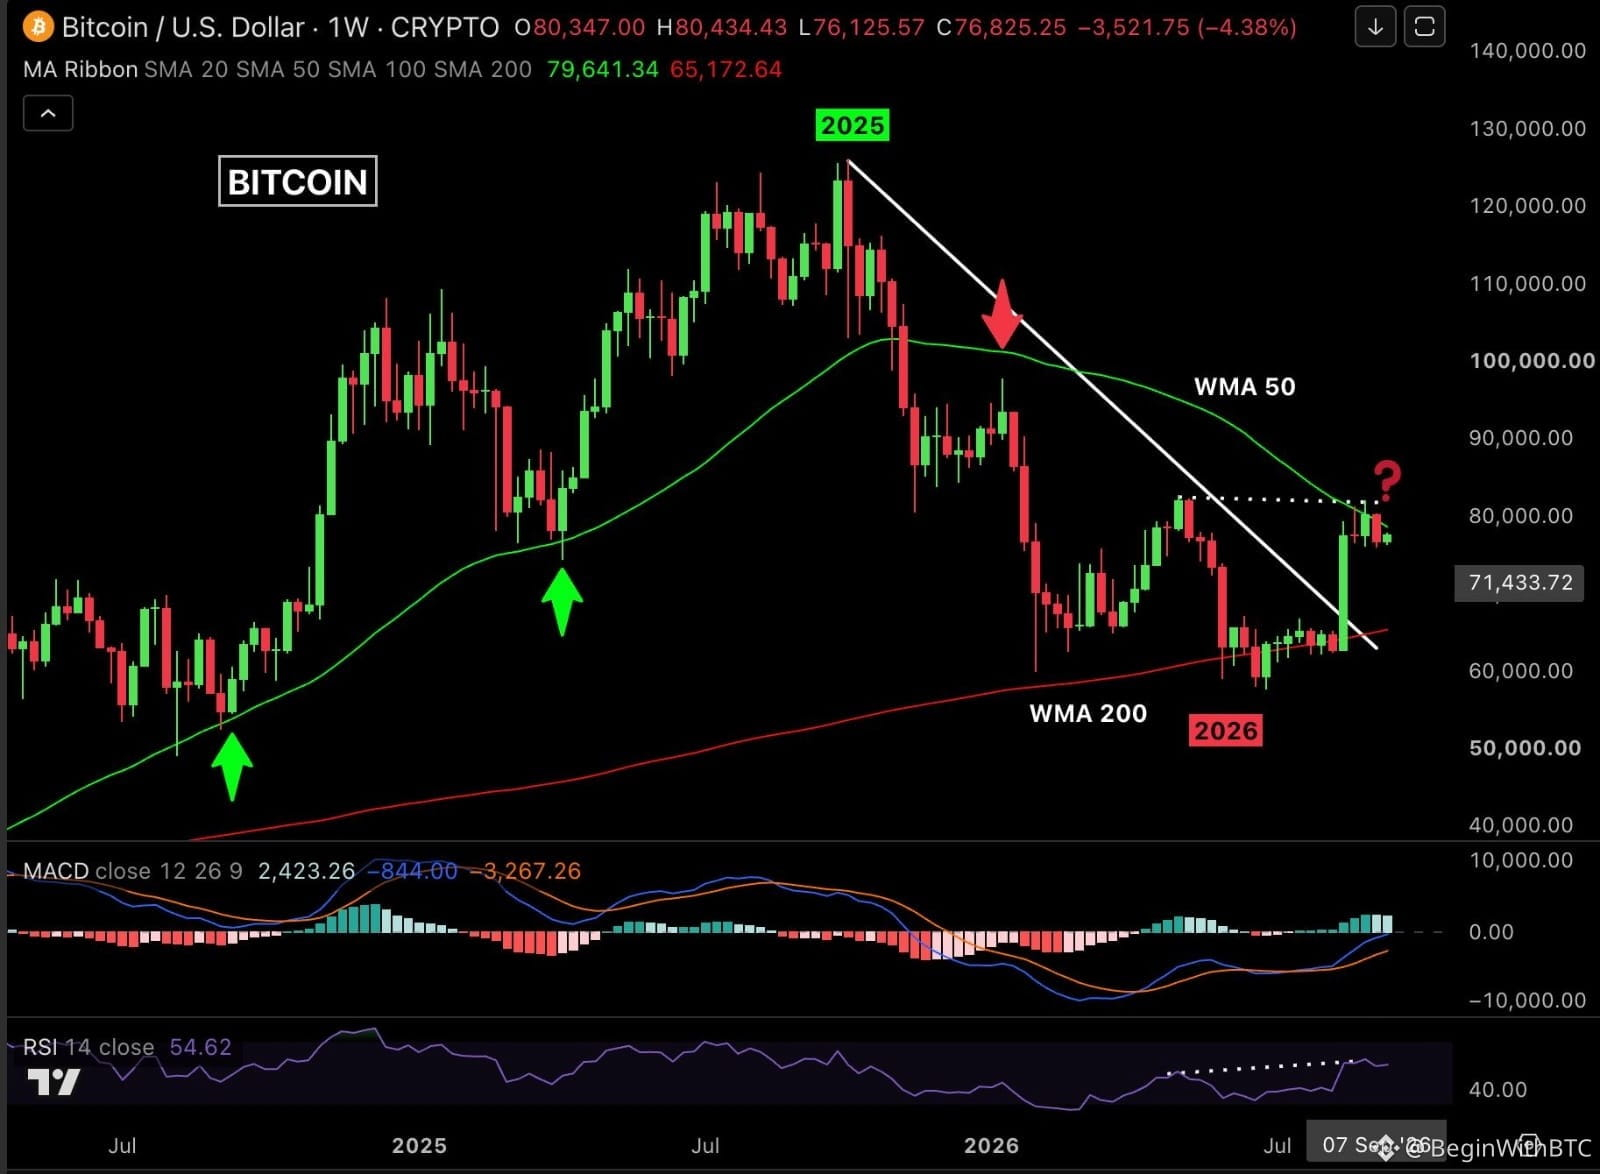
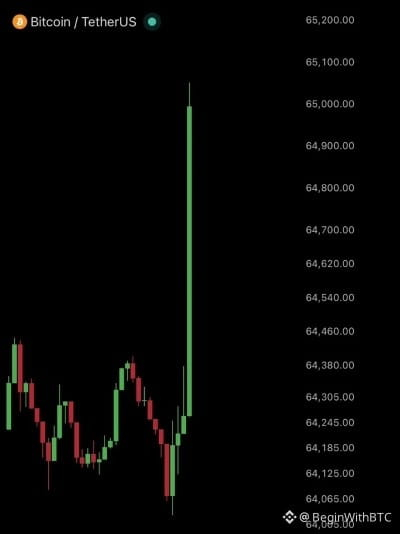
$BTC 🚨 比特幣的下一步:突破還是回拒? 💰 比特幣正處在關鍵區域,接下來的幾根K線可能決定市場走向。 在一段盤整之後,波動率正在下降——這種模式往往預示着即將出現重大行情。如果買方重新獲得動能且成交量上升,比特幣可能會嘗試強勢突破。可是,若失去關鍵支撐,可能會引發另一輪短期回調。 📊 需要重點關注的因素: - 強勁的買入量 - 突破並在阻力上方獲得確認 - 回調時支撐能否守住 記住,成功的交易者不會預測市場——他們會等待確認,並明智地管理風險。 你對比特幣的看法是什麼?👇 🚀 看漲突破 🔻 看跌回調 #bitcoin #BTC #crypto #BinanceSquareTalks #TechnicalAnalysiss
$BTC 🚨 比特幣的下一步:突破還是回拒?

💰 比特幣正處在關鍵區域,接下來的幾根K線可能決定市場走向。

在一段盤整之後,波動率正在下降——這種模式往往預示着即將出現重大行情。如果買方重新獲得動能且成交量上升,比特幣可能會嘗試強勢突破。可是,若失去關鍵支撐,可能會引發另一輪短期回調。

📊 需要重點關注的因素:

- 強勁的買入量
- 突破並在阻力上方獲得確認
- 回調時支撐能否守住

記住,成功的交易者不會預測市場——他們會等待確認,並明智地管理風險。

你對比特幣的看法是什麼?👇
🚀 看漲突破
🔻 看跌回調

#bitcoin #BTC #crypto #BinanceSquareTalks #TechnicalAnalysiss
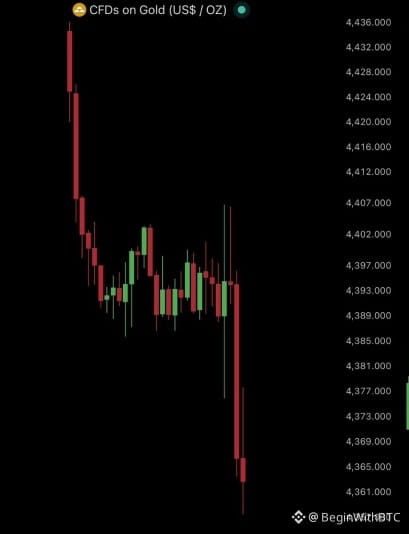
$BTC "儘管比特幣實現了快速的機構化採用,並且作爲“數字黃金”受到日益廣泛的認可,實體黃金仍是按市值計算全球最大的價值儲備資產。比特幣正在縮小差距,但黃金仍然主導全球財富保值。" � #GoldBreaksOutFromJanuaryDowntrend #Bitcoin❗
$BTC "儘管比特幣實現了快速的機構化採用,並且作爲“數字黃金”受到日益廣泛的認可,實體黃金仍是按市值計算全球最大的價值儲備資產。比特幣正在縮小差距,但黃金仍然主導全球財富保值。" �
#GoldBreaksOutFromJanuaryDowntrend #Bitcoin❗
文章
查看翻譯
Bitcoin Major Support & Resistance Zone:The Foundation of Professional Market Anylsis$BTC Major Support & Resistance Zones: The Foundation of Professional Market Analysis Introduction Bitcoin (BTC) has evolved from an experimental digital asset into one of the world's most closely watched financial instruments. Over the past decade, its market capitalization has grown into the hundreds of billions of dollars, attracting retail traders, hedge funds, asset managers, public companies, and institutional investors. Despite Bitcoin's volatility, one principle has remained remarkably consistent throughout every market cycle: price respects important support and resistance levels. Whether Bitcoin is experiencing a strong bull market, a prolonged bear market, or a period of consolidation, these critical price zones often determine where buyers gain control, where sellers become dominant, and where the next significant trend begins. Professional traders rarely rely on emotions or market headlines alone. Instead, they analyze price structure, liquidity, trading volume, and historical market behavior. At the center of this analysis lies one of the most important concepts in technical analysis—Support and Resistance. This article explains how these zones are formed, why they matter, and how professional traders incorporate them into their trading strategies. --- Understanding Market Structure Every financial market moves through a continuous cycle of buying and selling. When demand exceeds supply, prices rise. When supply exceeds demand, prices fall. The interaction between buyers and sellers naturally creates areas where the market repeatedly reacts. These areas eventually become known as support and resistance zones. Unlike random price levels, these zones represent areas where significant amounts of capital have previously entered the market. Because human psychology tends to repeat itself, these same areas often influence future price action. --- What Is Support? Support is a price zone where buying pressure becomes strong enough to slow, stop, or completely reverse a downtrend. At support levels, investors generally believe Bitcoin has become undervalued relative to current market conditions. As a result, demand increases while selling pressure decreases. Every time Bitcoin successfully rebounds from the same price region, confidence in that support level grows stronger. However, support should never be viewed as a single price. Professional traders treat support as a zone rather than an exact number because markets rarely reverse at the precise same level. Instead, institutional buying is often distributed across a range of prices. --- What Is Resistance? Resistance represents the opposite side of market psychology. It is a price area where selling pressure becomes stronger than buying pressure. Many traders begin taking profits after significant rallies. Some investors who previously bought at higher prices may also sell when the market returns to their original entry point. These combined selling activities create resistance. When Bitcoin repeatedly struggles to move above the same area, market participants recognize that level as an important resistance zone. A confirmed breakout above resistance usually indicates renewed buying momentum and often leads to the beginning of another upward trend. --- Why Support and Resistance Matter Professional trading is based on probabilities rather than predictions. Support and resistance levels help traders identify areas where probabilities favor specific market reactions. Instead of chasing prices emotionally, experienced traders wait for Bitcoin to approach these important zones before making trading decisions. Support and resistance assist traders by: - Identifying high-probability entry opportunities. - Defining realistic profit targets. - Determining logical stop-loss placement. - Measuring overall market strength. - Identifying breakout and reversal opportunities. - Improving risk-to-reward ratios. Without these levels, trading becomes little more than speculation. --- The Psychology Behind These Levels Markets are driven by human behavior. Fear and greed repeatedly create similar trading patterns throughout every market cycle. When Bitcoin falls toward an important support level, investors often remember previous rebounds from that area. This encourages buying activity. Likewise, when Bitcoin approaches previous highs, many investors become concerned that the market may reverse again. This increases selling pressure. Because millions of traders observe similar price levels, these zones often become self-reinforcing. The more market participants recognize a level, the more influential it becomes. --- Types of Support and Resistance Horizontal Levels Horizontal support and resistance represent the most widely used technical levels. These zones develop after repeated market reactions at approximately the same price. The more frequently Bitcoin respects a level, the stronger that level becomes. --- Dynamic Support and Resistance Unlike horizontal levels, dynamic support and resistance move continuously with price. Common examples include: - 50 EMA - 100 EMA - 200 EMA - Trendlines - Price Channels Institutional traders frequently monitor these indicators because they reflect changing market trends. --- Psychological Levels Round numbers naturally attract attention. Levels such as: - $50,000 - $75,000 - $100,000 - $150,000 often generate substantial buying and selling activity. These areas become important because traders naturally place orders around memorable price levels. --- Characteristics of Strong Support Zones Not every support level carries equal importance. Professional traders evaluate several characteristics before considering a support level reliable. Strong support zones usually include: - High historical trading volume - Institutional accumulation - Multiple successful price rebounds - Increased buying pressure - Confluence with moving averages - Positive momentum indicators The more technical factors align, the stronger the support becomes. --- Characteristics of Strong Resistance Zones Strong resistance levels typically display: - Previous swing highs - Heavy profit-taking - Increased selling volume - Institutional distribution - Multiple price rejections - Overbought market conditions These factors increase the probability that price may temporarily reverse before continuing higher. --- Breakouts and False Breakouts One of the biggest mistakes made by inexperienced traders is assuming every breakout is genuine. Professional traders wait for confirmation. A genuine breakout generally includes: - Strong trading volume - Large bullish candles - Daily or weekly candle close above resistance - Follow-through buying False breakouts often occur when price briefly moves above resistance before quickly falling back below it. This phenomenon traps emotional buyers while allowing experienced traders to enter after confirmation. --- Support Becoming Resistance One of the most fascinating characteristics of financial markets is role reversal. When support breaks decisively, that same level frequently becomes future resistance. Likewise, once resistance is broken, it often transforms into new support. Understanding this transition helps traders identify trend continuation opportunities. --- Combining Support & Resistance with Other Indicators Professional traders rarely depend on one indicator. Instead, they combine support and resistance with additional confirmation tools including: - Relative Strength Index (RSI) - MACD - Volume Profile - Moving Averages - Fibonacci Retracement - Market Structure - Trend Analysis - Candlestick Patterns The greater the number of confirmations, the higher the probability of a successful trade. --- Risk Management Even the strongest support or resistance level can fail. This is why risk management is more important than prediction. Professional traders focus on protecting capital before pursuing profits. Effective risk management includes: - Using stop-loss orders. - Maintaining favorable risk-to-reward ratios. - Avoiding emotional decisions. - Limiting position size. - Following a predefined trading plan. Long-term consistency comes from disciplined execution rather than attempting to predict every market movement. --- Common Mistakes Traders Should Avoid Many new traders repeatedly make the same mistakes. These include: - Buying immediately after price touches support. - Selling solely because price reaches resistance. - Ignoring trading volume. - Trading without confirmation. - Overleveraging positions. - Removing stop-loss orders. - Chasing emotional breakouts. - Ignoring broader market trends. Successful traders understand that patience often creates better opportunities than impulsive trading. --- Final Thoughts Support and resistance are far more than simple lines on a chart. They represent the collective decisions of millions of market participants and reveal where supply and demand have historically shifted. While no technical tool guarantees future performance, these zones consistently provide a framework for understanding market behavior, managing risk, and identifying high-probability trading opportunities. The most successful Bitcoin traders do not attempt to predict every price movement. Instead, they wait for the market to approach key support or resistance areas, seek confirmation through price action and volume, and execute disciplined strategies based on probability rather than emotion. Mastering support and resistance is not about finding perfect entries—it is about developing the patience, consistency, and risk management required for long-term success in one of the world's most dynamic financial markets. Disclaimer: This article is intended for educational and informational purposes only and does not constitute financial or investment advice. Cryptocurrency markets are highly volatile and involve substantial risk. Always conduct your own research (DYOR), evaluate your financial situation, and consult a qualified financial advisor before making investment decisions. #bitcoin #btc70k #cryptouniverseofficial #HISTORY

Bitcoin Major Support & Resistance Zone:The Foundation of Professional Market Anylsis

$BTC Major Support & Resistance Zones: The Foundation of Professional Market Analysis
Introduction
Bitcoin (BTC) has evolved from an experimental digital asset into one of the world's most closely watched financial instruments. Over the past decade, its market capitalization has grown into the hundreds of billions of dollars, attracting retail traders, hedge funds, asset managers, public companies, and institutional investors.
Despite Bitcoin's volatility, one principle has remained remarkably consistent throughout every market cycle: price respects important support and resistance levels.
Whether Bitcoin is experiencing a strong bull market, a prolonged bear market, or a period of consolidation, these critical price zones often determine where buyers gain control, where sellers become dominant, and where the next significant trend begins.
Professional traders rarely rely on emotions or market headlines alone. Instead, they analyze price structure, liquidity, trading volume, and historical market behavior. At the center of this analysis lies one of the most important concepts in technical analysis—Support and Resistance.
This article explains how these zones are formed, why they matter, and how professional traders incorporate them into their trading strategies.
---
Understanding Market Structure
Every financial market moves through a continuous cycle of buying and selling.
When demand exceeds supply, prices rise.
When supply exceeds demand, prices fall.
The interaction between buyers and sellers naturally creates areas where the market repeatedly reacts. These areas eventually become known as support and resistance zones.
Unlike random price levels, these zones represent areas where significant amounts of capital have previously entered the market.
Because human psychology tends to repeat itself, these same areas often influence future price action.
---
What Is Support?
Support is a price zone where buying pressure becomes strong enough to slow, stop, or completely reverse a downtrend.
At support levels, investors generally believe Bitcoin has become undervalued relative to current market conditions.
As a result, demand increases while selling pressure decreases.
Every time Bitcoin successfully rebounds from the same price region, confidence in that support level grows stronger.
However, support should never be viewed as a single price.
Professional traders treat support as a zone rather than an exact number because markets rarely reverse at the precise same level.
Instead, institutional buying is often distributed across a range of prices.
---
What Is Resistance?
Resistance represents the opposite side of market psychology.
It is a price area where selling pressure becomes stronger than buying pressure.
Many traders begin taking profits after significant rallies.
Some investors who previously bought at higher prices may also sell when the market returns to their original entry point.
These combined selling activities create resistance.
When Bitcoin repeatedly struggles to move above the same area, market participants recognize that level as an important resistance zone.
A confirmed breakout above resistance usually indicates renewed buying momentum and often leads to the beginning of another upward trend.
---
Why Support and Resistance Matter
Professional trading is based on probabilities rather than predictions.
Support and resistance levels help traders identify areas where probabilities favor specific market reactions.
Instead of chasing prices emotionally, experienced traders wait for Bitcoin to approach these important zones before making trading decisions.
Support and resistance assist traders by:
- Identifying high-probability entry opportunities.
- Defining realistic profit targets.
- Determining logical stop-loss placement.
- Measuring overall market strength.
- Identifying breakout and reversal opportunities.
- Improving risk-to-reward ratios.
Without these levels, trading becomes little more than speculation.
---
The Psychology Behind These Levels
Markets are driven by human behavior.
Fear and greed repeatedly create similar trading patterns throughout every market cycle.
When Bitcoin falls toward an important support level, investors often remember previous rebounds from that area.
This encourages buying activity.
Likewise, when Bitcoin approaches previous highs, many investors become concerned that the market may reverse again.
This increases selling pressure.
Because millions of traders observe similar price levels, these zones often become self-reinforcing.
The more market participants recognize a level, the more influential it becomes.
---
Types of Support and Resistance
Horizontal Levels
Horizontal support and resistance represent the most widely used technical levels.
These zones develop after repeated market reactions at approximately the same price.
The more frequently Bitcoin respects a level, the stronger that level becomes.
---
Dynamic Support and Resistance
Unlike horizontal levels, dynamic support and resistance move continuously with price.
Common examples include:
- 50 EMA
- 100 EMA
- 200 EMA
- Trendlines
- Price Channels
Institutional traders frequently monitor these indicators because they reflect changing market trends.
---
Psychological Levels
Round numbers naturally attract attention.
Levels such as:
- $50,000
- $75,000
- $100,000
- $150,000
often generate substantial buying and selling activity.
These areas become important because traders naturally place orders around memorable price levels.
---
Characteristics of Strong Support Zones
Not every support level carries equal importance.
Professional traders evaluate several characteristics before considering a support level reliable.
Strong support zones usually include:
- High historical trading volume
- Institutional accumulation
- Multiple successful price rebounds
- Increased buying pressure
- Confluence with moving averages
- Positive momentum indicators
The more technical factors align, the stronger the support becomes.
---
Characteristics of Strong Resistance Zones
Strong resistance levels typically display:
- Previous swing highs
- Heavy profit-taking
- Increased selling volume
- Institutional distribution
- Multiple price rejections
- Overbought market conditions
These factors increase the probability that price may temporarily reverse before continuing higher.
---
Breakouts and False Breakouts
One of the biggest mistakes made by inexperienced traders is assuming every breakout is genuine.
Professional traders wait for confirmation.
A genuine breakout generally includes:
- Strong trading volume
- Large bullish candles
- Daily or weekly candle close above resistance
- Follow-through buying
False breakouts often occur when price briefly moves above resistance before quickly falling back below it.
This phenomenon traps emotional buyers while allowing experienced traders to enter after confirmation.
---
Support Becoming Resistance
One of the most fascinating characteristics of financial markets is role reversal.
When support breaks decisively, that same level frequently becomes future resistance.
Likewise, once resistance is broken, it often transforms into new support.
Understanding this transition helps traders identify trend continuation opportunities.
---
Combining Support & Resistance with Other Indicators
Professional traders rarely depend on one indicator.
Instead, they combine support and resistance with additional confirmation tools including:
- Relative Strength Index (RSI)
- MACD
- Volume Profile
- Moving Averages
- Fibonacci Retracement
- Market Structure
- Trend Analysis
- Candlestick Patterns
The greater the number of confirmations, the higher the probability of a successful trade.
---
Risk Management
Even the strongest support or resistance level can fail.
This is why risk management is more important than prediction.
Professional traders focus on protecting capital before pursuing profits.
Effective risk management includes:
- Using stop-loss orders.
- Maintaining favorable risk-to-reward ratios.
- Avoiding emotional decisions.
- Limiting position size.
- Following a predefined trading plan.
Long-term consistency comes from disciplined execution rather than attempting to predict every market movement.
---
Common Mistakes Traders Should Avoid
Many new traders repeatedly make the same mistakes.
These include:
- Buying immediately after price touches support.
- Selling solely because price reaches resistance.
- Ignoring trading volume.
- Trading without confirmation.
- Overleveraging positions.
- Removing stop-loss orders.
- Chasing emotional breakouts.
- Ignoring broader market trends.
Successful traders understand that patience often creates better opportunities than impulsive trading.
---
Final Thoughts
Support and resistance are far more than simple lines on a chart. They represent the collective decisions of millions of market participants and reveal where supply and demand have historically shifted.
While no technical tool guarantees future performance, these zones consistently provide a framework for understanding market behavior, managing risk, and identifying high-probability trading opportunities.
The most successful Bitcoin traders do not attempt to predict every price movement. Instead, they wait for the market to approach key support or resistance areas, seek confirmation through price action and volume, and execute disciplined strategies based on probability rather than emotion.
Mastering support and resistance is not about finding perfect entries—it is about developing the patience, consistency, and risk management required for long-term success in one of the world's most dynamic financial markets.
Disclaimer: This article is intended for educational and informational purposes only and does not constitute financial or investment advice. Cryptocurrency markets are highly volatile and involve substantial risk. Always conduct your own research (DYOR), evaluate your financial situation, and consult a qualified financial advisor before making investment decisions.
#bitcoin
#btc70k #cryptouniverseofficial #HISTORY
$BTC / 美元穩定幣(USDT)最新市場動態(複製並粘貼以用於 Binance): 比特幣(BTC)市場分析 – 2026年8月7日 當前市場結構仍偏謹慎看多,因爲BTC維持在關鍵的64,000美元支撐之上。買家繼續守住該區域,而價格在近期盤整之後正嘗試積蓄動能。分析師指出,站穩50日EMA具有建設性,不過上方仍存在阻力。 關鍵價位 🟢 支撐:$64,000 – $63,500 🔴 阻力:$65,500 – $67,000 📈 若上破65.5K美元,可能打開通往67K+的空間。 📉 若跌破64K美元,可能引發走勢走向62.5K–63K。 交易傾向 短線:在64K美元之上仍偏看多。 策略:等待突破確認,或在強支撐附近買入並做好適當的風險管理。 趨勢:除非價格收盤跌破主要支撐區,否則偏中性到看多。 #bitcoin #Crypto_Jobs🎯 #cryptouniverseofficial
$BTC / 美元穩定幣(USDT)最新市場動態(複製並粘貼以用於 Binance):

比特幣(BTC)市場分析 – 2026年8月7日

當前市場結構仍偏謹慎看多,因爲BTC維持在關鍵的64,000美元支撐之上。買家繼續守住該區域,而價格在近期盤整之後正嘗試積蓄動能。分析師指出,站穩50日EMA具有建設性,不過上方仍存在阻力。

關鍵價位

🟢 支撐:$64,000 – $63,500

🔴 阻力:$65,500 – $67,000

📈 若上破65.5K美元,可能打開通往67K+的空間。

📉 若跌破64K美元,可能引發走勢走向62.5K–63K。

交易傾向
短線:在64K美元之上仍偏看多。
策略:等待突破確認,或在強支撐附近買入並做好適當的風險管理。
趨勢:除非價格收盤跌破主要支撐區,否則偏中性到看多。
#bitcoin #Crypto_Jobs🎯 #cryptouniverseofficial
登入以探索更多內容
加入幣安廣場中的全球加密貨幣用戶
⚡️ 獲取加密貨幣的最新和實用資訊。
💬 受到全球最大加密貨幣交易所的信任。
👍 發掘來自經過驗證創作者的真實見解。
電子郵件 / 電話號碼
網站地圖
Cookie 偏好設定
平台條款