
Basic Money BD
183 貼文

Basic Money BD
舉報
封鎖用戶
Follow For a FREE POTATO :))
實盤交易
中頻交易者
6.2 年
43 關注
52 粉絲
100 點讚數
貼文
投資組合
全部
引用
影片
置頂
與我聯繫以獲取推廣、合作、大使、夥伴、評論、AMA等信息。👇
點擊並在這裏找到我所有的社交媒體、賬號、鏈接:👇
https://linktr.ee/basicmoneybd
與我聯繫以獲取推廣、合作、大使、夥伴、評論、AMA等信息。👇
點擊並在這裏找到我所有的社交媒體、賬號、鏈接:👇
https://linktr.ee/basicmoneybd
點擊並在這裏找到我所有的社交媒體、賬號、鏈接:👇
https://linktr.ee/basicmoneybd
2
14
#baby $BABY 對$BABY 的長期價值而言,它不只是關於短期價格波動——更在於它在協調 Babylon 生態系統中所扮演的角色。
隨着採用不斷增長,越來越多的 BTC 參與 Babylon 的基礎設施,治理變得愈發重要。強有力的治理有助於引導升級、生態激勵以及協議未來的發展方向。
市場波動和代幣解鎖可能會影響市場情緒,但它們並不會改變比特幣自託管質押的核心機制。隨着時間推移,真正要回答的問題是:Babylon 是否持續吸引用戶、開發者以及 BTC 流動性。
對我而言,重點始終在基本面,而不是頭條新聞。
@babylonlabs_io
$BABY #bitcoin #Babylon #BTCStaking
#baby $BABY 對$BABY 的長期價值而言,它不只是關於短期價格波動——更在於它在協調 Babylon 生態系統中所扮演的角色。
隨着採用不斷增長,越來越多的 BTC 參與 Babylon 的基礎設施,治理變得愈發重要。強有力的治理有助於引導升級、生態激勵以及協議未來的發展方向。
市場波動和代幣解鎖可能會影響市場情緒,但它們並不會改變比特幣自託管質押的核心機制。隨着時間推移,真正要回答的問題是:Babylon 是否持續吸引用戶、開發者以及 BTC 流動性。
對我而言,重點始終在基本面,而不是頭條新聞。
@BabylonLabs_io
$BABY #bitcoin #Babylon #BTCStaking
隨着採用不斷增長,越來越多的 BTC 參與 Babylon 的基礎設施,治理變得愈發重要。強有力的治理有助於引導升級、生態激勵以及協議未來的發展方向。
市場波動和代幣解鎖可能會影響市場情緒,但它們並不會改變比特幣自託管質押的核心機制。隨着時間推移,真正要回答的問題是:Babylon 是否持續吸引用戶、開發者以及 BTC 流動性。
對我而言,重點始終在基本面,而不是頭條新聞。
@BabylonLabs_io
$BABY #bitcoin #Babylon #BTCStaking
102
#baby $BABY
比特幣不必再閒置。
藉助 Babylon,你可以質押原生 BTC,同時保持對你幣的完全託管。不需要橋接、無需包裝資產,也不依賴可信的第三方——只有由密碼學時間鎖驅動的比特幣主網安全性。
這是在不損害比特幣核心原則的前提下,邁向釋放比特幣效用的一大步。
@babylonlabs_io $BABY #bitcoin #BTC #Babylon
#baby $BABY
比特幣不必再閒置。
藉助 Babylon,你可以質押原生 BTC,同時保持對你幣的完全託管。不需要橋接、無需包裝資產,也不依賴可信的第三方——只有由密碼學時間鎖驅動的比特幣主網安全性。
這是在不損害比特幣核心原則的前提下,邁向釋放比特幣效用的一大步。
@BabylonLabs_io $BABY #bitcoin #BTC #Babylon
比特幣不必再閒置。
藉助 Babylon,你可以質押原生 BTC,同時保持對你幣的完全託管。不需要橋接、無需包裝資產,也不依賴可信的第三方——只有由密碼學時間鎖驅動的比特幣主網安全性。
這是在不損害比特幣核心原則的前提下,邁向釋放比特幣效用的一大步。
@BabylonLabs_io $BABY #bitcoin #BTC #Babylon
2
#baby $BABY
比特幣不應該離開比特幣才能發揮作用。
藉助 Babylon 的無需信任比特幣金庫(Trustless Bitcoin Vaults),BTC 在保持自我託管的同時變得更具收益性。🟠
$BABY 支撐協調層:幫助保障協議安全、治理升級,並在整個生態系統中對齊激勵——無需依賴中心化託管方。
隨着無需信任的 BTC 基礎設施不斷擴張,像 baby 這樣的、原生於協議的資產的重要性也將愈發令人心動。
比特幣的實用性未來,正通過一個金庫一個金庫地構建中。
@babylonlabs_io
$BABY #BABY #bitcoin #BTCFi
#baby $BABY
比特幣不應該離開比特幣才能發揮作用。
藉助 Babylon 的無需信任比特幣金庫(Trustless Bitcoin Vaults),BTC 在保持自我託管的同時變得更具收益性。🟠
$BABY 支撐協調層:幫助保障協議安全、治理升級,並在整個生態系統中對齊激勵——無需依賴中心化託管方。
隨着無需信任的 BTC 基礎設施不斷擴張,像 baby 這樣的、原生於協議的資產的重要性也將愈發令人心動。
比特幣的實用性未來,正通過一個金庫一個金庫地構建中。
@BabylonLabs_io
$BABY #BABY #bitcoin #BTCFi
比特幣不應該離開比特幣才能發揮作用。
藉助 Babylon 的無需信任比特幣金庫(Trustless Bitcoin Vaults),BTC 在保持自我託管的同時變得更具收益性。🟠
$BABY 支撐協調層:幫助保障協議安全、治理升級,並在整個生態系統中對齊激勵——無需依賴中心化託管方。
隨着無需信任的 BTC 基礎設施不斷擴張,像 baby 這樣的、原生於協議的資產的重要性也將愈發令人心動。
比特幣的實用性未來,正通過一個金庫一個金庫地構建中。
@BabylonLabs_io
$BABY #BABY #bitcoin #BTCFi
8
·
--
看跌
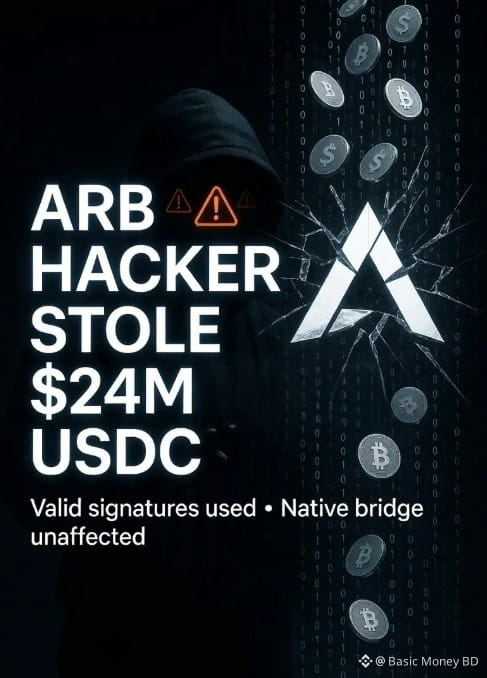
🚨$ARB hacker stole 24million $USDC with validl signatures Arbitrum said its native bridge was not affected.
{spot}(USDCUSDT)
{spot}(ARBUSDT)
🚨$ARB hacker stole 24million $USDC with validl signatures Arbitrum said its native bridge was not affected.
102
·
--
看漲
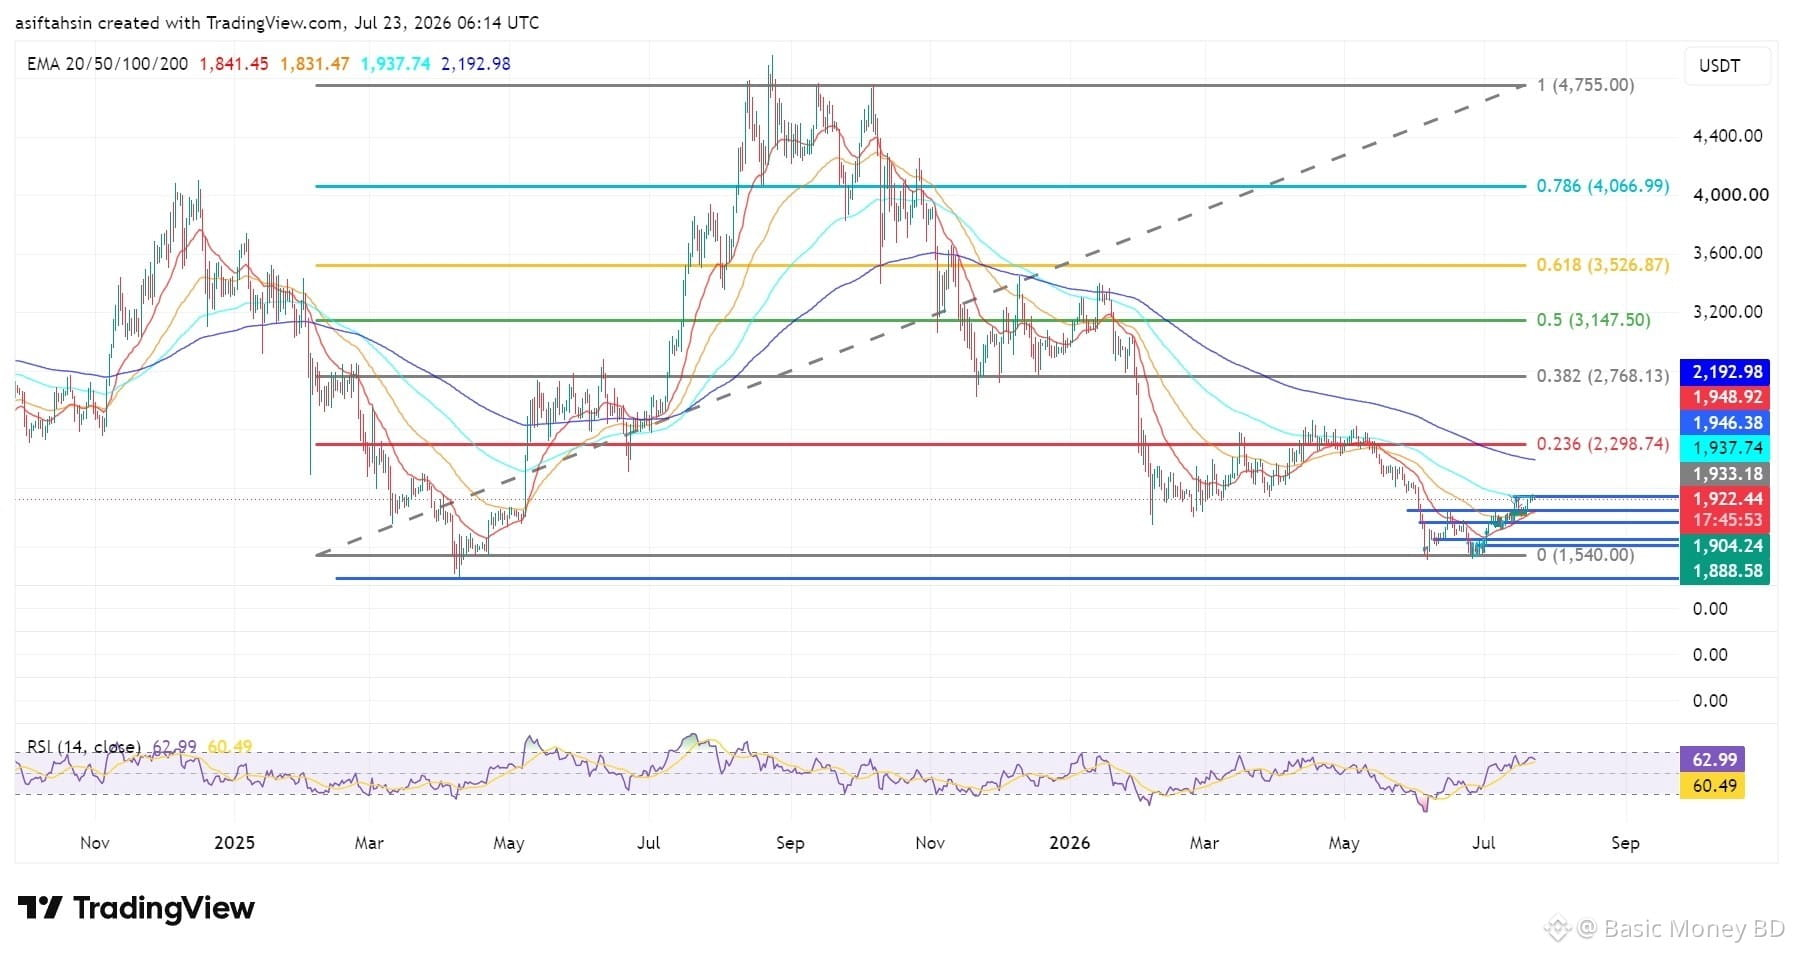
技術展望:$ETH 重新奪回短期 EMA,但 100 $EMA.US 仍是主要障礙
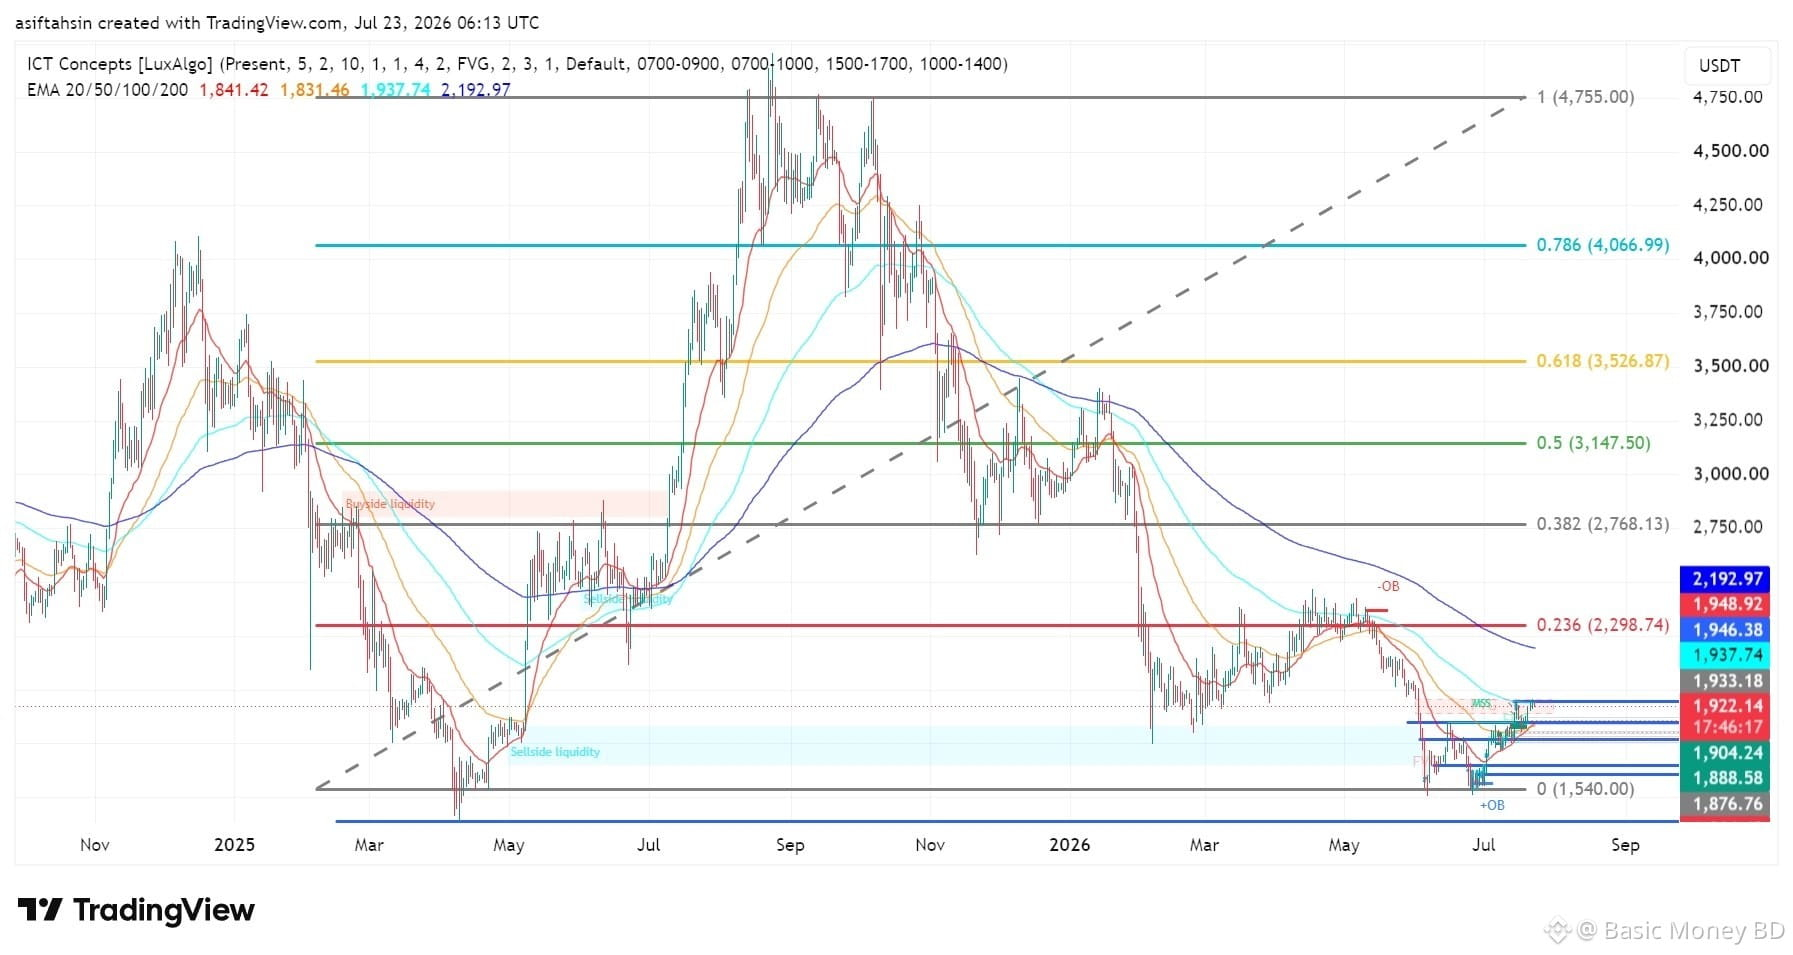
以太坊在守住 $1,888–$1,904 需求區後,延續反彈。價格已重新站上 20 EMA 與 50 EMA,而 RSI 持續在中性水準之上走強,顯示多頭動能改善。不過,ETH 仍位於 100 EMA 與 200 EMA 下方,表示儘管目前出現緩解型反彈,但更高週期的趨勢依然偏空。
📈
EMA 結構(短期看多修復)
20 EMA:$1,841.45
50 EMA:$1,831.47
100 EMA:$1,937.74
200 EMA:$2,192.98
ETH 交易價格同時高於 20 EMA 與 50 EMA,證實買方已重新掌握短期主導權。
100 EMA($1,937.74)是下一個主要阻力,且仍是用來確認更大級別趨勢反轉的關鍵水位。
200 EMA($2,192.98)持續作為強勁的更高週期阻力。
👉
短期結構偏向買方,但在 ETH 能夠建立於 100 EMA 上方的持續價格走勢前,宏觀趨勢仍偏空。
📐
費波納契 & 市場結構
ETH 仍低於 0.236 費波納契位於 $2,298.74 的水平,證實更高週期的下行趨勢仍未被破壞。
買方持續守住 $1,888–$1,904 需求區,並在掃清賣方流動性後形成較高低點結構。
目前價格正在測試約 $1,922–$1,946 的局部阻力集群;此前的供給與流動性可能引發獲利了結。
看多目標:
$1,946(100 EMA 阻力區)
$2,000
$2,193(200 EMA)
$2,299(0.236 費波納契)
看空情境:
若跌破 $1,904,將削弱目前的反彈結構。
若跌落至 $1,888 下方,將使看多佈局失效,並提高回到近期低點的機率。
🧠
ICT / 聰明資金觀點
ETH 在掃清 6 月低點後,已重新奪回附近的買方流動性,並試圖建立看多的市場結構。
價格正在回補短期公平價值缺口(FVG),同時接近附近的訂單區塊(OB);在此位置,賣方可能會變得活躍。 $ETH
{spot}(ETHUSDT)
技術展望:$ETH 重新奪回短期 EMA,但 100 $EMA.US 仍是主要障礙
以太坊在守住 $1,888–$1,904 需求區後,延續反彈。價格已重新站上 20 EMA 與 50 EMA,而 RSI 持續在中性水準之上走強,顯示多頭動能改善。不過,ETH 仍位於 100 EMA 與 200 EMA 下方,表示儘管目前出現緩解型反彈,但更高週期的趨勢依然偏空。
📈
EMA 結構(短期看多修復)
20 EMA:$1,841.45
50 EMA:$1,831.47
100 EMA:$1,937.74
200 EMA:$2,192.98
ETH 交易價格同時高於 20 EMA 與 50 EMA,證實買方已重新掌握短期主導權。
100 EMA($1,937.74)是下一個主要阻力,且仍是用來確認更大級別趨勢反轉的關鍵水位。
200 EMA($2,192.98)持續作為強勁的更高週期阻力。
👉
短期結構偏向買方,但在 ETH 能夠建立於 100 EMA 上方的持續價格走勢前,宏觀趨勢仍偏空。
📐
費波納契 & 市場結構
ETH 仍低於 0.236 費波納契位於 $2,298.74 的水平,證實更高週期的下行趨勢仍未被破壞。
買方持續守住 $1,888–$1,904 需求區,並在掃清賣方流動性後形成較高低點結構。
目前價格正在測試約 $1,922–$1,946 的局部阻力集群;此前的供給與流動性可能引發獲利了結。
看多目標:
$1,946(100 EMA 阻力區)
$2,000
$2,193(200 EMA)
$2,299(0.236 費波納契)
看空情境:
若跌破 $1,904,將削弱目前的反彈結構。
若跌落至 $1,888 下方,將使看多佈局失效,並提高回到近期低點的機率。
🧠
ICT / 聰明資金觀點
ETH 在掃清 6 月低點後,已重新奪回附近的買方流動性,並試圖建立看多的市場結構。
價格正在回補短期公平價值缺口(FVG),同時接近附近的訂單區塊(OB);在此位置,賣方可能會變得活躍。 $ETH
以太坊在守住 $1,888–$1,904 需求區後,延續反彈。價格已重新站上 20 EMA 與 50 EMA,而 RSI 持續在中性水準之上走強,顯示多頭動能改善。不過,ETH 仍位於 100 EMA 與 200 EMA 下方,表示儘管目前出現緩解型反彈,但更高週期的趨勢依然偏空。
📈
EMA 結構(短期看多修復)
20 EMA:$1,841.45
50 EMA:$1,831.47
100 EMA:$1,937.74
200 EMA:$2,192.98
ETH 交易價格同時高於 20 EMA 與 50 EMA,證實買方已重新掌握短期主導權。
100 EMA($1,937.74)是下一個主要阻力,且仍是用來確認更大級別趨勢反轉的關鍵水位。
200 EMA($2,192.98)持續作為強勁的更高週期阻力。
👉
短期結構偏向買方,但在 ETH 能夠建立於 100 EMA 上方的持續價格走勢前,宏觀趨勢仍偏空。
📐
費波納契 & 市場結構
ETH 仍低於 0.236 費波納契位於 $2,298.74 的水平,證實更高週期的下行趨勢仍未被破壞。
買方持續守住 $1,888–$1,904 需求區,並在掃清賣方流動性後形成較高低點結構。
目前價格正在測試約 $1,922–$1,946 的局部阻力集群;此前的供給與流動性可能引發獲利了結。
看多目標:
$1,946(100 EMA 阻力區)
$2,000
$2,193(200 EMA)
$2,299(0.236 費波納契)
看空情境:
若跌破 $1,904,將削弱目前的反彈結構。
若跌落至 $1,888 下方,將使看多佈局失效,並提高回到近期低點的機率。
🧠
ICT / 聰明資金觀點
ETH 在掃清 6 月低點後,已重新奪回附近的買方流動性,並試圖建立看多的市場結構。
價格正在回補短期公平價值缺口(FVG),同時接近附近的訂單區塊(OB);在此位置,賣方可能會變得活躍。 $ETH
77
·
--
看漲
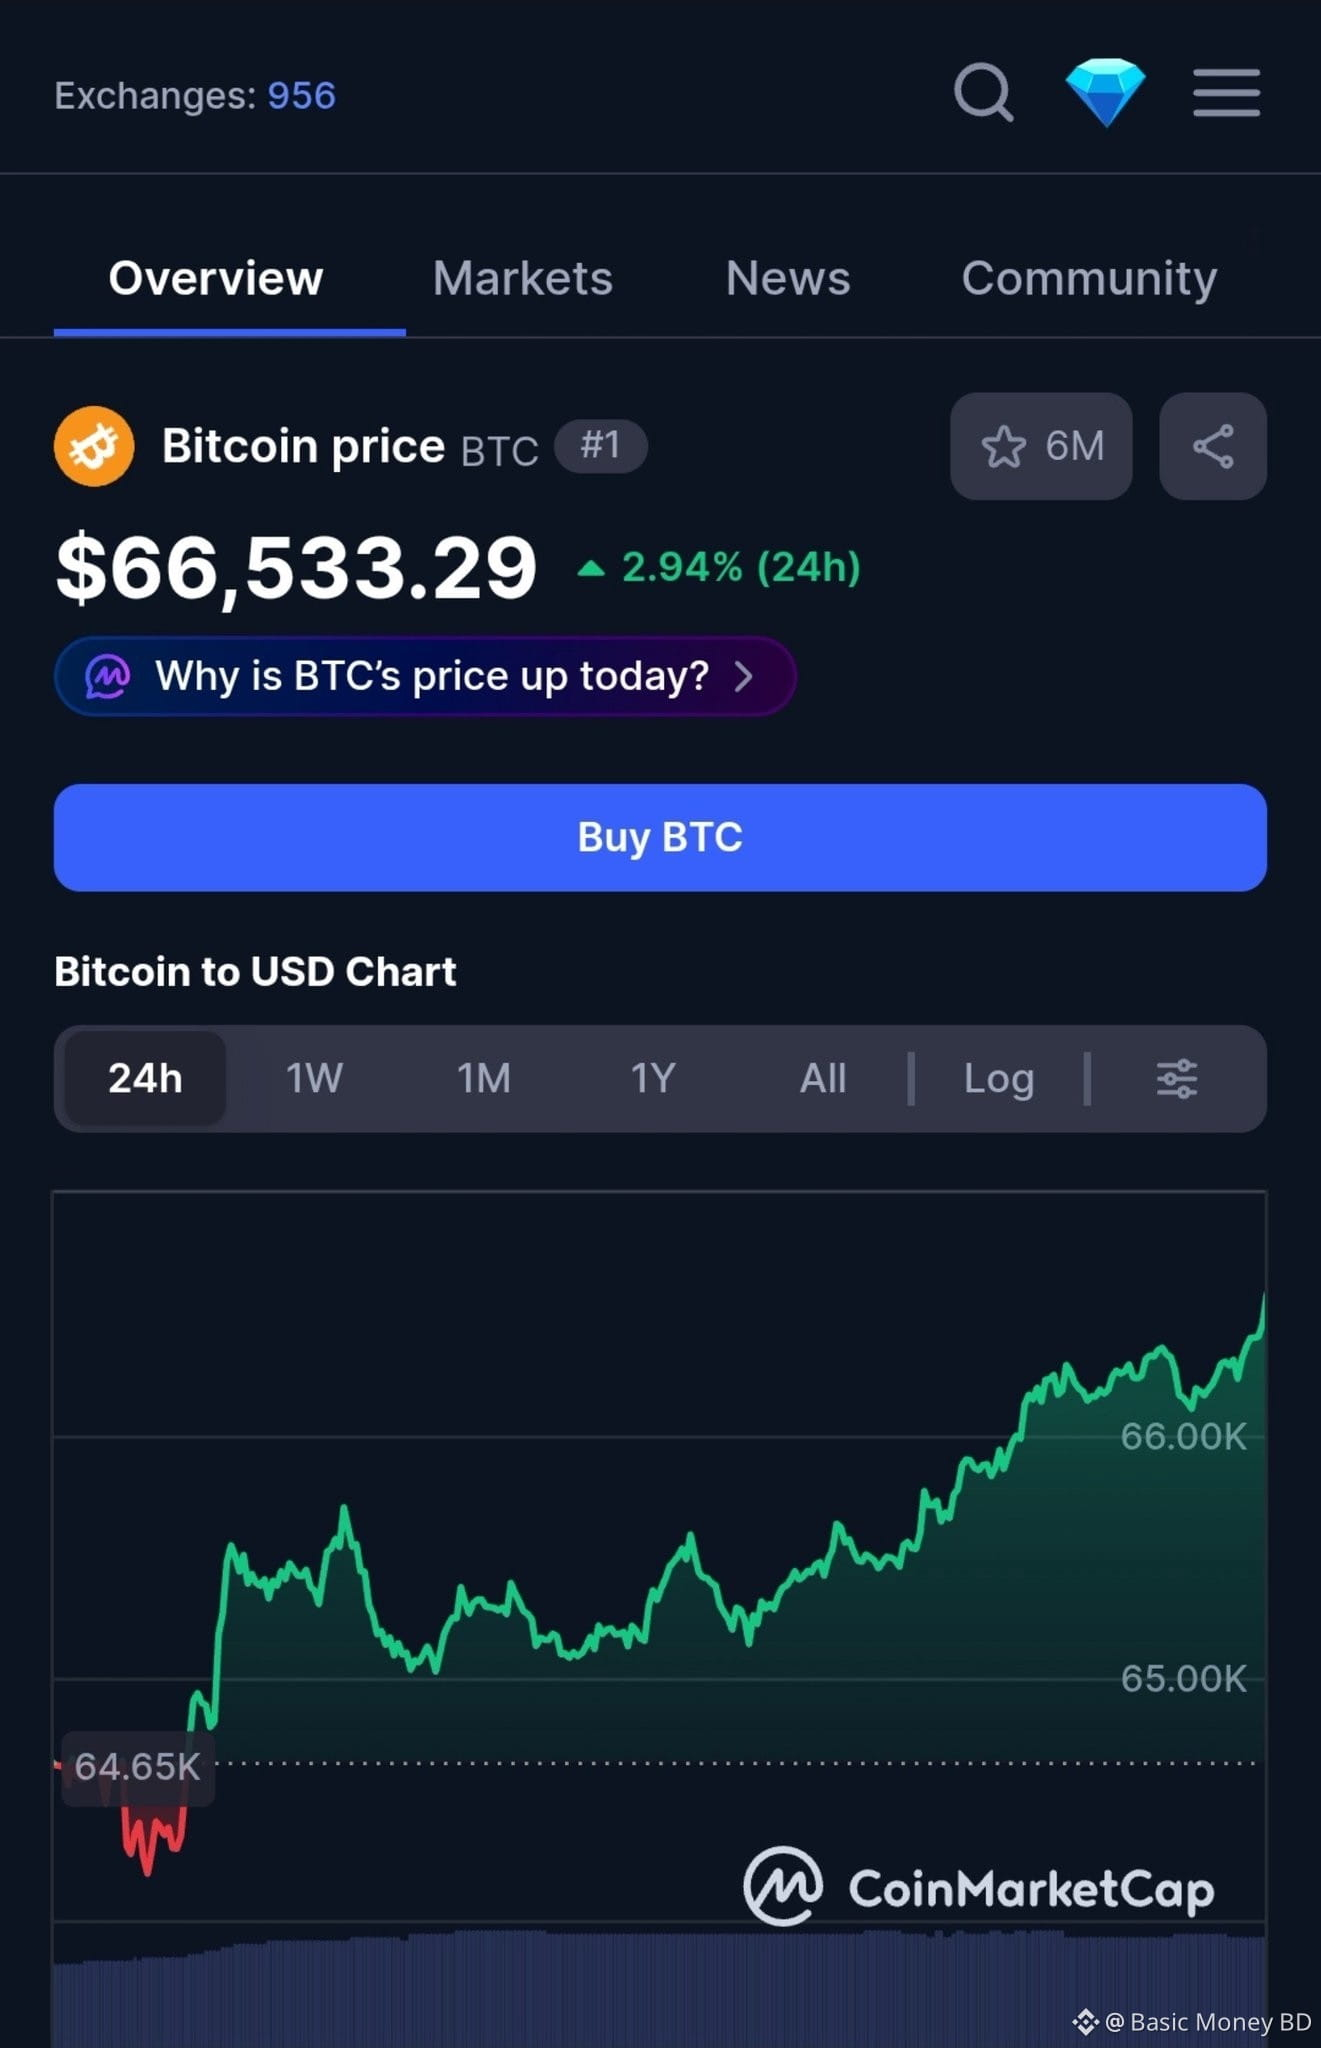
比特幣重新站上66,000美元,這是自6月以來首次出現,表明市場實力有所回升。
$BTC 目前交易價格約爲66,533美元,過去24小時上漲2.94%,此前一度觸及日內高點66,640美元。價格持續保持在關鍵移動均線之上,使短期趨勢仍偏看多。
動能正在增強,接下來的走勢可能爲整個市場接下來的表現定下基調。
{spot}(BTCUSDT)
比特幣重新站上66,000美元,這是自6月以來首次出現,表明市場實力有所回升。
$BTC 目前交易價格約爲66,533美元,過去24小時上漲2.94%,此前一度觸及日內高點66,640美元。價格持續保持在關鍵移動均線之上,使短期趨勢仍偏看多。
動能正在增強,接下來的走勢可能爲整個市場接下來的表現定下基調。
$BTC 目前交易價格約爲66,533美元,過去24小時上漲2.94%,此前一度觸及日內高點66,640美元。價格持續保持在關鍵移動均線之上,使短期趨勢仍偏看多。
動能正在增強,接下來的走勢可能爲整個市場接下來的表現定下基調。

Best of luck🥰
來自 Basic Money BD
3
10
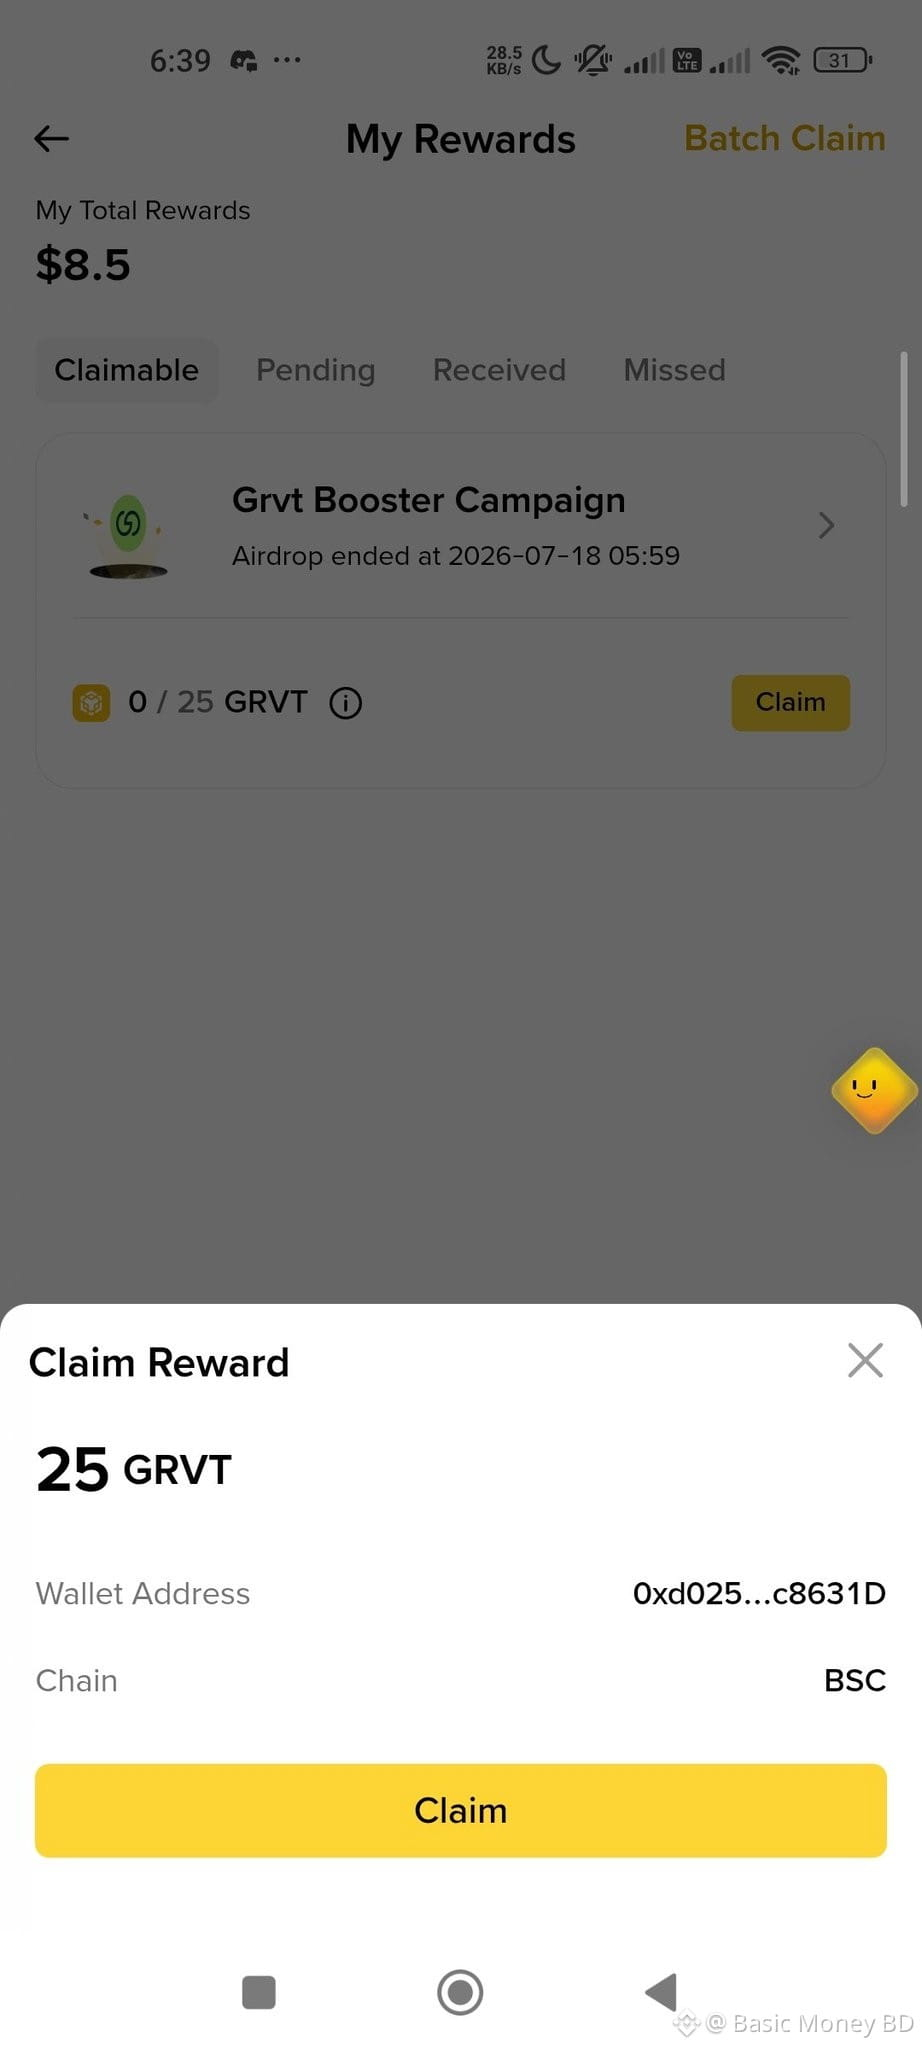
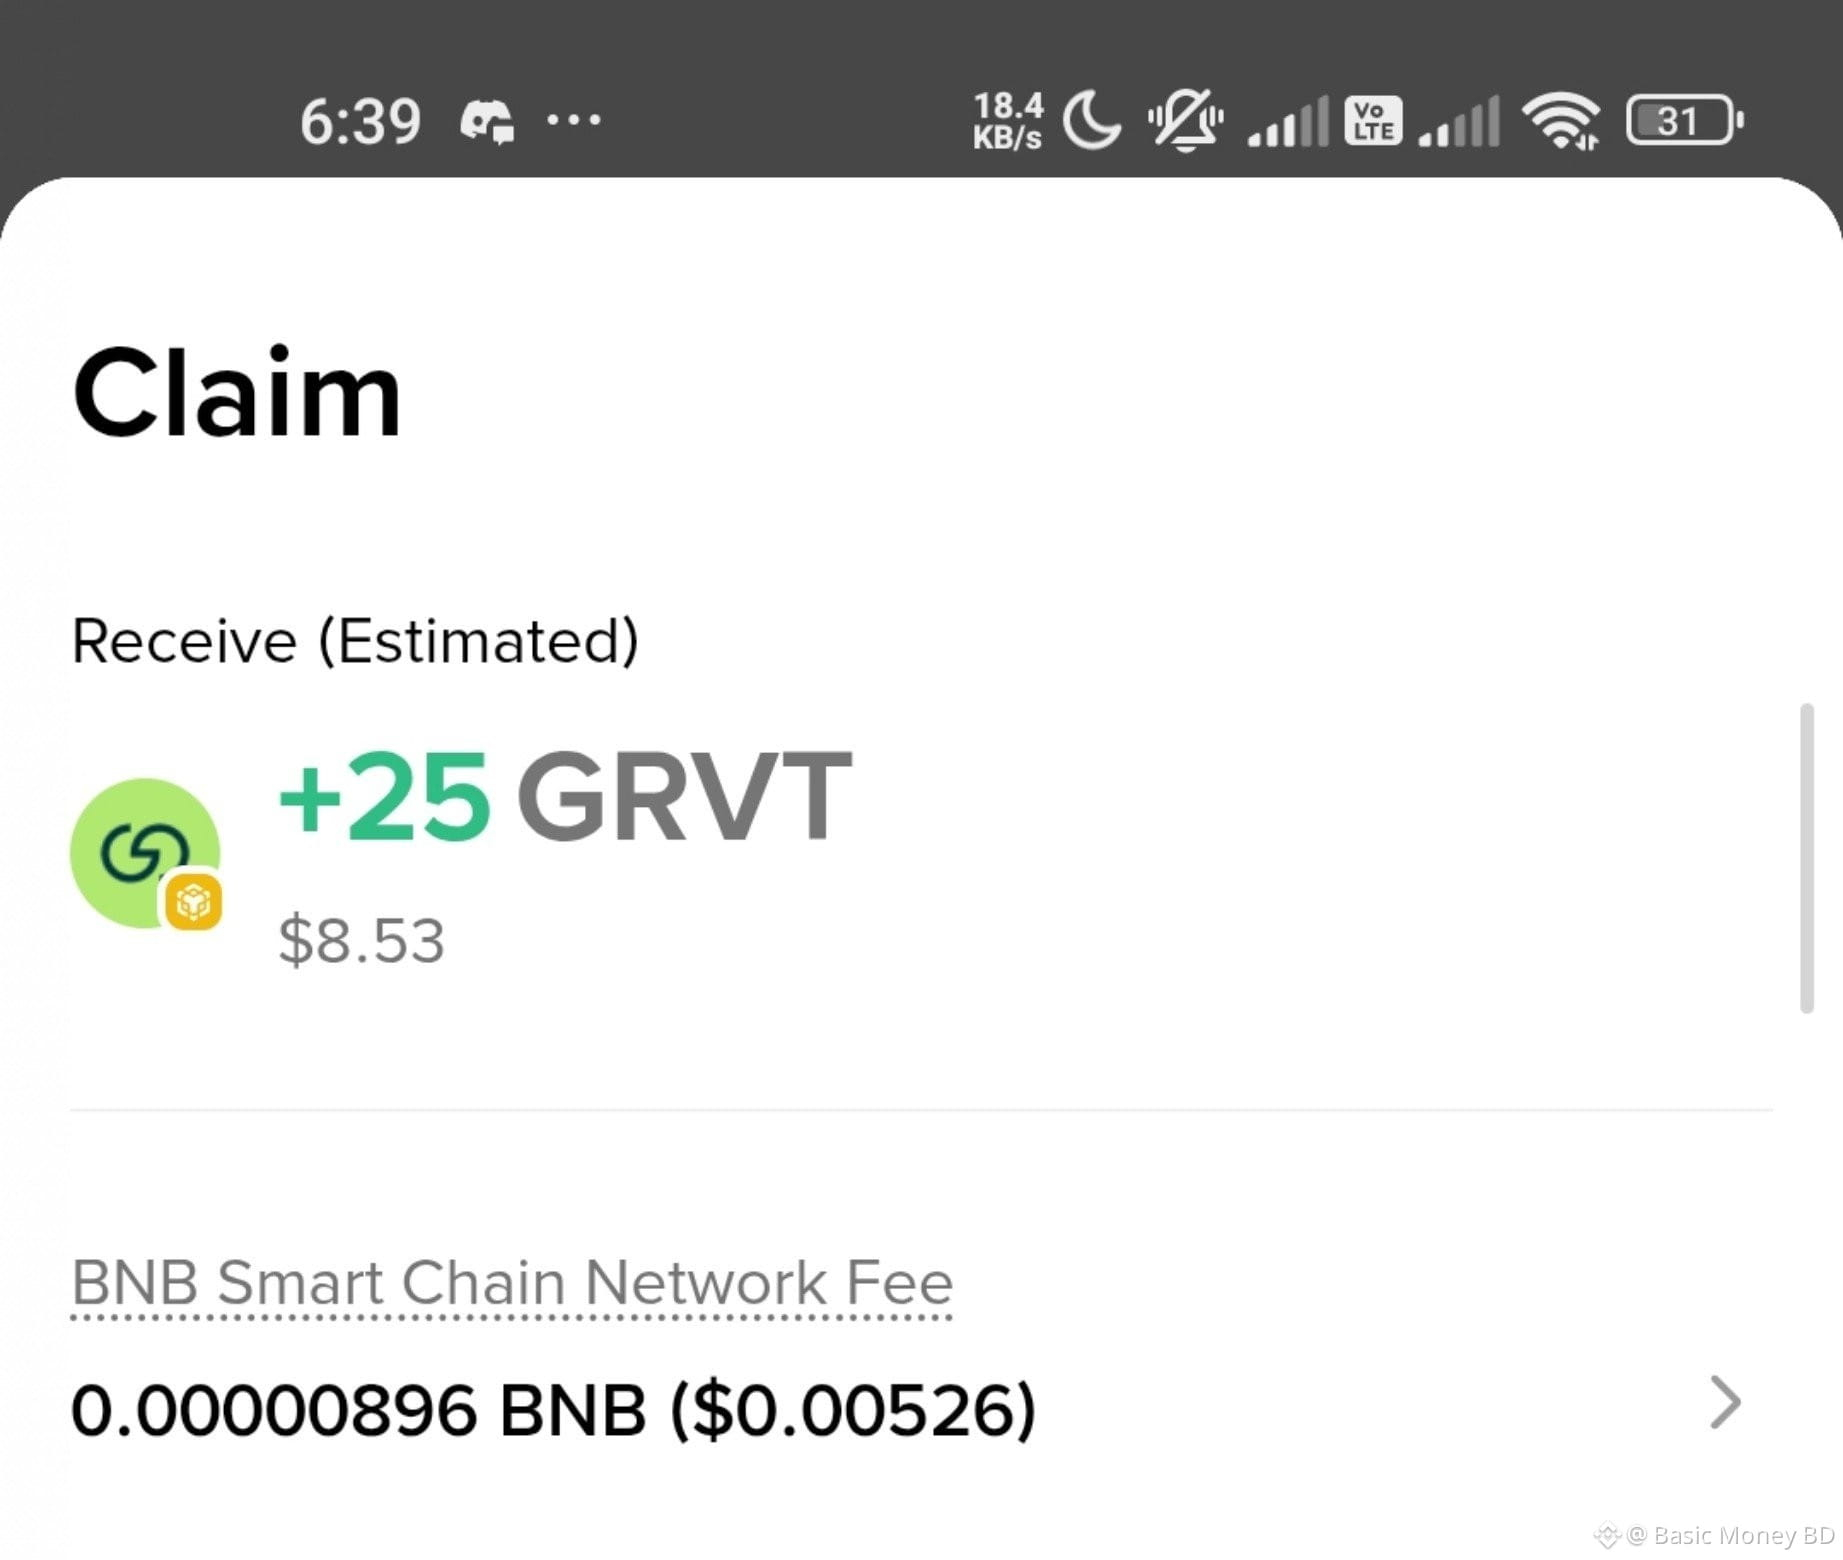
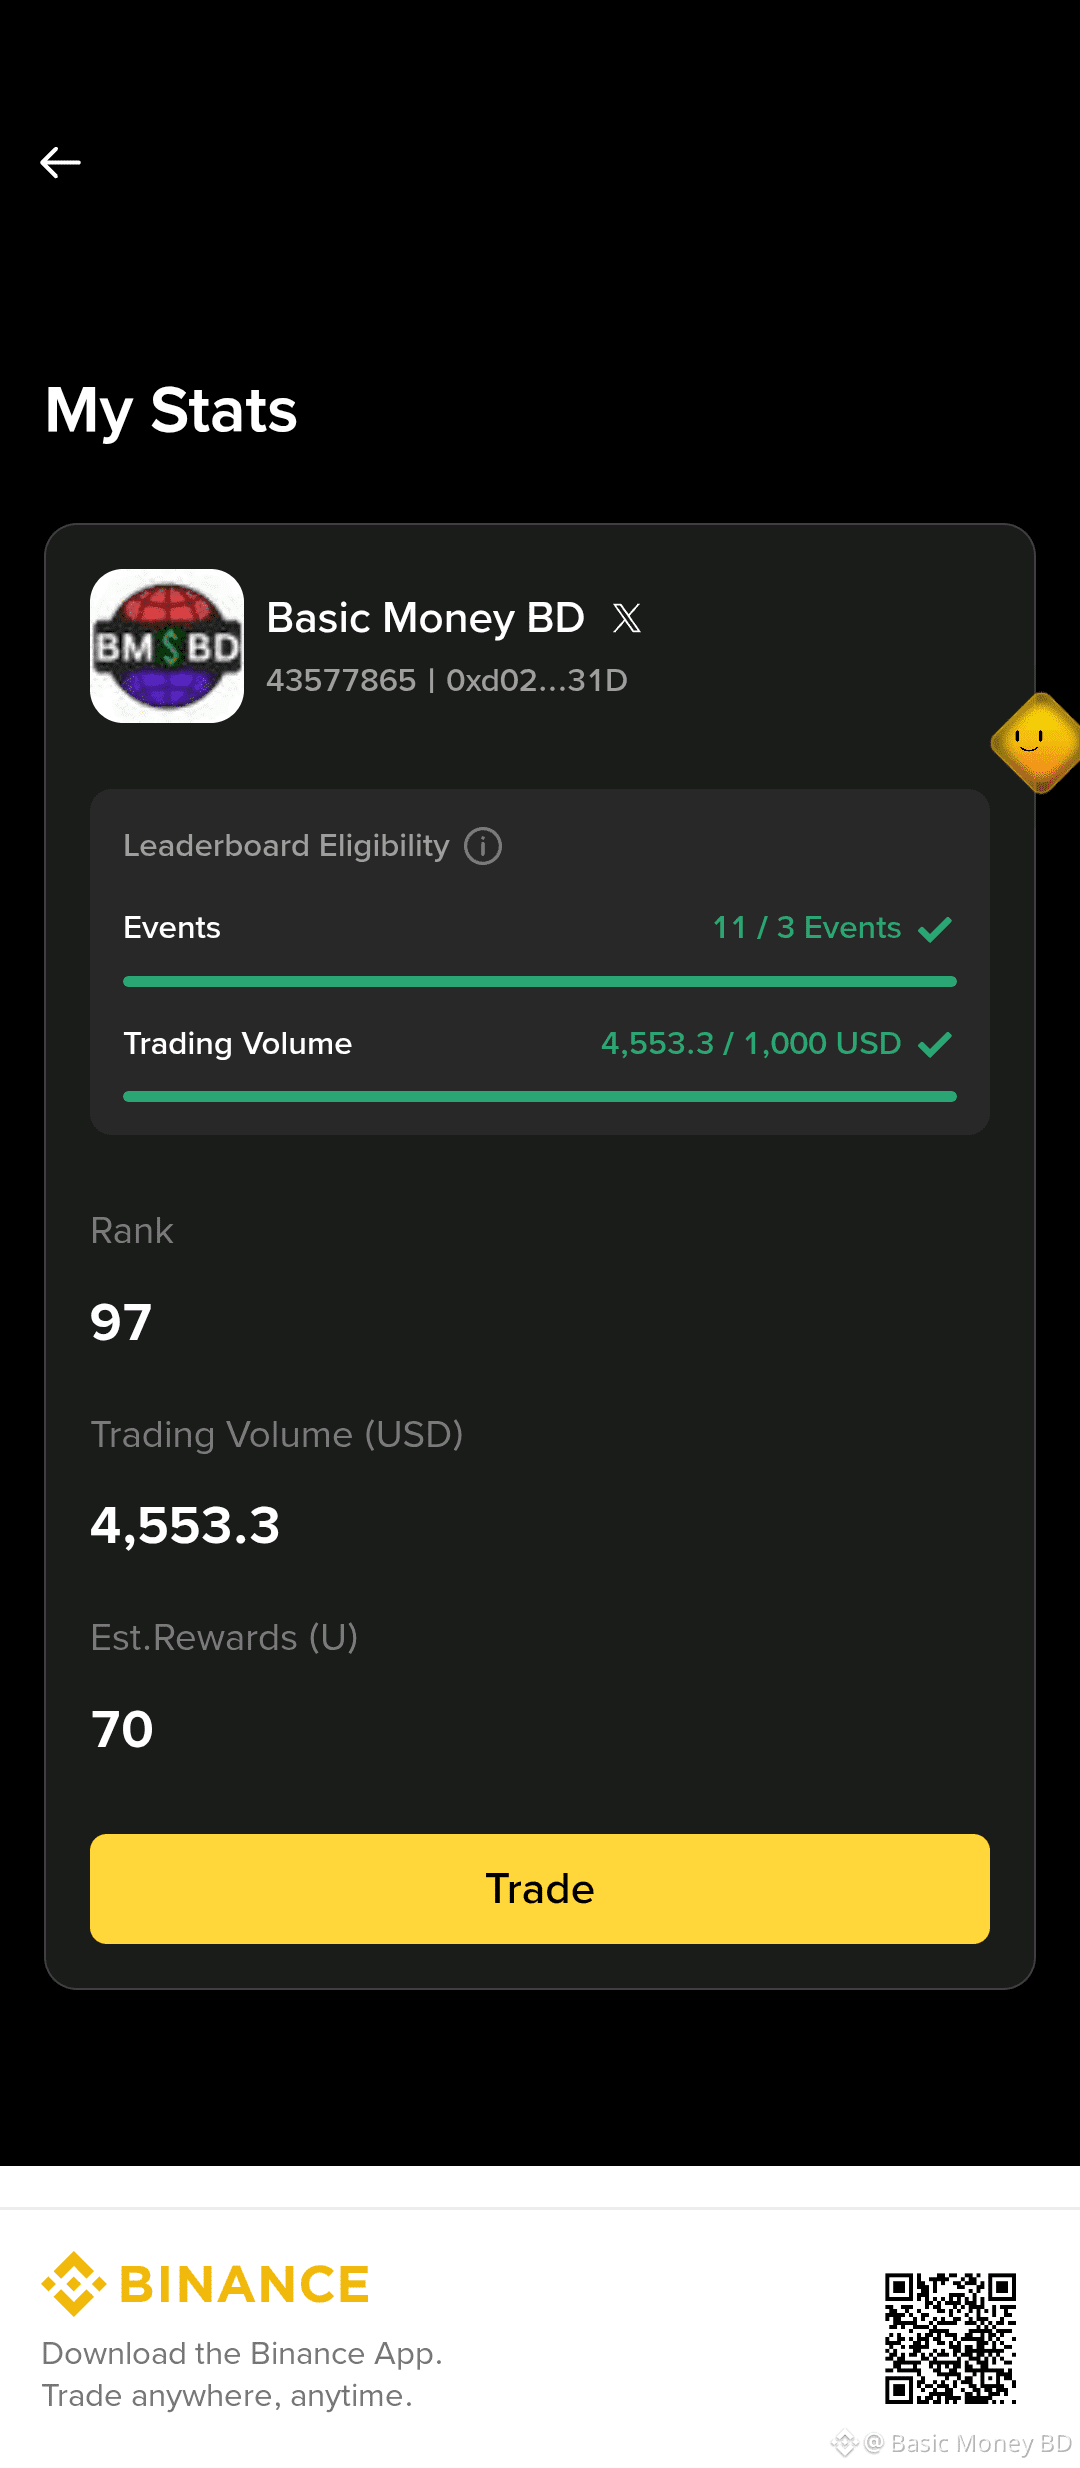
我從來沒見過任何交易所或錢包在活動結束後這麼快就發放獎勵。真的太厲害了。
謝謝你,Binance! 🥰
我從來沒見過任何交易所或錢包在活動結束後這麼快就發放獎勵。真的太厲害了。
謝謝你,Binance! 🥰
謝謝你,Binance! 🥰
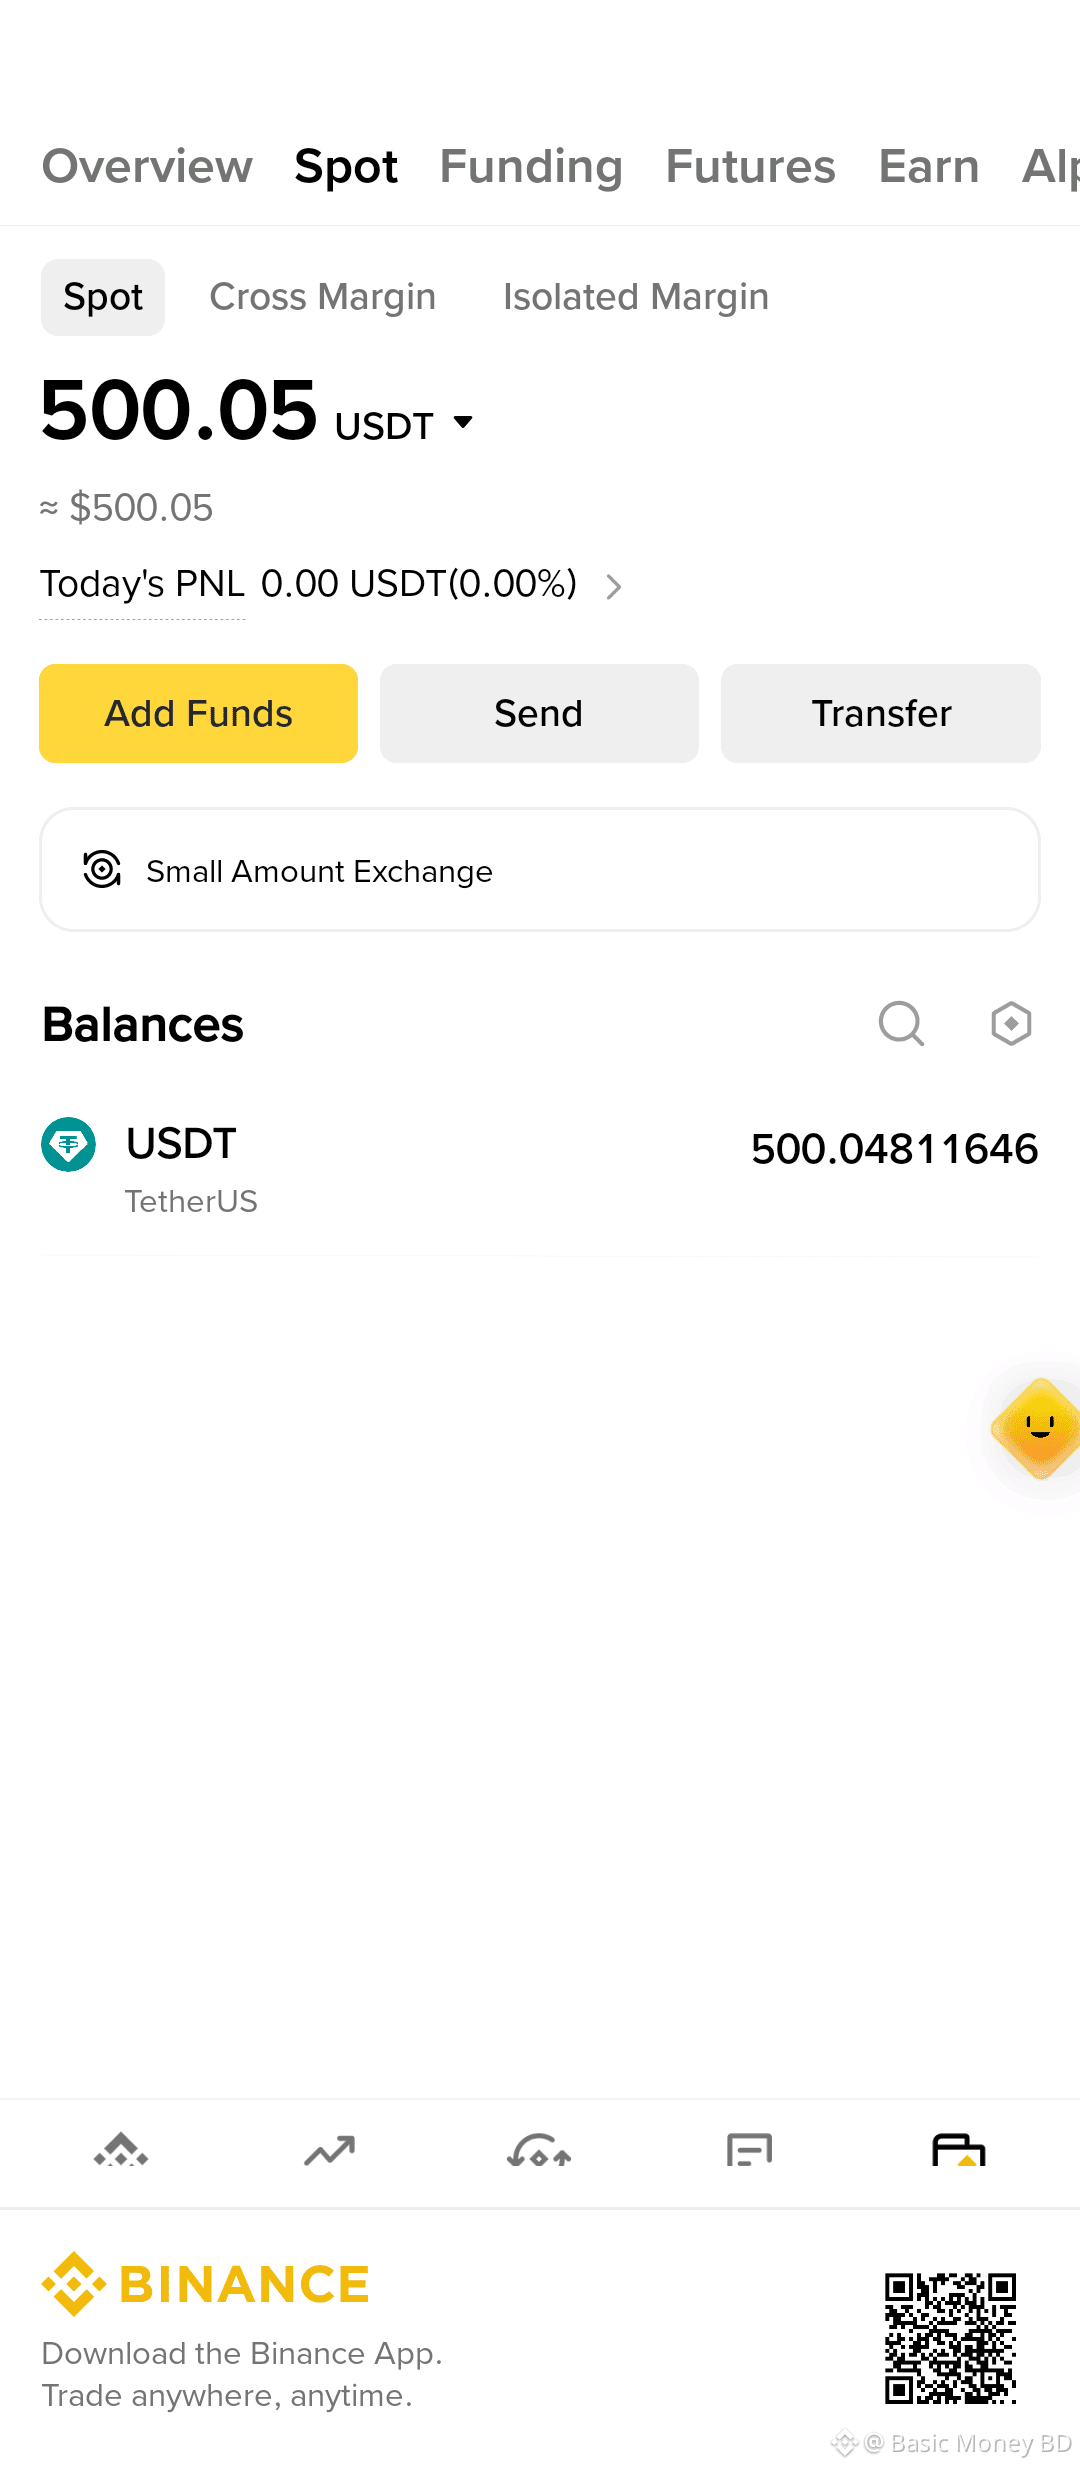
來自幣安 App 截圖分享
73
·
--
看漲
🎉 50美元抽獎活動!💸
我將把50美元送給一位幸運的獲獎者!
參與方式:
✅ 關注我的賬號
✅ 在下方評論:"如果你贏得這50美元,你會做什麼?"
我會從符合條件的參與者中隨機抽取一位獲獎者。
祝大家好運!🍀
$TRX
{spot}(TRXUSDT)
#Giveaway #crypto #Community #WinCash
🎉 50美元抽獎活動!💸
我將把50美元送給一位幸運的獲獎者!
參與方式:
✅ 關注我的賬號
✅ 在下方評論:"如果你贏得這50美元,你會做什麼?"
我會從符合條件的參與者中隨機抽取一位獲獎者。
祝大家好運!🍀
$TRX
#Giveaway #crypto #Community #WinCash
我將把50美元送給一位幸運的獲獎者!
參與方式:
✅ 關注我的賬號
✅ 在下方評論:"如果你贏得這50美元,你會做什麼?"
我會從符合條件的參與者中隨機抽取一位獲獎者。
祝大家好運!🍀
$TRX
#Giveaway #crypto #Community #WinCash
5
1
208
·
--
看跌
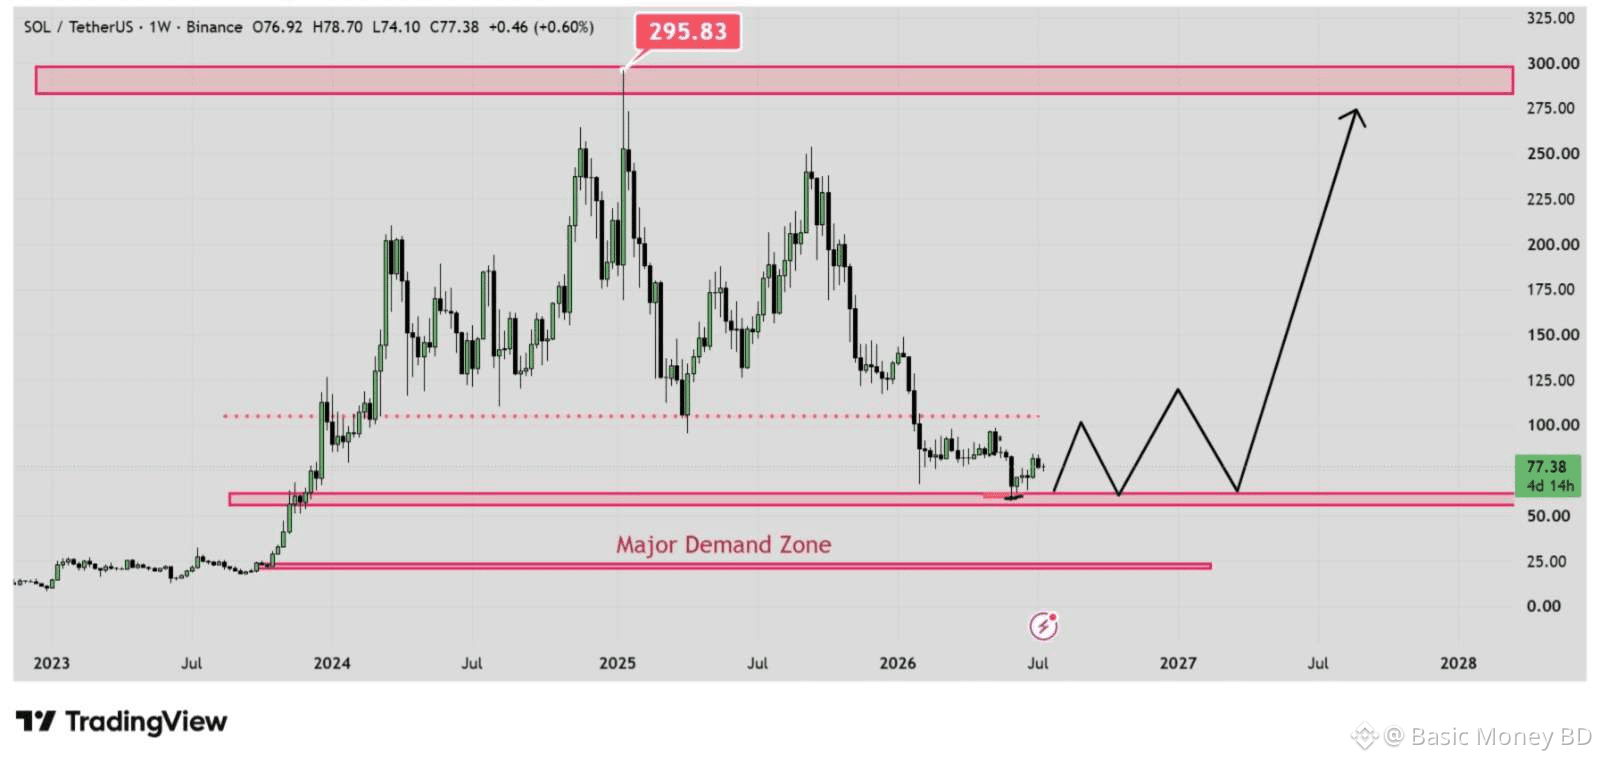
$SOL 在經歷了此前高點的長時間回調後,正在一個主要需求區內交易。買家正在捍衛該區域,這表明賣壓可能正在減弱,並且可能正在出現累積。
首要挑戰是重新奪回 $100-$120 的阻力區。如果成功向上突破這一區間,可能會確認看漲動能重新啓動,併爲更大幅度的上漲鋪平道路。
$SOL 在經歷了此前高點的長時間回調後,正在一個主要需求區內交易。買家正在捍衛該區域,這表明賣壓可能正在減弱,並且可能正在出現累積。
首要挑戰是重新奪回 $100-$120 的阻力區。如果成功向上突破這一區間,可能會確認看漲動能重新啓動,併爲更大幅度的上漲鋪平道路。
首要挑戰是重新奪回 $100-$120 的阻力區。如果成功向上突破這一區間,可能會確認看漲動能重新啓動,併爲更大幅度的上漲鋪平道路。
80
登入以探索更多內容
加入幣安廣場中的全球加密貨幣用戶
⚡️ 獲取加密貨幣的最新和實用資訊。
💬 受到全球最大加密貨幣交易所的信任。
👍 發掘來自經過驗證創作者的真實見解。
電子郵件 / 電話號碼