
asiftahsin
2.3k 貼文

asiftahsin
舉報
封鎖用戶
Share Crypto Related Market Analysis, Share Crypto Related knowledge for my follower(brother and Sister)
32 關注
335 粉絲
1.3K+ 點讚數
貼文
全部
引用
·
--
文章
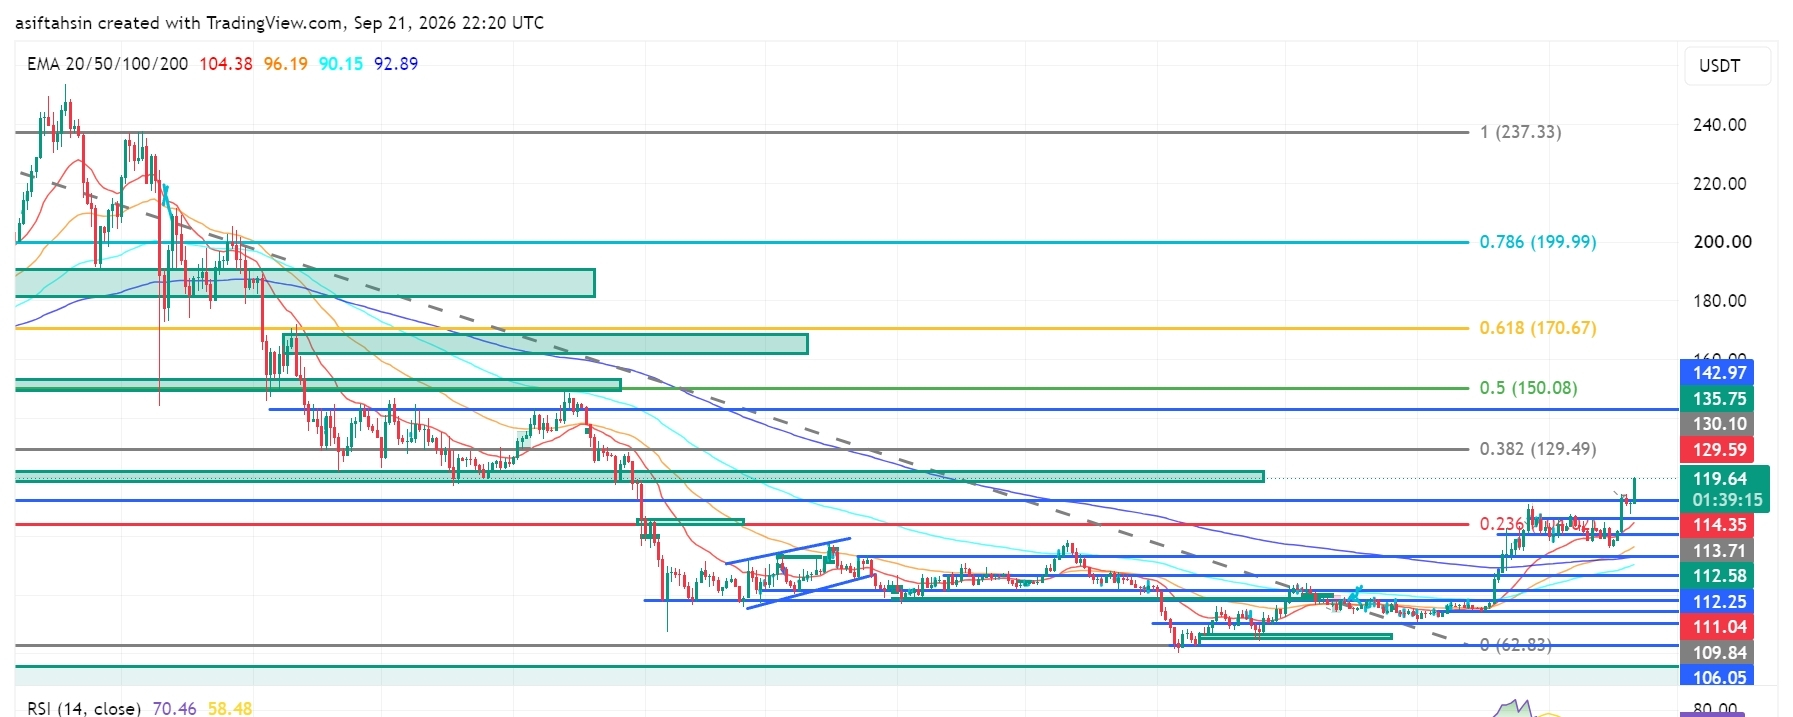
SOL技術展望:隨着突破結構增強,Solana衝向$120SOL目前交易在約$119.61,經過從$104–$110支撐區域的強勁反彈後,守得很好,高於$112–$114區域。
更大的結構已經顯著改善:SOL重新奪回$110–$114區域,並正在測試$119–$120阻力區。如果能在該區域上方實現持續突破,更高的斐波那契水平將再次回到關注焦點。
📈 EMA結構
20 EMA: $104.38
50 EMA: $96.19
100 EMA: $90.15
200 EMA: $92.89
SOL顯著高於四條主要均線(EMA)。
SOL技術展望:隨着突破結構增強,Solana衝向$120
SOL目前交易在約$119.61,經過從$104–$110支撐區域的強勁反彈後,守得很好,高於$112–$114區域。
更大的結構已經顯著改善:SOL重新奪回$110–$114區域,並正在測試$119–$120阻力區。如果能在該區域上方實現持續突破,更高的斐波那契水平將再次回到關注焦點。
📈 EMA結構
20 EMA: $104.38
50 EMA: $96.19
100 EMA: $90.15
200 EMA: $92.89
SOL顯著高於四條主要均線(EMA)。
更大的結構已經顯著改善:SOL重新奪回$110–$114區域,並正在測試$119–$120阻力區。如果能在該區域上方實現持續突破,更高的斐波那契水平將再次回到關注焦點。
📈 EMA結構
20 EMA: $104.38
50 EMA: $96.19
100 EMA: $90.15
200 EMA: $92.89
SOL顯著高於四條主要均線(EMA)。
35
·
--
文章
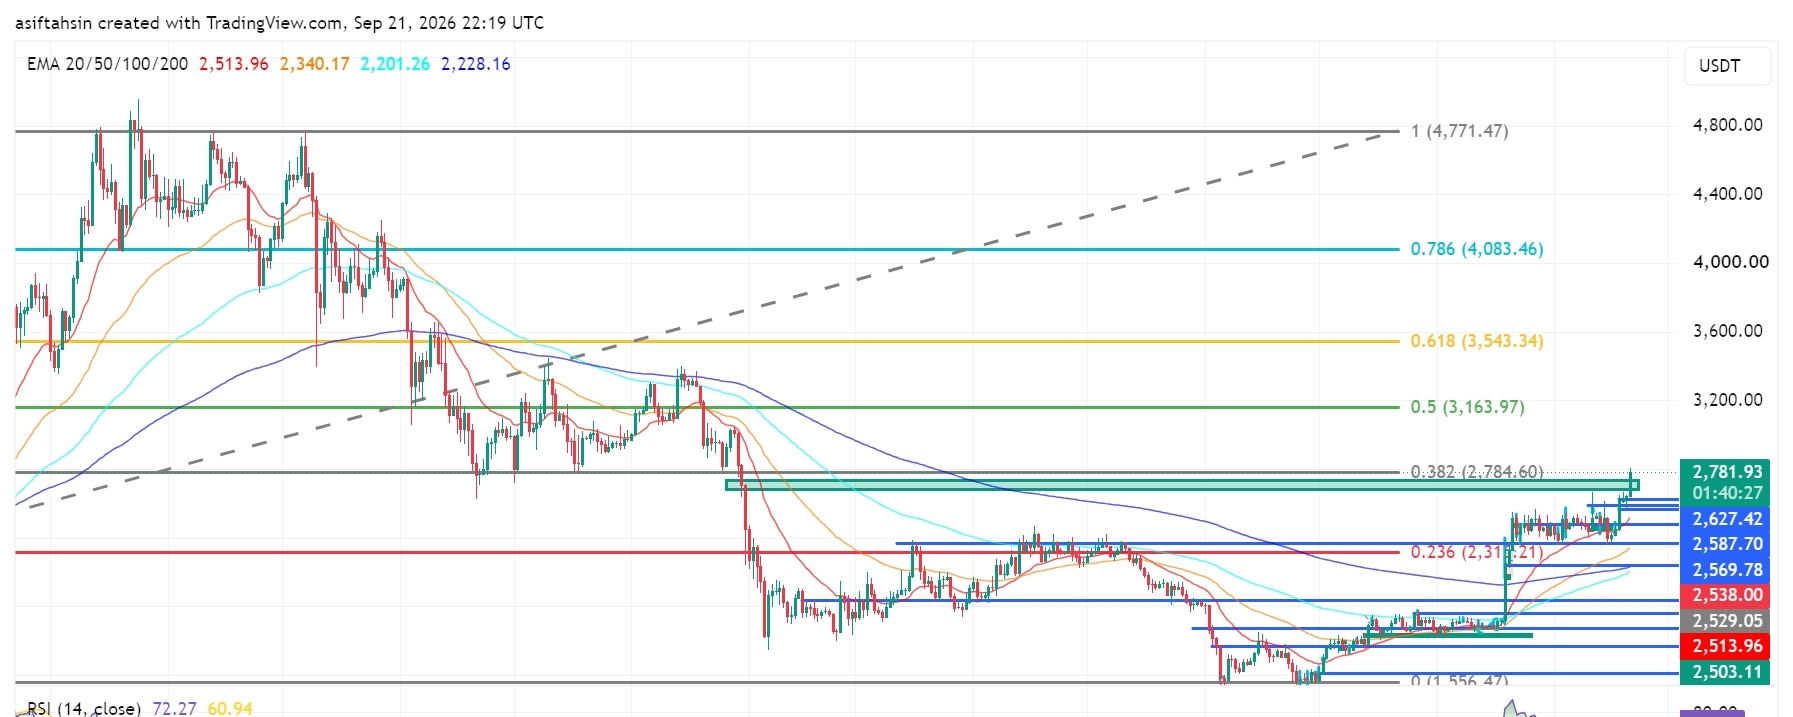
ETH技術展望:以太坊重回2.78K,突破結構走強ETH目前交易在約$2,781.93附近,在從$2,475–$2,500區域強勁反彈後,正逼近關鍵的$2,784.60斐波那契阻力位。
更大的結構已經顯著改善,ETH重新奪回$2,500–$2,600區域,並突破了先前的震盪區間。若能持續突破$2,784.60,將把更高的斐波那契水平帶入視野。
📈 EMA結構
20日均線:$2,513.96
50日均線:$2,340.17
100日均線:$2,201.26
200日均線:$2,228.16
ETH正在遠高於四條主要EMA
ETH技術展望:以太坊重回2.78K,突破結構走強
ETH目前交易在約$2,781.93附近,在從$2,475–$2,500區域強勁反彈後,正逼近關鍵的$2,784.60斐波那契阻力位。
更大的結構已經顯著改善,ETH重新奪回$2,500–$2,600區域,並突破了先前的震盪區間。若能持續突破$2,784.60,將把更高的斐波那契水平帶入視野。
📈 EMA結構
20日均線:$2,513.96
50日均線:$2,340.17
100日均線:$2,201.26
200日均線:$2,228.16
ETH正在遠高於四條主要EMA
更大的結構已經顯著改善,ETH重新奪回$2,500–$2,600區域,並突破了先前的震盪區間。若能持續突破$2,784.60,將把更高的斐波那契水平帶入視野。
📈 EMA結構
20日均線:$2,513.96
50日均線:$2,340.17
100日均線:$2,201.26
200日均線:$2,228.16
ETH正在遠高於四條主要EMA
58
·
--
文章
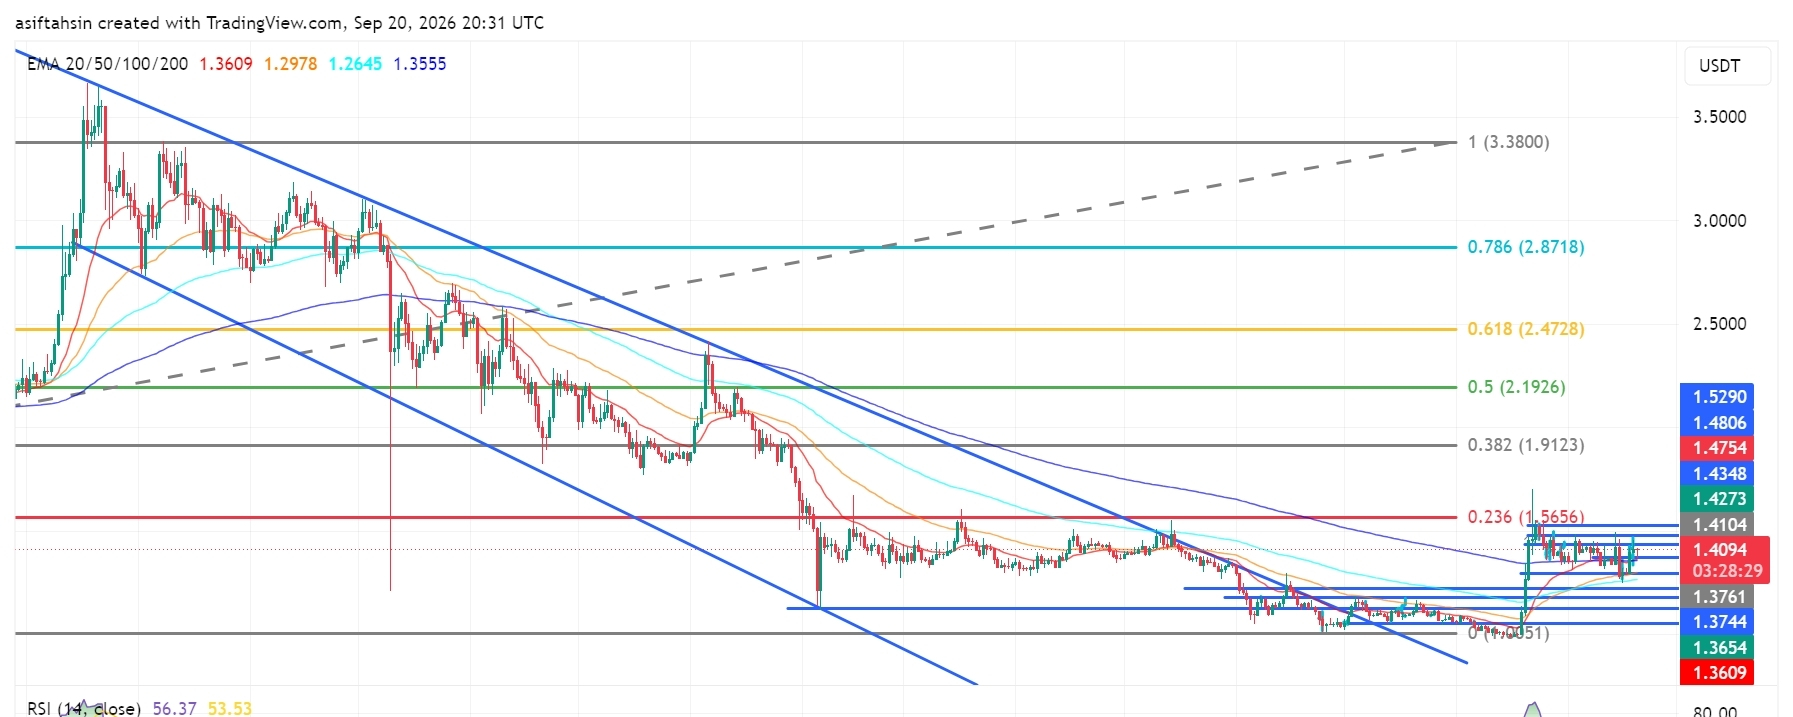
XRP技術展望:XRP守住1.40美元上方,復甦結構正在增強XRP技術展望:XRP守住1.40美元上方,復甦結構正在增強
目前,XRP的交易價格約爲1.41美元。在從1.25–1.30美元支撐區域近期反彈之後,價格守在1.37–1.40美元區間之上。
整體結構已經改善,價格重新站回1.40美元區域,並再次接近主要的1.41–1.48美元阻力區。如果該區域出現持續性突破,就會讓更高的斐波那契水平重新回到關注焦點。
近期市場評論也指出,1.40美元區域是一個重要的阻力/回收(轉爲支撐)位,不過短期動能在該區域附近仍然較爲敏感。
XRP技術展望:XRP守住1.40美元上方,復甦結構正在增強
XRP技術展望:XRP守住1.40美元上方,復甦結構正在增強
目前,XRP的交易價格約爲1.41美元。在從1.25–1.30美元支撐區域近期反彈之後,價格守在1.37–1.40美元區間之上。
整體結構已經改善,價格重新站回1.40美元區域,並再次接近主要的1.41–1.48美元阻力區。如果該區域出現持續性突破,就會讓更高的斐波那契水平重新回到關注焦點。
近期市場評論也指出,1.40美元區域是一個重要的阻力/回收(轉爲支撐)位,不過短期動能在該區域附近仍然較爲敏感。
目前,XRP的交易價格約爲1.41美元。在從1.25–1.30美元支撐區域近期反彈之後,價格守在1.37–1.40美元區間之上。
整體結構已經改善,價格重新站回1.40美元區域,並再次接近主要的1.41–1.48美元阻力區。如果該區域出現持續性突破,就會讓更高的斐波那契水平重新回到關注焦點。
近期市場評論也指出,1.40美元區域是一個重要的阻力/回收(轉爲支撐)位,不過短期動能在該區域附近仍然較爲敏感。
2
1.2k
·
--
文章
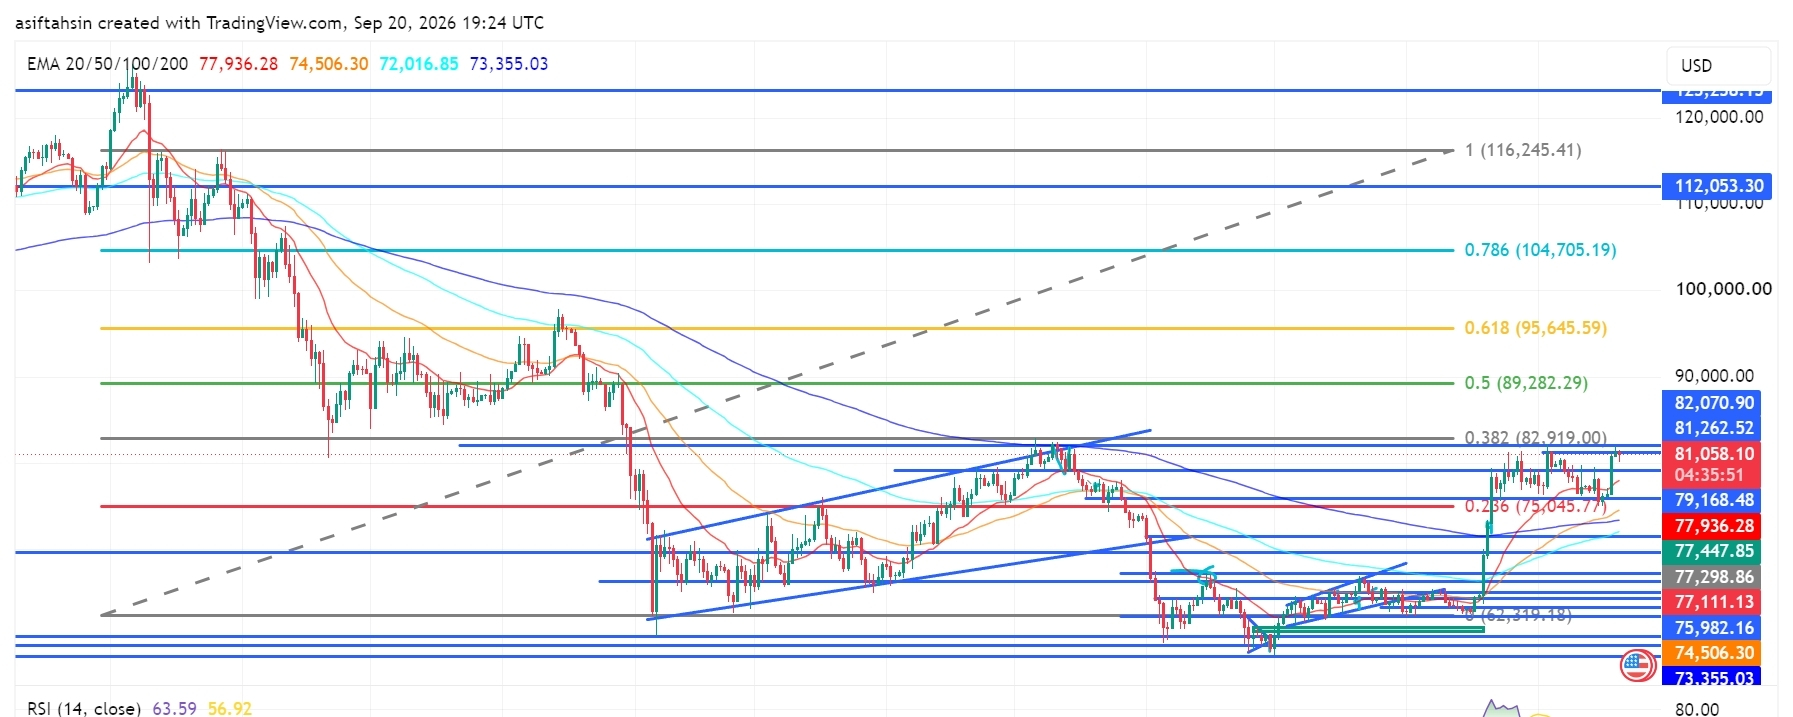
BTC技術展望:比特幣重新站上$81K,復甦結構走強BTC目前交易在約$81,058附近,在近期從$72K–$75K支撐區域反彈後,仍守在$79K–$80K區間之上。
整體結構已得到改善:價格重新站回$80K區域,並回到主要$81.26K–$82.92K阻力區附近。若能在該區域形成持續突破,將使更高的斐波那契水平重新回到關注焦點。
📈 EMA結構
20 EMA:$77,936.12
50 EMA:$74,506.24
100 EMA:$72,016.82
200 EMA:$73,355.02
BTC目前正在顯著高於20 EMA,交易價格爲$77,936。
BTC技術展望:比特幣重新站上$81K,復甦結構走強
BTC目前交易在約$81,058附近,在近期從$72K–$75K支撐區域反彈後,仍守在$79K–$80K區間之上。
整體結構已得到改善:價格重新站回$80K區域,並回到主要$81.26K–$82.92K阻力區附近。若能在該區域形成持續突破,將使更高的斐波那契水平重新回到關注焦點。
📈 EMA結構
20 EMA:$77,936.12
50 EMA:$74,506.24
100 EMA:$72,016.82
200 EMA:$73,355.02
BTC目前正在顯著高於20 EMA,交易價格爲$77,936。
整體結構已得到改善:價格重新站回$80K區域,並回到主要$81.26K–$82.92K阻力區附近。若能在該區域形成持續突破,將使更高的斐波那契水平重新回到關注焦點。
📈 EMA結構
20 EMA:$77,936.12
50 EMA:$74,506.24
100 EMA:$72,016.82
200 EMA:$73,355.02
BTC目前正在顯著高於20 EMA,交易價格爲$77,936。
43
·
--
文章
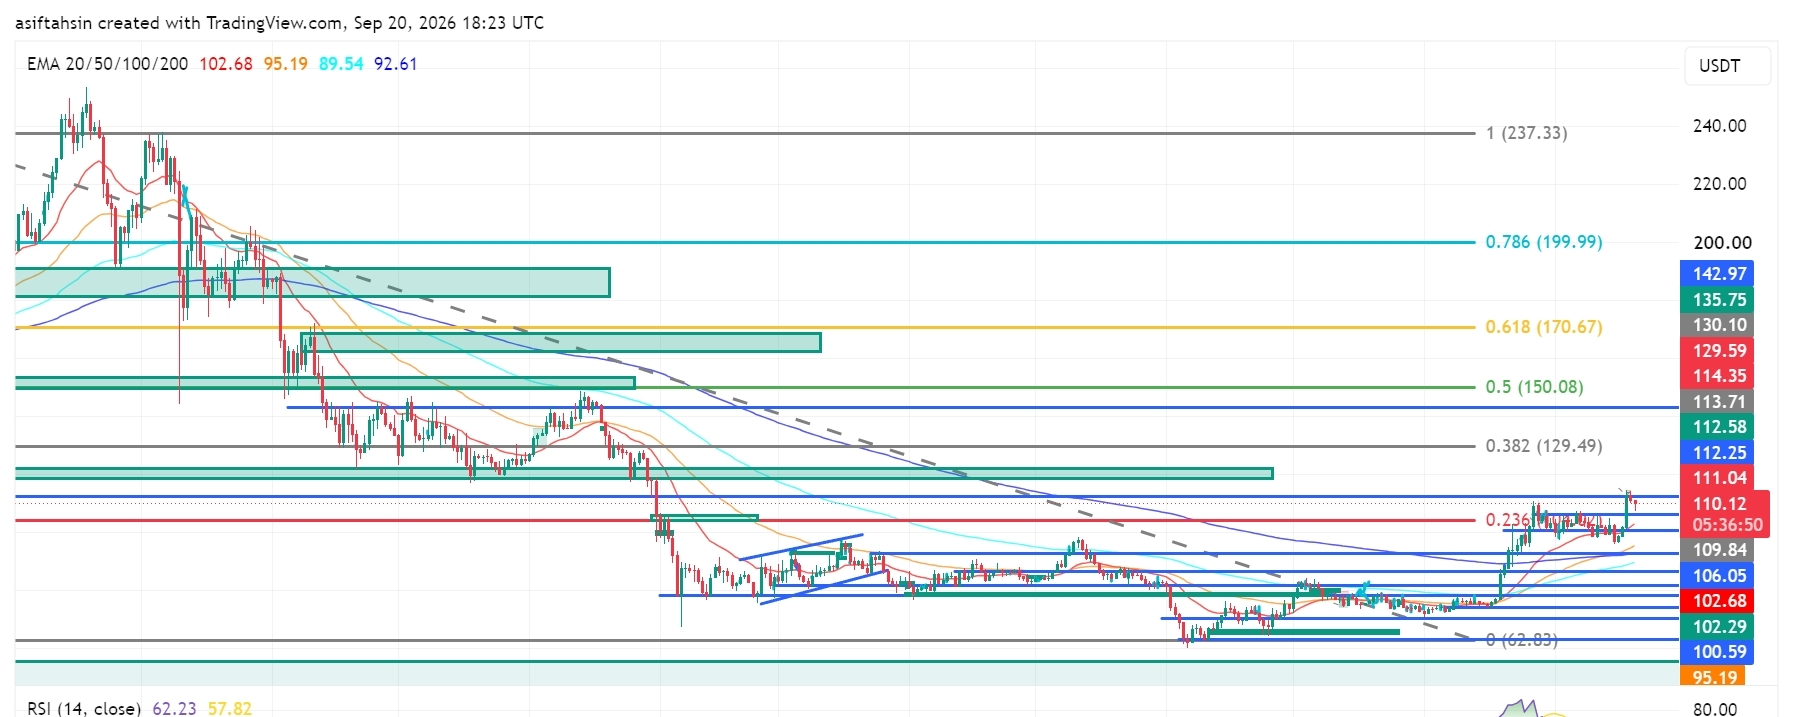
SOL技術展望:Solana重回$110,反彈結構走強SOL目前大約在$110.1附近運行。在近期從$92–$100支撐區域反彈之後,價格仍守在$106–$109區間之上。
整體結構已改善:價格重新站回$100關口,並回到主要$111–$114阻力區附近。若能在該區域形成持續上破,將使更高的斐波那契關鍵位重新回到關注焦點。
📈 EMA結構
20 EMA:$102.68
50 EMA:$95.19
100 EMA:$89.54
200 EMA:$92.61
SOL目前正處於遠高於20 EMA的交易區間,價格爲$102.68。
在收復50 EMA($95.19)、100 EMA($89.54)以及200 EMA($92.61)之後的反彈,令更廣泛的反彈結構保持良性。
SOL技術展望:Solana重回$110,反彈結構走強
SOL目前大約在$110.1附近運行。在近期從$92–$100支撐區域反彈之後,價格仍守在$106–$109區間之上。
整體結構已改善:價格重新站回$100關口,並回到主要$111–$114阻力區附近。若能在該區域形成持續上破,將使更高的斐波那契關鍵位重新回到關注焦點。
📈 EMA結構
20 EMA:$102.68
50 EMA:$95.19
100 EMA:$89.54
200 EMA:$92.61
SOL目前正處於遠高於20 EMA的交易區間,價格爲$102.68。
在收復50 EMA($95.19)、100 EMA($89.54)以及200 EMA($92.61)之後的反彈,令更廣泛的反彈結構保持良性。
整體結構已改善:價格重新站回$100關口,並回到主要$111–$114阻力區附近。若能在該區域形成持續上破,將使更高的斐波那契關鍵位重新回到關注焦點。
📈 EMA結構
20 EMA:$102.68
50 EMA:$95.19
100 EMA:$89.54
200 EMA:$92.61
SOL目前正處於遠高於20 EMA的交易區間,價格爲$102.68。
在收復50 EMA($95.19)、100 EMA($89.54)以及200 EMA($92.61)之後的反彈,令更廣泛的反彈結構保持良性。
1.1k
·
--
文章
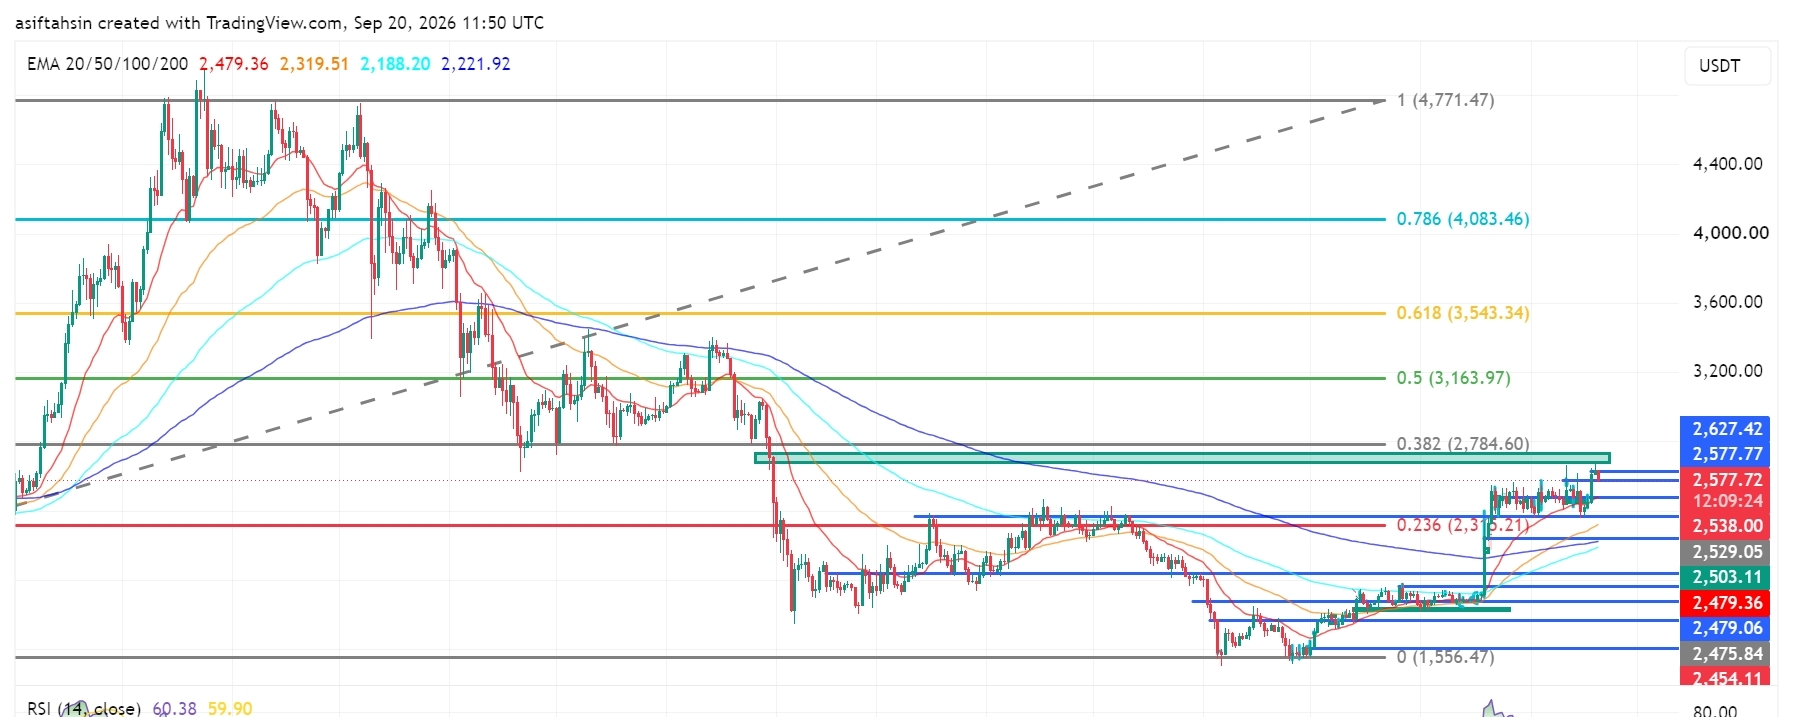
ETH 技術展望:以太坊在反彈持續的背景下維持在 $2.58K 附近ETH 目前交易在約 $2,577 附近,在從 $2,280–$2,360 需求區近期反彈後,仍保持在 $2,500–$2,540 支撐區域之上。
更廣泛的反彈結構仍然保持建設性,價格目前正在接近重要的 $2,627–$2,785 阻力區。$2,784.60 這一水平是圖表上的關鍵 0.382 斐波那契參考位。
📈 EMA 結構
20 EMA: $2,479.36
50 EMA: $2,319.51
100 EMA: $2,188.20
200 EMA: $2,221.92
ETH 目前運行在 20 EMA($2,479.36)之上,表現良好。
在 $2,319.51(50 EMA)、$2,188.20(100 EMA)以及 $2,221.92(200 EMA)之上完成反彈,使更廣泛的反彈結構保持建設性。
ETH 技術展望:以太坊在反彈持續的背景下維持在 $2.58K 附近
ETH 目前交易在約 $2,577 附近,在從 $2,280–$2,360 需求區近期反彈後,仍保持在 $2,500–$2,540 支撐區域之上。
更廣泛的反彈結構仍然保持建設性,價格目前正在接近重要的 $2,627–$2,785 阻力區。$2,784.60 這一水平是圖表上的關鍵 0.382 斐波那契參考位。
📈 EMA 結構
20 EMA: $2,479.36
50 EMA: $2,319.51
100 EMA: $2,188.20
200 EMA: $2,221.92
ETH 目前運行在 20 EMA($2,479.36)之上,表現良好。
在 $2,319.51(50 EMA)、$2,188.20(100 EMA)以及 $2,221.92(200 EMA)之上完成反彈,使更廣泛的反彈結構保持建設性。
更廣泛的反彈結構仍然保持建設性,價格目前正在接近重要的 $2,627–$2,785 阻力區。$2,784.60 這一水平是圖表上的關鍵 0.382 斐波那契參考位。
📈 EMA 結構
20 EMA: $2,479.36
50 EMA: $2,319.51
100 EMA: $2,188.20
200 EMA: $2,221.92
ETH 目前運行在 20 EMA($2,479.36)之上,表現良好。
在 $2,319.51(50 EMA)、$2,188.20(100 EMA)以及 $2,221.92(200 EMA)之上完成反彈,使更廣泛的反彈結構保持建設性。
65
·
--
文章
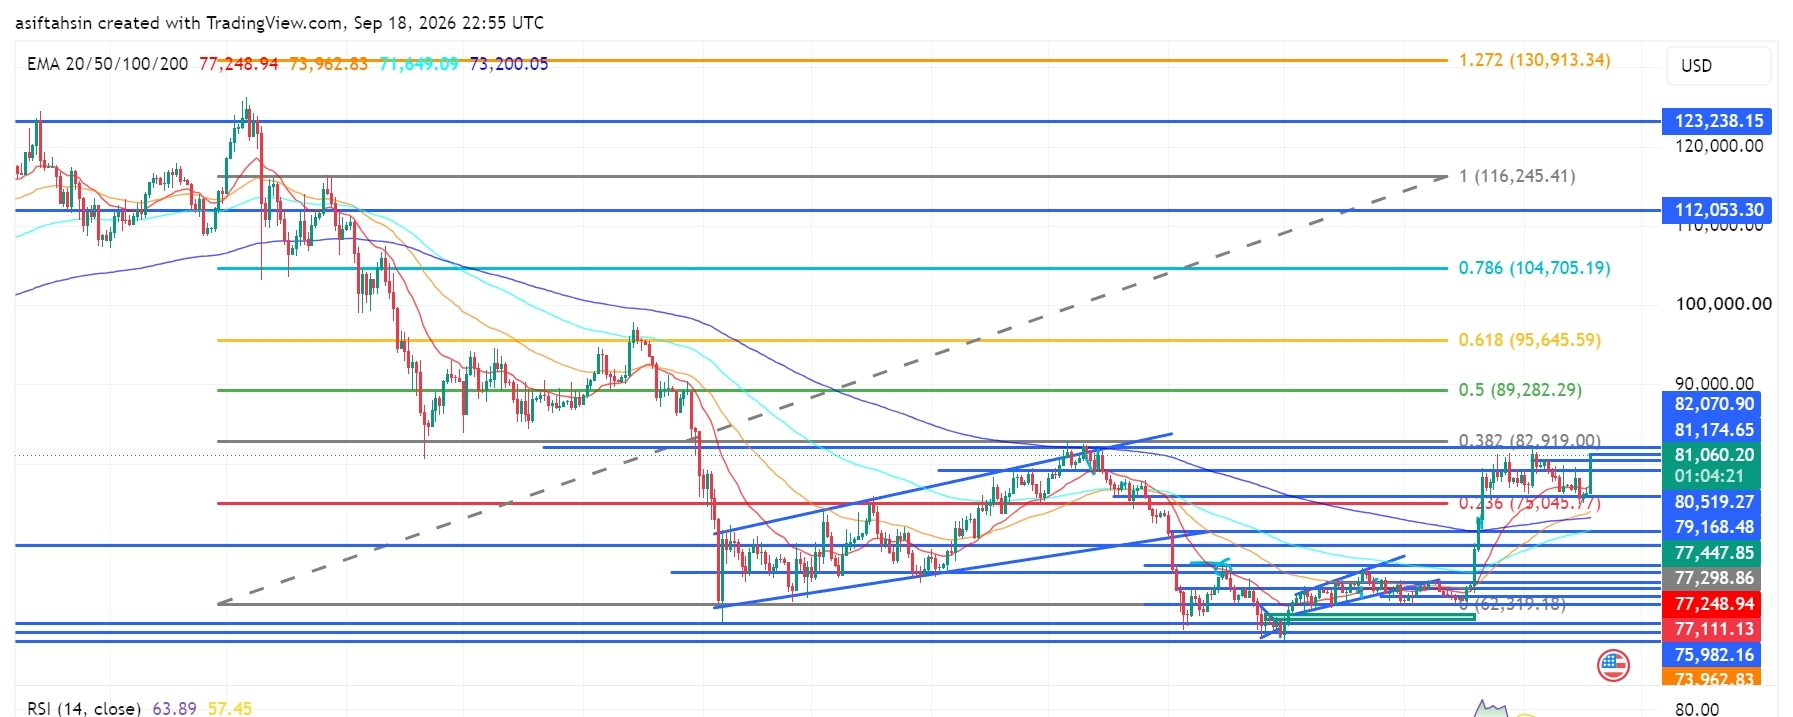
BTC技術展望:比特幣重新站上81K,復甦結構走強BTC目前交易在約$81,060附近,在從$73,000–$76,000需求區近期反彈之後,仍站穩在$79,000–$80,000區域之上。
整體結構有所改善:價格重新收回80K美元區域,並重新接近主要的$82,070–$82,919阻力區。如果能在該區域內持續上破,將使更高的斐波那契水平重新回到關注焦點。
📈 EMA結構
20 EMA:$77,248.95
50 EMA:$73,962.83
100 EMA:$71,649.09
200 EMA:$73,200.05
BTC目前交易價格明顯高於20 EMA($77,248.95)。
BTC技術展望:比特幣重新站上81K,復甦結構走強
BTC目前交易在約$81,060附近,在從$73,000–$76,000需求區近期反彈之後,仍站穩在$79,000–$80,000區域之上。
整體結構有所改善:價格重新收回80K美元區域,並重新接近主要的$82,070–$82,919阻力區。如果能在該區域內持續上破,將使更高的斐波那契水平重新回到關注焦點。
📈 EMA結構
20 EMA:$77,248.95
50 EMA:$73,962.83
100 EMA:$71,649.09
200 EMA:$73,200.05
BTC目前交易價格明顯高於20 EMA($77,248.95)。
整體結構有所改善:價格重新收回80K美元區域,並重新接近主要的$82,070–$82,919阻力區。如果能在該區域內持續上破,將使更高的斐波那契水平重新回到關注焦點。
📈 EMA結構
20 EMA:$77,248.95
50 EMA:$73,962.83
100 EMA:$71,649.09
200 EMA:$73,200.05
BTC目前交易價格明顯高於20 EMA($77,248.95)。
12
·
--
文章
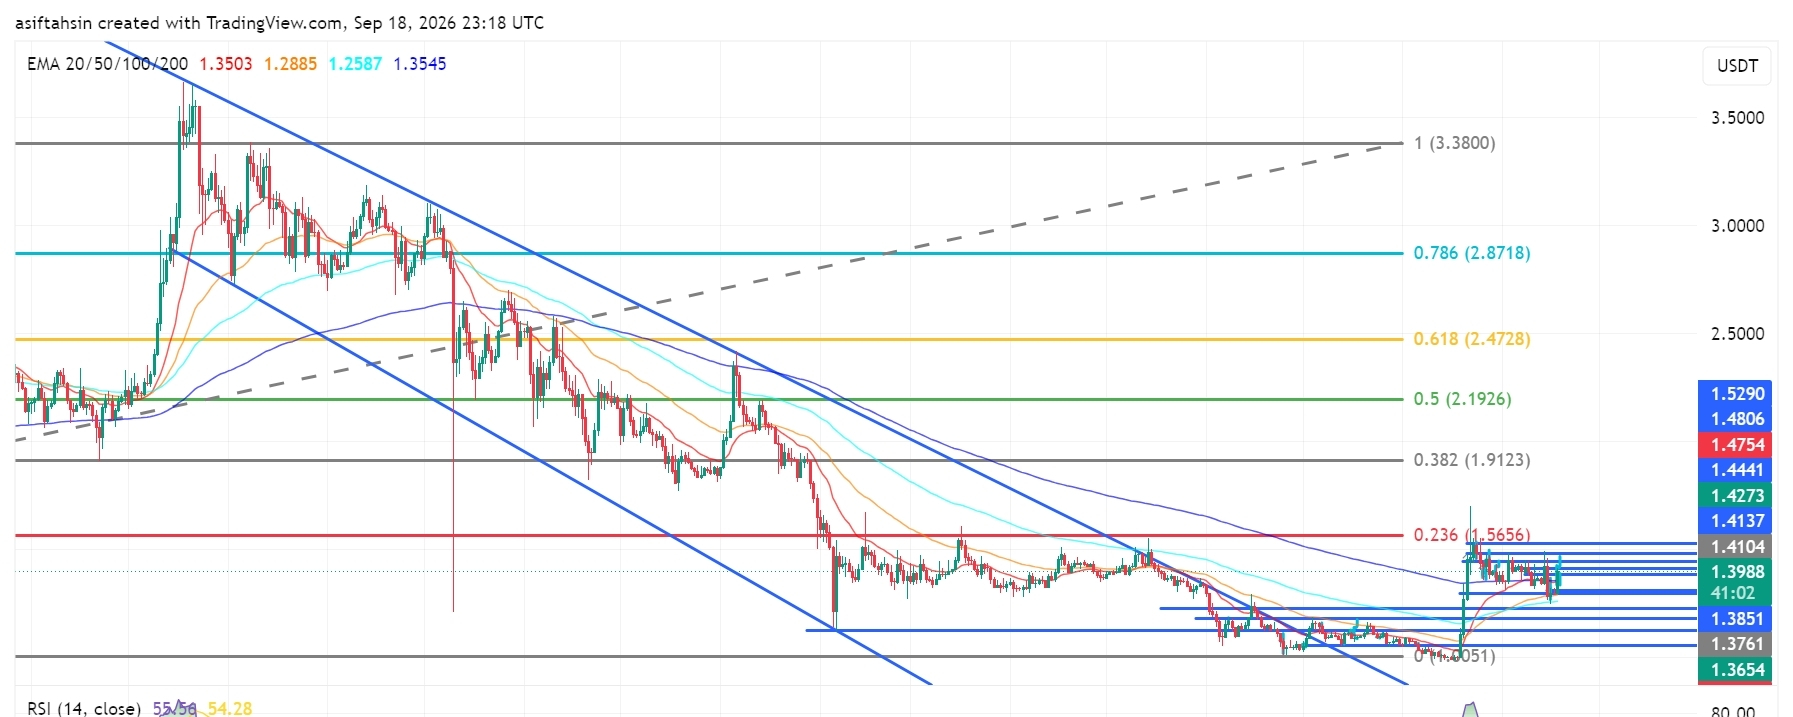
XRP技術展望:多頭守住突破後,XRP維持在約$1.40附近XRP目前大約在$1.40附近震盪:此前從8月低點強勁反彈,並且從先前的下降結構中出現了迅猛突破後,現在進入整固階段。
更大的整體結構已經顯著改善:XRP正交易在20、50和100日均線之上。然而,價格目前正面臨一個重要的阻力聚集區,約在$1.41–$1.43。多頭需要在該區域上方實現乾淨的突破,以確認下一輪上行擴張。
📈 均線結構
20 EMA:$1.3503
50 EMA:$1.2885
100 EMA:$1.2586
200 EMA:$1.3545
XRP目前交易價格位於四條主要均線之上,保持着良好的反彈結構。
XRP技術展望:多頭守住突破後,XRP維持在約$1.40附近
XRP目前大約在$1.40附近震盪:此前從8月低點強勁反彈,並且從先前的下降結構中出現了迅猛突破後,現在進入整固階段。
更大的整體結構已經顯著改善:XRP正交易在20、50和100日均線之上。然而,價格目前正面臨一個重要的阻力聚集區,約在$1.41–$1.43。多頭需要在該區域上方實現乾淨的突破,以確認下一輪上行擴張。
📈 均線結構
20 EMA:$1.3503
50 EMA:$1.2885
100 EMA:$1.2586
200 EMA:$1.3545
XRP目前交易價格位於四條主要均線之上,保持着良好的反彈結構。
更大的整體結構已經顯著改善:XRP正交易在20、50和100日均線之上。然而,價格目前正面臨一個重要的阻力聚集區,約在$1.41–$1.43。多頭需要在該區域上方實現乾淨的突破,以確認下一輪上行擴張。
📈 均線結構
20 EMA:$1.3503
50 EMA:$1.2885
100 EMA:$1.2586
200 EMA:$1.3545
XRP目前交易價格位於四條主要均線之上,保持着良好的反彈結構。
276
·
--
文章
查看翻譯
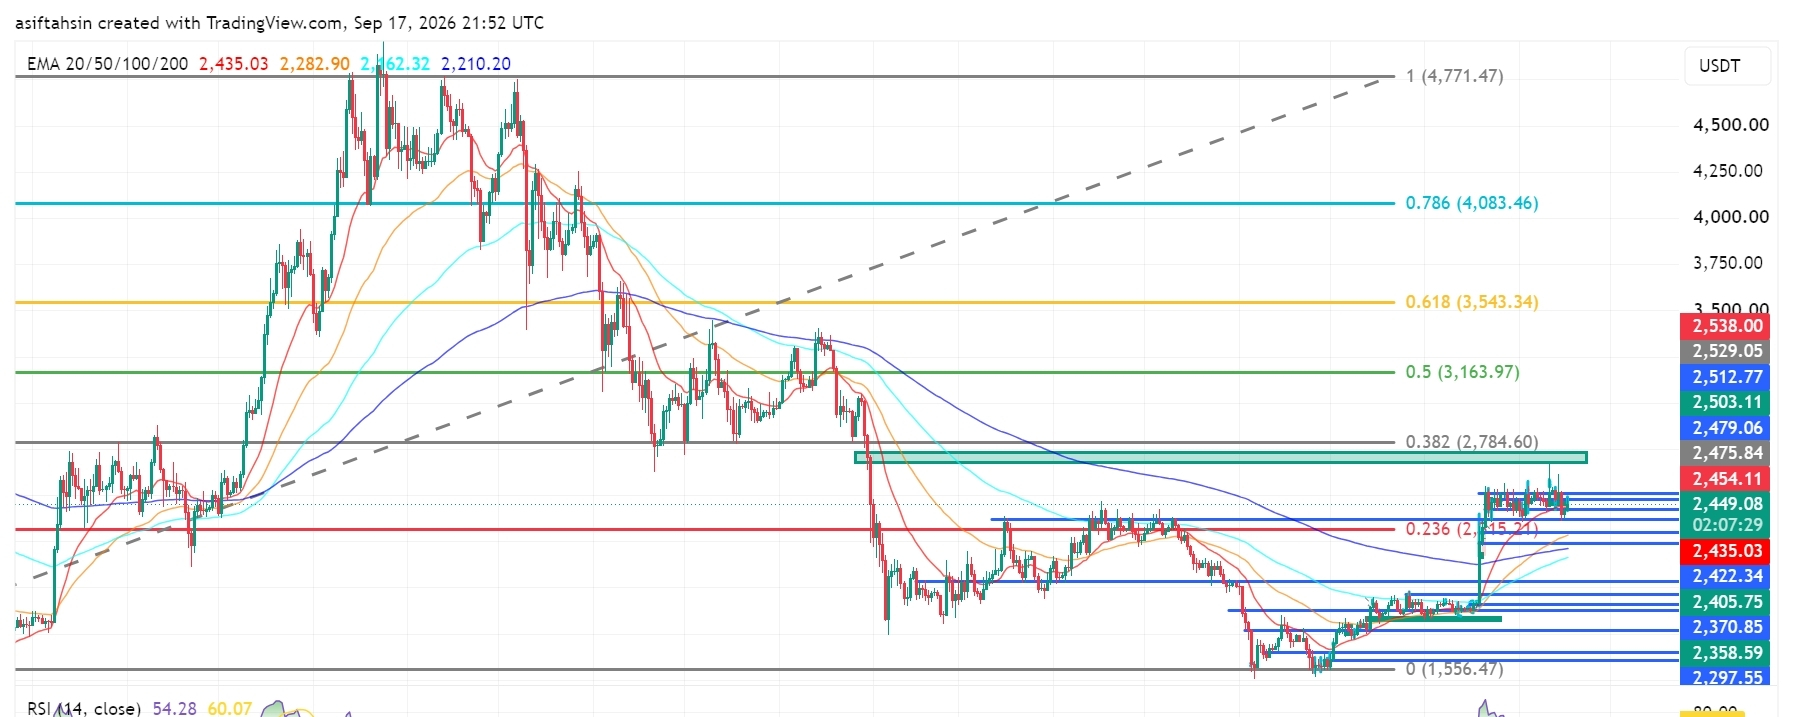
ETH Technical Outlook: Ethereum Holds Above $2.4K as Recovery Structure BuildsETH is currently trading around $2,450, holding above the $2,405–$2,435 support area after the recent recovery from the $2,300–$2,360 demand zone.
The broader structure is improving, but ETH is now consolidating below the $2,475–$2,538 resistance cluster. The next major chart area is around $2,784.60, which aligns with the 0.382 Fibonacci level.
📈 EMA Structure
20 EMA: $2,435.06
50 EMA: $2,282.92
100 EMA: $2,162.32
200 EMA: $2,210.20
ETH is currently trading above the 20 EMA at $2,435.06.
The recovery above the 50 EMA at $2,282.92, 100 EMA at $2,162.32, and 200 EMA at $2,210.20 keeps the broader recovery structure constructive.
A sustained hold above the 20 EMA would support short-term momentum, while losing the $2,210–$2,283 area would weaken the current structure.
📐 Fibonacci Levels
Key Fibonacci levels:
0.236: $2,315.21
0.382: $2,784.60
0.5: $3,163.97
0.618: $3,543.34
0.786: $4,083.46
1.0: $4,771.47
ETH is currently holding well above the 0.236 Fibonacci level at $2,315.21.
The next major Fibonacci resistance is $2,784.60 — 0.382 Fib.
A sustained move through the $2,475–$2,538 resistance structure could place the $2,784.60 region into focus.
🟢 Bullish Scenario
ETH is consolidating after the recent recovery and is currently holding above the $2,435 area.
Immediate resistance:
$2,454.11
$2,475.84
$2,479.06
$2,503.11
$2,512.77
$2,529.05
$2,538.00
$2,784.60 — 0.382 Fibonacci
A clean breakout and sustained close above the $2,529–$2,538 zone would provide stronger confirmation of continued recovery.
🎯 Target 1: $2,475.84
🎯 Target 2: $2,503.11
🎯 Target 3: $2,529.05
🎯 Target 4: $2,538.00
🎯 Target 5: $2,784.60 — 0.382 Fibonacci
🎯 Target 6: $3,163.97 — 0.5 Fibonacci
A confirmed move above $2,538 could strengthen the medium-term recovery structure and bring the $2,784–$3,164 region into focus.
🔴 Pullback Scenario
After the recent recovery, a retest of the breakout area would be normal.
Key supports:
$2,449.37
$2,435.06 — 20 EMA
$2,422.34
$2,405.75
$2,370.85
$2,358.59
$2,297.55
$2,282.92 — 50 EMA
$2,210.20 — 200 EMA
The $2,405–$2,435 zone is particularly important.
If ETH continues to hold this area during a pullback, the current recovery structure remains active.
A sustained loss of $2,282.92 would weaken the broader structure and could expose the $2,210–$2,162 area.
🧠 Market Structure & Liquidity
ETH has formed a clear recovery structure after sweeping liquidity around the $2,280–$2,360 region.
The recent move produced a strong recovery followed by a breakout above the previous consolidation area.
ETH is now moving through an important:
Recovery → Breakout → Retest → Consolidation
structure.
The major upside liquidity is concentrated around $2,475–$2,538. A decisive move through this zone would place $2,784.60 as the next major Fibonacci reference.
📊 RSI Momentum
RSI (14): 54.28
RSI remains above the neutral 50 level after the recent recovery.
The current reading shows moderately positive momentum, while the RSI signal line is around 60.07.
A sustained RSI move above 55–60 would indicate improving momentum toward the upper resistance area.
A move back below 50 would indicate increasing short-term momentum weakness.
🎯 Key Levels
🔴 Major Resistance: $2,454.11 → $2,475.84 → $2,503.11 → $2,529.05 → $2,538.00
🟢 Major Support: $2,435.06 → $2,422.34 → $2,405.75 → $2,370.85 → $2,358.59
📉 Dynamic EMA Support: $2,435.06 — 20 EMA | $2,282.92 — 50 EMA | $2,210.20 — 200 EMA | $2,162.32 — 100 EMA
🚀 Upside References: $2,538 → $2,784.60 → $3,163.97 → $3,543.34
📌 Final Outlook
ETH's broader structure remains constructive after the recent recovery, with price holding above the $2,405–$2,435 area.
The $2,405–$2,435 zone is now an important short-term support region. As long as ETH maintains this area, the current recovery structure remains active.
The immediate battle is around $2,475–$2,538. A confirmed move above $2,538 could open the path toward $2,784.60, followed by $3,163.97.
However, rejection from resistance followed by a sustained loss of $2,282.92 would weaken the broader structure and increase the possibility of a deeper retracement toward the $2,210–$2,162 area.
Bias: 🟢 Recovery structure intact above $2,282.92. A breakout above $2,538 could open the path toward $2,784.60, with $3,163.97 as the next major Fibonacci reference.
$ETH
{future}(ETHUSDT)
ETH Technical Outlook: Ethereum Holds Above $2.4K as Recovery Structure Builds
ETH is currently trading around $2,450, holding above the $2,405–$2,435 support area after the recent recovery from the $2,300–$2,360 demand zone.
The broader structure is improving, but ETH is now consolidating below the $2,475–$2,538 resistance cluster. The next major chart area is around $2,784.60, which aligns with the 0.382 Fibonacci level.
📈 EMA Structure
20 EMA: $2,435.06
50 EMA: $2,282.92
100 EMA: $2,162.32
200 EMA: $2,210.20
ETH is currently trading above the 20 EMA at $2,435.06.
The recovery above the 50 EMA at $2,282.92, 100 EMA at $2,162.32, and 200 EMA at $2,210.20 keeps the broader recovery structure constructive.
A sustained hold above the 20 EMA would support short-term momentum, while losing the $2,210–$2,283 area would weaken the current structure.
📐 Fibonacci Levels
Key Fibonacci levels:
0.236: $2,315.21
0.382: $2,784.60
0.5: $3,163.97
0.618: $3,543.34
0.786: $4,083.46
1.0: $4,771.47
ETH is currently holding well above the 0.236 Fibonacci level at $2,315.21.
The next major Fibonacci resistance is $2,784.60 — 0.382 Fib.
A sustained move through the $2,475–$2,538 resistance structure could place the $2,784.60 region into focus.
🟢 Bullish Scenario
ETH is consolidating after the recent recovery and is currently holding above the $2,435 area.
Immediate resistance:
$2,454.11
$2,475.84
$2,479.06
$2,503.11
$2,512.77
$2,529.05
$2,538.00
$2,784.60 — 0.382 Fibonacci
A clean breakout and sustained close above the $2,529–$2,538 zone would provide stronger confirmation of continued recovery.
🎯 Target 1: $2,475.84
🎯 Target 2: $2,503.11
🎯 Target 3: $2,529.05
🎯 Target 4: $2,538.00
🎯 Target 5: $2,784.60 — 0.382 Fibonacci
🎯 Target 6: $3,163.97 — 0.5 Fibonacci
A confirmed move above $2,538 could strengthen the medium-term recovery structure and bring the $2,784–$3,164 region into focus.
🔴 Pullback Scenario
After the recent recovery, a retest of the breakout area would be normal.
Key supports:
$2,449.37
$2,435.06 — 20 EMA
$2,422.34
$2,405.75
$2,370.85
$2,358.59
$2,297.55
$2,282.92 — 50 EMA
$2,210.20 — 200 EMA
The $2,405–$2,435 zone is particularly important.
If ETH continues to hold this area during a pullback, the current recovery structure remains active.
A sustained loss of $2,282.92 would weaken the broader structure and could expose the $2,210–$2,162 area.
🧠 Market Structure & Liquidity
ETH has formed a clear recovery structure after sweeping liquidity around the $2,280–$2,360 region.
The recent move produced a strong recovery followed by a breakout above the previous consolidation area.
ETH is now moving through an important:
Recovery → Breakout → Retest → Consolidation
structure.
The major upside liquidity is concentrated around $2,475–$2,538. A decisive move through this zone would place $2,784.60 as the next major Fibonacci reference.
📊 RSI Momentum
RSI (14): 54.28
RSI remains above the neutral 50 level after the recent recovery.
The current reading shows moderately positive momentum, while the RSI signal line is around 60.07.
A sustained RSI move above 55–60 would indicate improving momentum toward the upper resistance area.
A move back below 50 would indicate increasing short-term momentum weakness.
🎯 Key Levels
🔴 Major Resistance: $2,454.11 → $2,475.84 → $2,503.11 → $2,529.05 → $2,538.00
🟢 Major Support: $2,435.06 → $2,422.34 → $2,405.75 → $2,370.85 → $2,358.59
📉 Dynamic EMA Support: $2,435.06 — 20 EMA | $2,282.92 — 50 EMA | $2,210.20 — 200 EMA | $2,162.32 — 100 EMA
🚀 Upside References: $2,538 → $2,784.60 → $3,163.97 → $3,543.34
📌 Final Outlook
ETH's broader structure remains constructive after the recent recovery, with price holding above the $2,405–$2,435 area.
The $2,405–$2,435 zone is now an important short-term support region. As long as ETH maintains this area, the current recovery structure remains active.
The immediate battle is around $2,475–$2,538. A confirmed move above $2,538 could open the path toward $2,784.60, followed by $3,163.97.
However, rejection from resistance followed by a sustained loss of $2,282.92 would weaken the broader structure and increase the possibility of a deeper retracement toward the $2,210–$2,162 area.
Bias: 🟢 Recovery structure intact above $2,282.92. A breakout above $2,538 could open the path toward $2,784.60, with $3,163.97 as the next major Fibonacci reference.
$ETH
The broader structure is improving, but ETH is now consolidating below the $2,475–$2,538 resistance cluster. The next major chart area is around $2,784.60, which aligns with the 0.382 Fibonacci level.
📈 EMA Structure
20 EMA: $2,435.06
50 EMA: $2,282.92
100 EMA: $2,162.32
200 EMA: $2,210.20
ETH is currently trading above the 20 EMA at $2,435.06.
The recovery above the 50 EMA at $2,282.92, 100 EMA at $2,162.32, and 200 EMA at $2,210.20 keeps the broader recovery structure constructive.
A sustained hold above the 20 EMA would support short-term momentum, while losing the $2,210–$2,283 area would weaken the current structure.
📐 Fibonacci Levels
Key Fibonacci levels:
0.236: $2,315.21
0.382: $2,784.60
0.5: $3,163.97
0.618: $3,543.34
0.786: $4,083.46
1.0: $4,771.47
ETH is currently holding well above the 0.236 Fibonacci level at $2,315.21.
The next major Fibonacci resistance is $2,784.60 — 0.382 Fib.
A sustained move through the $2,475–$2,538 resistance structure could place the $2,784.60 region into focus.
🟢 Bullish Scenario
ETH is consolidating after the recent recovery and is currently holding above the $2,435 area.
Immediate resistance:
$2,454.11
$2,475.84
$2,479.06
$2,503.11
$2,512.77
$2,529.05
$2,538.00
$2,784.60 — 0.382 Fibonacci
A clean breakout and sustained close above the $2,529–$2,538 zone would provide stronger confirmation of continued recovery.
🎯 Target 1: $2,475.84
🎯 Target 2: $2,503.11
🎯 Target 3: $2,529.05
🎯 Target 4: $2,538.00
🎯 Target 5: $2,784.60 — 0.382 Fibonacci
🎯 Target 6: $3,163.97 — 0.5 Fibonacci
A confirmed move above $2,538 could strengthen the medium-term recovery structure and bring the $2,784–$3,164 region into focus.
🔴 Pullback Scenario
After the recent recovery, a retest of the breakout area would be normal.
Key supports:
$2,449.37
$2,435.06 — 20 EMA
$2,422.34
$2,405.75
$2,370.85
$2,358.59
$2,297.55
$2,282.92 — 50 EMA
$2,210.20 — 200 EMA
The $2,405–$2,435 zone is particularly important.
If ETH continues to hold this area during a pullback, the current recovery structure remains active.
A sustained loss of $2,282.92 would weaken the broader structure and could expose the $2,210–$2,162 area.
🧠 Market Structure & Liquidity
ETH has formed a clear recovery structure after sweeping liquidity around the $2,280–$2,360 region.
The recent move produced a strong recovery followed by a breakout above the previous consolidation area.
ETH is now moving through an important:
Recovery → Breakout → Retest → Consolidation
structure.
The major upside liquidity is concentrated around $2,475–$2,538. A decisive move through this zone would place $2,784.60 as the next major Fibonacci reference.
📊 RSI Momentum
RSI (14): 54.28
RSI remains above the neutral 50 level after the recent recovery.
The current reading shows moderately positive momentum, while the RSI signal line is around 60.07.
A sustained RSI move above 55–60 would indicate improving momentum toward the upper resistance area.
A move back below 50 would indicate increasing short-term momentum weakness.
🎯 Key Levels
🔴 Major Resistance: $2,454.11 → $2,475.84 → $2,503.11 → $2,529.05 → $2,538.00
🟢 Major Support: $2,435.06 → $2,422.34 → $2,405.75 → $2,370.85 → $2,358.59
📉 Dynamic EMA Support: $2,435.06 — 20 EMA | $2,282.92 — 50 EMA | $2,210.20 — 200 EMA | $2,162.32 — 100 EMA
🚀 Upside References: $2,538 → $2,784.60 → $3,163.97 → $3,543.34
📌 Final Outlook
ETH's broader structure remains constructive after the recent recovery, with price holding above the $2,405–$2,435 area.
The $2,405–$2,435 zone is now an important short-term support region. As long as ETH maintains this area, the current recovery structure remains active.
The immediate battle is around $2,475–$2,538. A confirmed move above $2,538 could open the path toward $2,784.60, followed by $3,163.97.
However, rejection from resistance followed by a sustained loss of $2,282.92 would weaken the broader structure and increase the possibility of a deeper retracement toward the $2,210–$2,162 area.
Bias: 🟢 Recovery structure intact above $2,282.92. A breakout above $2,538 could open the path toward $2,784.60, with $3,163.97 as the next major Fibonacci reference.
$ETH
75
·
--
文章
查看翻譯
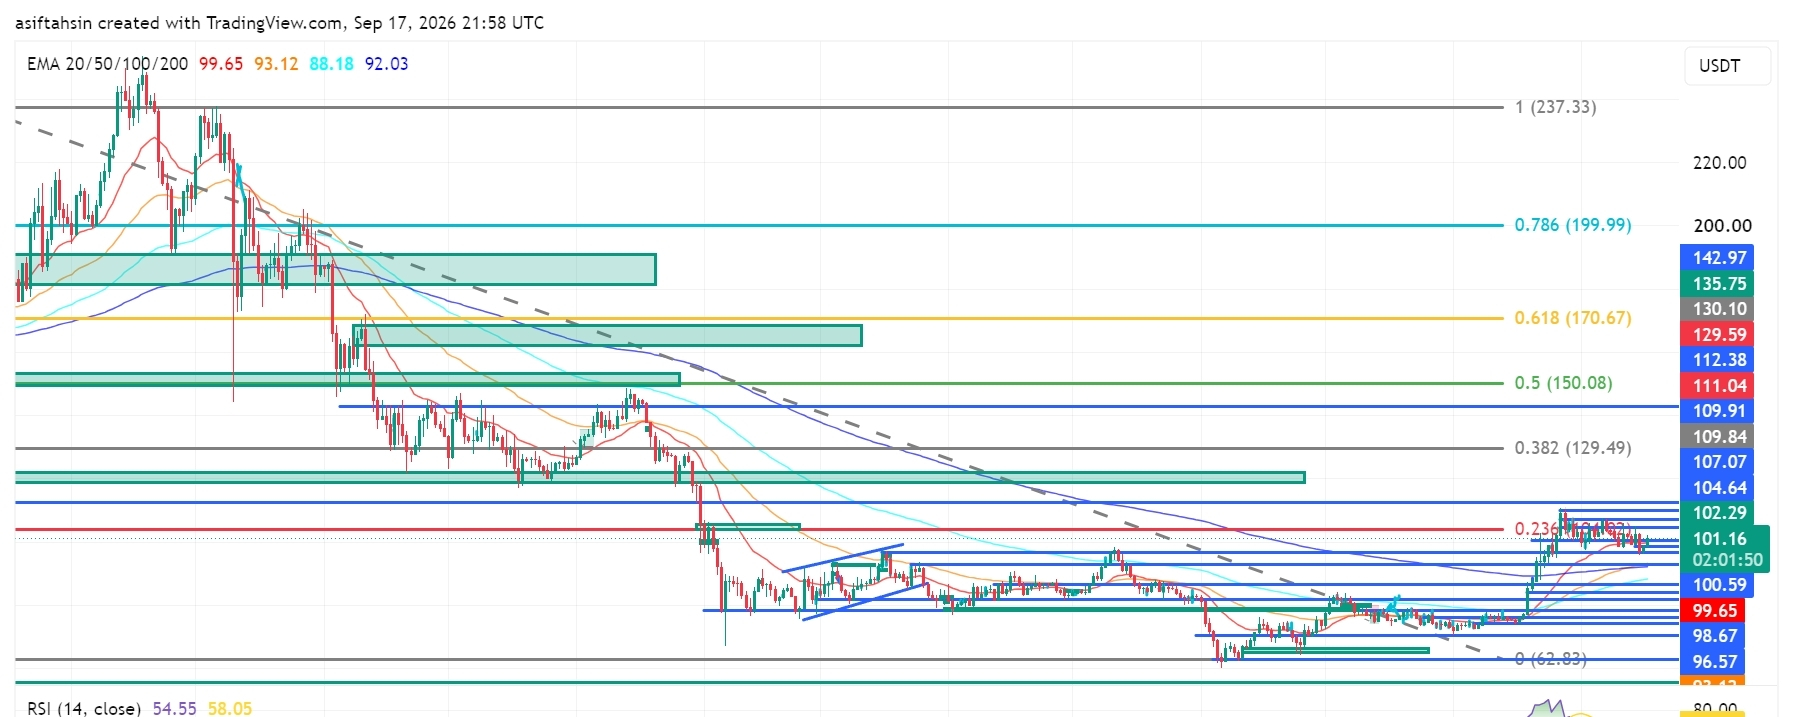
SOL Technical Outlook: Solana Holds Above $100 as Bulls Defend the RecoverySOL is currently trading around $101.16, holding above the $99–$100 breakout zone after the recent bullish expansion from the $92–$94 demand area.
The broader recovery structure remains constructive, but SOL is now consolidating below the $102.29–$107.07 resistance cluster. Bulls need to reclaim this area and break the $109.91–$112.38 zone for the next major upside expansion.
📈 EMA Structure
- 20 EMA: $99.65
- 50 EMA: $93.12
- 100 EMA: $88.18
- 200 EMA: $92.03
SOL is currently trading above the 20 EMA at $99.65.
The recovery above the 50 EMA at $93.12 and 200 EMA at $92.03 keeps the broader recovery structure intact.
A sustained hold above the 20 EMA would support short-term momentum, while losing the $93.12–$92.03 area would weaken the current structure.
📐 Fibonacci Levels
Key Fibonacci levels:
- 0.236: $104.64
- 0.382: $129.49
- 0.5: $150.08
- 0.618: $170.67
- 0.786: $199.99
- 1.0: $237.33
SOL is currently trading below the 0.236 Fibonacci level at $104.64.
The next major Fibonacci resistance is $129.49 — 0.382 Fib.
A sustained breakout through the $104–$112 resistance structure could open the path toward the $129.49 region.
🟢 Bullish Scenario
SOL is consolidating after the recent recovery and is currently maintaining acceptance above the $100 area.
Immediate resistance:
- $102.29
- $104.64 — 0.236 Fibonacci
- $107.07
- $109.84
- $109.91
- $111.04
- $112.38
A clean breakout and sustained close above $111.04–$112.38 would provide stronger confirmation of bullish continuation.
🎯 Target 1: $104.64
🎯 Target 2: $107.07
🎯 Target 3: $109.91
🎯 Target 4: $112.38
🎯 Target 5: $129.49 — 0.382 Fibonacci
🎯 Target 6: $150.08 — 0.5 Fibonacci
A confirmed breakout above the $111–$112 zone could strengthen the medium-term recovery structure and potentially accelerate SOL toward the $129–$150 region.
🔴 Pullback Scenario
After the recent bullish expansion, a retest of the breakout area would be normal.
Key supports:
- $100.59
- $99.65 — 20 EMA
- $98.67
- $96.57
- $93.12 — 50 EMA
- $92.94
- $92.03 — 200 EMA
- $88.18 — 100 EMA
The $96–$100 zone is particularly important.
If SOL continues to hold this area during a pullback, the current recovery structure remains active.
A sustained loss of $92.03 would weaken the current structure and could expose the $88.18 support zone.
🧠 Market Structure & Liquidity
SOL has formed a clear recovery structure after sweeping liquidity around the $92–$94 demand region.
The recent move produced a market-structure shift followed by a breakout and higher-low formation.
SOL is now moving through an important:
Breakout → Retest → Consolidation → Continuation
structure.
The major upside liquidity is concentrated around $102–$112. A decisive breakout above this zone would place $129.49 as the next major Fibonacci reference.
📊 RSI Momentum
RSI (14): 54.55
RSI remains above the neutral 50 level after cooling from the recent bullish expansion.
The current reading shows moderately positive momentum without reaching an extreme zone.
A sustained RSI move above 55–60 would indicate improving momentum toward the upper resistance area.
A move back below 50 would indicate increasing short-term momentum weakness.
🎯 Key Levels
🔴 Major Resistance: $102.29 → $104.64 → $107.07 → $109.91 → $111.04 → $112.38
🟢 Major Support: $100.59 → $99.65 → $98.67 → $96.57 → $93.12 → $92.03
📉 Dynamic EMA Support: $99.65 — 20 EMA | $93.12 — 50 EMA | $92.03 — 200 EMA | $88.18 — 100 EMA
🚀 Upside Targets: $112.38 → $129.49 → $150.08 → $170.67
📌 Final Outlook
SOL's broader structure remains constructive after the recent breakout, with price holding above the $99–$100 region.
The $96–$100 area is now an important short-term support region. As long as SOL maintains this area, the current recovery structure remains active.
The immediate battle is around $102–$112. A confirmed breakout above $112.38 could open the path toward $129.49, followed by $150.08 and potentially $170.67.
However, rejection from resistance followed by a sustained loss of $92.03 would weaken the current structure and increase the possibility of a deeper retracement toward the $88.18 area.
Bias: 🟢 Recovery structure intact above $92.03. A breakout above $112.38 could open the path toward $129.49, with $150.08 as the next major Fibonacci target.
$SOL
{future}(SOLUSDT)
SOL Technical Outlook: Solana Holds Above $100 as Bulls Defend the Recovery
SOL is currently trading around $101.16, holding above the $99–$100 breakout zone after the recent bullish expansion from the $92–$94 demand area.
The broader recovery structure remains constructive, but SOL is now consolidating below the $102.29–$107.07 resistance cluster. Bulls need to reclaim this area and break the $109.91–$112.38 zone for the next major upside expansion.
📈 EMA Structure
- 20 EMA: $99.65
- 50 EMA: $93.12
- 100 EMA: $88.18
- 200 EMA: $92.03
SOL is currently trading above the 20 EMA at $99.65.
The recovery above the 50 EMA at $93.12 and 200 EMA at $92.03 keeps the broader recovery structure intact.
A sustained hold above the 20 EMA would support short-term momentum, while losing the $93.12–$92.03 area would weaken the current structure.
📐 Fibonacci Levels
Key Fibonacci levels:
- 0.236: $104.64
- 0.382: $129.49
- 0.5: $150.08
- 0.618: $170.67
- 0.786: $199.99
- 1.0: $237.33
SOL is currently trading below the 0.236 Fibonacci level at $104.64.
The next major Fibonacci resistance is $129.49 — 0.382 Fib.
A sustained breakout through the $104–$112 resistance structure could open the path toward the $129.49 region.
🟢 Bullish Scenario
SOL is consolidating after the recent recovery and is currently maintaining acceptance above the $100 area.
Immediate resistance:
- $102.29
- $104.64 — 0.236 Fibonacci
- $107.07
- $109.84
- $109.91
- $111.04
- $112.38
A clean breakout and sustained close above $111.04–$112.38 would provide stronger confirmation of bullish continuation.
🎯 Target 1: $104.64
🎯 Target 2: $107.07
🎯 Target 3: $109.91
🎯 Target 4: $112.38
🎯 Target 5: $129.49 — 0.382 Fibonacci
🎯 Target 6: $150.08 — 0.5 Fibonacci
A confirmed breakout above the $111–$112 zone could strengthen the medium-term recovery structure and potentially accelerate SOL toward the $129–$150 region.
🔴 Pullback Scenario
After the recent bullish expansion, a retest of the breakout area would be normal.
Key supports:
- $100.59
- $99.65 — 20 EMA
- $98.67
- $96.57
- $93.12 — 50 EMA
- $92.94
- $92.03 — 200 EMA
- $88.18 — 100 EMA
The $96–$100 zone is particularly important.
If SOL continues to hold this area during a pullback, the current recovery structure remains active.
A sustained loss of $92.03 would weaken the current structure and could expose the $88.18 support zone.
🧠 Market Structure & Liquidity
SOL has formed a clear recovery structure after sweeping liquidity around the $92–$94 demand region.
The recent move produced a market-structure shift followed by a breakout and higher-low formation.
SOL is now moving through an important:
Breakout → Retest → Consolidation → Continuation
structure.
The major upside liquidity is concentrated around $102–$112. A decisive breakout above this zone would place $129.49 as the next major Fibonacci reference.
📊 RSI Momentum
RSI (14): 54.55
RSI remains above the neutral 50 level after cooling from the recent bullish expansion.
The current reading shows moderately positive momentum without reaching an extreme zone.
A sustained RSI move above 55–60 would indicate improving momentum toward the upper resistance area.
A move back below 50 would indicate increasing short-term momentum weakness.
🎯 Key Levels
🔴 Major Resistance: $102.29 → $104.64 → $107.07 → $109.91 → $111.04 → $112.38
🟢 Major Support: $100.59 → $99.65 → $98.67 → $96.57 → $93.12 → $92.03
📉 Dynamic EMA Support: $99.65 — 20 EMA | $93.12 — 50 EMA | $92.03 — 200 EMA | $88.18 — 100 EMA
🚀 Upside Targets: $112.38 → $129.49 → $150.08 → $170.67
📌 Final Outlook
SOL's broader structure remains constructive after the recent breakout, with price holding above the $99–$100 region.
The $96–$100 area is now an important short-term support region. As long as SOL maintains this area, the current recovery structure remains active.
The immediate battle is around $102–$112. A confirmed breakout above $112.38 could open the path toward $129.49, followed by $150.08 and potentially $170.67.
However, rejection from resistance followed by a sustained loss of $92.03 would weaken the current structure and increase the possibility of a deeper retracement toward the $88.18 area.
Bias: 🟢 Recovery structure intact above $92.03. A breakout above $112.38 could open the path toward $129.49, with $150.08 as the next major Fibonacci target.
$SOL
The broader recovery structure remains constructive, but SOL is now consolidating below the $102.29–$107.07 resistance cluster. Bulls need to reclaim this area and break the $109.91–$112.38 zone for the next major upside expansion.
📈 EMA Structure
- 20 EMA: $99.65
- 50 EMA: $93.12
- 100 EMA: $88.18
- 200 EMA: $92.03
SOL is currently trading above the 20 EMA at $99.65.
The recovery above the 50 EMA at $93.12 and 200 EMA at $92.03 keeps the broader recovery structure intact.
A sustained hold above the 20 EMA would support short-term momentum, while losing the $93.12–$92.03 area would weaken the current structure.
📐 Fibonacci Levels
Key Fibonacci levels:
- 0.236: $104.64
- 0.382: $129.49
- 0.5: $150.08
- 0.618: $170.67
- 0.786: $199.99
- 1.0: $237.33
SOL is currently trading below the 0.236 Fibonacci level at $104.64.
The next major Fibonacci resistance is $129.49 — 0.382 Fib.
A sustained breakout through the $104–$112 resistance structure could open the path toward the $129.49 region.
🟢 Bullish Scenario
SOL is consolidating after the recent recovery and is currently maintaining acceptance above the $100 area.
Immediate resistance:
- $102.29
- $104.64 — 0.236 Fibonacci
- $107.07
- $109.84
- $109.91
- $111.04
- $112.38
A clean breakout and sustained close above $111.04–$112.38 would provide stronger confirmation of bullish continuation.
🎯 Target 1: $104.64
🎯 Target 2: $107.07
🎯 Target 3: $109.91
🎯 Target 4: $112.38
🎯 Target 5: $129.49 — 0.382 Fibonacci
🎯 Target 6: $150.08 — 0.5 Fibonacci
A confirmed breakout above the $111–$112 zone could strengthen the medium-term recovery structure and potentially accelerate SOL toward the $129–$150 region.
🔴 Pullback Scenario
After the recent bullish expansion, a retest of the breakout area would be normal.
Key supports:
- $100.59
- $99.65 — 20 EMA
- $98.67
- $96.57
- $93.12 — 50 EMA
- $92.94
- $92.03 — 200 EMA
- $88.18 — 100 EMA
The $96–$100 zone is particularly important.
If SOL continues to hold this area during a pullback, the current recovery structure remains active.
A sustained loss of $92.03 would weaken the current structure and could expose the $88.18 support zone.
🧠 Market Structure & Liquidity
SOL has formed a clear recovery structure after sweeping liquidity around the $92–$94 demand region.
The recent move produced a market-structure shift followed by a breakout and higher-low formation.
SOL is now moving through an important:
Breakout → Retest → Consolidation → Continuation
structure.
The major upside liquidity is concentrated around $102–$112. A decisive breakout above this zone would place $129.49 as the next major Fibonacci reference.
📊 RSI Momentum
RSI (14): 54.55
RSI remains above the neutral 50 level after cooling from the recent bullish expansion.
The current reading shows moderately positive momentum without reaching an extreme zone.
A sustained RSI move above 55–60 would indicate improving momentum toward the upper resistance area.
A move back below 50 would indicate increasing short-term momentum weakness.
🎯 Key Levels
🔴 Major Resistance: $102.29 → $104.64 → $107.07 → $109.91 → $111.04 → $112.38
🟢 Major Support: $100.59 → $99.65 → $98.67 → $96.57 → $93.12 → $92.03
📉 Dynamic EMA Support: $99.65 — 20 EMA | $93.12 — 50 EMA | $92.03 — 200 EMA | $88.18 — 100 EMA
🚀 Upside Targets: $112.38 → $129.49 → $150.08 → $170.67
📌 Final Outlook
SOL's broader structure remains constructive after the recent breakout, with price holding above the $99–$100 region.
The $96–$100 area is now an important short-term support region. As long as SOL maintains this area, the current recovery structure remains active.
The immediate battle is around $102–$112. A confirmed breakout above $112.38 could open the path toward $129.49, followed by $150.08 and potentially $170.67.
However, rejection from resistance followed by a sustained loss of $92.03 would weaken the current structure and increase the possibility of a deeper retracement toward the $88.18 area.
Bias: 🟢 Recovery structure intact above $92.03. A breakout above $112.38 could open the path toward $129.49, with $150.08 as the next major Fibonacci target.
$SOL
73
·
--
文章
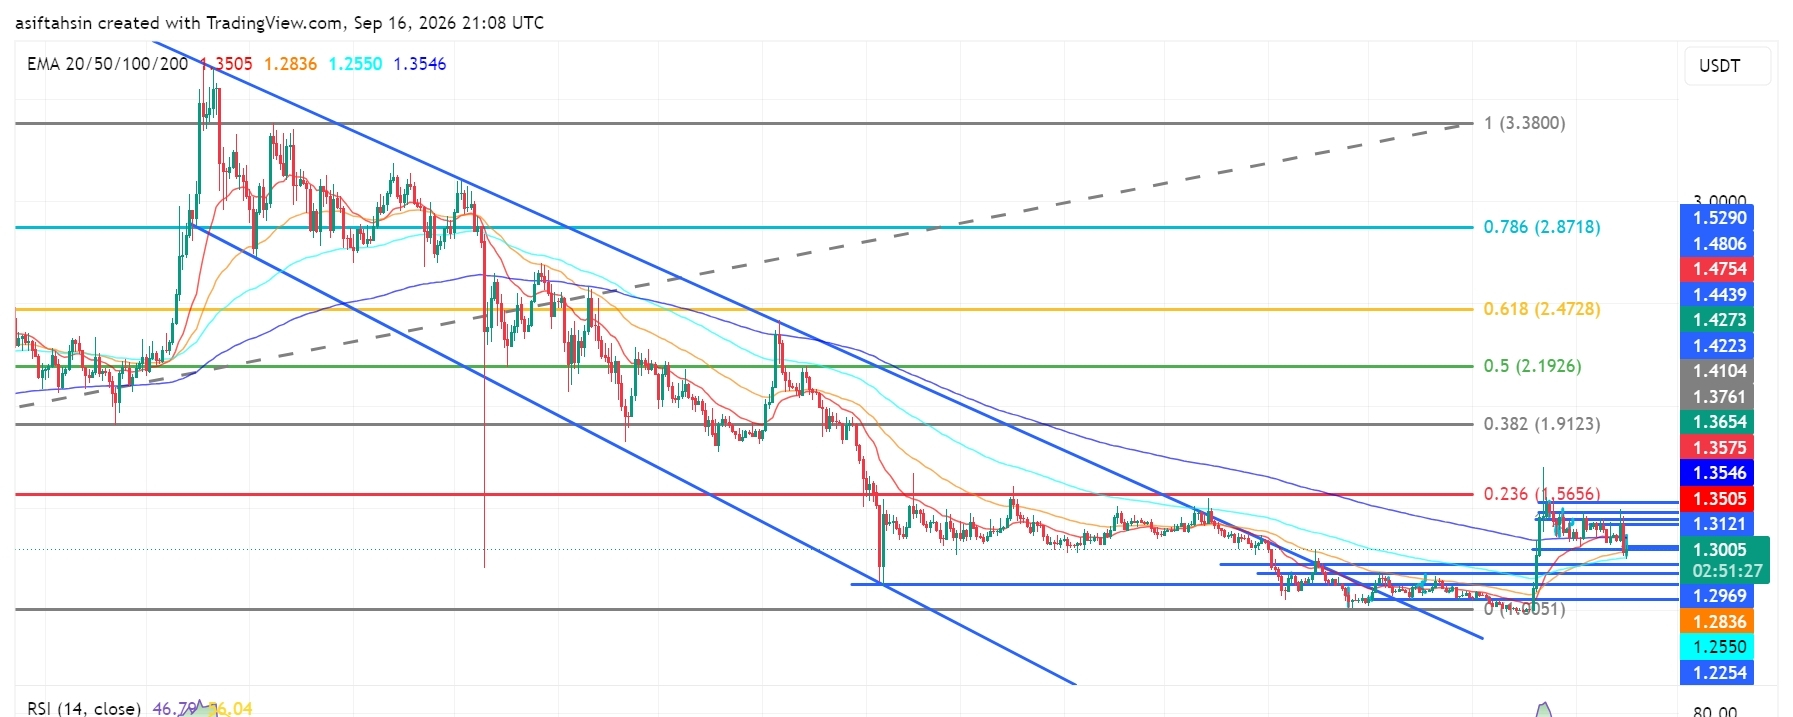
XRP技術展望:XRP在急劇回撤後於$1.30附近盤整XRP在圖表上約在$1.30附近交易,此前從$1.35–$1.43區域出現急劇回拒。價格已回到突破位附近,而更大級別的圖表仍處於從$1.20–$1.25區域反彈的階段。當前動能偏中性,RSI低於50。
📈 均線結構
20日均線(EMA):$1.3505
50日均線(EMA):$1.2836
100日均線(EMA):$1.2550
200日均線(EMA):$1.3546
XRP目前位於20日均線和200日均線下方,而50日和100日EMA仍在價格下方。收復$1.35這一關口將改善短期結構。
XRP技術展望:XRP在急劇回撤後於$1.30附近盤整
XRP在圖表上約在$1.30附近交易,此前從$1.35–$1.43區域出現急劇回拒。價格已回到突破位附近,而更大級別的圖表仍處於從$1.20–$1.25區域反彈的階段。當前動能偏中性,RSI低於50。
📈 均線結構
20日均線(EMA):$1.3505
50日均線(EMA):$1.2836
100日均線(EMA):$1.2550
200日均線(EMA):$1.3546
XRP目前位於20日均線和200日均線下方,而50日和100日EMA仍在價格下方。收復$1.35這一關口將改善短期結構。
📈 均線結構
20日均線(EMA):$1.3505
50日均線(EMA):$1.2836
100日均線(EMA):$1.2550
200日均線(EMA):$1.3546
XRP目前位於20日均線和200日均線下方,而50日和100日EMA仍在價格下方。收復$1.35這一關口將改善短期結構。
1
3
788
·
--
文章
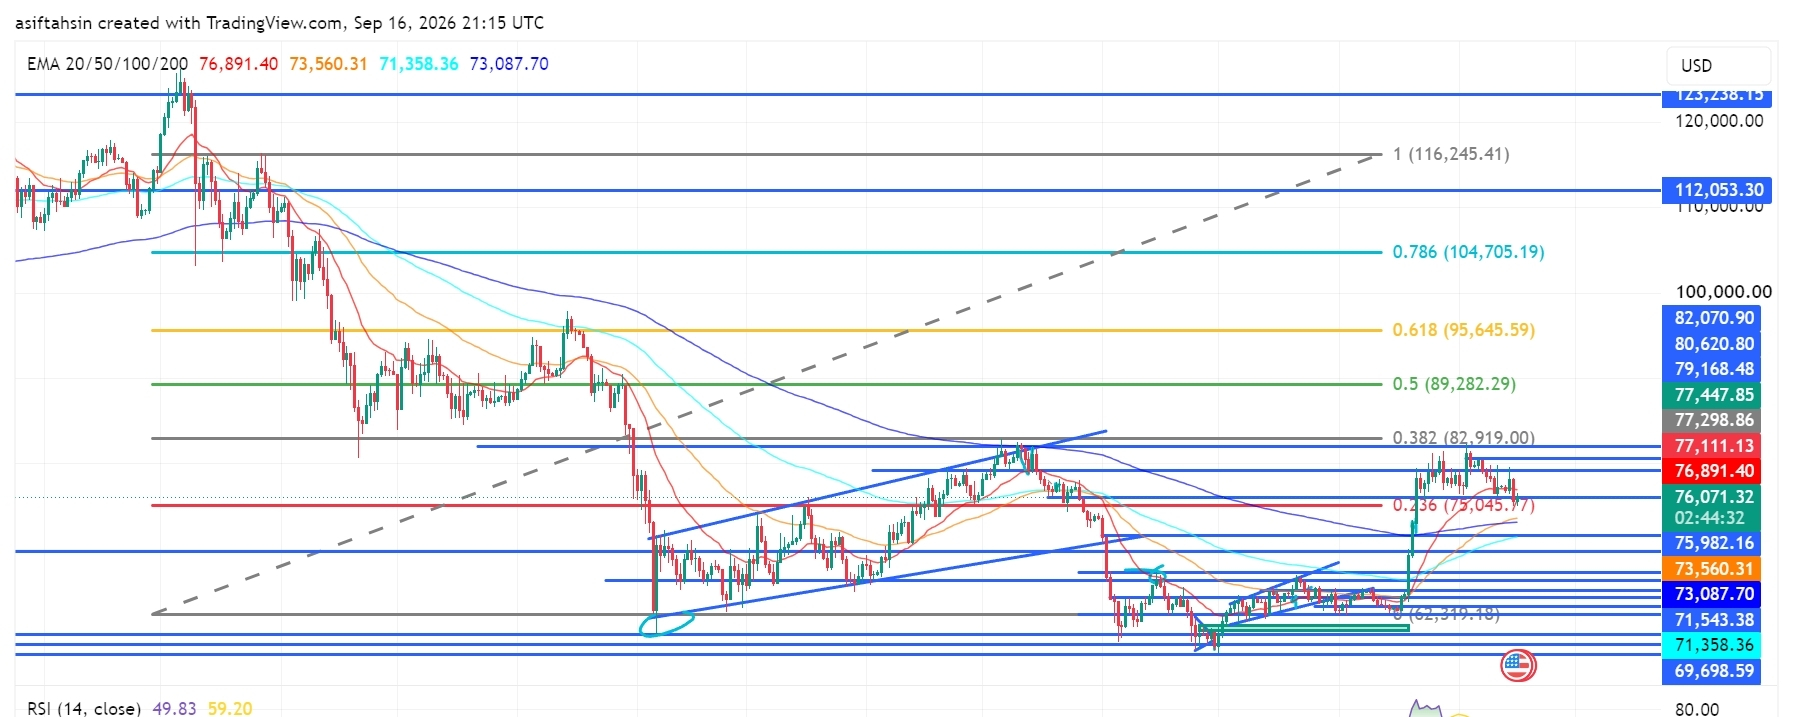
BTC 技術展望:比特幣在 $77K 下方整固,多頭守住反彈比特幣目前在約 $76.9K 附近交易,在從 $69K–$71K 需求區域的近期反彈後進入盤整。價格仍高於主要 $75K 支撐區,但由於 BTC 難以跌破/突破 $77.1K–$82.9K 的阻力區間,動能已有所降溫。下一次向上突破或向下跌破將決定短期走勢。
📈 EMA 結構
20 EMA: $76,891
50 EMA: $73,560
100 EMA: $71,358
200 EMA: $73,088
BTC 目前正處在 20 EMA 附近,而 50/100/200 EMA 仍低於價格。只要站穩 $75K,較大級別的反彈結構就仍保持完整,但如果跌破 20 EMA,可能會引發更深度的回測。
BTC 技術展望:比特幣在 $77K 下方整固,多頭守住反彈
比特幣目前在約 $76.9K 附近交易,在從 $69K–$71K 需求區域的近期反彈後進入盤整。價格仍高於主要 $75K 支撐區,但由於 BTC 難以跌破/突破 $77.1K–$82.9K 的阻力區間,動能已有所降溫。下一次向上突破或向下跌破將決定短期走勢。
📈 EMA 結構
20 EMA: $76,891
50 EMA: $73,560
100 EMA: $71,358
200 EMA: $73,088
BTC 目前正處在 20 EMA 附近,而 50/100/200 EMA 仍低於價格。只要站穩 $75K,較大級別的反彈結構就仍保持完整,但如果跌破 20 EMA,可能會引發更深度的回測。
📈 EMA 結構
20 EMA: $76,891
50 EMA: $73,560
100 EMA: $71,358
200 EMA: $73,088
BTC 目前正處在 20 EMA 附近,而 50/100/200 EMA 仍低於價格。只要站穩 $75K,較大級別的反彈結構就仍保持完整,但如果跌破 20 EMA,可能會引發更深度的回測。
61
·
--
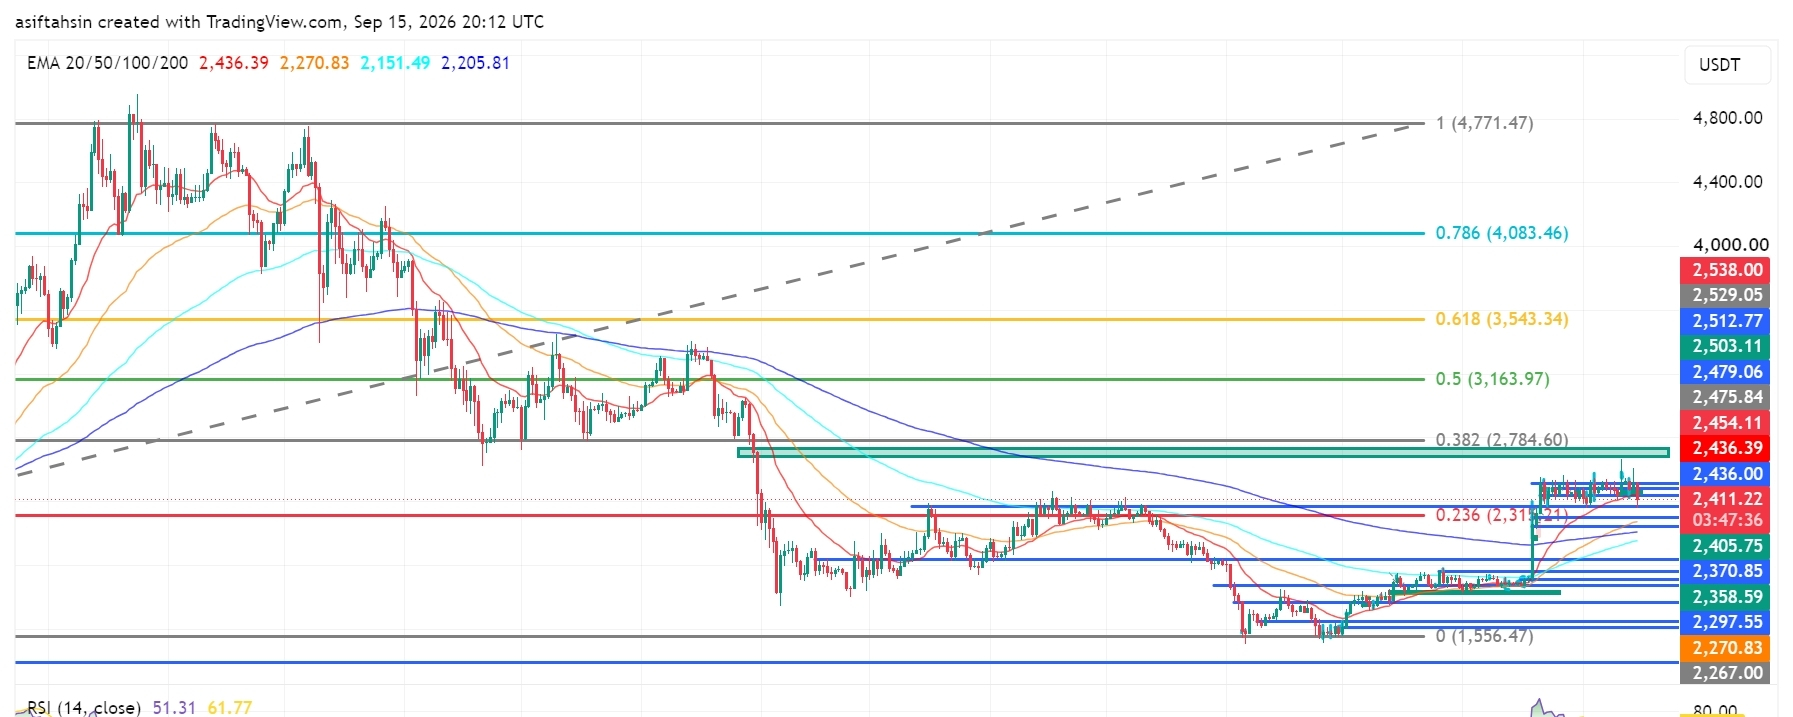
文章
SOL技術展望:Solana守在$100附近,多頭防守突破SOL目前交易在約$99.6附近,在近期從$92–$94需求區域出現的看漲擴張之後,正守在$99–$100突破區附近。
更廣泛的復甦結構依然偏建設性,但SOL目前正處於$100.59–$104.64這一阻力區下方的盤整。多頭需要重新奪回該區域,並突破$107.07–$109.91區間,才能迎來下一輪更大級別的上行動能擴張。
📈 均線結構
20日均線:$99.62
50日均線:$92.58
100日均線:$87.71
200日均線:$91.88
SOL目前正在測試20日均線($99.62)。
SOL技術展望:Solana守在$100附近,多頭防守突破
SOL目前交易在約$99.6附近,在近期從$92–$94需求區域出現的看漲擴張之後,正守在$99–$100突破區附近。
更廣泛的復甦結構依然偏建設性,但SOL目前正處於$100.59–$104.64這一阻力區下方的盤整。多頭需要重新奪回該區域,並突破$107.07–$109.91區間,才能迎來下一輪更大級別的上行動能擴張。
📈 均線結構
20日均線:$99.62
50日均線:$92.58
100日均線:$87.71
200日均線:$91.88
SOL目前正在測試20日均線($99.62)。
更廣泛的復甦結構依然偏建設性,但SOL目前正處於$100.59–$104.64這一阻力區下方的盤整。多頭需要重新奪回該區域,並突破$107.07–$109.91區間,才能迎來下一輪更大級別的上行動能擴張。
📈 均線結構
20日均線:$99.62
50日均線:$92.58
100日均線:$87.71
200日均線:$91.88
SOL目前正在測試20日均線($99.62)。
62
·
--
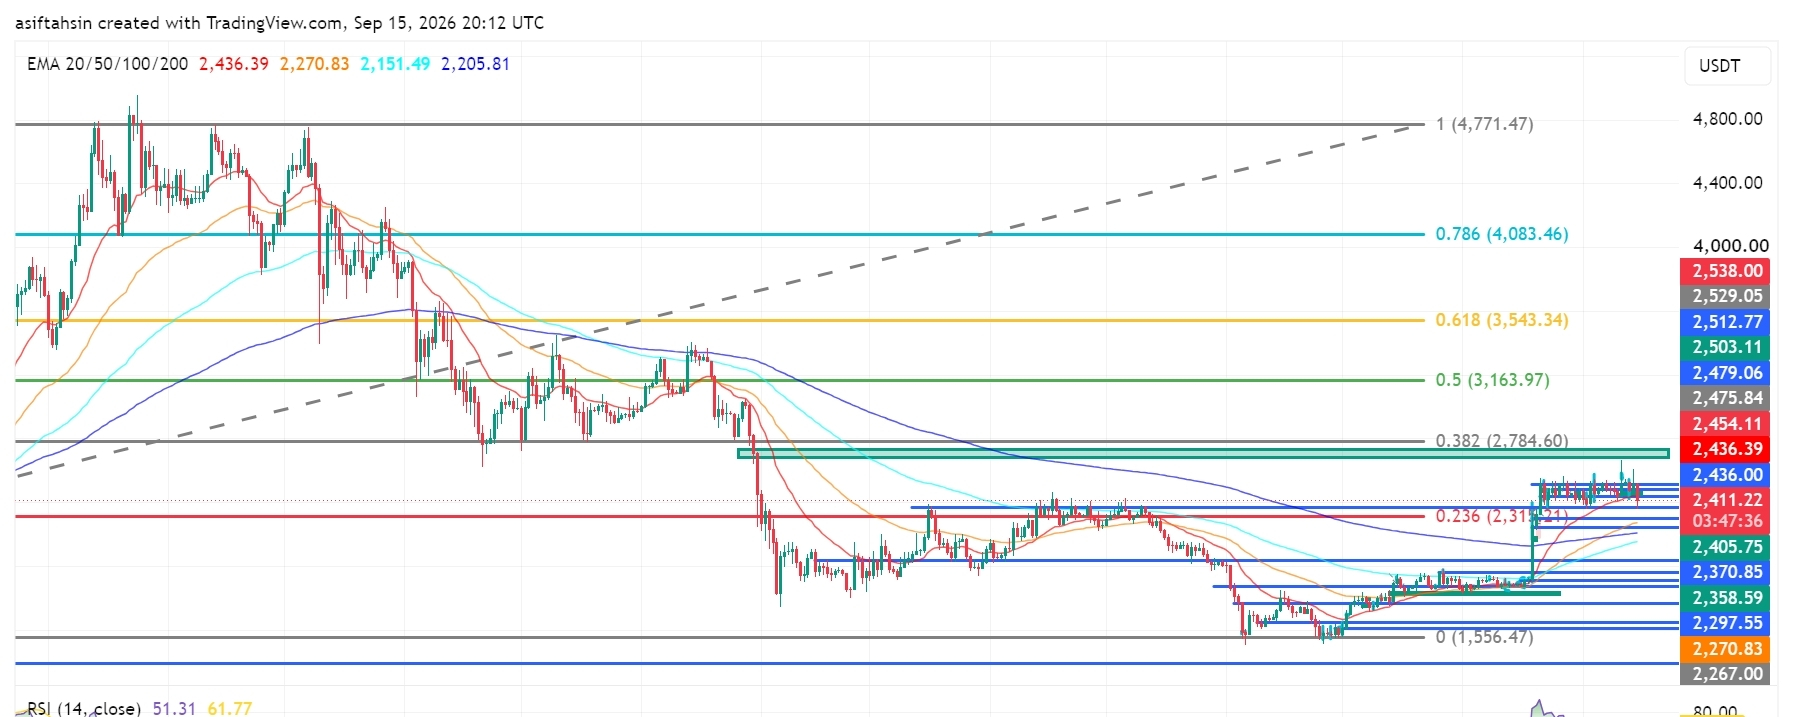
文章
ETH技術展望:以太坊守住$2.4K,空頭防守修復勢頭ETH目前在約$2.41K附近交易,在近期從$2.27K–$2.30K需求區域反彈之後,守住了$2.40K–$2.41K支撐區。
更廣泛的修復結構依然偏建設性,但ETH目前正在$2.436K–$2.454K阻力區下方整固。多頭需要重新收復該區域,並突破$2,538,才能迎來下一輪更重要的上行擴展。
📈 EMA結構
20 EMA:$2,436.39
50 EMA:$2,270.83
100 EMA:$2,151.49
200 EMA:$2,205.81
ETH仍位於50、100和200日EMA之上。
$2,436.39 的20日EMA目前是關鍵的短期阻力位。若能持續收復該價位,將強化看漲修復結構。
ETH技術展望:以太坊守住$2.4K,空頭防守修復勢頭
ETH目前在約$2.41K附近交易,在近期從$2.27K–$2.30K需求區域反彈之後,守住了$2.40K–$2.41K支撐區。
更廣泛的修復結構依然偏建設性,但ETH目前正在$2.436K–$2.454K阻力區下方整固。多頭需要重新收復該區域,並突破$2,538,才能迎來下一輪更重要的上行擴展。
📈 EMA結構
20 EMA:$2,436.39
50 EMA:$2,270.83
100 EMA:$2,151.49
200 EMA:$2,205.81
ETH仍位於50、100和200日EMA之上。
$2,436.39 的20日EMA目前是關鍵的短期阻力位。若能持續收復該價位,將強化看漲修復結構。
更廣泛的修復結構依然偏建設性,但ETH目前正在$2.436K–$2.454K阻力區下方整固。多頭需要重新收復該區域,並突破$2,538,才能迎來下一輪更重要的上行擴展。
📈 EMA結構
20 EMA:$2,436.39
50 EMA:$2,270.83
100 EMA:$2,151.49
200 EMA:$2,205.81
ETH仍位於50、100和200日EMA之上。
$2,436.39 的20日EMA目前是關鍵的短期阻力位。若能持續收復該價位,將強化看漲修復結構。
63
·
--
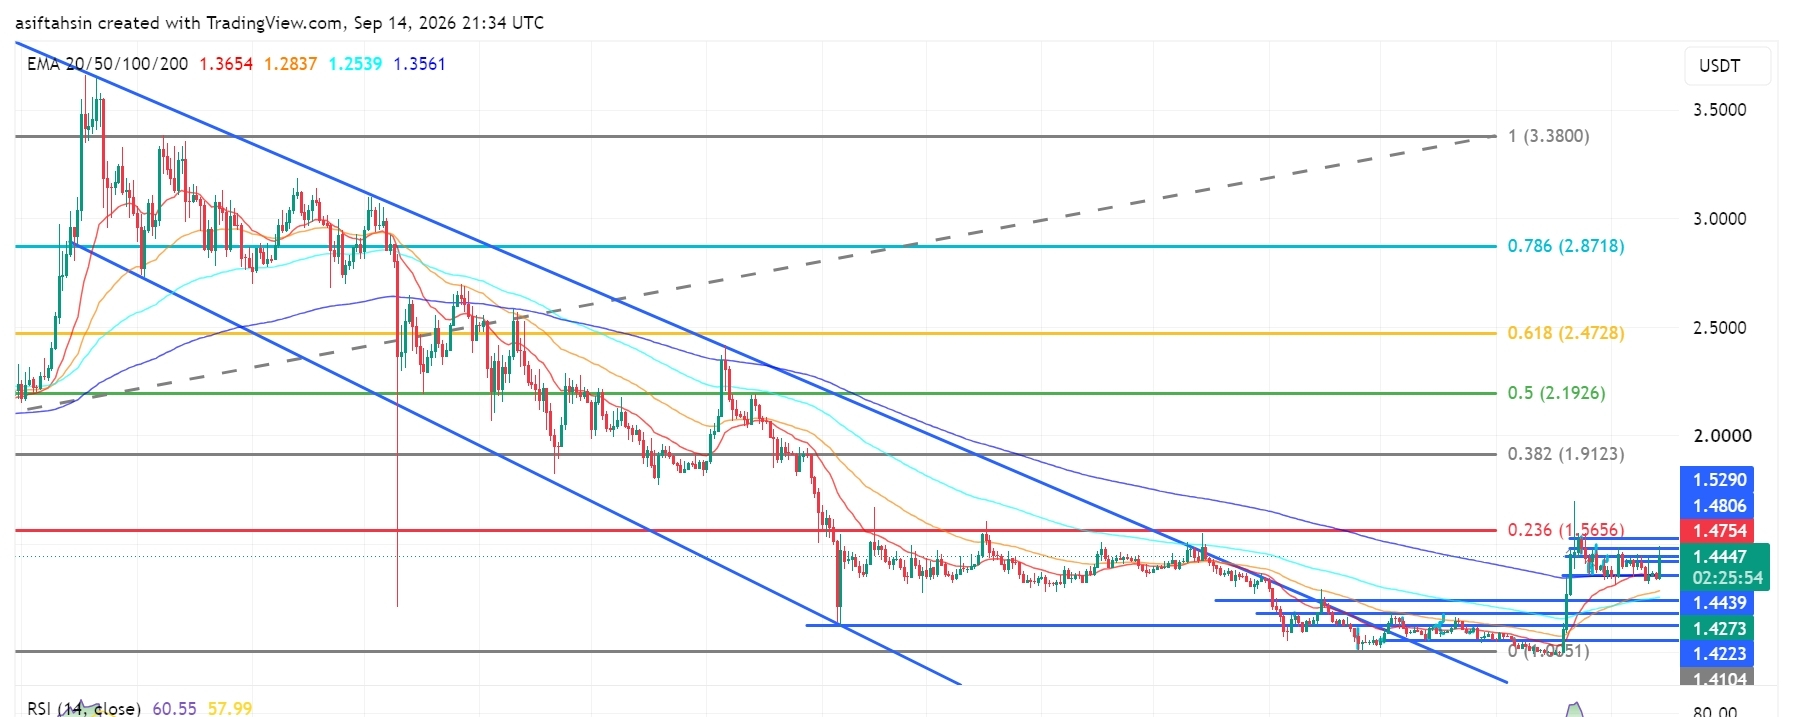
文章
XRP技術前景:XRP守在1.40美元上方,多頭目標指向1.56美元XRP目前在約1.44美元附近交易,在6月-7月低點強勁反彈之後,正於重要的1.40美元心理關口上方進行整固。
整體結構已顯著改善,目前XRP已站上四條主要指數移動平均線(EMA)。不過,價格正接近關鍵阻力區間,約在1.475–1.53美元。多頭需要在該區域上方實現乾淨的突破,才能爲指向1.5656美元斐波那契阻力位鋪路。
📈 均線結構
20日均線(EMA):1.3653美元
50日均線(EMA):1.2837美元
100日均線(EMA):1.2539美元
200日均線(EMA):1.3561美元
XRP技術前景:XRP守在1.40美元上方,多頭目標指向1.56美元
XRP目前在約1.44美元附近交易,在6月-7月低點強勁反彈之後,正於重要的1.40美元心理關口上方進行整固。
整體結構已顯著改善,目前XRP已站上四條主要指數移動平均線(EMA)。不過,價格正接近關鍵阻力區間,約在1.475–1.53美元。多頭需要在該區域上方實現乾淨的突破,才能爲指向1.5656美元斐波那契阻力位鋪路。
📈 均線結構
20日均線(EMA):1.3653美元
50日均線(EMA):1.2837美元
100日均線(EMA):1.2539美元
200日均線(EMA):1.3561美元
整體結構已顯著改善,目前XRP已站上四條主要指數移動平均線(EMA)。不過,價格正接近關鍵阻力區間,約在1.475–1.53美元。多頭需要在該區域上方實現乾淨的突破,才能爲指向1.5656美元斐波那契阻力位鋪路。
📈 均線結構
20日均線(EMA):1.3653美元
50日均線(EMA):1.2837美元
100日均線(EMA):1.2539美元
200日均線(EMA):1.3561美元
2
1
1.2k
·
--
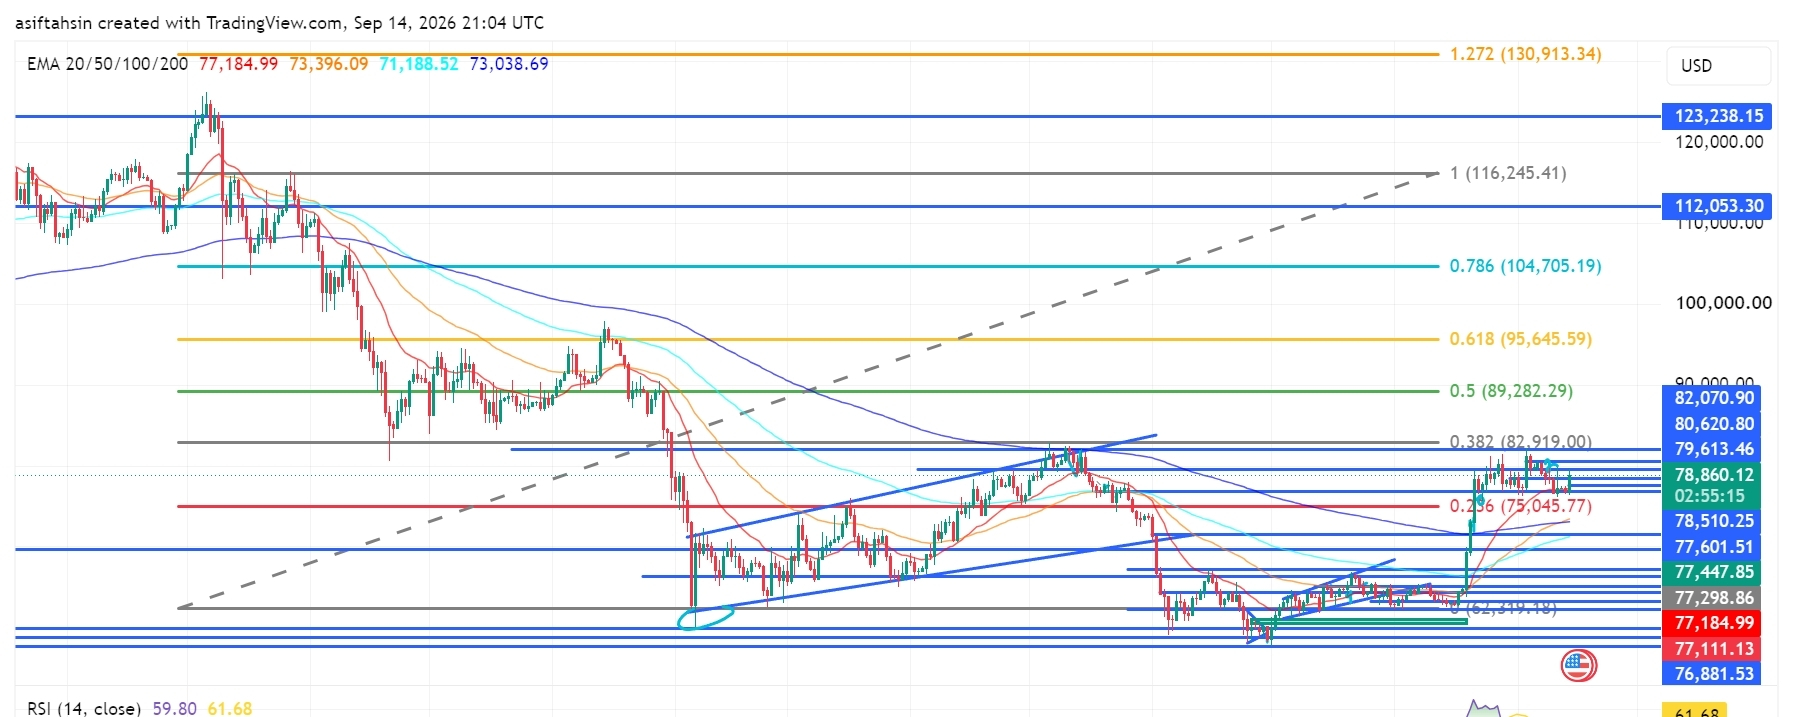
文章
比特幣(BTC)技術展望:BTC守住78K, 多頭瞄準80K–83K阻力BTC目前在$78,860附近交易,在經歷了6月低點的強勁反彈後,正於$78K上方進行盤整。
更大的結構仍然保持看多:BTC在四條主要均線之上交易。不過,價格目前正接近一處重要的阻力集羣,區間在$79,613–$82,070。多頭需要在該區域之上實現一次乾淨的突破,才能打開通往$82,919斐波那契阻力位的路徑,並可能進一步衝擊更高水平。
📈 均線結構
20 EMA: $77,182.98
50 EMA: $73,395.26
100 EMA: $71,188.10
比特幣(BTC)技術展望:BTC守住78K, 多頭瞄準80K–83K阻力
BTC目前在$78,860附近交易,在經歷了6月低點的強勁反彈後,正於$78K上方進行盤整。
更大的結構仍然保持看多:BTC在四條主要均線之上交易。不過,價格目前正接近一處重要的阻力集羣,區間在$79,613–$82,070。多頭需要在該區域之上實現一次乾淨的突破,才能打開通往$82,919斐波那契阻力位的路徑,並可能進一步衝擊更高水平。
📈 均線結構
20 EMA: $77,182.98
50 EMA: $73,395.26
100 EMA: $71,188.10
更大的結構仍然保持看多:BTC在四條主要均線之上交易。不過,價格目前正接近一處重要的阻力集羣,區間在$79,613–$82,070。多頭需要在該區域之上實現一次乾淨的突破,才能打開通往$82,919斐波那契阻力位的路徑,並可能進一步衝擊更高水平。
📈 均線結構
20 EMA: $77,182.98
50 EMA: $73,395.26
100 EMA: $71,188.10
69
·
--
文章
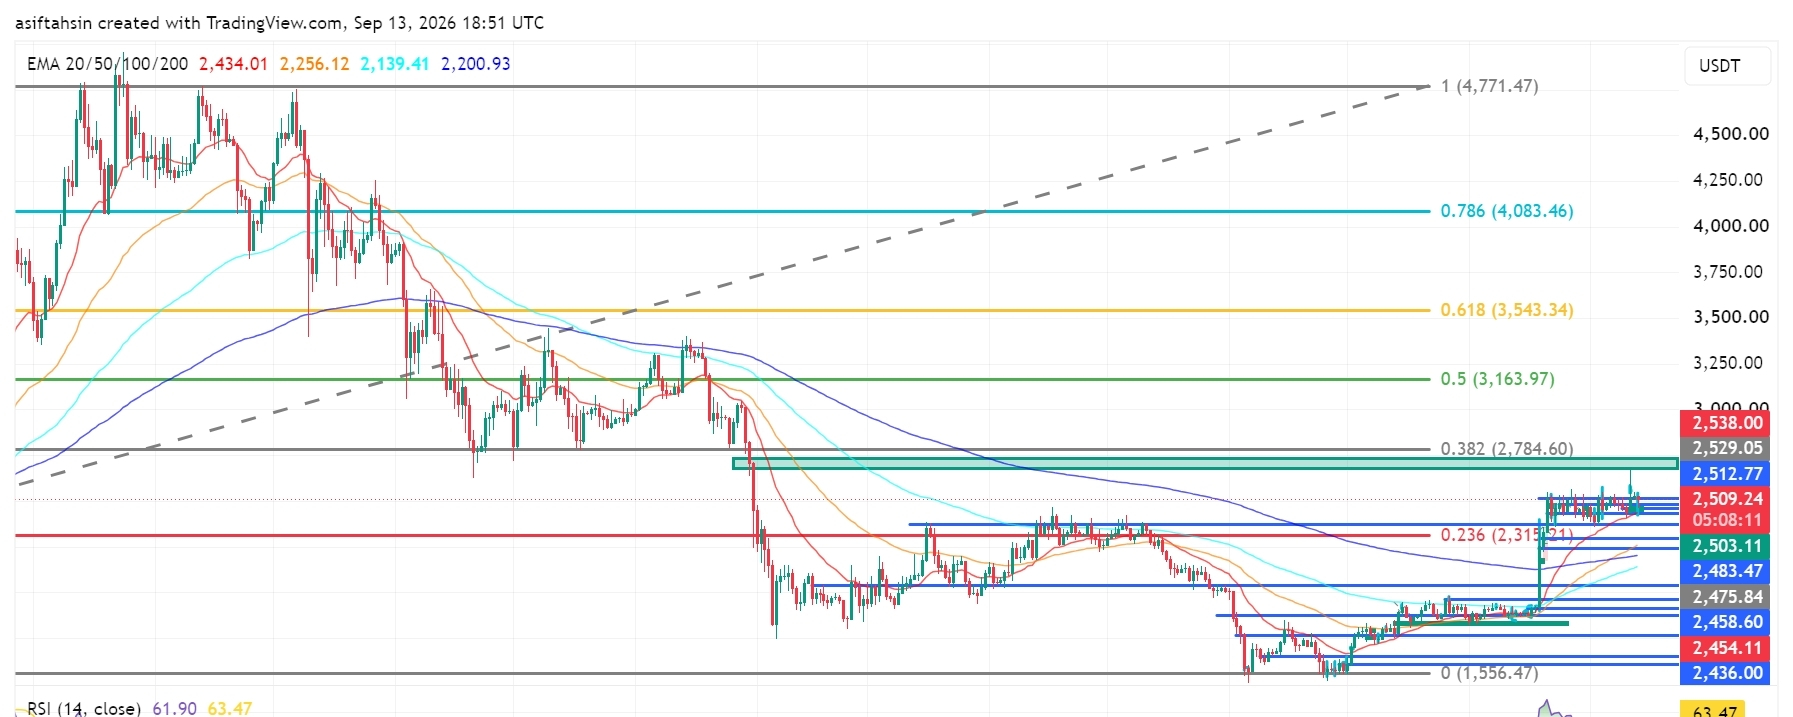
Solana(SOL)技術展望:SOL 守住 $100, 多頭瞄準更高阻力SOL 當前約在 $101.25 附近交易,在從 6 月低點強勁反彈之後,鞏固在心理關口 $100 上方。
更廣泛的結構顯示出改善跡象:目前 SOL 正在所有四條主要均線之上交易。不過,價格正面臨位於 $102.29–$104.64 附近的顯著阻力密集區。多頭需要對該區域進行明確的突破,才能打開通往 $107–$109 區域以及 $129.49 斐波那契阻力位的路徑。
📈 均線結構
20 EMA: $99.76
50 EMA: $92.04
100 EMA: $87.25
Solana(SOL)技術展望:SOL 守住 $100, 多頭瞄準更高阻力
SOL 當前約在 $101.25 附近交易,在從 6 月低點強勁反彈之後,鞏固在心理關口 $100 上方。
更廣泛的結構顯示出改善跡象:目前 SOL 正在所有四條主要均線之上交易。不過,價格正面臨位於 $102.29–$104.64 附近的顯著阻力密集區。多頭需要對該區域進行明確的突破,才能打開通往 $107–$109 區域以及 $129.49 斐波那契阻力位的路徑。
📈 均線結構
20 EMA: $99.76
50 EMA: $92.04
100 EMA: $87.25
更廣泛的結構顯示出改善跡象:目前 SOL 正在所有四條主要均線之上交易。不過,價格正面臨位於 $102.29–$104.64 附近的顯著阻力密集區。多頭需要對該區域進行明確的突破,才能打開通往 $107–$109 區域以及 $129.49 斐波那契阻力位的路徑。
📈 均線結構
20 EMA: $99.76
50 EMA: $92.04
100 EMA: $87.25
61
·
--
文章
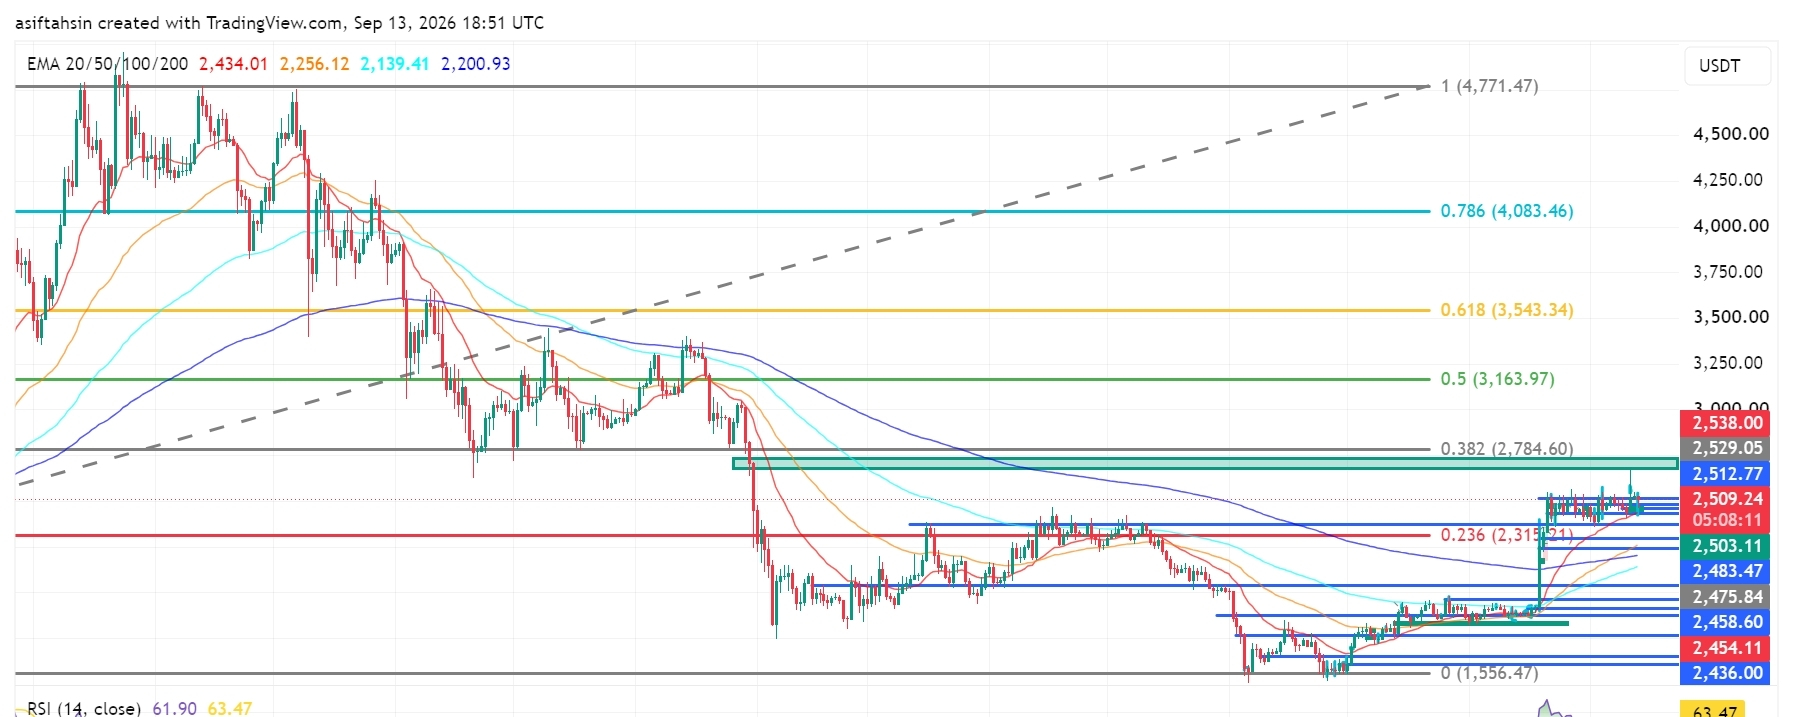
ETH技術前景:以太坊守住$2.5K, 多頭瞄準更高阻力ETH目前交易價格約在$2,509,正在$2,500這一心理關口上方盤整。此前從6月低點強勢反彈後,價格維持在該區域之上。
整體結構仍偏向積極,ETH交易價格位於四條主要EMAs之上。不過,價格正接近一組重要阻力區,約在$2,512–$2,538。多頭需要在該區域上方實現明確突破,纔可能打開通往$2,784斐波那契阻力位的路徑。
📈 EMA結構
20 EMA: $2,434.01
50 EMA: $2,256.12
100 EMA: $2,139.41
200 EMA: $2,200.93
ETH技術前景:以太坊守住$2.5K, 多頭瞄準更高阻力
ETH目前交易價格約在$2,509,正在$2,500這一心理關口上方盤整。此前從6月低點強勢反彈後,價格維持在該區域之上。
整體結構仍偏向積極,ETH交易價格位於四條主要EMAs之上。不過,價格正接近一組重要阻力區,約在$2,512–$2,538。多頭需要在該區域上方實現明確突破,纔可能打開通往$2,784斐波那契阻力位的路徑。
📈 EMA結構
20 EMA: $2,434.01
50 EMA: $2,256.12
100 EMA: $2,139.41
200 EMA: $2,200.93
整體結構仍偏向積極,ETH交易價格位於四條主要EMAs之上。不過,價格正接近一組重要阻力區,約在$2,512–$2,538。多頭需要在該區域上方實現明確突破,纔可能打開通往$2,784斐波那契阻力位的路徑。
📈 EMA結構
20 EMA: $2,434.01
50 EMA: $2,256.12
100 EMA: $2,139.41
200 EMA: $2,200.93
83
·
--
文章
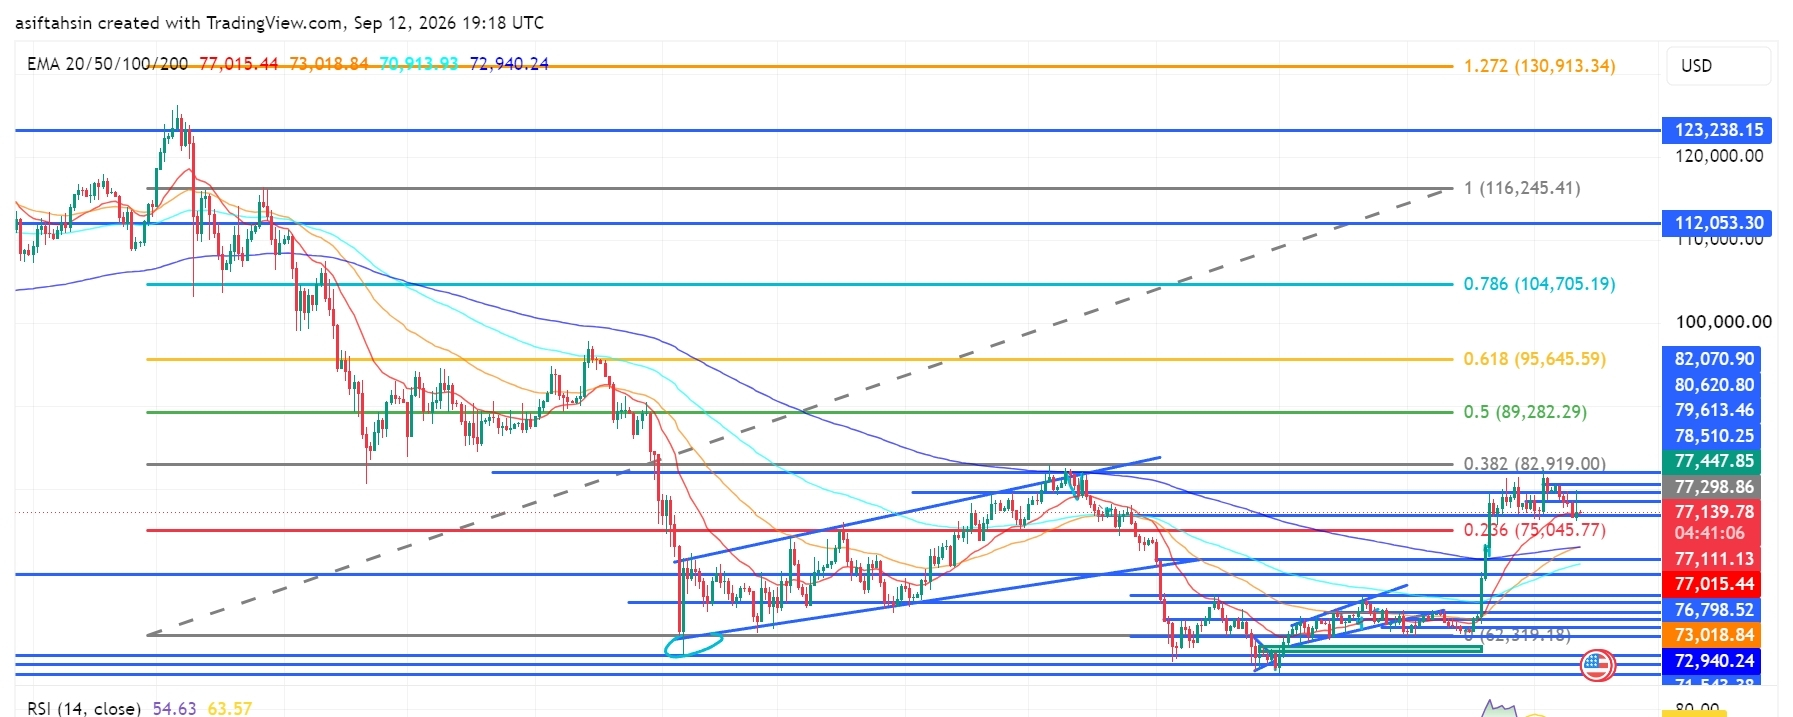
BTC 技術面展望:比特幣守住 $77K,空頭防守突破BTC 目前在約 $77.1K 處交易,在近期看漲反彈之後,盤整於 $75K–$77K 突破區間之上。
更大的結構仍然偏建設性,但 BTC 在約 $77.4K–$82.9K 附近面臨強勁阻力。多頭需要重新奪回這一阻力區間,並突破 $82,919 的斐波那契水平,才能打開下一輪更大幅度的上行空間。
📈 EMA 結構
20 EMA:$77,015.44
50 EMA:$73,018.84
100 EMA:$70,913.93
200 EMA:$72,940.24
BTC 目前守在 20 EMA 之上,同時仍位於 50、100 和 200 EMA 之上。
BTC 技術面展望:比特幣守住 $77K,空頭防守突破
BTC 目前在約 $77.1K 處交易,在近期看漲反彈之後,盤整於 $75K–$77K 突破區間之上。
更大的結構仍然偏建設性,但 BTC 在約 $77.4K–$82.9K 附近面臨強勁阻力。多頭需要重新奪回這一阻力區間,並突破 $82,919 的斐波那契水平,才能打開下一輪更大幅度的上行空間。
📈 EMA 結構
20 EMA:$77,015.44
50 EMA:$73,018.84
100 EMA:$70,913.93
200 EMA:$72,940.24
BTC 目前守在 20 EMA 之上,同時仍位於 50、100 和 200 EMA 之上。
更大的結構仍然偏建設性,但 BTC 在約 $77.4K–$82.9K 附近面臨強勁阻力。多頭需要重新奪回這一阻力區間,並突破 $82,919 的斐波那契水平,才能打開下一輪更大幅度的上行空間。
📈 EMA 結構
20 EMA:$77,015.44
50 EMA:$73,018.84
100 EMA:$70,913.93
200 EMA:$72,940.24
BTC 目前守在 20 EMA 之上,同時仍位於 50、100 和 200 EMA 之上。
37
登入以探索更多內容
加入幣安廣場中的全球加密貨幣用戶
⚡️ 獲取加密貨幣的最新和實用資訊。
💬 受到全球最大加密貨幣交易所的信任。
👍 發掘來自經過驗證創作者的真實見解。
電子郵件 / 電話號碼
熱門話題
AI股持续上涨还有哪些投资机会
186,413 次瀏覽
867 討論中
快問快答!參與發佈熱門話題贏流量
✨本期話題: AI股持續上漲還有哪些投資機會?
👉參與方式:
發佈短文或是長文並帶主話題 #AI股持续上涨还有哪些投资机会
分享您是看漲還是看跌,或是曬出您的持倉
內容正文建議,如:
- 英偉達稱明年芯片銷量或將翻倍,頭部AI公司營收預測屢創新高,背後算力投入同樣驚人。你認爲AI需求真的起飛了嗎?這種需求能持續多久?近日AI股上漲,你覺得這波AI股票行情是強勢反攻,還是短期反彈?
- Anthropic、OpenAI 等行業大佬呼籲放緩AI發展速度,特朗普卻計劃組建AI軍隊,稱AI未來或佔美國GDP的25%。你更認同哪一方?政府下場會成爲AI股的長期利好嗎?
- 你會佈局AI股嗎?請使用曬單卡片曬出你的AI股票相關標的交易/持倉。
⏰本期開放投稿時間:
- 2026年9月22日 15:00 - 2026年9月24日12:00 (東八區時間)
🎁活動獎勵:
- 流量扶持:符合活動要求且被評選上的優質內容,隨機獲得500 - 3000流量扶持激勵(最少發佈100字,按以上方向發佈的帖文被選上的機會更大哦, 獲得流量激勵的帖文作者將收到小祕書通知)
- 官方曝光:評選上的優質內容將有機會被官方賬號推薦
獲取內容發佈靈感,請參考話題頁#AI股持续上涨还有哪些投资机会 或廣場内容流量诊断清单
币安广场
·295 人按讚
·362.5k 次瀏覽
比特币突破5月高点逼近8.6万美元
46,840 次瀏覽
307 討論中
狗狗币上涨15%
56,623 次瀏覽
250 討論中