

Ether Guru 1
146 貼文

Ether Guru 1
舉報
封鎖用戶
Where experience meets discipline. Crypto isn’t luck — it’s mindset 💭
0 關注
6 粉絲
26 點讚數
貼文
·
--
查看翻譯
$BTC SHE EARNS $58,000. BUT WOULD QUITTING HER JOB ACTUALLY SAVE MONEY?
Her husband’s promotion changed the conversation at home.
He now earns around $186,000 annually, while she brings in $58,000. With a three-year-old daughter and daycare bills approaching $2,000 a month, he suggested she consider becoming a stay-at-home mom.
The idea sounds reasonable until you look beyond the monthly bills.
Daycare alone costs about $24,000 annually. Add commuting, work lunches, and other job expenses, and a meaningful portion of her paycheck may disappear before it reaches the family budget.
But there’s another side to this calculation.
If she leaves her job, the household loses more than a salary. It may also lose employer retirement contributions, opportunities for raises, and years of career growth.
And there’s a risk families sometimes underestimate: returning to work later might mean starting at a lower salary or spending months searching for the right position.
Meanwhile, relying on one income creates a different kind of financial exposure. If that paycheck disappears, the family has no second salary to fall back on.
Before deciding, they could calculate her actual take-home pay after work-related expenses, compare both household budgets, and explore flexible work or part-time childcare arrangements.
Because the question isn't simply whether daycare is expensive.
It's whether the family's long-term financial position would change after accounting for everything her job provides.
A paycheck has value beyond its monthly deposit.
$BTC SHE EARNS $58,000. BUT WOULD QUITTING HER JOB ACTUALLY SAVE MONEY?
Her husband’s promotion changed the conversation at home.
He now earns around $186,000 annually, while she brings in $58,000. With a three-year-old daughter and daycare bills approaching $2,000 a month, he suggested she consider becoming a stay-at-home mom.
The idea sounds reasonable until you look beyond the monthly bills.
Daycare alone costs about $24,000 annually. Add commuting, work lunches, and other job expenses, and a meaningful portion of her paycheck may disappear before it reaches the family budget.
But there’s another side to this calculation.
If she leaves her job, the household loses more than a salary. It may also lose employer retirement contributions, opportunities for raises, and years of career growth.
And there’s a risk families sometimes underestimate: returning to work later might mean starting at a lower salary or spending months searching for the right position.
Meanwhile, relying on one income creates a different kind of financial exposure. If that paycheck disappears, the family has no second salary to fall back on.
Before deciding, they could calculate her actual take-home pay after work-related expenses, compare both household budgets, and explore flexible work or part-time childcare arrangements.
Because the question isn't simply whether daycare is expensive.
It's whether the family's long-term financial position would change after accounting for everything her job provides.
A paycheck has value beyond its monthly deposit.
Her husband’s promotion changed the conversation at home.
He now earns around $186,000 annually, while she brings in $58,000. With a three-year-old daughter and daycare bills approaching $2,000 a month, he suggested she consider becoming a stay-at-home mom.
The idea sounds reasonable until you look beyond the monthly bills.
Daycare alone costs about $24,000 annually. Add commuting, work lunches, and other job expenses, and a meaningful portion of her paycheck may disappear before it reaches the family budget.
But there’s another side to this calculation.
If she leaves her job, the household loses more than a salary. It may also lose employer retirement contributions, opportunities for raises, and years of career growth.
And there’s a risk families sometimes underestimate: returning to work later might mean starting at a lower salary or spending months searching for the right position.
Meanwhile, relying on one income creates a different kind of financial exposure. If that paycheck disappears, the family has no second salary to fall back on.
Before deciding, they could calculate her actual take-home pay after work-related expenses, compare both household budgets, and explore flexible work or part-time childcare arrangements.
Because the question isn't simply whether daycare is expensive.
It's whether the family's long-term financial position would change after accounting for everything her job provides.
A paycheck has value beyond its monthly deposit.
54
·
--
查看翻譯
$BTC 3 BITCOIN COULD COST HIM MORE THAN MONEY.
A friend already owns 3+ BTC bought below $30,000, roughly $2 million in income-producing real estate with equity, and more than $400,000 in cash.
Now his wife wants him to buy another 3 BTC before Bitcoin climbs back above $100,000.
But he has three teenagers approaching college age.
And that changes the calculation.
Buying 3 BTC at $85,000 each would require about $255,000 before fees.
From $400,000 in cash, that leaves just $145,000.
If tuition, property repairs, vacancies or another unexpected expense arrives, he may have to sell assets at an inconvenient time.
His real estate may be valuable, but equity isn't the same as cash. Accessing it can take time, cost money and depend on financing conditions.
And Bitcoin could rise above $100,000—or fall sharply before it gets there.
Nobody knows which happens first.
The decision isn't simply whether 3 more BTC would be a good investment.
It's whether the potential upside justifies reducing the family's readily available financial cushion while major education expenses are approaching.
He could estimate the next several years of college costs, property expenses and household spending first, then determine how much cash is genuinely available for investing.
An opportunity matters less if it weakens your financial flexibility.
$BTC 3 BITCOIN COULD COST HIM MORE THAN MONEY.
A friend already owns 3+ BTC bought below $30,000, roughly $2 million in income-producing real estate with equity, and more than $400,000 in cash.
Now his wife wants him to buy another 3 BTC before Bitcoin climbs back above $100,000.
But he has three teenagers approaching college age.
And that changes the calculation.
Buying 3 BTC at $85,000 each would require about $255,000 before fees.
From $400,000 in cash, that leaves just $145,000.
If tuition, property repairs, vacancies or another unexpected expense arrives, he may have to sell assets at an inconvenient time.
His real estate may be valuable, but equity isn't the same as cash. Accessing it can take time, cost money and depend on financing conditions.
And Bitcoin could rise above $100,000—or fall sharply before it gets there.
Nobody knows which happens first.
The decision isn't simply whether 3 more BTC would be a good investment.
It's whether the potential upside justifies reducing the family's readily available financial cushion while major education expenses are approaching.
He could estimate the next several years of college costs, property expenses and household spending first, then determine how much cash is genuinely available for investing.
An opportunity matters less if it weakens your financial flexibility.
A friend already owns 3+ BTC bought below $30,000, roughly $2 million in income-producing real estate with equity, and more than $400,000 in cash.
Now his wife wants him to buy another 3 BTC before Bitcoin climbs back above $100,000.
But he has three teenagers approaching college age.
And that changes the calculation.
Buying 3 BTC at $85,000 each would require about $255,000 before fees.
From $400,000 in cash, that leaves just $145,000.
If tuition, property repairs, vacancies or another unexpected expense arrives, he may have to sell assets at an inconvenient time.
His real estate may be valuable, but equity isn't the same as cash. Accessing it can take time, cost money and depend on financing conditions.
And Bitcoin could rise above $100,000—or fall sharply before it gets there.
Nobody knows which happens first.
The decision isn't simply whether 3 more BTC would be a good investment.
It's whether the potential upside justifies reducing the family's readily available financial cushion while major education expenses are approaching.
He could estimate the next several years of college costs, property expenses and household spending first, then determine how much cash is genuinely available for investing.
An opportunity matters less if it weakens your financial flexibility.
64
·
--
查看翻譯
$BTC FOUR YEARS CAN CHANGE THE BITCOIN MATH FAST.
On September 27, 2022, Bitcoin was around $18,802.
Four years later, the reference price is about $84,625.
That works out to roughly a 46% annualized growth rate.
Now comes the interesting part.
If Bitcoin somehow repeated that exact 46% CAGR for another four years, the math would put BTC near $381,000 by September 2030.
Rounded up, that's the often-mentioned $385K scenario.
But there’s a huge difference between calculating a return and predicting one.
Bitcoin did not rise 46% every year.
Some periods were dramatically stronger, while others produced deep drawdowns.
So the $385K figure isn't a forecast.
It's simply what happens when you extend the previous four-year annualized growth rate forward for another four years.
That distinction matters whenever historical performance gets turned into future price targets.
Past compounding creates scenarios, not promises.
$BTC FOUR YEARS CAN CHANGE THE BITCOIN MATH FAST.
On September 27, 2022, Bitcoin was around $18,802.
Four years later, the reference price is about $84,625.
That works out to roughly a 46% annualized growth rate.
Now comes the interesting part.
If Bitcoin somehow repeated that exact 46% CAGR for another four years, the math would put BTC near $381,000 by September 2030.
Rounded up, that's the often-mentioned $385K scenario.
But there’s a huge difference between calculating a return and predicting one.
Bitcoin did not rise 46% every year.
Some periods were dramatically stronger, while others produced deep drawdowns.
So the $385K figure isn't a forecast.
It's simply what happens when you extend the previous four-year annualized growth rate forward for another four years.
That distinction matters whenever historical performance gets turned into future price targets.
Past compounding creates scenarios, not promises.
On September 27, 2022, Bitcoin was around $18,802.
Four years later, the reference price is about $84,625.
That works out to roughly a 46% annualized growth rate.
Now comes the interesting part.
If Bitcoin somehow repeated that exact 46% CAGR for another four years, the math would put BTC near $381,000 by September 2030.
Rounded up, that's the often-mentioned $385K scenario.
But there’s a huge difference between calculating a return and predicting one.
Bitcoin did not rise 46% every year.
Some periods were dramatically stronger, while others produced deep drawdowns.
So the $385K figure isn't a forecast.
It's simply what happens when you extend the previous four-year annualized growth rate forward for another four years.
That distinction matters whenever historical performance gets turned into future price targets.
Past compounding creates scenarios, not promises.
4
·
--
查看翻譯
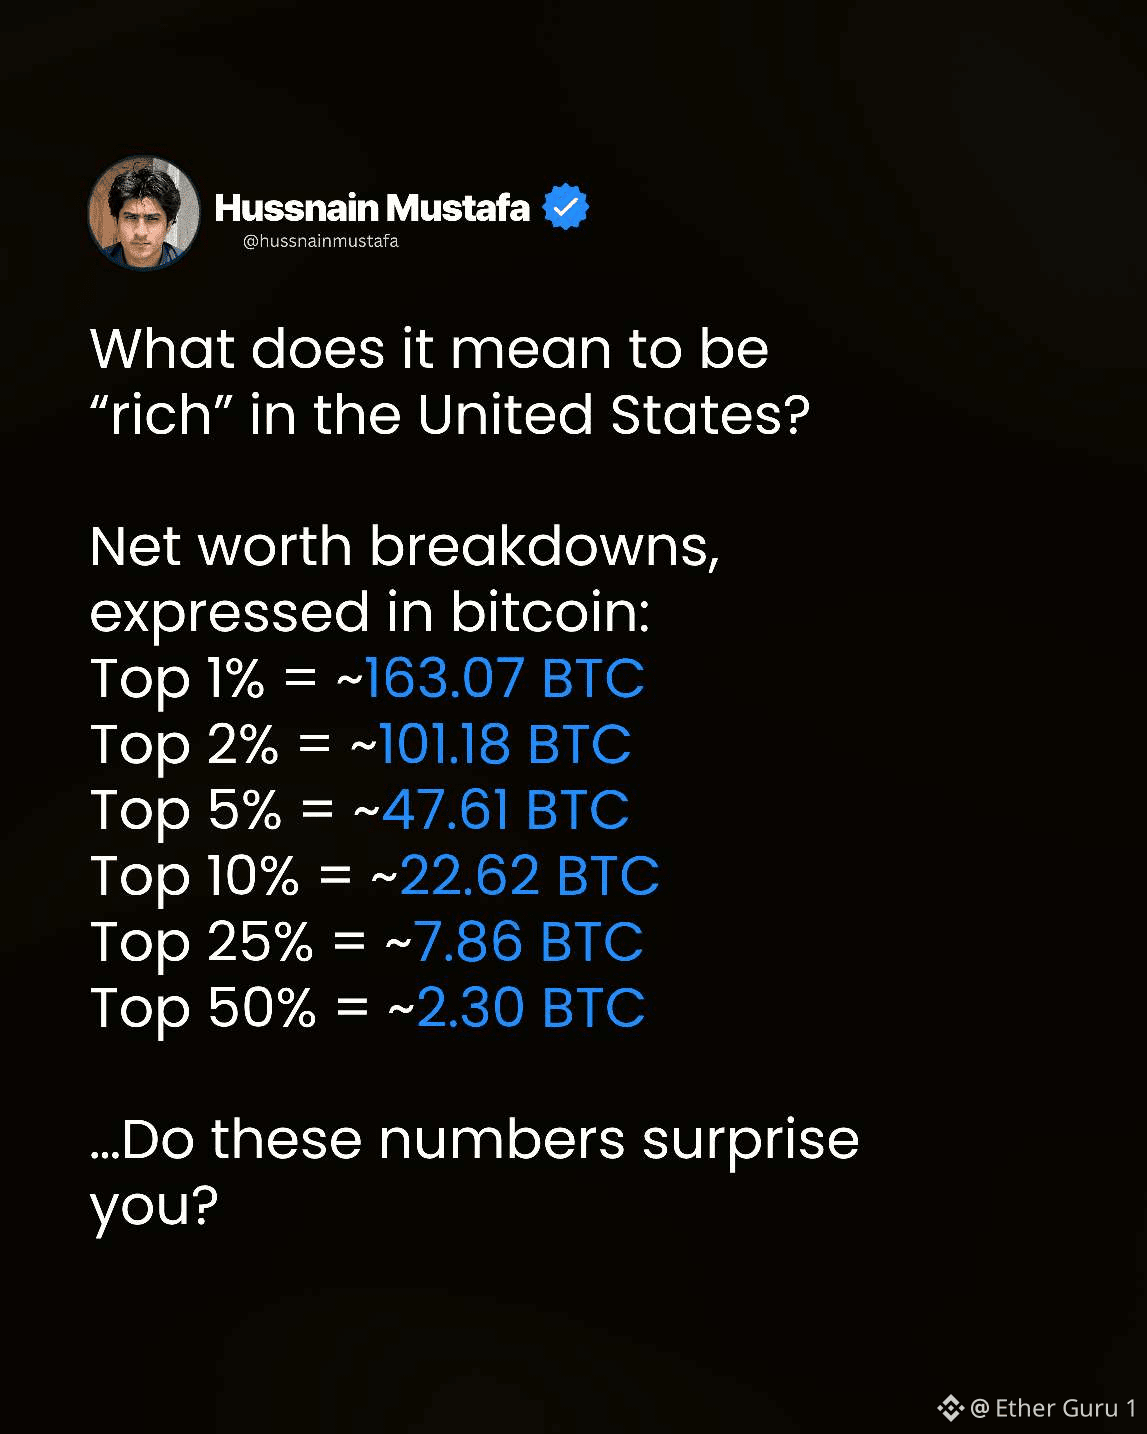
$BTC WHAT IF AMERICAN WEALTH WERE MEASURED IN BTC?
Using a fixed Bitcoin price can make the numbers look surprisingly simple.
But there’s an important catch:
A net-worth threshold measured in BTC changes every time Bitcoin’s dollar price changes.
If a household has $1 million in net worth, that represents about 11.8 BTC at an $85,000 Bitcoin price.
At $170,000, the same $1 million would equal only about 5.9 BTC.
The household didn't become poorer.
The BTC measurement changed.
That’s why converting U.S. wealth percentiles into Bitcoin is more of a thought experiment than a permanent definition of being rich.
It also shows something important about Bitcoin:
As the BTC price rises, the amount of Bitcoin needed to represent the same dollar wealth falls.
Bitcoin can change the measuring stick without changing wealth.
$BTC WHAT IF AMERICAN WEALTH WERE MEASURED IN BTC?
Using a fixed Bitcoin price can make the numbers look surprisingly simple.
But there’s an important catch:
A net-worth threshold measured in BTC changes every time Bitcoin’s dollar price changes.
If a household has $1 million in net worth, that represents about 11.8 BTC at an $85,000 Bitcoin price.
At $170,000, the same $1 million would equal only about 5.9 BTC.
The household didn't become poorer.
The BTC measurement changed.
That’s why converting U.S. wealth percentiles into Bitcoin is more of a thought experiment than a permanent definition of being rich.
It also shows something important about Bitcoin:
As the BTC price rises, the amount of Bitcoin needed to represent the same dollar wealth falls.
Bitcoin can change the measuring stick without changing wealth.
Using a fixed Bitcoin price can make the numbers look surprisingly simple.
But there’s an important catch:
A net-worth threshold measured in BTC changes every time Bitcoin’s dollar price changes.
If a household has $1 million in net worth, that represents about 11.8 BTC at an $85,000 Bitcoin price.
At $170,000, the same $1 million would equal only about 5.9 BTC.
The household didn't become poorer.
The BTC measurement changed.
That’s why converting U.S. wealth percentiles into Bitcoin is more of a thought experiment than a permanent definition of being rich.
It also shows something important about Bitcoin:
As the BTC price rises, the amount of Bitcoin needed to represent the same dollar wealth falls.
Bitcoin can change the measuring stick without changing wealth.
66
·
--
查看翻譯
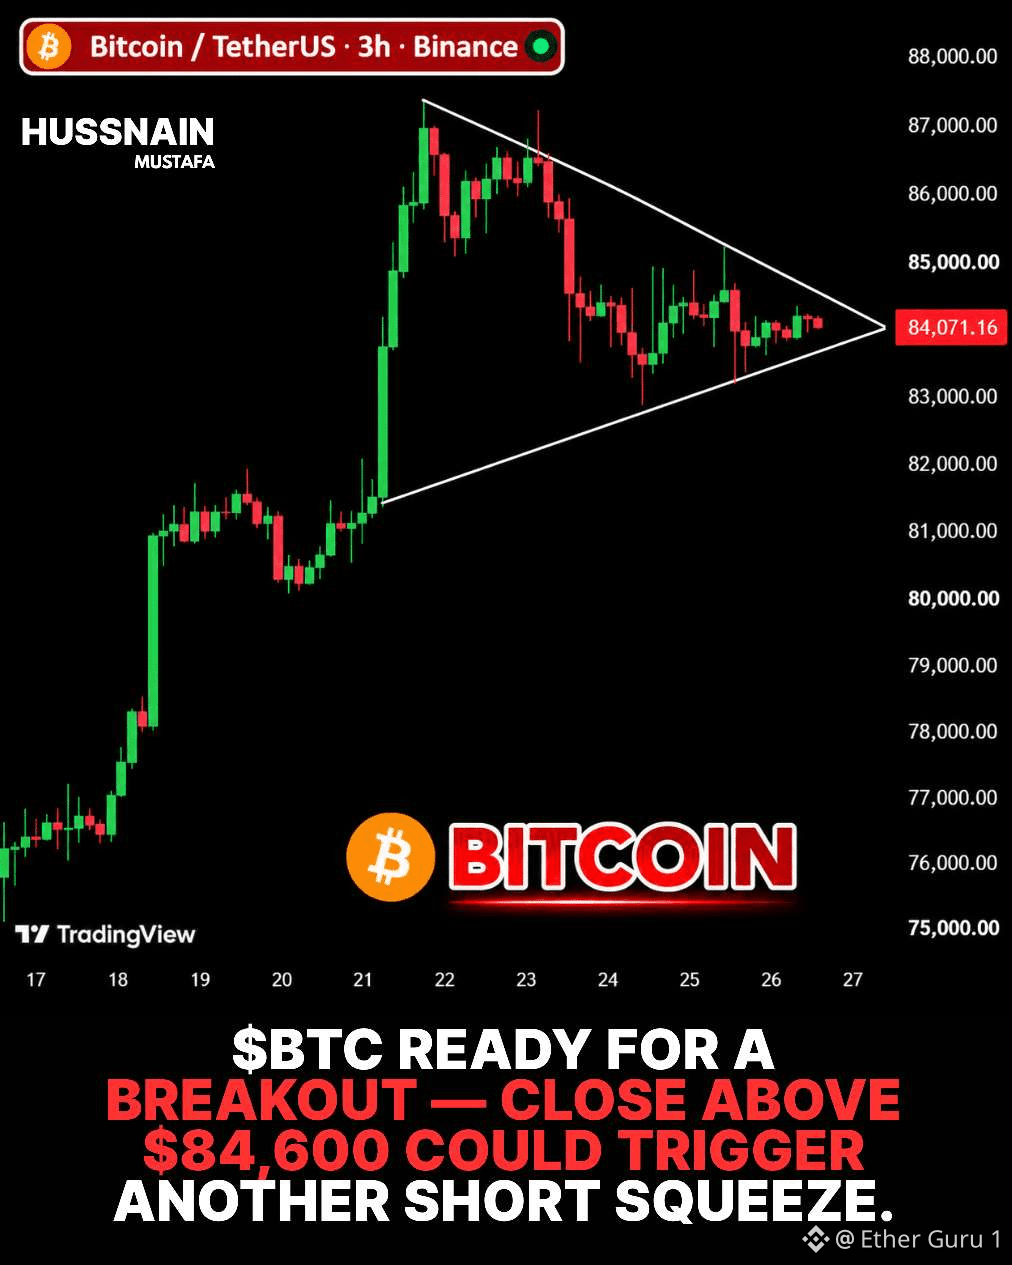
$BTC BITCOIN ALREADY BROKE THE LEVEL.
The more interesting question now is what happens after the squeeze.
BTC pushed through the $84,000 area and reached roughly $87,000 this week.
A major reason for the speed was forced short covering.
When heavily leveraged shorts get liquidated, exchanges close those positions by buying back BTC.
That buying can create a chain reaction:
Higher price.
More liquidations.
More forced buying.
But there’s a catch.
Liquidations are temporary fuel.
Once those positions are gone, the market needs actual buyers to keep the move going.
That makes the next few sessions more informative than the breakout headline itself.
A squeeze can start a move; demand must sustain it.
$BTC BITCOIN ALREADY BROKE THE LEVEL.
The more interesting question now is what happens after the squeeze.
BTC pushed through the $84,000 area and reached roughly $87,000 this week.
A major reason for the speed was forced short covering.
When heavily leveraged shorts get liquidated, exchanges close those positions by buying back BTC.
That buying can create a chain reaction:
Higher price.
More liquidations.
More forced buying.
But there’s a catch.
Liquidations are temporary fuel.
Once those positions are gone, the market needs actual buyers to keep the move going.
That makes the next few sessions more informative than the breakout headline itself.
A squeeze can start a move; demand must sustain it.
The more interesting question now is what happens after the squeeze.
BTC pushed through the $84,000 area and reached roughly $87,000 this week.
A major reason for the speed was forced short covering.
When heavily leveraged shorts get liquidated, exchanges close those positions by buying back BTC.
That buying can create a chain reaction:
Higher price.
More liquidations.
More forced buying.
But there’s a catch.
Liquidations are temporary fuel.
Once those positions are gone, the market needs actual buyers to keep the move going.
That makes the next few sessions more informative than the breakout headline itself.
A squeeze can start a move; demand must sustain it.
54
·
--
查看翻譯
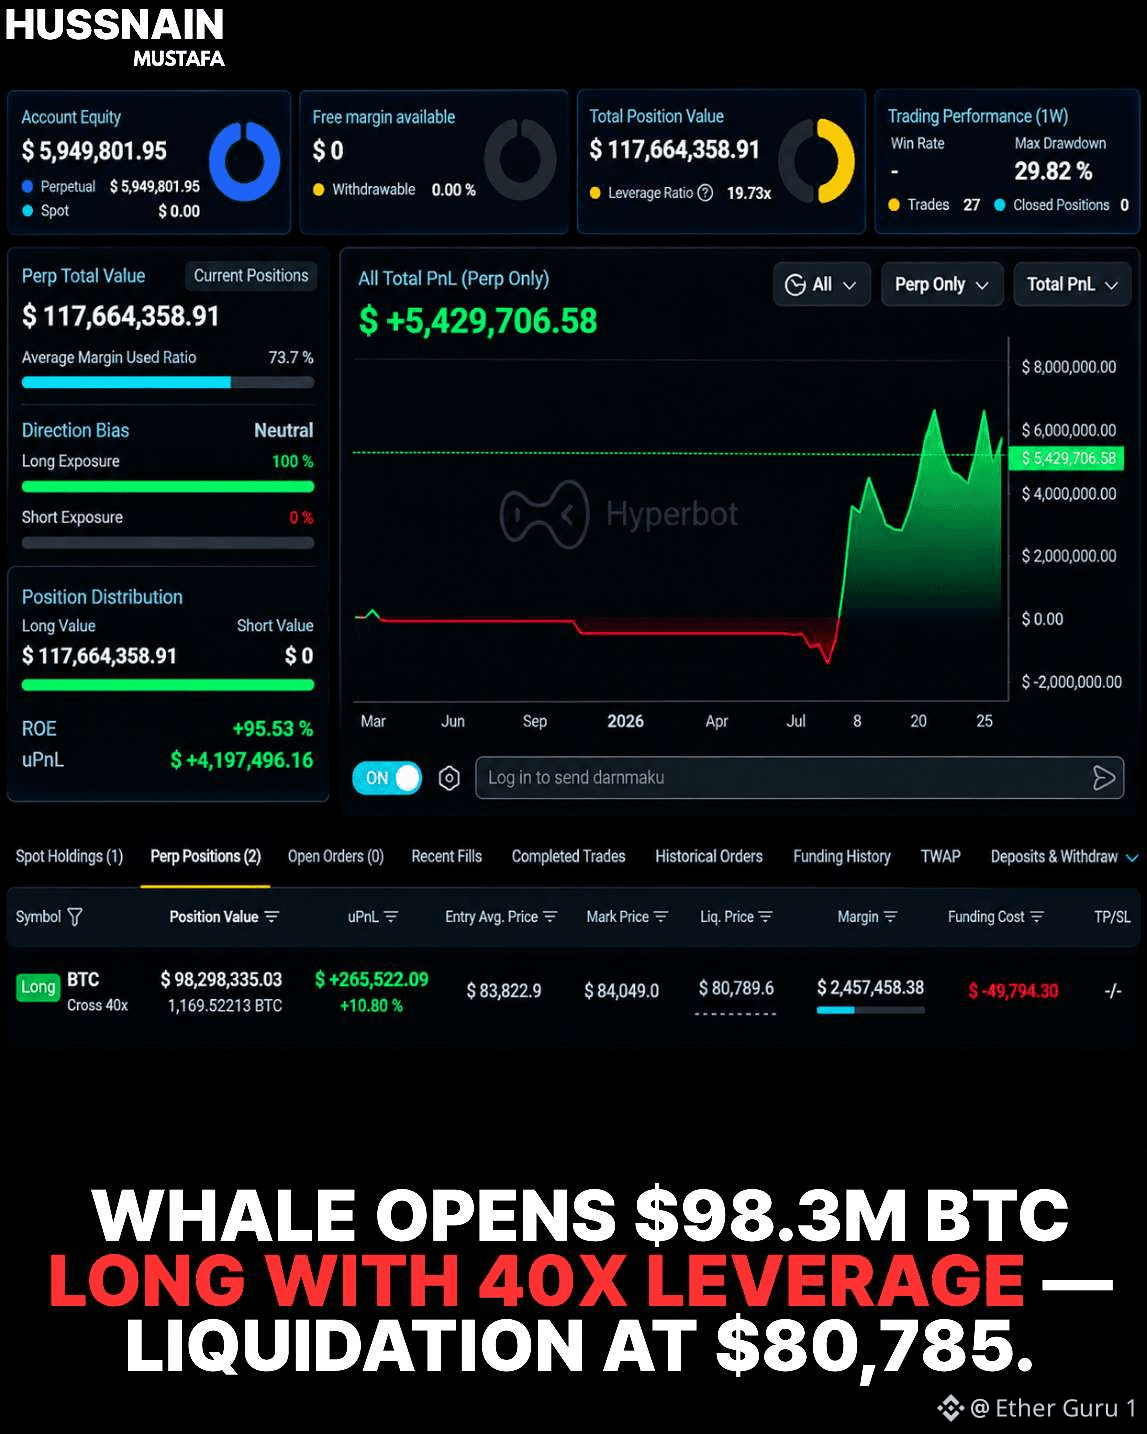
$BTC A WHALE JUST OPENED A $98.3M BITCOIN LONG
The position reportedly uses 40× leverage, with liquidation around $80,785.
At 40× leverage, roughly $2.46 million of margin controls a $98.3 million position.
That creates enormous exposure from relatively little posted capital.
The dangerous part is the distance to liquidation.
If BTC falls toward $80,785, the position can be forced to close, potentially locking in losses for the trader and adding selling pressure during a decline.
Leverage can make a position look huge without requiring equally large upfront capital.
Big positions can carry very small cushions.
$BTC A WHALE JUST OPENED A $98.3M BITCOIN LONG
The position reportedly uses 40× leverage, with liquidation around $80,785.
At 40× leverage, roughly $2.46 million of margin controls a $98.3 million position.
That creates enormous exposure from relatively little posted capital.
The dangerous part is the distance to liquidation.
If BTC falls toward $80,785, the position can be forced to close, potentially locking in losses for the trader and adding selling pressure during a decline.
Leverage can make a position look huge without requiring equally large upfront capital.
Big positions can carry very small cushions.
The position reportedly uses 40× leverage, with liquidation around $80,785.
At 40× leverage, roughly $2.46 million of margin controls a $98.3 million position.
That creates enormous exposure from relatively little posted capital.
The dangerous part is the distance to liquidation.
If BTC falls toward $80,785, the position can be forced to close, potentially locking in losses for the trader and adding selling pressure during a decline.
Leverage can make a position look huge without requiring equally large upfront capital.
Big positions can carry very small cushions.
66
·
--
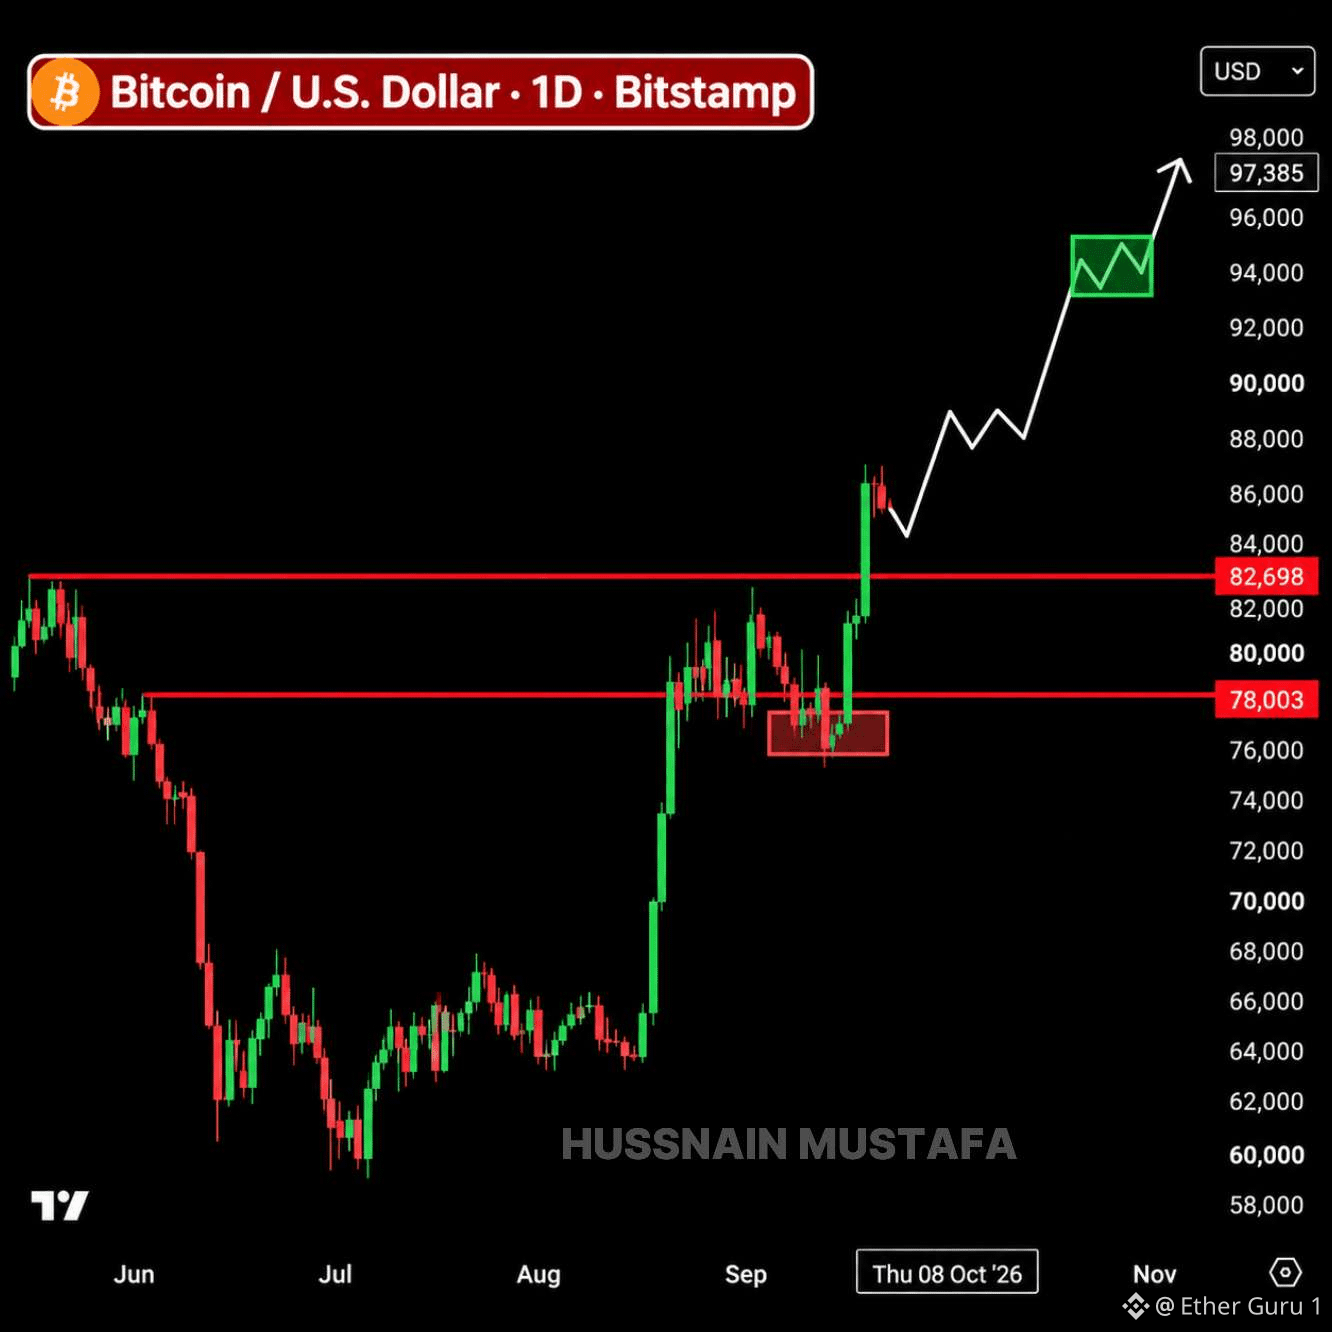
$BTC 比特幣剛剛把兩個舊的阻力位變成了支撐。
$78K 被重新站回。
隨後 $82.7K 被跌破。
現在 BTC 交易在約 $84K 附近,市場正在關注買家能否繼續守住這些先前支撐價格的關鍵水平。
這一區別很重要。
突破是一碼事。
但在興奮情緒退去之後仍能在其上方站穩又是另一回事。
如果 $82.7K 繼續充當支撐,那麼 $90K 對交易者來說將變成一個更顯而易見的關注點。
但如果該水平再次被失守,這整個結構看起來就會不一樣。
目前,更有意思的並不是 $90K 這個數字本身。
而是比特幣能否在其下方繼續構建更高的低點。
接下來的走勢取決於哪些位置能夠守住。
$BTC 比特幣剛剛把兩個舊的阻力位變成了支撐。
$78K 被重新站回。
隨後 $82.7K 被跌破。
現在 BTC 交易在約 $84K 附近,市場正在關注買家能否繼續守住這些先前支撐價格的關鍵水平。
這一區別很重要。
突破是一碼事。
但在興奮情緒退去之後仍能在其上方站穩又是另一回事。
如果 $82.7K 繼續充當支撐,那麼 $90K 對交易者來說將變成一個更顯而易見的關注點。
但如果該水平再次被失守,這整個結構看起來就會不一樣。
目前,更有意思的並不是 $90K 這個數字本身。
而是比特幣能否在其下方繼續構建更高的低點。
接下來的走勢取決於哪些位置能夠守住。
$78K 被重新站回。
隨後 $82.7K 被跌破。
現在 BTC 交易在約 $84K 附近,市場正在關注買家能否繼續守住這些先前支撐價格的關鍵水平。
這一區別很重要。
突破是一碼事。
但在興奮情緒退去之後仍能在其上方站穩又是另一回事。
如果 $82.7K 繼續充當支撐,那麼 $90K 對交易者來說將變成一個更顯而易見的關注點。
但如果該水平再次被失守,這整個結構看起來就會不一樣。
目前,更有意思的並不是 $90K 這個數字本身。
而是比特幣能否在其下方繼續構建更高的低點。
接下來的走勢取決於哪些位置能夠守住。
60
·
--
$BTC 比特幣 ETF 再度變得認真起來。
美國現貨比特幣 ETF 週二吸引了約 7.15 億美元的資金流入。
這是連續第四個轉正的交易日,令四天累計的漲勢來到約 23.1 億美元。
其中,貝萊德的 IBIT 單獨吸金約 3.5 億美元。
富達又增加了 2.57 億美元。
這很重要,因為 ETF 資金流向代表的是對現貨比特幣的實際需求,而不只是人們在社群媒體上喊多。
在數週資金流動反覆、震盪不定之後,短短幾個交易日內又有數十億美元回流,這在盤面上是明顯的變化。
這並不保證接下來一定會往更高的位置走。
但如果這種需求持續出現,同時比特幣守住近期的漲幅,那市場正在傳遞的訊號,將與最近拋售期間我們看到的截然不同。
資金正在回流進比特幣。
$BTC 比特幣 ETF 再度變得認真起來。
美國現貨比特幣 ETF 週二吸引了約 7.15 億美元的資金流入。
這是連續第四個轉正的交易日,令四天累計的漲勢來到約 23.1 億美元。
其中,貝萊德的 IBIT 單獨吸金約 3.5 億美元。
富達又增加了 2.57 億美元。
這很重要,因為 ETF 資金流向代表的是對現貨比特幣的實際需求,而不只是人們在社群媒體上喊多。
在數週資金流動反覆、震盪不定之後,短短幾個交易日內又有數十億美元回流,這在盤面上是明顯的變化。
這並不保證接下來一定會往更高的位置走。
但如果這種需求持續出現,同時比特幣守住近期的漲幅,那市場正在傳遞的訊號,將與最近拋售期間我們看到的截然不同。
資金正在回流進比特幣。
美國現貨比特幣 ETF 週二吸引了約 7.15 億美元的資金流入。
這是連續第四個轉正的交易日,令四天累計的漲勢來到約 23.1 億美元。
其中,貝萊德的 IBIT 單獨吸金約 3.5 億美元。
富達又增加了 2.57 億美元。
這很重要,因為 ETF 資金流向代表的是對現貨比特幣的實際需求,而不只是人們在社群媒體上喊多。
在數週資金流動反覆、震盪不定之後,短短幾個交易日內又有數十億美元回流,這在盤面上是明顯的變化。
這並不保證接下來一定會往更高的位置走。
但如果這種需求持續出現,同時比特幣守住近期的漲幅,那市場正在傳遞的訊號,將與最近拋售期間我們看到的截然不同。
資金正在回流進比特幣。

BTC-0.50%
IBITETF-0.22%
70
·
--
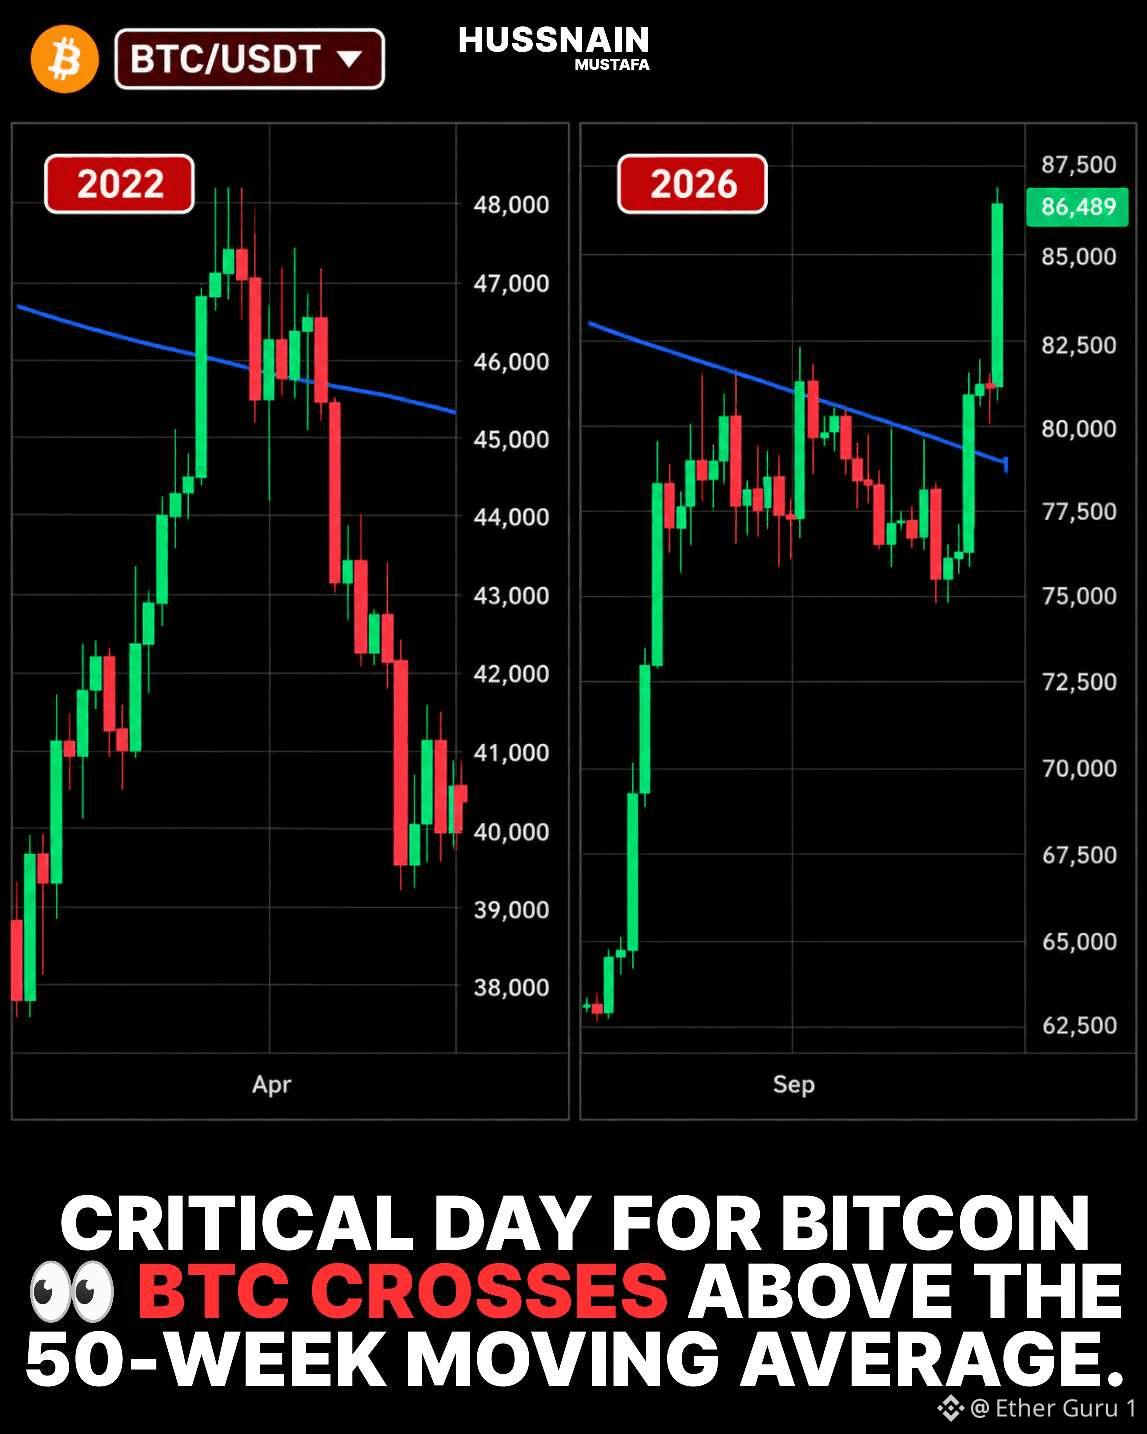
$BTC 比特幣剛剛收復了「關鍵」水準。
BTC 收在約 $81,159。
其 50 週移動平均線約在 $78,788。
這意味著比特幣大約在該線上方 3%。
但歷史讓這組態變得更有意思。
Galaxy Research 發現過 13 次先前的每週收復。
其中 11 次沒有在之後出現新的循環低點。
但有兩次不同。
2021 年 12 月與 2022 年 3 月都曾先收復該均線,但之後比特幣最終還是跌得更深。
因此,只有一次成功收盤並不保證會出現趨勢反轉。
接下來最重要的問題是:BTC 能否持續站在移動平均線之上。
這裡這個訊號才會更有用。
如果收復失敗,同一個水準就會再次變成阻力。
若能在其上方形成持續走勢,將更有力地支持市場結構已經改變的說法。
技術指標最適合作為證據,而非確定性。
而就目前來看,比特幣正直接站在它最受關注的長期趨勢線之一上。
接下來的每週收盤,可能比今天的突破更重要。
$BTC 比特幣剛剛收復了「關鍵」水準。
BTC 收在約 $81,159。
其 50 週移動平均線約在 $78,788。
這意味著比特幣大約在該線上方 3%。
但歷史讓這組態變得更有意思。
Galaxy Research 發現過 13 次先前的每週收復。
其中 11 次沒有在之後出現新的循環低點。
但有兩次不同。
2021 年 12 月與 2022 年 3 月都曾先收復該均線,但之後比特幣最終還是跌得更深。
因此,只有一次成功收盤並不保證會出現趨勢反轉。
接下來最重要的問題是:BTC 能否持續站在移動平均線之上。
這裡這個訊號才會更有用。
如果收復失敗,同一個水準就會再次變成阻力。
若能在其上方形成持續走勢,將更有力地支持市場結構已經改變的說法。
技術指標最適合作為證據,而非確定性。
而就目前來看,比特幣正直接站在它最受關注的長期趨勢線之一上。
接下來的每週收盤,可能比今天的突破更重要。
BTC 收在約 $81,159。
其 50 週移動平均線約在 $78,788。
這意味著比特幣大約在該線上方 3%。
但歷史讓這組態變得更有意思。
Galaxy Research 發現過 13 次先前的每週收復。
其中 11 次沒有在之後出現新的循環低點。
但有兩次不同。
2021 年 12 月與 2022 年 3 月都曾先收復該均線,但之後比特幣最終還是跌得更深。
因此,只有一次成功收盤並不保證會出現趨勢反轉。
接下來最重要的問題是:BTC 能否持續站在移動平均線之上。
這裡這個訊號才會更有用。
如果收復失敗,同一個水準就會再次變成阻力。
若能在其上方形成持續走勢,將更有力地支持市場結構已經改變的說法。
技術指標最適合作為證據,而非確定性。
而就目前來看,比特幣正直接站在它最受關注的長期趨勢線之一上。
接下來的每週收盤,可能比今天的突破更重要。
70
·
--
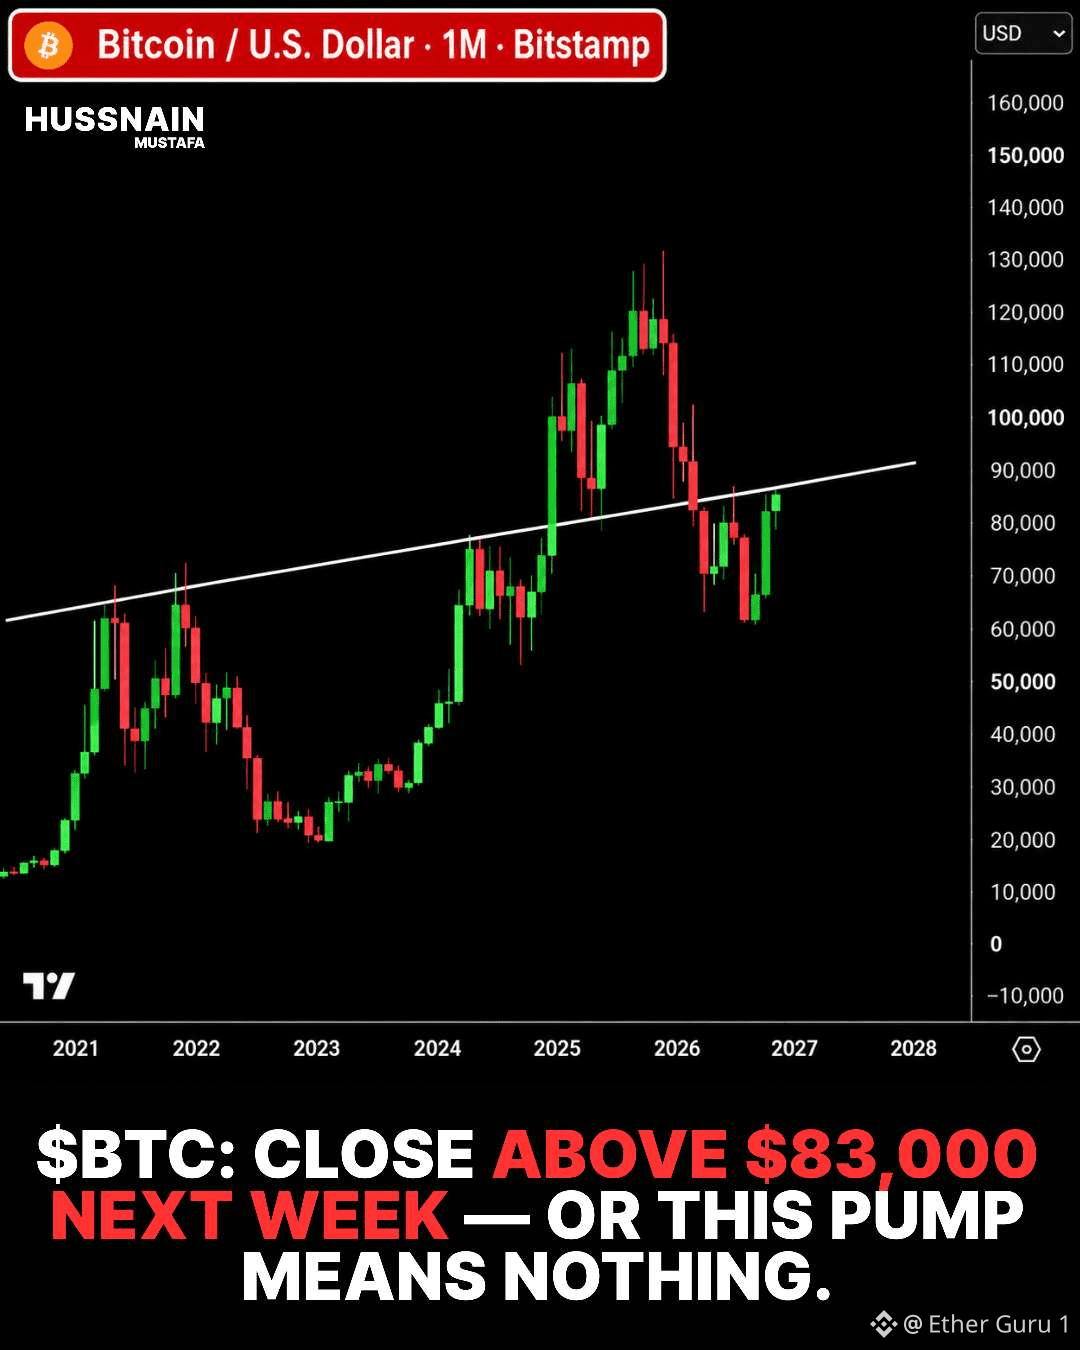
$BTC 比特幣每週測試 $83K
每週收盤價高於 $83,000 將把比特幣推向一個新的短期里程碑。
這個水平之所以重要,是因爲每週收盤價顯示買家和賣家在該週期結束時最終所處的位置。
盤中上穿 $83K 講述的是另一種情況。
若能出現持續的收盤,將爲價格在該水平之上獲得接受提供更強的證據。
比特幣近期的反彈已讓它遠離了九月份的低點。
但在加密市場中,短期動能可能很快就會消失。
成交量、ETF 資金流以及流動性都可能影響後續走勢。
單一的收盤價無法確認整個市場週期。
下一根每週K線將揭示 $83K 是否會成爲支撐位。
或者這次反彈是否只是又一次暫時性的行情。
$BTC 比特幣每週測試 $83K
每週收盤價高於 $83,000 將把比特幣推向一個新的短期里程碑。
這個水平之所以重要,是因爲每週收盤價顯示買家和賣家在該週期結束時最終所處的位置。
盤中上穿 $83K 講述的是另一種情況。
若能出現持續的收盤,將爲價格在該水平之上獲得接受提供更強的證據。
比特幣近期的反彈已讓它遠離了九月份的低點。
但在加密市場中,短期動能可能很快就會消失。
成交量、ETF 資金流以及流動性都可能影響後續走勢。
單一的收盤價無法確認整個市場週期。
下一根每週K線將揭示 $83K 是否會成爲支撐位。
或者這次反彈是否只是又一次暫時性的行情。
每週收盤價高於 $83,000 將把比特幣推向一個新的短期里程碑。
這個水平之所以重要,是因爲每週收盤價顯示買家和賣家在該週期結束時最終所處的位置。
盤中上穿 $83K 講述的是另一種情況。
若能出現持續的收盤,將爲價格在該水平之上獲得接受提供更強的證據。
比特幣近期的反彈已讓它遠離了九月份的低點。
但在加密市場中,短期動能可能很快就會消失。
成交量、ETF 資金流以及流動性都可能影響後續走勢。
單一的收盤價無法確認整個市場週期。
下一根每週K線將揭示 $83K 是否會成爲支撐位。
或者這次反彈是否只是又一次暫時性的行情。
63
·
--
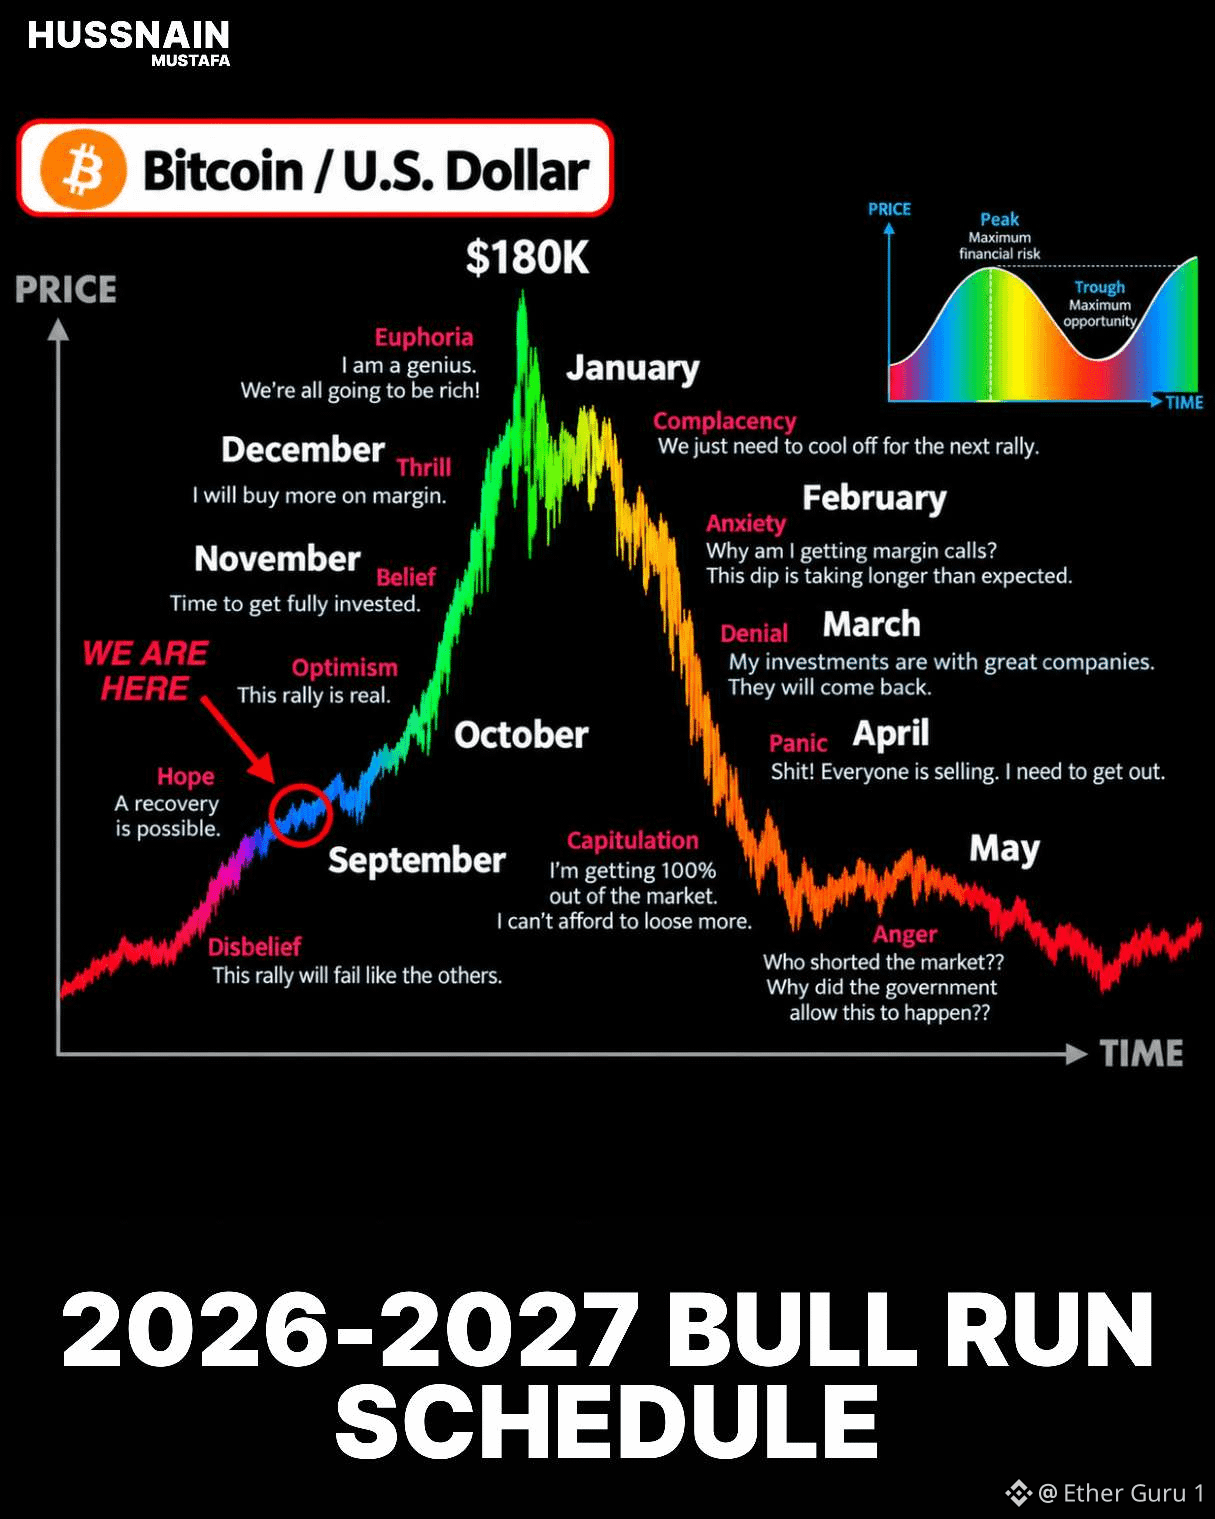
$BTC 沒有“魔法比特幣數字”可以用來規劃退休。
有個走紅的圖表說 16 歲時擁有 0.05 BTC。
然後到了 30 多歲時達到 0.25 BTC。
再到 65 歲以後達到 5 BTC。
但這些目標並不是一條理財規則。
比特幣的最高固定供應量爲 2100 萬枚。
如果按每人 5 BTC 來算,理論上只有大約 420 萬人能持有這麼多。
這還沒考慮丟失的幣、機構、政府、交易所,以及所有權分佈不均。
更重要的啓示其實在於“積累”。
今天持有 0.10 BTC 的人,在網絡中的份額和一個在十年後纔開始持幣的人並不相同。
但比特幣的價格也可能出現大幅下跌。
如果只用 BTC 數字來衡量目標,會忽略收入、債務、應急儲蓄、稅收、退休賬戶以及整體淨資產。
對某個人而言,0.25 BTC 可能只是很小的一筆投機配置。
對另一個人而言,它可能意味着其財富中高度集中的部分。
所以,“贏得這場遊戲”無法用某一個比特幣數字來定義。
真正有用的問題是:一個人能在多大程度上負責任地承擔風險。
比特幣持有當然重要,但財務語境更關鍵。
$BTC 沒有“魔法比特幣數字”可以用來規劃退休。
有個走紅的圖表說 16 歲時擁有 0.05 BTC。
然後到了 30 多歲時達到 0.25 BTC。
再到 65 歲以後達到 5 BTC。
但這些目標並不是一條理財規則。
比特幣的最高固定供應量爲 2100 萬枚。
如果按每人 5 BTC 來算,理論上只有大約 420 萬人能持有這麼多。
這還沒考慮丟失的幣、機構、政府、交易所,以及所有權分佈不均。
更重要的啓示其實在於“積累”。
今天持有 0.10 BTC 的人,在網絡中的份額和一個在十年後纔開始持幣的人並不相同。
但比特幣的價格也可能出現大幅下跌。
如果只用 BTC 數字來衡量目標,會忽略收入、債務、應急儲蓄、稅收、退休賬戶以及整體淨資產。
對某個人而言,0.25 BTC 可能只是很小的一筆投機配置。
對另一個人而言,它可能意味着其財富中高度集中的部分。
所以,“贏得這場遊戲”無法用某一個比特幣數字來定義。
真正有用的問題是:一個人能在多大程度上負責任地承擔風險。
比特幣持有當然重要,但財務語境更關鍵。
有個走紅的圖表說 16 歲時擁有 0.05 BTC。
然後到了 30 多歲時達到 0.25 BTC。
再到 65 歲以後達到 5 BTC。
但這些目標並不是一條理財規則。
比特幣的最高固定供應量爲 2100 萬枚。
如果按每人 5 BTC 來算,理論上只有大約 420 萬人能持有這麼多。
這還沒考慮丟失的幣、機構、政府、交易所,以及所有權分佈不均。
更重要的啓示其實在於“積累”。
今天持有 0.10 BTC 的人,在網絡中的份額和一個在十年後纔開始持幣的人並不相同。
但比特幣的價格也可能出現大幅下跌。
如果只用 BTC 數字來衡量目標,會忽略收入、債務、應急儲蓄、稅收、退休賬戶以及整體淨資產。
對某個人而言,0.25 BTC 可能只是很小的一筆投機配置。
對另一個人而言,它可能意味着其財富中高度集中的部分。
所以,“贏得這場遊戲”無法用某一個比特幣數字來定義。
真正有用的問題是:一個人能在多大程度上負責任地承擔風險。
比特幣持有當然重要,但財務語境更關鍵。
71
·
--
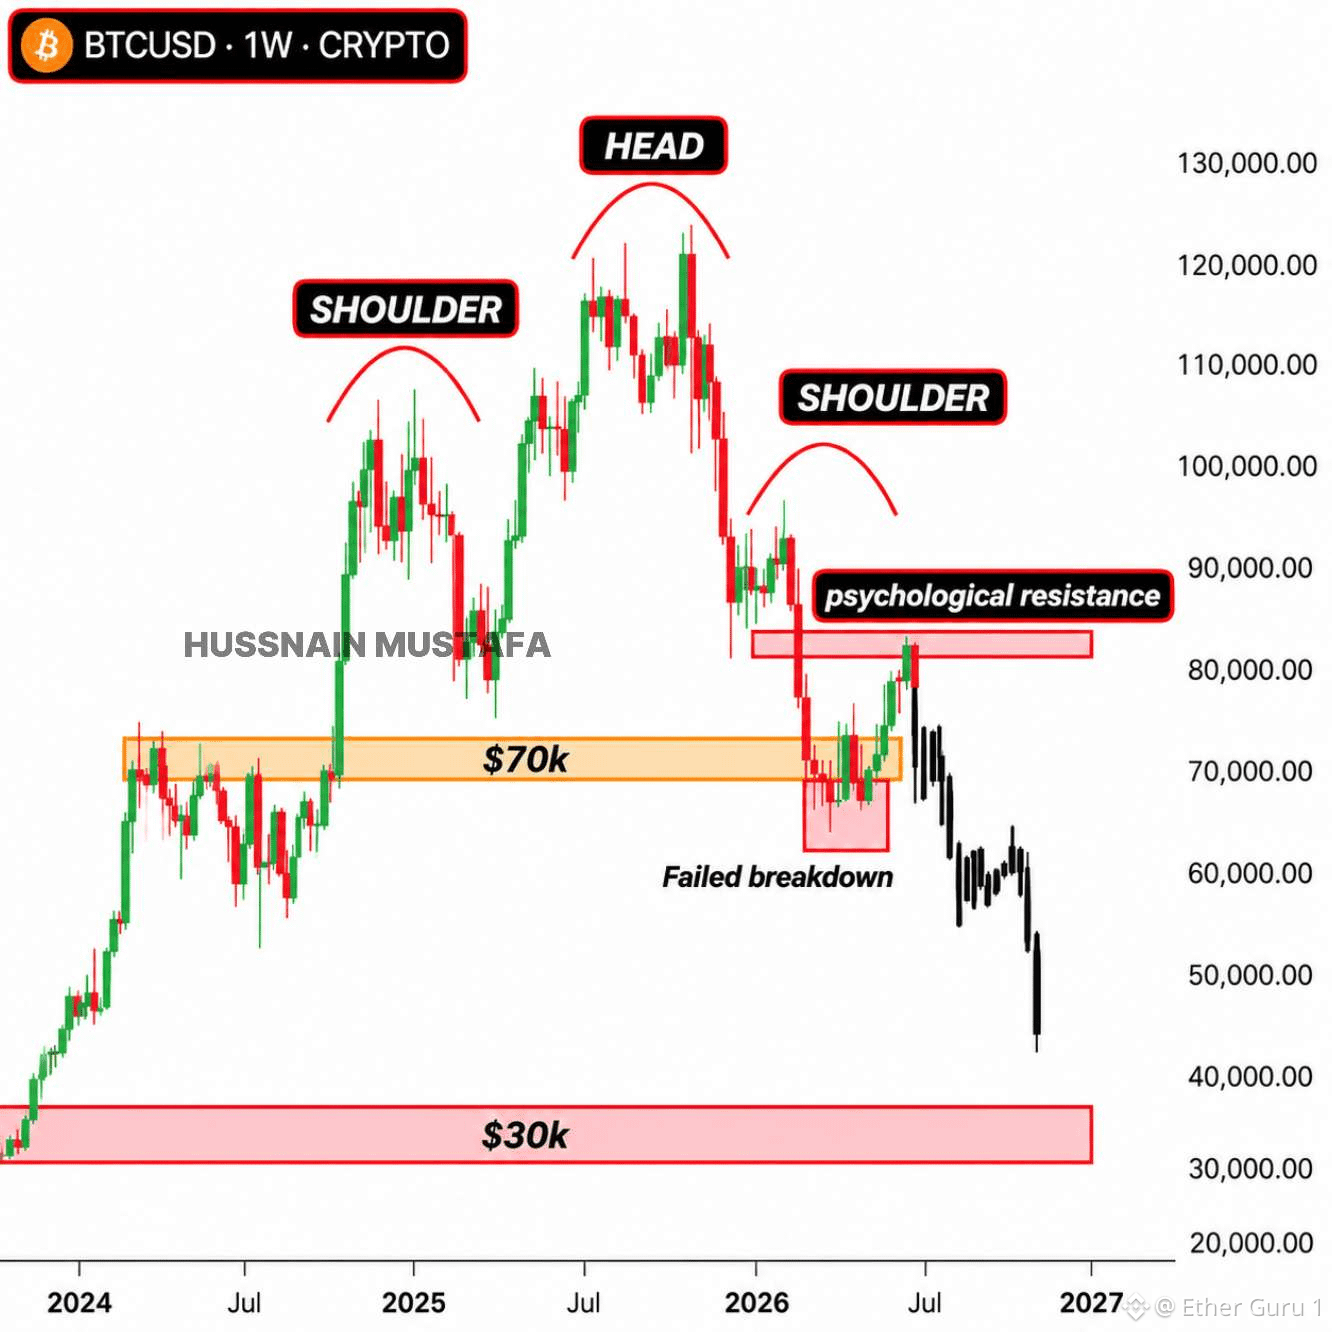
$BTC 比特幣的下跌需要的不止一個解釋。
一項被否決的加密法案會傷害市場情緒。
但這並不能證明下一個價格目標。
比特幣會對流動性、槓桿、ETF資金流、利率以及投資者倉位作出反應。
從 $75,000 跌到 $70,000 將意味着約 6.7% 的下跌。
跌到 $63,000 則表示從 $70,000 再下跌 10%。
從 $75,000 到 $47,000,跌幅大約將達到 37%。
因此,對精確預測應保持謹慎。
交易者可能準確找到了一個關鍵低點。
但這並不意味着所有後續預測都可靠。
市場可能會持續數週遵循某種模式。
隨後,一個政策決定、流動性變化或突發的頭條新聞,都可能改變走勢。
最重要的問題並不是誰預測了上一個低點。
而是當前論點背後是否有可衡量的證據。
關注支撐位、成交量、衍生品槓桿以及機構資金流。
這些信號能提供背景信息,而不需要承諾一個精確的拐點。
沒有風險控制的預測就不算是一種策略。
$BTC 比特幣的下跌需要的不止一個解釋。
一項被否決的加密法案會傷害市場情緒。
但這並不能證明下一個價格目標。
比特幣會對流動性、槓桿、ETF資金流、利率以及投資者倉位作出反應。
從 $75,000 跌到 $70,000 將意味着約 6.7% 的下跌。
跌到 $63,000 則表示從 $70,000 再下跌 10%。
從 $75,000 到 $47,000,跌幅大約將達到 37%。
因此,對精確預測應保持謹慎。
交易者可能準確找到了一個關鍵低點。
但這並不意味着所有後續預測都可靠。
市場可能會持續數週遵循某種模式。
隨後,一個政策決定、流動性變化或突發的頭條新聞,都可能改變走勢。
最重要的問題並不是誰預測了上一個低點。
而是當前論點背後是否有可衡量的證據。
關注支撐位、成交量、衍生品槓桿以及機構資金流。
這些信號能提供背景信息,而不需要承諾一個精確的拐點。
沒有風險控制的預測就不算是一種策略。
一項被否決的加密法案會傷害市場情緒。
但這並不能證明下一個價格目標。
比特幣會對流動性、槓桿、ETF資金流、利率以及投資者倉位作出反應。
從 $75,000 跌到 $70,000 將意味着約 6.7% 的下跌。
跌到 $63,000 則表示從 $70,000 再下跌 10%。
從 $75,000 到 $47,000,跌幅大約將達到 37%。
因此,對精確預測應保持謹慎。
交易者可能準確找到了一個關鍵低點。
但這並不意味着所有後續預測都可靠。
市場可能會持續數週遵循某種模式。
隨後,一個政策決定、流動性變化或突發的頭條新聞,都可能改變走勢。
最重要的問題並不是誰預測了上一個低點。
而是當前論點背後是否有可衡量的證據。
關注支撐位、成交量、衍生品槓桿以及機構資金流。
這些信號能提供背景信息,而不需要承諾一個精確的拐點。
沒有風險控制的預測就不算是一種策略。
2
·
--
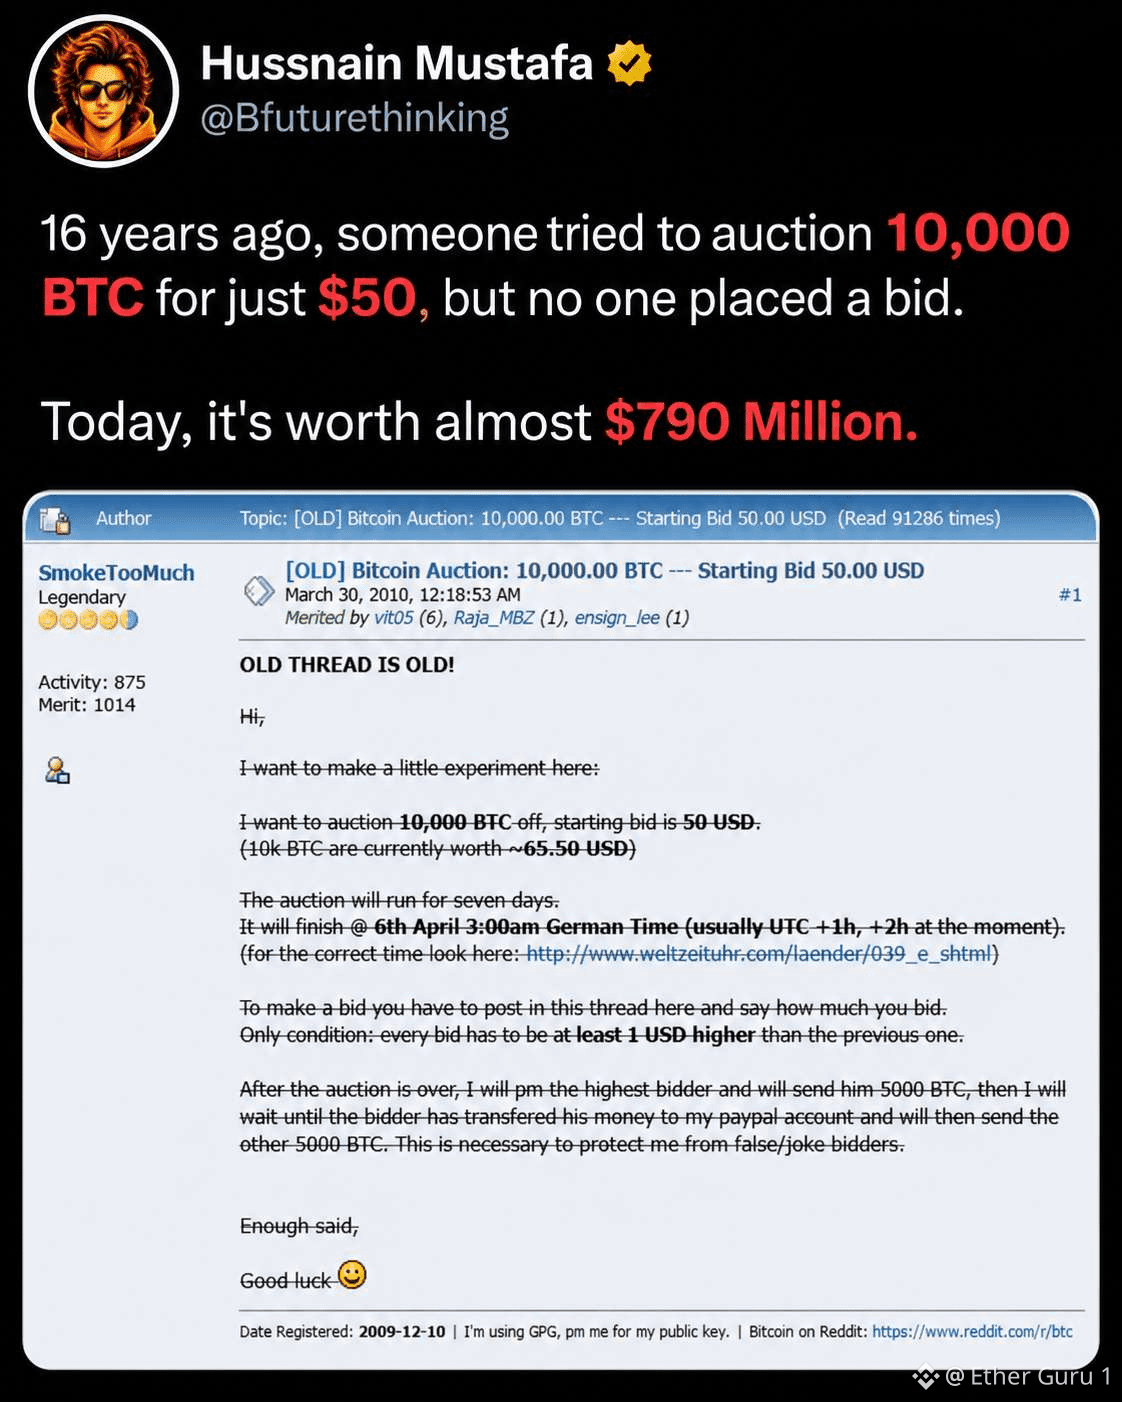
$BTC 10,000 BTC。一次 $50 拍賣。零出價。
十六年前,據稱有人試圖用僅僅 $50 的價格出售一大筆比特幣存量。
沒人想要它。
而今天,同樣數量的比特幣將價值數億美元。
$BTC 10,000 BTC。一次 $50 拍賣。零出價。
十六年前,據稱有人試圖用僅僅 $50 的價格出售一大筆比特幣存量。
沒人想要它。
而今天,同樣數量的比特幣將價值數億美元。
十六年前,據稱有人試圖用僅僅 $50 的價格出售一大筆比特幣存量。
沒人想要它。
而今天,同樣數量的比特幣將價值數億美元。
·
--
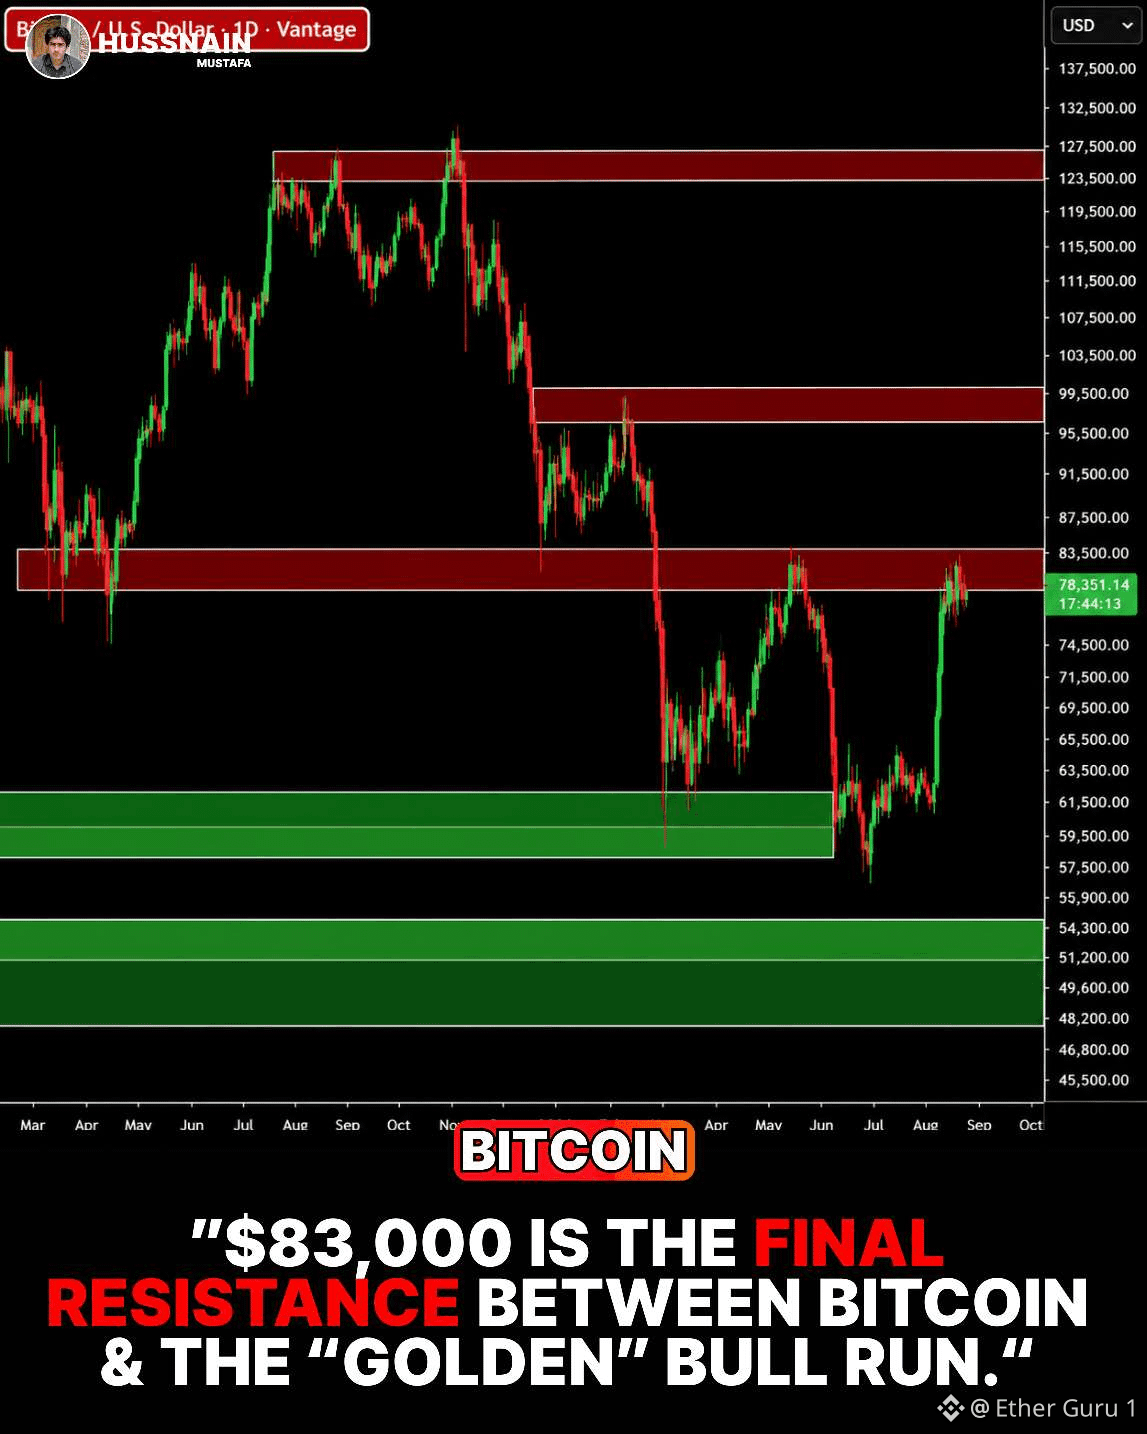
$BTC $83,000是圖表進入嚴肅階段的地方。
這一區間與比特幣的5月高點相吻合,並且位於更廣泛的$83K–$86K供應區之內。
技術面背景也有所改善。
比特幣剛剛自2025年5月以來首次出現50日均線下穿200日均線金叉(即首次“50日/200日金叉”)。
但僅憑交叉本身並不能確認趨勢的持續反轉。
如果出現果斷突破$83K,這將移除一個重大的技術障礙。
在此之前,賣方仍然控制着最關鍵的上方阻力區。
$83K仍然是通行關口。
$BTC $83,000是圖表進入嚴肅階段的地方。
這一區間與比特幣的5月高點相吻合,並且位於更廣泛的$83K–$86K供應區之內。
技術面背景也有所改善。
比特幣剛剛自2025年5月以來首次出現50日均線下穿200日均線金叉(即首次“50日/200日金叉”)。
但僅憑交叉本身並不能確認趨勢的持續反轉。
如果出現果斷突破$83K,這將移除一個重大的技術障礙。
在此之前,賣方仍然控制着最關鍵的上方阻力區。
$83K仍然是通行關口。
這一區間與比特幣的5月高點相吻合,並且位於更廣泛的$83K–$86K供應區之內。
技術面背景也有所改善。
比特幣剛剛自2025年5月以來首次出現50日均線下穿200日均線金叉(即首次“50日/200日金叉”)。
但僅憑交叉本身並不能確認趨勢的持續反轉。
如果出現果斷突破$83K,這將移除一個重大的技術障礙。
在此之前,賣方仍然控制着最關鍵的上方阻力區。
$83K仍然是通行關口。
52
·
--
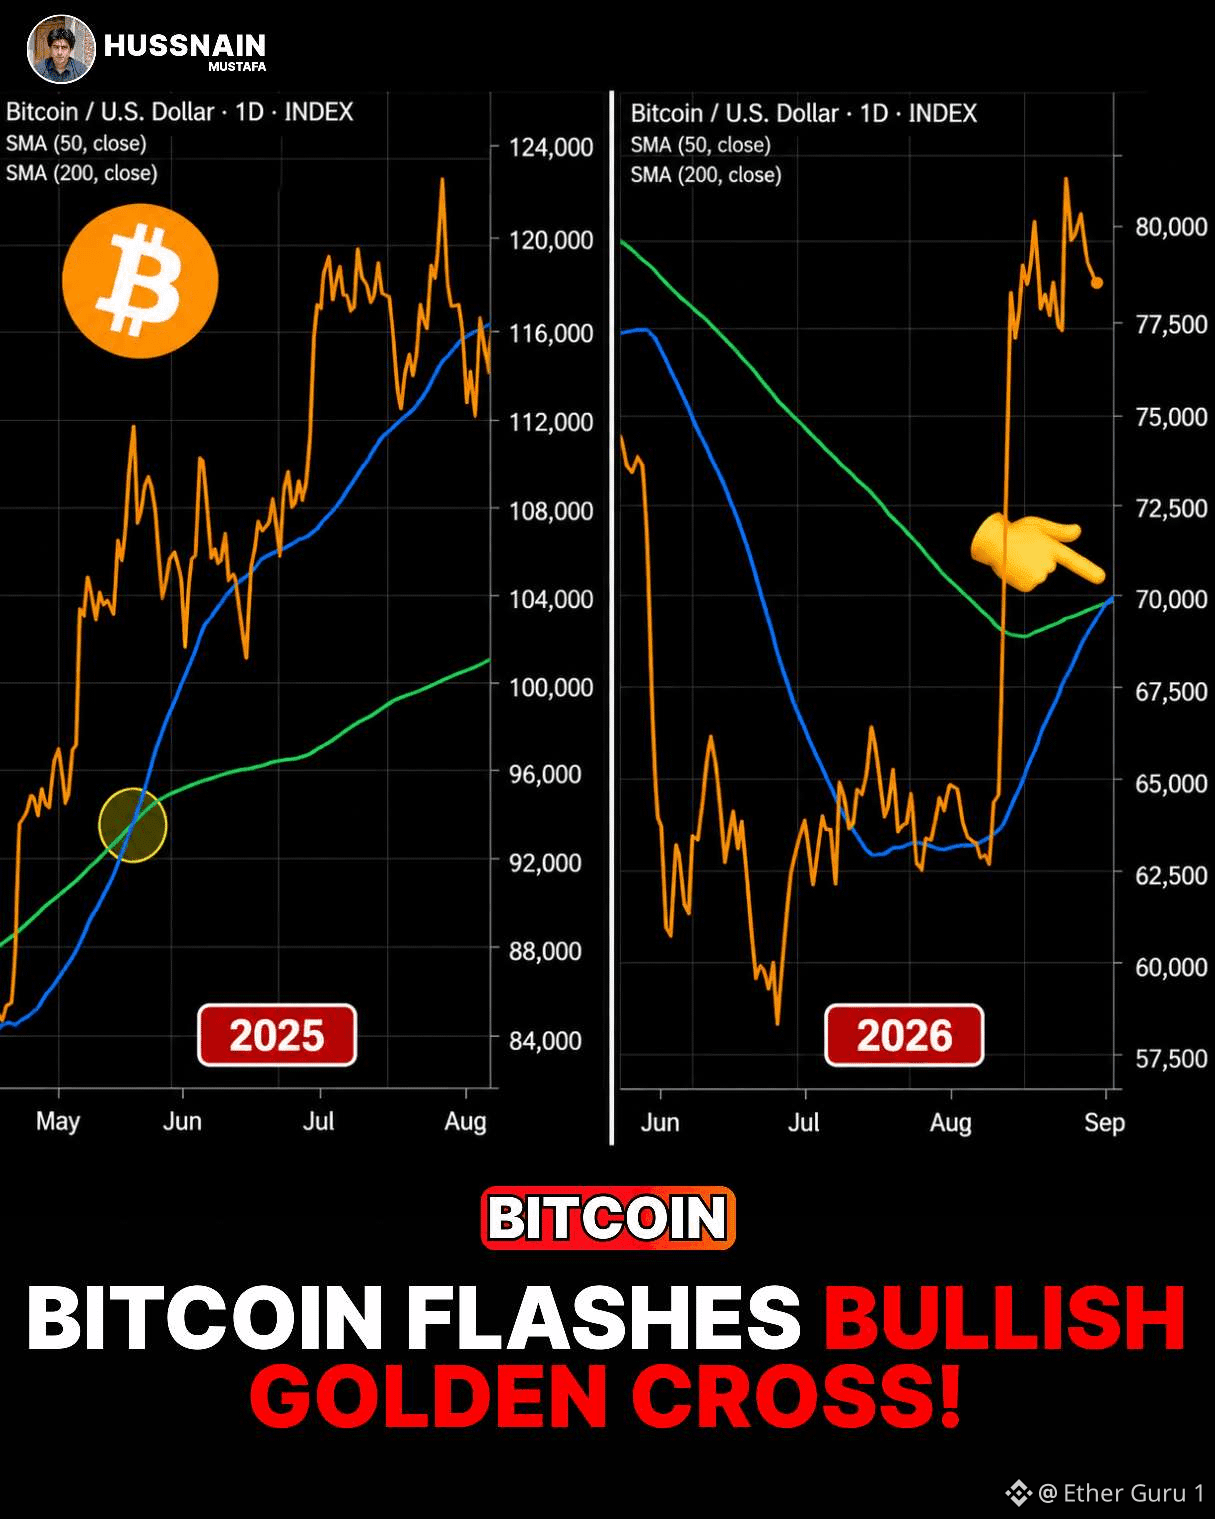
$BTC 比特幣再次顯示出黃金交叉(golden-cross)設置。
同樣的技術形態曾在 2025 年 5 月出現,隨後 BTC 最終一路上漲,創下其 $126,200 的歷史新高。
這一次,圖表再次引起人們對比特幣主要移動均線之間關係的關注。
但歷史只能作爲參考,而不是保證。
黃金交叉可以證實動能正在改善,但它並不能保證會出現下一輪直線式上漲。近期的技術分析仍然指向 BTC 需要突破的關鍵阻力位。
信號回來了。
接下來,價格必須作出迴應
$BTC 比特幣再次顯示出黃金交叉(golden-cross)設置。
同樣的技術形態曾在 2025 年 5 月出現,隨後 BTC 最終一路上漲,創下其 $126,200 的歷史新高。
這一次,圖表再次引起人們對比特幣主要移動均線之間關係的關注。
但歷史只能作爲參考,而不是保證。
黃金交叉可以證實動能正在改善,但它並不能保證會出現下一輪直線式上漲。近期的技術分析仍然指向 BTC 需要突破的關鍵阻力位。
信號回來了。
接下來,價格必須作出迴應
同樣的技術形態曾在 2025 年 5 月出現,隨後 BTC 最終一路上漲,創下其 $126,200 的歷史新高。
這一次,圖表再次引起人們對比特幣主要移動均線之間關係的關注。
但歷史只能作爲參考,而不是保證。
黃金交叉可以證實動能正在改善,但它並不能保證會出現下一輪直線式上漲。近期的技術分析仍然指向 BTC 需要突破的關鍵阻力位。
信號回來了。
接下來,價格必須作出迴應
73
·
--
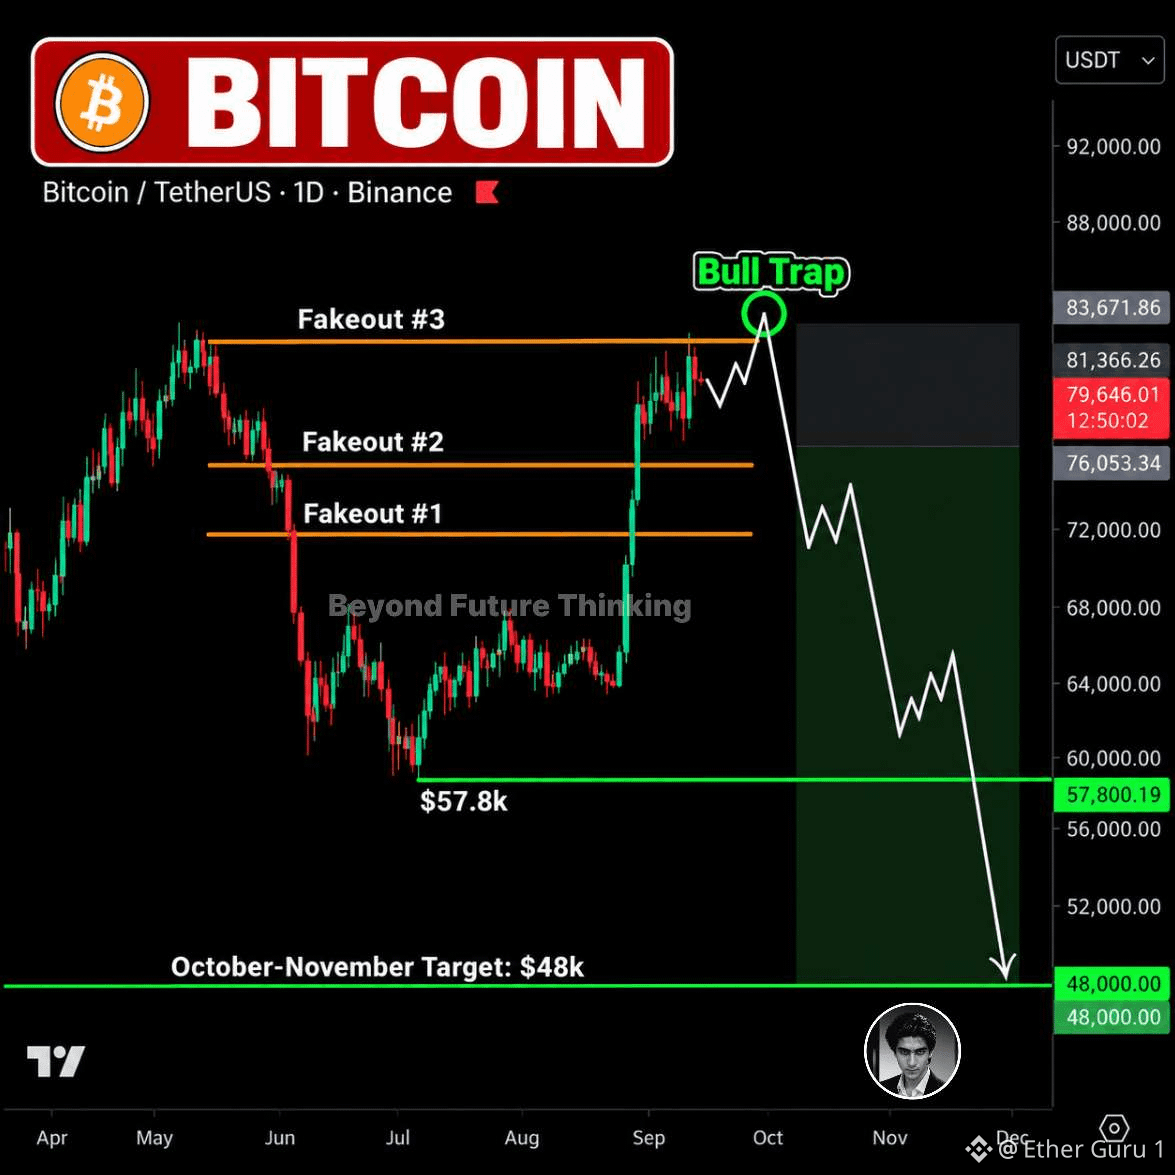
$BTC $83K 區域或將決定比特幣下一次重大走勢
比特幣最近重新逼近 $82K,這讓看漲情緒重新回到市場。
但目前仍有一個重要的流動性區位位於 $83K 附近。
這意味着價格在真正方向變得明朗之前,可能還有一次上行動作。
我當前的路線圖仍是:
$79K → $83K → $68K
如果市場在這次反彈後失去動能,我正在關注的下方關鍵位是:
$57.8K → $49K
我之所以沒有把最新這輪反彈視爲已確認的復甦,原因很簡單。
一次強勁的上衝可能會把新的買家重新吸引回市場,尤其是在經歷數週恐懼與大規模拋售之後。
靠近 $83K 的這片流動性,可能會成爲下一輪重大反應的重要區域。
如果比特幣在這裏被拒絕回落,那麼下行結構可能會迅速重新回到人們的視線。
在整個週期中,我一直密切關注這些主要水平,包括從 $98K → $60K 以及 $83K → $57K 的走勢。
這並不意味着之後的每一次判斷都將得到保證。
但價格走勢、流動性和關鍵位仍然比情緒更重要。
接下來的幾步走勢,可能會揭示這究竟是真正的復甦——還是更深一輪拋售前的另一個陷阱。
$83K 是這條線。
$BTC $83K 區域或將決定比特幣下一次重大走勢
比特幣最近重新逼近 $82K,這讓看漲情緒重新回到市場。
但目前仍有一個重要的流動性區位位於 $83K 附近。
這意味着價格在真正方向變得明朗之前,可能還有一次上行動作。
我當前的路線圖仍是:
$79K → $83K → $68K
如果市場在這次反彈後失去動能,我正在關注的下方關鍵位是:
$57.8K → $49K
我之所以沒有把最新這輪反彈視爲已確認的復甦,原因很簡單。
一次強勁的上衝可能會把新的買家重新吸引回市場,尤其是在經歷數週恐懼與大規模拋售之後。
靠近 $83K 的這片流動性,可能會成爲下一輪重大反應的重要區域。
如果比特幣在這裏被拒絕回落,那麼下行結構可能會迅速重新回到人們的視線。
在整個週期中,我一直密切關注這些主要水平,包括從 $98K → $60K 以及 $83K → $57K 的走勢。
這並不意味着之後的每一次判斷都將得到保證。
但價格走勢、流動性和關鍵位仍然比情緒更重要。
接下來的幾步走勢,可能會揭示這究竟是真正的復甦——還是更深一輪拋售前的另一個陷阱。
$83K 是這條線。
比特幣最近重新逼近 $82K,這讓看漲情緒重新回到市場。
但目前仍有一個重要的流動性區位位於 $83K 附近。
這意味着價格在真正方向變得明朗之前,可能還有一次上行動作。
我當前的路線圖仍是:
$79K → $83K → $68K
如果市場在這次反彈後失去動能,我正在關注的下方關鍵位是:
$57.8K → $49K
我之所以沒有把最新這輪反彈視爲已確認的復甦,原因很簡單。
一次強勁的上衝可能會把新的買家重新吸引回市場,尤其是在經歷數週恐懼與大規模拋售之後。
靠近 $83K 的這片流動性,可能會成爲下一輪重大反應的重要區域。
如果比特幣在這裏被拒絕回落,那麼下行結構可能會迅速重新回到人們的視線。
在整個週期中,我一直密切關注這些主要水平,包括從 $98K → $60K 以及 $83K → $57K 的走勢。
這並不意味着之後的每一次判斷都將得到保證。
但價格走勢、流動性和關鍵位仍然比情緒更重要。
接下來的幾步走勢,可能會揭示這究竟是真正的復甦——還是更深一輪拋售前的另一個陷阱。
$83K 是這條線。
134
·
--
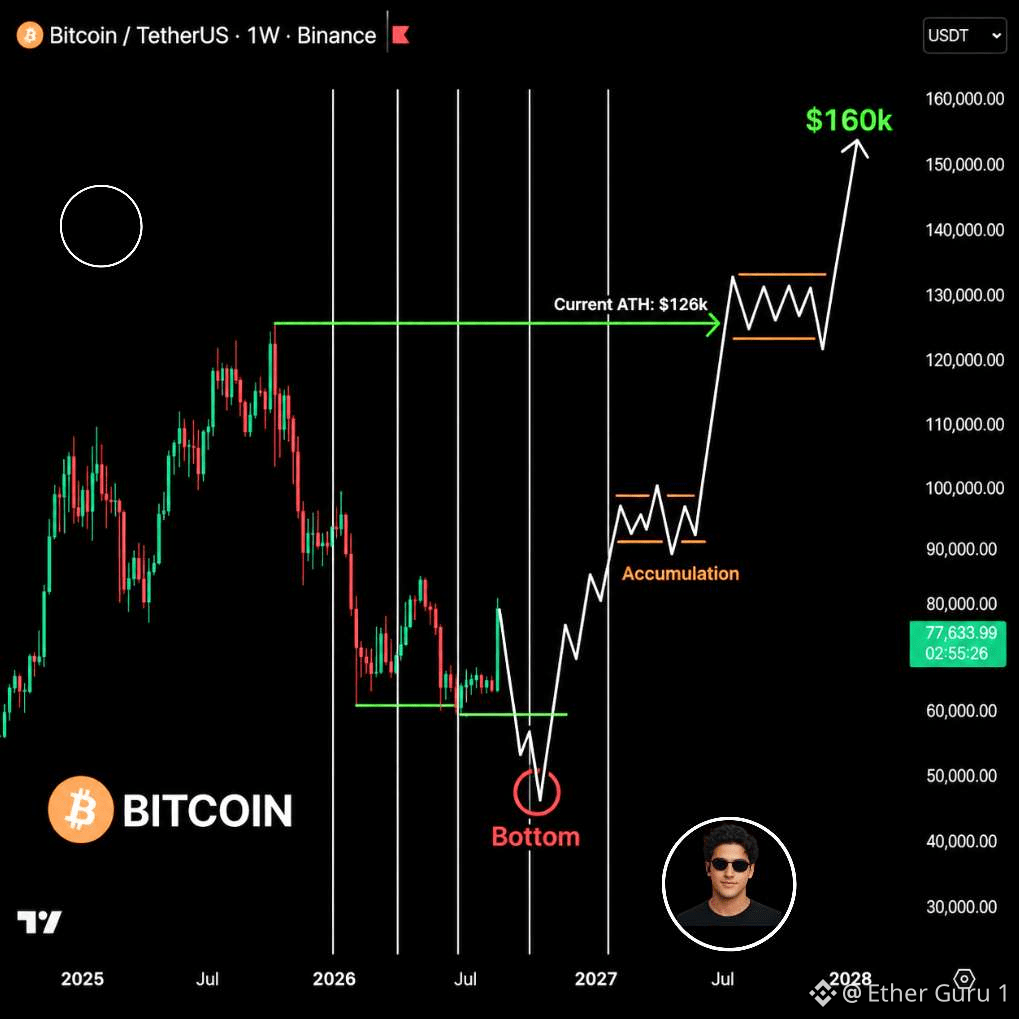
$BTC 🚨 2026–27 宏觀重置
如果貨幣政策與加密情緒同步走弱,2026 年第三季度可能會對風險資產構成重大考驗。
BTC:可能的築底階段
SPX:約 7.3K 的下行情景
新一輪美聯儲領導層週期可能會重塑市場對利率、流動性與金融狀況的預期。
首次降息並不必然意味着牛市。
如果對衰退的擔憂加劇,市場一開始可能會把“寬鬆”解讀爲對經濟走弱的迴應。
加密情緒:極端恐懼情景
如果比特幣重新站上關鍵阻力位、機構需求增強,第四季度可能帶來不同的格局。
BTC:高於 84K 美元
若《CLARITY 法案》最終成爲法律,監管清晰度也可能成爲另一項催化因素。
AI 基礎設施與加密採用也可能爲資金輪動創造新的敘事。
2027 年 BTC 情景:160K+ 美元
若經濟走弱變得更爲明顯,三次美聯儲降息將意味着貨幣環境的重大轉變。
在貨幣不確定性期間,比特幣可能會越來越多地與其他稀缺資產一起被看待。
但路徑不會是線性的。
12 個月內實現 2 倍回報,需要比特幣大致達到第三季度入場水平的兩倍。
這仍然只是一個情景,而非必然結果。
最強的機會往往出現在情緒最弱的時候。
恐懼會帶來機會。
流動性決定時點。
$BTC 🚨 2026–27 宏觀重置
如果貨幣政策與加密情緒同步走弱,2026 年第三季度可能會對風險資產構成重大考驗。
BTC:可能的築底階段
SPX:約 7.3K 的下行情景
新一輪美聯儲領導層週期可能會重塑市場對利率、流動性與金融狀況的預期。
首次降息並不必然意味着牛市。
如果對衰退的擔憂加劇,市場一開始可能會把“寬鬆”解讀爲對經濟走弱的迴應。
加密情緒:極端恐懼情景
如果比特幣重新站上關鍵阻力位、機構需求增強,第四季度可能帶來不同的格局。
BTC:高於 84K 美元
若《CLARITY 法案》最終成爲法律,監管清晰度也可能成爲另一項催化因素。
AI 基礎設施與加密採用也可能爲資金輪動創造新的敘事。
2027 年 BTC 情景:160K+ 美元
若經濟走弱變得更爲明顯,三次美聯儲降息將意味着貨幣環境的重大轉變。
在貨幣不確定性期間,比特幣可能會越來越多地與其他稀缺資產一起被看待。
但路徑不會是線性的。
12 個月內實現 2 倍回報,需要比特幣大致達到第三季度入場水平的兩倍。
這仍然只是一個情景,而非必然結果。
最強的機會往往出現在情緒最弱的時候。
恐懼會帶來機會。
流動性決定時點。
如果貨幣政策與加密情緒同步走弱,2026 年第三季度可能會對風險資產構成重大考驗。
BTC:可能的築底階段
SPX:約 7.3K 的下行情景
新一輪美聯儲領導層週期可能會重塑市場對利率、流動性與金融狀況的預期。
首次降息並不必然意味着牛市。
如果對衰退的擔憂加劇,市場一開始可能會把“寬鬆”解讀爲對經濟走弱的迴應。
加密情緒:極端恐懼情景
如果比特幣重新站上關鍵阻力位、機構需求增強,第四季度可能帶來不同的格局。
BTC:高於 84K 美元
若《CLARITY 法案》最終成爲法律,監管清晰度也可能成爲另一項催化因素。
AI 基礎設施與加密採用也可能爲資金輪動創造新的敘事。
2027 年 BTC 情景:160K+ 美元
若經濟走弱變得更爲明顯,三次美聯儲降息將意味着貨幣環境的重大轉變。
在貨幣不確定性期間,比特幣可能會越來越多地與其他稀缺資產一起被看待。
但路徑不會是線性的。
12 個月內實現 2 倍回報,需要比特幣大致達到第三季度入場水平的兩倍。
這仍然只是一個情景,而非必然結果。
最強的機會往往出現在情緒最弱的時候。
恐懼會帶來機會。
流動性決定時點。
118
·
--
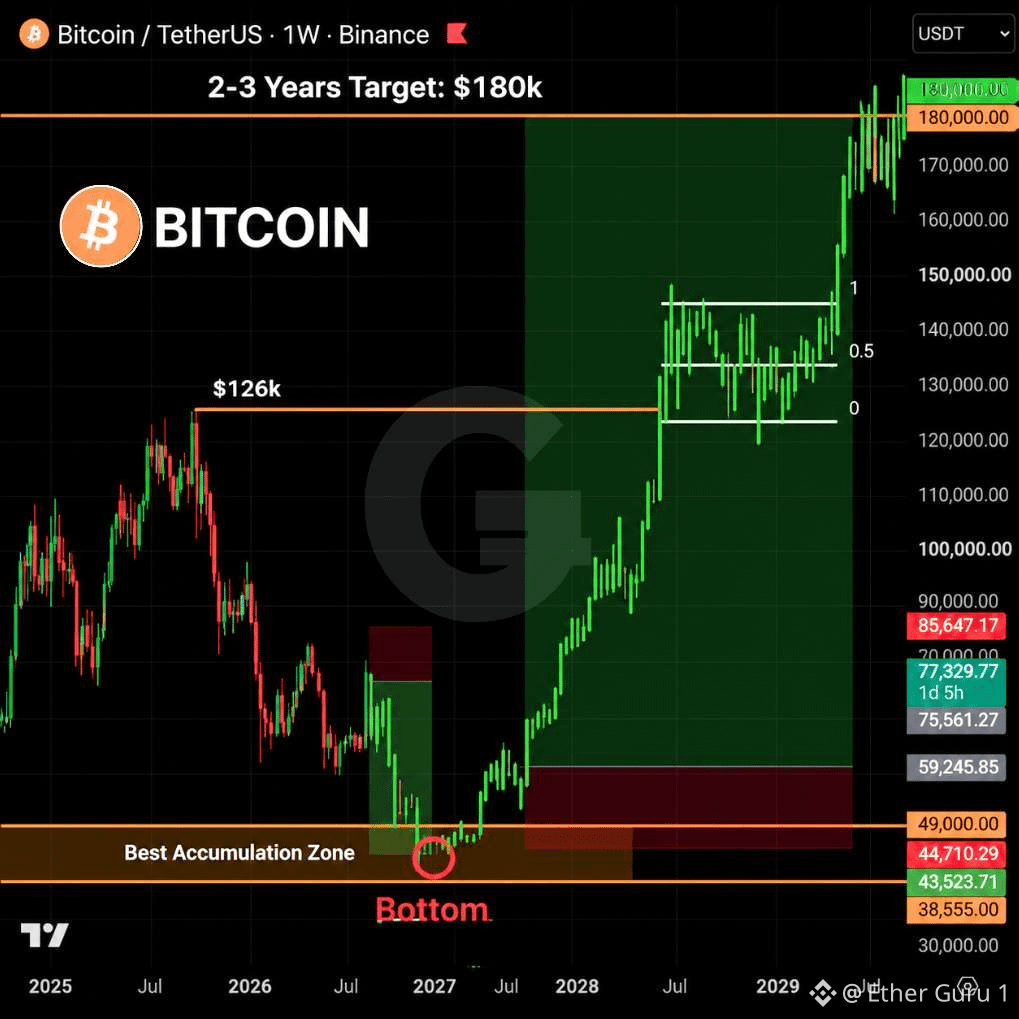
$BTC $BTC 路線圖 🧭
比特幣當前的態勢正圍繞從 77K 開始的起點進行繪製。
熊市情景的預測目標是:潛在的週期底部區域在 39K–49K。
這將意味着從 77K 出現可能的 36%–49% 回撤。
隨後,長期牛市情景則指向接下來 2–3 年內達到 180K。
從 45K 的中值出發,180K 需要大約 4 倍的增長。
這屬於技術性情景——39K–49K 區域並非已確認的底部。
策略是在將該區間視爲累積機會之前,先觀察恐慌情緒、流動性與結構變化。
$BTC $BTC 路線圖 🧭
比特幣當前的態勢正圍繞從 77K 開始的起點進行繪製。
熊市情景的預測目標是:潛在的週期底部區域在 39K–49K。
這將意味着從 77K 出現可能的 36%–49% 回撤。
隨後,長期牛市情景則指向接下來 2–3 年內達到 180K。
從 45K 的中值出發,180K 需要大約 4 倍的增長。
這屬於技術性情景——39K–49K 區域並非已確認的底部。
策略是在將該區間視爲累積機會之前,先觀察恐慌情緒、流動性與結構變化。
比特幣當前的態勢正圍繞從 77K 開始的起點進行繪製。
熊市情景的預測目標是:潛在的週期底部區域在 39K–49K。
這將意味着從 77K 出現可能的 36%–49% 回撤。
隨後,長期牛市情景則指向接下來 2–3 年內達到 180K。
從 45K 的中值出發,180K 需要大約 4 倍的增長。
這屬於技術性情景——39K–49K 區域並非已確認的底部。
策略是在將該區間視爲累積機會之前,先觀察恐慌情緒、流動性與結構變化。
91
·
--
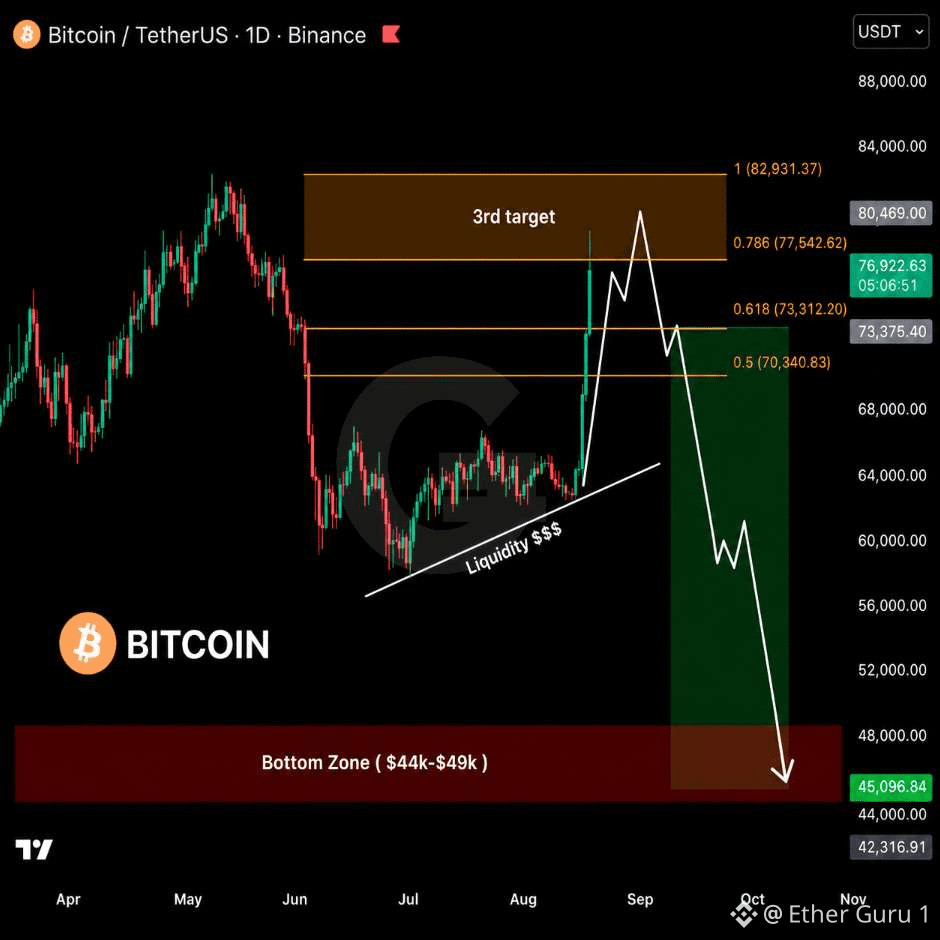
$BTC 戰術翻轉 🧭
此前所有 $BTC 多頭目標現已全部觸及——策略已轉向潛在的空頭設置。
$52K–$63K 多頭區:已完成 ✅
1H/4H 看跌結構突破:已完成 ✅
0.618–0.786 斐波那契區間:已完成 ✅
牛市陷阱形態:已完成 ✅
下一觸發條件:僅在確認看跌結構後才建立空單。
下行路線圖目標指向:在 $57K 下方進行一次流動性掃蕩。
最終“拋壓”情景:$42K–$49K。
BTC 僅用 2 天就完成了整個做多路線圖,並得益於大量空頭回補/清算加速。
最新一波 BTC 拉昇也引發了多個山寨幣的重大突破。
策略現在取決於:在下一步操作之前,BTC 是否會出現確認的更低高點 + 看跌結構。
$BTC 戰術翻轉 🧭
此前所有 $BTC 多頭目標現已全部觸及——策略已轉向潛在的空頭設置。
$52K–$63K 多頭區:已完成 ✅
1H/4H 看跌結構突破:已完成 ✅
0.618–0.786 斐波那契區間:已完成 ✅
牛市陷阱形態:已完成 ✅
下一觸發條件:僅在確認看跌結構後才建立空單。
下行路線圖目標指向:在 $57K 下方進行一次流動性掃蕩。
最終“拋壓”情景:$42K–$49K。
BTC 僅用 2 天就完成了整個做多路線圖,並得益於大量空頭回補/清算加速。
最新一波 BTC 拉昇也引發了多個山寨幣的重大突破。
策略現在取決於:在下一步操作之前,BTC 是否會出現確認的更低高點 + 看跌結構。
此前所有 $BTC 多頭目標現已全部觸及——策略已轉向潛在的空頭設置。
$52K–$63K 多頭區:已完成 ✅
1H/4H 看跌結構突破:已完成 ✅
0.618–0.786 斐波那契區間:已完成 ✅
牛市陷阱形態:已完成 ✅
下一觸發條件:僅在確認看跌結構後才建立空單。
下行路線圖目標指向:在 $57K 下方進行一次流動性掃蕩。
最終“拋壓”情景:$42K–$49K。
BTC 僅用 2 天就完成了整個做多路線圖,並得益於大量空頭回補/清算加速。
最新一波 BTC 拉昇也引發了多個山寨幣的重大突破。
策略現在取決於:在下一步操作之前,BTC 是否會出現確認的更低高點 + 看跌結構。
64
·
--
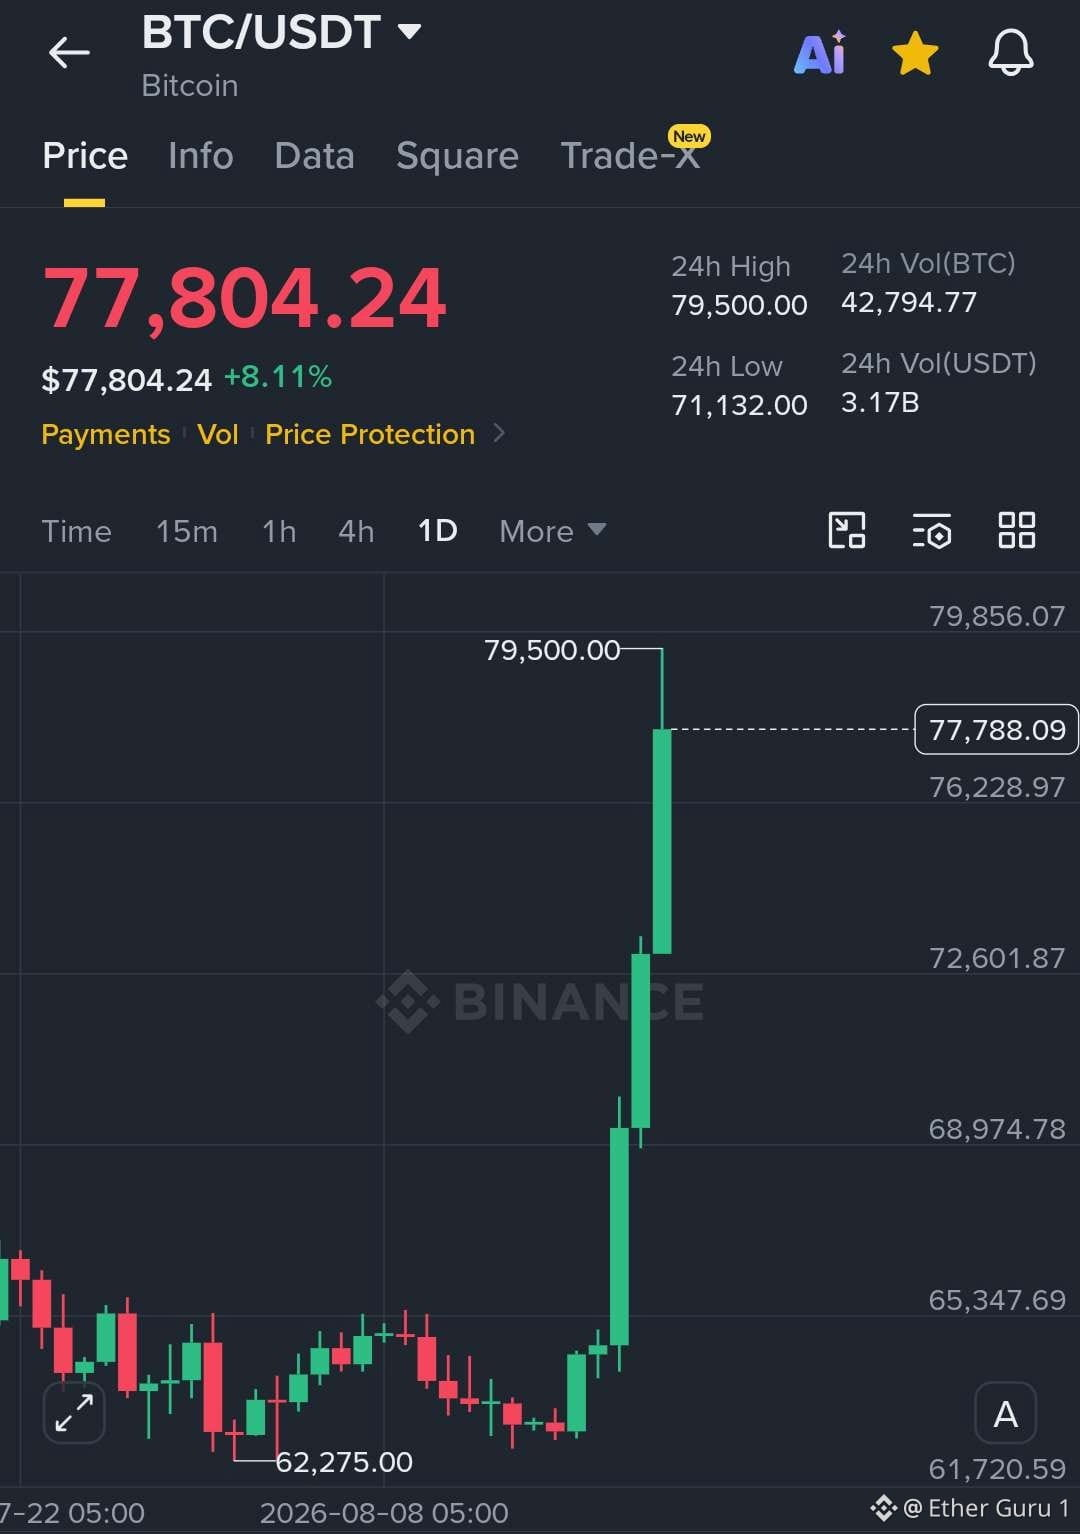
$BTC 突破 🚀
比特幣剛剛首次觸及約 78,000 美元,爲大約三個月以來的首次。
在短短几天內,BTC 從 63,000 美元附近區域上漲了約 24%。
這次行情推動了數十億美元的槓桿空頭倉位被迫平倉。
當被清算的空頭不得不重新買入 BTC 時,空頭擠壓可能會加速價格上漲。
如果要稱其爲“史上最大空頭擠壓”,則需要經過驗證的歷史記錄對比。
但這波行情的速度顯然正在重塑加密市場的倉位佈局。
$BTC 突破 🚀
比特幣剛剛首次觸及約 78,000 美元,爲大約三個月以來的首次。
在短短几天內,BTC 從 63,000 美元附近區域上漲了約 24%。
這次行情推動了數十億美元的槓桿空頭倉位被迫平倉。
當被清算的空頭不得不重新買入 BTC 時,空頭擠壓可能會加速價格上漲。
如果要稱其爲“史上最大空頭擠壓”,則需要經過驗證的歷史記錄對比。
但這波行情的速度顯然正在重塑加密市場的倉位佈局。
比特幣剛剛首次觸及約 78,000 美元,爲大約三個月以來的首次。
在短短几天內,BTC 從 63,000 美元附近區域上漲了約 24%。
這次行情推動了數十億美元的槓桿空頭倉位被迫平倉。
當被清算的空頭不得不重新買入 BTC 時,空頭擠壓可能會加速價格上漲。
如果要稱其爲“史上最大空頭擠壓”,則需要經過驗證的歷史記錄對比。
但這波行情的速度顯然正在重塑加密市場的倉位佈局。
70
登入以探索更多內容
加入幣安廣場中的全球加密貨幣用戶
⚡️ 獲取加密貨幣的最新和實用資訊。
💬 受到全球最大加密貨幣交易所的信任。
👍 發掘來自經過驗證創作者的真實見解。
電子郵件 / 電話號碼