

KCM 1
144 貼文

KCM 1
舉報
封鎖用戶
0 關注
6 粉絲
18 點讚數
貼文
·
--
查看翻譯
While late buyers chase the extended rally, this supply rejection setup on $BTC is positioning for a deep corrective retracement toward lower liquidity zones.
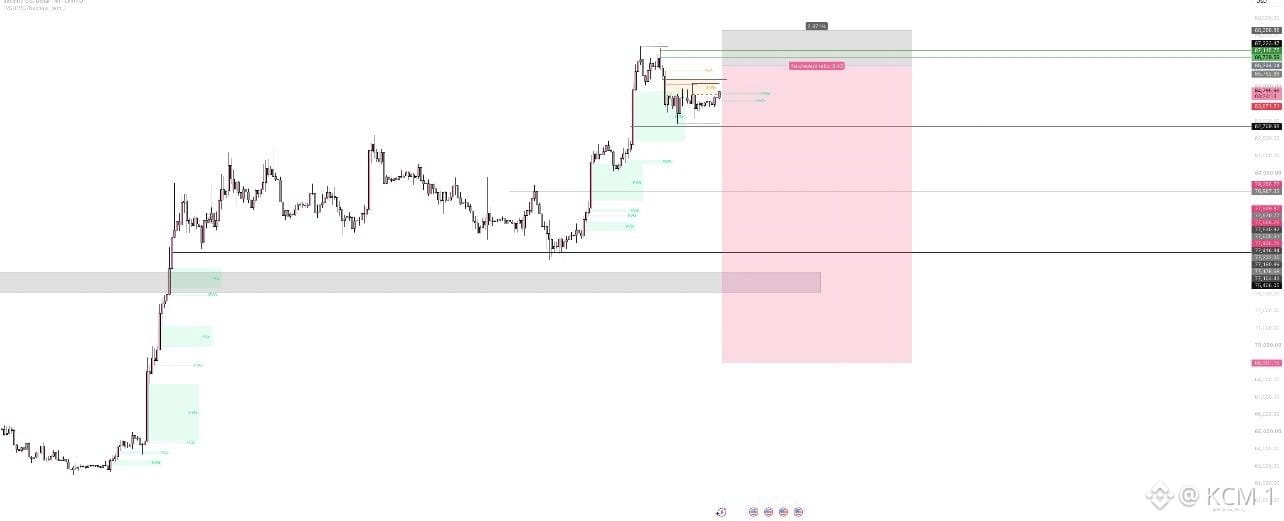
After hitting local highs, price tapped directly into a premium supply block near $87,712.47 and printed a clear lower-high distribution structure. The current price action around $85,271.51 shows seller control, validating a short entry setup with an attractive risk-to-reward ratio.
Holding below the invalidation level above $87,712.47 maintains the short bias, targeting primary downside levels at $82,729.09 and $78,358.77 , with ultimate expansion toward the major support zone around $75,429.35 . A daily close above $87,712.47 invalidates the short thesis and reopens bullish momentum.
Don't buy into overhead distribution—wait for supply rejections to confirm high-probability corrective setups.
#BTC #Bitcoin #CryptoAnalysis #TechnicalAnalysis #Trading
While late buyers chase the extended rally, this supply rejection setup on $BTC is positioning for a deep corrective retracement toward lower liquidity zones.
After hitting local highs, price tapped directly into a premium supply block near $87,712.47 and printed a clear lower-high distribution structure. The current price action around $85,271.51 shows seller control, validating a short entry setup with an attractive risk-to-reward ratio.
Holding below the invalidation level above $87,712.47 maintains the short bias, targeting primary downside levels at $82,729.09 and $78,358.77 , with ultimate expansion toward the major support zone around $75,429.35 . A daily close above $87,712.47 invalidates the short thesis and reopens bullish momentum.
Don't buy into overhead distribution—wait for supply rejections to confirm high-probability corrective setups.
#BTC #Bitcoin #CryptoAnalysis #TechnicalAnalysis #Trading
After hitting local highs, price tapped directly into a premium supply block near $87,712.47 and printed a clear lower-high distribution structure. The current price action around $85,271.51 shows seller control, validating a short entry setup with an attractive risk-to-reward ratio.
Holding below the invalidation level above $87,712.47 maintains the short bias, targeting primary downside levels at $82,729.09 and $78,358.77 , with ultimate expansion toward the major support zone around $75,429.35 . A daily close above $87,712.47 invalidates the short thesis and reopens bullish momentum.
Don't buy into overhead distribution—wait for supply rejections to confirm high-probability corrective setups.
#BTC #Bitcoin #CryptoAnalysis #TechnicalAnalysis #Trading
68
·
--
查看翻譯
$ACU Transparency Update
Acurast has published its ACU Token Transparency Filing through the Blockworks Token Transparency Framework, giving the community a clearer look at token allocation, vesting, unlocks, governance, treasury, and administrative controls.
Transparency matters. Instead of guessing, the community can now review the details and verify the information for themselves.
#ACU #Acurast #Crypto #Tokenomics
$ACU Transparency Update
Acurast has published its ACU Token Transparency Filing through the Blockworks Token Transparency Framework, giving the community a clearer look at token allocation, vesting, unlocks, governance, treasury, and administrative controls.
Transparency matters. Instead of guessing, the community can now review the details and verify the information for themselves.
#ACU #Acurast #Crypto #Tokenomics
Acurast has published its ACU Token Transparency Filing through the Blockworks Token Transparency Framework, giving the community a clearer look at token allocation, vesting, unlocks, governance, treasury, and administrative controls.
Transparency matters. Instead of guessing, the community can now review the details and verify the information for themselves.
#ACU #Acurast #Crypto #Tokenomics

90
·
--
查看翻譯
While retail sentiment remains distracted by short-term volatility, this multi-year market cap chart for $DOGE is defending a critical macro support floor.
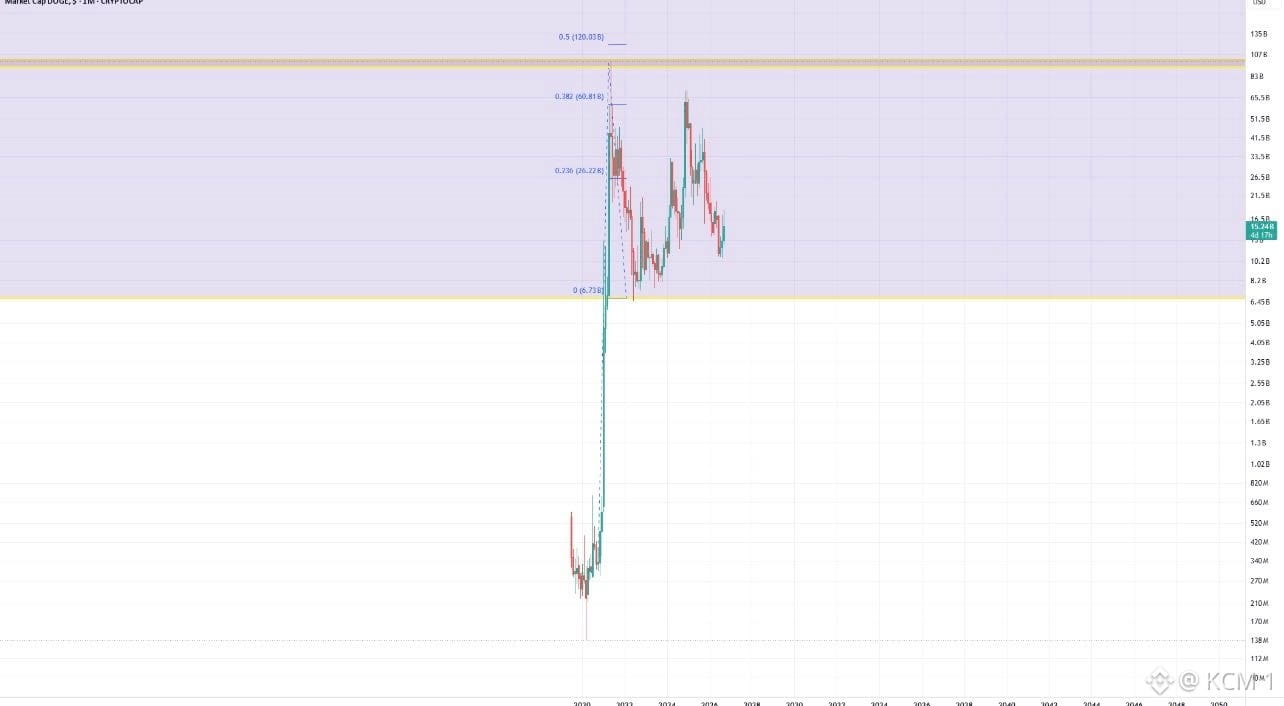
After sweeping historical highs into the major resistance zone above 100B, market cap pulled back to retest macro Fibonacci retracement levels. The current structure shows valuations holding firmly above the baseline support band around 6.73B (0 Fib), coiling inside a long-term accumulation range between lower support and overhead resistance.
Sustaining position above the 6.73B macro support floor keeps the long-term bullish cycle alive, setting the stage for subsequent expansion attempts toward the 0.236 Fib at 20.27B and the 0.382 Fib at 50.81B . A breakdown below the 6.73B floor invalidates the macro range support thesis, risking further valuation compression.
Don't ignore multi-year range boundaries—macro support defenses pave the way for the next cyclical expansion.
#DOGE #Dogecoin #CryptoAnalysis #TechnicalAnalysis
While retail sentiment remains distracted by short-term volatility, this multi-year market cap chart for $DOGE is defending a critical macro support floor.
After sweeping historical highs into the major resistance zone above 100B, market cap pulled back to retest macro Fibonacci retracement levels. The current structure shows valuations holding firmly above the baseline support band around 6.73B (0 Fib), coiling inside a long-term accumulation range between lower support and overhead resistance.
Sustaining position above the 6.73B macro support floor keeps the long-term bullish cycle alive, setting the stage for subsequent expansion attempts toward the 0.236 Fib at 20.27B and the 0.382 Fib at 50.81B . A breakdown below the 6.73B floor invalidates the macro range support thesis, risking further valuation compression.
Don't ignore multi-year range boundaries—macro support defenses pave the way for the next cyclical expansion.
#DOGE #Dogecoin #CryptoAnalysis #TechnicalAnalysis
After sweeping historical highs into the major resistance zone above 100B, market cap pulled back to retest macro Fibonacci retracement levels. The current structure shows valuations holding firmly above the baseline support band around 6.73B (0 Fib), coiling inside a long-term accumulation range between lower support and overhead resistance.
Sustaining position above the 6.73B macro support floor keeps the long-term bullish cycle alive, setting the stage for subsequent expansion attempts toward the 0.236 Fib at 20.27B and the 0.382 Fib at 50.81B . A breakdown below the 6.73B floor invalidates the macro range support thesis, risking further valuation compression.
Don't ignore multi-year range boundaries—macro support defenses pave the way for the next cyclical expansion.
#DOGE #Dogecoin #CryptoAnalysis #TechnicalAnalysis
68
·
--
查看翻譯
While many anticipate local resistance consolidation, this primary Elliott Wave structure on $BTC is signaling a macro wave (5) impulse targeting $98,000 .
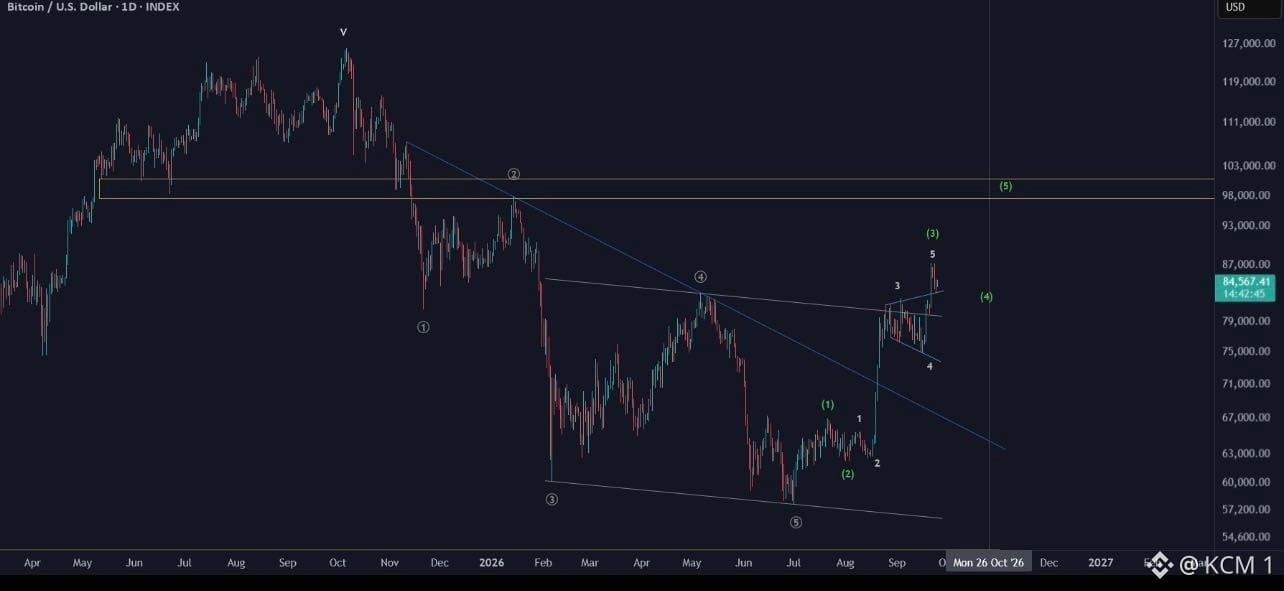
After completing a major corrective sequence into wave (5) lower, price broke out of the primary descending channel and initiated a new impulse wave count. The aggressive surge out of the sub-wave 4 bull flag completed sub-wave 5 of primary wave (3), currently trading around $84,567.41.
A healthy shallow retracement into wave (4) above dynamic trendline support around $79,000 maintains the bullish wave structure. Resolving into primary wave (5) unlocks higher targets at the horizontal resistance band between $98,000 and $103,000. A breakdown back inside the channel below $71,000 invalidates this impulsive wave count.
Don't trade against primary Elliott Wave impulses—respect macro trendline breakouts as wave (5) expansions unfold.
#BTC #Bitcoin #CryptoAnalysis #TechnicalAnalysis #ElliottWave
While many anticipate local resistance consolidation, this primary Elliott Wave structure on $BTC is signaling a macro wave (5) impulse targeting $98,000 .
After completing a major corrective sequence into wave (5) lower, price broke out of the primary descending channel and initiated a new impulse wave count. The aggressive surge out of the sub-wave 4 bull flag completed sub-wave 5 of primary wave (3), currently trading around $84,567.41.
A healthy shallow retracement into wave (4) above dynamic trendline support around $79,000 maintains the bullish wave structure. Resolving into primary wave (5) unlocks higher targets at the horizontal resistance band between $98,000 and $103,000. A breakdown back inside the channel below $71,000 invalidates this impulsive wave count.
Don't trade against primary Elliott Wave impulses—respect macro trendline breakouts as wave (5) expansions unfold.
#BTC #Bitcoin #CryptoAnalysis #TechnicalAnalysis #ElliottWave
After completing a major corrective sequence into wave (5) lower, price broke out of the primary descending channel and initiated a new impulse wave count. The aggressive surge out of the sub-wave 4 bull flag completed sub-wave 5 of primary wave (3), currently trading around $84,567.41.
A healthy shallow retracement into wave (4) above dynamic trendline support around $79,000 maintains the bullish wave structure. Resolving into primary wave (5) unlocks higher targets at the horizontal resistance band between $98,000 and $103,000. A breakdown back inside the channel below $71,000 invalidates this impulsive wave count.
Don't trade against primary Elliott Wave impulses—respect macro trendline breakouts as wave (5) expansions unfold.
#BTC #Bitcoin #CryptoAnalysis #TechnicalAnalysis #ElliottWave
56
·
--
查看翻譯
While the broader market consolidates, this symmetrical triangle breakout on $ORCA is signaling a major shift toward bullish expansion.
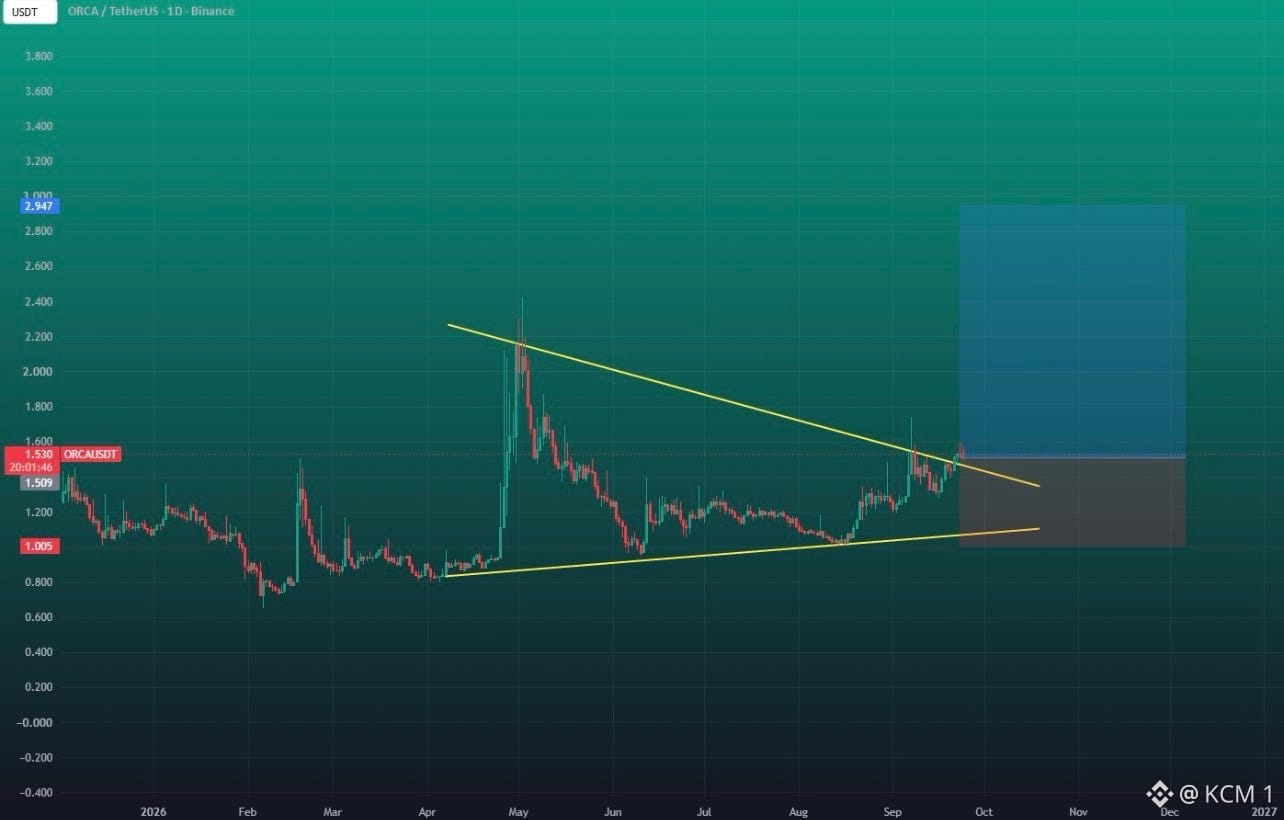
After months of compression inside converging trendlines, price has broken out above the upper diagonal ceiling around $1.530[span_0](start_span)[span_0](end_span). This clean daily breakout confirms buyer control and signals the end of a multi-month accumulation phase[span_1](start_span)[span_1](end_span).
Holding above the breakout level at $1.509 validates the long trade setup, targeting a multi-stage rally toward $2.947[span_2](start_span)[span_2](end_span). However, a failure to sustain momentum that brings price back inside the pattern below key support at $1.005 invalidates the breakout thesis[span_3](start_span)[span_3](end_span).
Don't ignore multi-month triangle breakouts—compression patterns often precede the strongest directional expansions.
#ORCA #CryptoAnalysis #TechnicalAnalysis #Trading
While the broader market consolidates, this symmetrical triangle breakout on $ORCA is signaling a major shift toward bullish expansion.
After months of compression inside converging trendlines, price has broken out above the upper diagonal ceiling around $1.530[span_0](start_span)[span_0](end_span). This clean daily breakout confirms buyer control and signals the end of a multi-month accumulation phase[span_1](start_span)[span_1](end_span).
Holding above the breakout level at $1.509 validates the long trade setup, targeting a multi-stage rally toward $2.947[span_2](start_span)[span_2](end_span). However, a failure to sustain momentum that brings price back inside the pattern below key support at $1.005 invalidates the breakout thesis[span_3](start_span)[span_3](end_span).
Don't ignore multi-month triangle breakouts—compression patterns often precede the strongest directional expansions.
#ORCA #CryptoAnalysis #TechnicalAnalysis #Trading
After months of compression inside converging trendlines, price has broken out above the upper diagonal ceiling around $1.530[span_0](start_span)[span_0](end_span). This clean daily breakout confirms buyer control and signals the end of a multi-month accumulation phase[span_1](start_span)[span_1](end_span).
Holding above the breakout level at $1.509 validates the long trade setup, targeting a multi-stage rally toward $2.947[span_2](start_span)[span_2](end_span). However, a failure to sustain momentum that brings price back inside the pattern below key support at $1.005 invalidates the breakout thesis[span_3](start_span)[span_3](end_span).
Don't ignore multi-month triangle breakouts—compression patterns often precede the strongest directional expansions.
#ORCA #CryptoAnalysis #TechnicalAnalysis #Trading
65
·
--
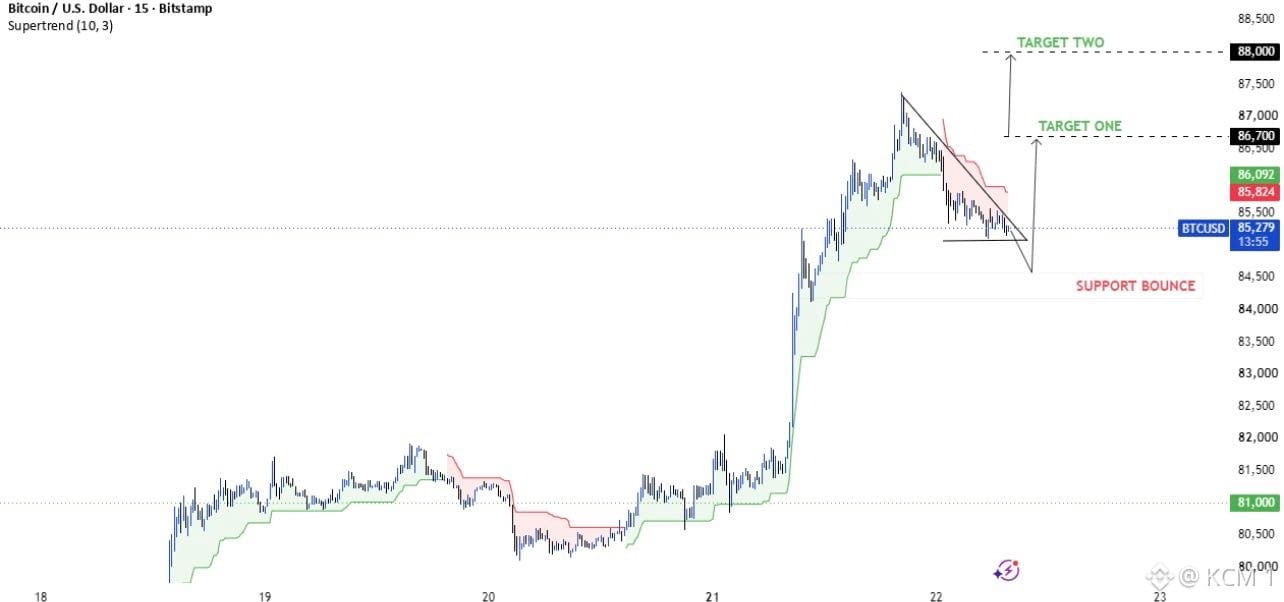
在突破賣家做空回撤的同時,這個位於 $BTC 上的下跌楔形盤整正在關鍵盤中支撐的正上方緊密纏繞,為看多延續做準備。
在強勁上漲之後,價格回撤至一個緊密的下降楔形結構內,目前正測試接近 $85,279[span_0](start_span)[span_0](end_span) 的支撐。Supertrend 指標與本地水平支撐區顯示,買方正在守住下邊界,可能帶來從旗形結構中向外擴張的機會[span_1](start_span)[span_1](end_span)。
若能有效突破下降楔形的阻力趨勢線,將確認上行走勢,第一目標看向 $86,700,第二目標在 $88,000[span_2](start_span)[span_2](end_span)。只要能守在接近 $84,500 的本地支撐之上,就能維持看多論點;但若跌破,則會使該設置失效[span_3](start_span)[span_3](end_span)。
不要在下跌楔形支撐處做空——等待價格擴張以確認下一段上行。
#BTC #Bitcoin #CryptoAnalysis #TechnicalAnalysis #Trading
在突破賣家做空回撤的同時,這個位於 $BTC 上的下跌楔形盤整正在關鍵盤中支撐的正上方緊密纏繞,為看多延續做準備。
在強勁上漲之後,價格回撤至一個緊密的下降楔形結構內,目前正測試接近 $85,279[span_0](start_span)[span_0](end_span) 的支撐。Supertrend 指標與本地水平支撐區顯示,買方正在守住下邊界,可能帶來從旗形結構中向外擴張的機會[span_1](start_span)[span_1](end_span)。
若能有效突破下降楔形的阻力趨勢線,將確認上行走勢,第一目標看向 $86,700,第二目標在 $88,000[span_2](start_span)[span_2](end_span)。只要能守在接近 $84,500 的本地支撐之上,就能維持看多論點;但若跌破,則會使該設置失效[span_3](start_span)[span_3](end_span)。
不要在下跌楔形支撐處做空——等待價格擴張以確認下一段上行。
#BTC #Bitcoin #CryptoAnalysis #TechnicalAnalysis #Trading
在強勁上漲之後,價格回撤至一個緊密的下降楔形結構內,目前正測試接近 $85,279[span_0](start_span)[span_0](end_span) 的支撐。Supertrend 指標與本地水平支撐區顯示,買方正在守住下邊界,可能帶來從旗形結構中向外擴張的機會[span_1](start_span)[span_1](end_span)。
若能有效突破下降楔形的阻力趨勢線,將確認上行走勢,第一目標看向 $86,700,第二目標在 $88,000[span_2](start_span)[span_2](end_span)。只要能守在接近 $84,500 的本地支撐之上,就能維持看多論點;但若跌破,則會使該設置失效[span_3](start_span)[span_3](end_span)。
不要在下跌楔形支撐處做空——等待價格擴張以確認下一段上行。
#BTC #Bitcoin #CryptoAnalysis #TechnicalAnalysis #Trading
49
·
--
查看翻譯
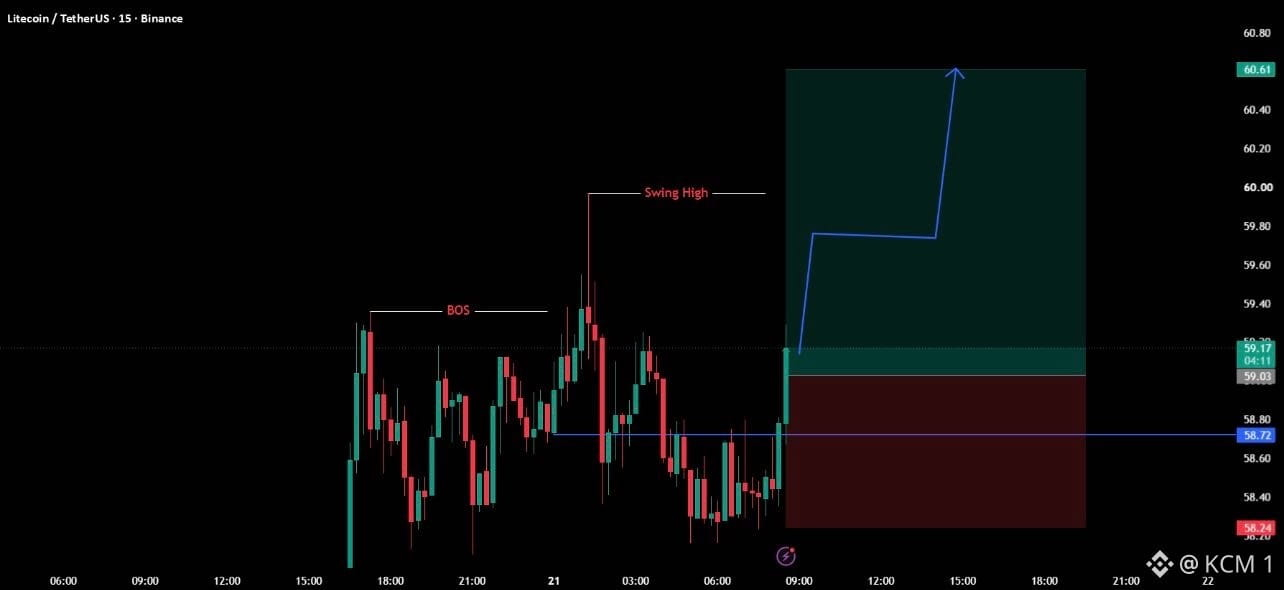
While many wait for higher timeframe confirmation, this intraday break of structure on $LTC is triggering a high-RR long continuation setup.
After establishing a clear Break of Structure (BOS) and printing a key swing high, price swept lower timeframe liquidity before aggressive buyers stepped in near $58.72 . The strong bullish engulfing candle off the internal low confirms demand absorption, shifting local momentum back toward the upside.
Holding above the trade invalidation level at $58.24 preserves the bullish momentum, targeting a sweep of the previous swing high followed by full expansion toward $60.61 . A failure to defend support and a drop below $58.24 invalidates the trade setup, signaling a deeper pullback toward lower demand blocks.
Don't wait for price to run away—align entries with lower timeframe structure shifts off key demand zones.
#LTC #Litecoin #CryptoAnalysis #TechnicalAnalysis #Trading
While many wait for higher timeframe confirmation, this intraday break of structure on $LTC is triggering a high-RR long continuation setup.
After establishing a clear Break of Structure (BOS) and printing a key swing high, price swept lower timeframe liquidity before aggressive buyers stepped in near $58.72 . The strong bullish engulfing candle off the internal low confirms demand absorption, shifting local momentum back toward the upside.
Holding above the trade invalidation level at $58.24 preserves the bullish momentum, targeting a sweep of the previous swing high followed by full expansion toward $60.61 . A failure to defend support and a drop below $58.24 invalidates the trade setup, signaling a deeper pullback toward lower demand blocks.
Don't wait for price to run away—align entries with lower timeframe structure shifts off key demand zones.
#LTC #Litecoin #CryptoAnalysis #TechnicalAnalysis #Trading
After establishing a clear Break of Structure (BOS) and printing a key swing high, price swept lower timeframe liquidity before aggressive buyers stepped in near $58.72 . The strong bullish engulfing candle off the internal low confirms demand absorption, shifting local momentum back toward the upside.
Holding above the trade invalidation level at $58.24 preserves the bullish momentum, targeting a sweep of the previous swing high followed by full expansion toward $60.61 . A failure to defend support and a drop below $58.24 invalidates the trade setup, signaling a deeper pullback toward lower demand blocks.
Don't wait for price to run away—align entries with lower timeframe structure shifts off key demand zones.
#LTC #Litecoin #CryptoAnalysis #TechnicalAnalysis #Trading
576
·
--
查看翻譯
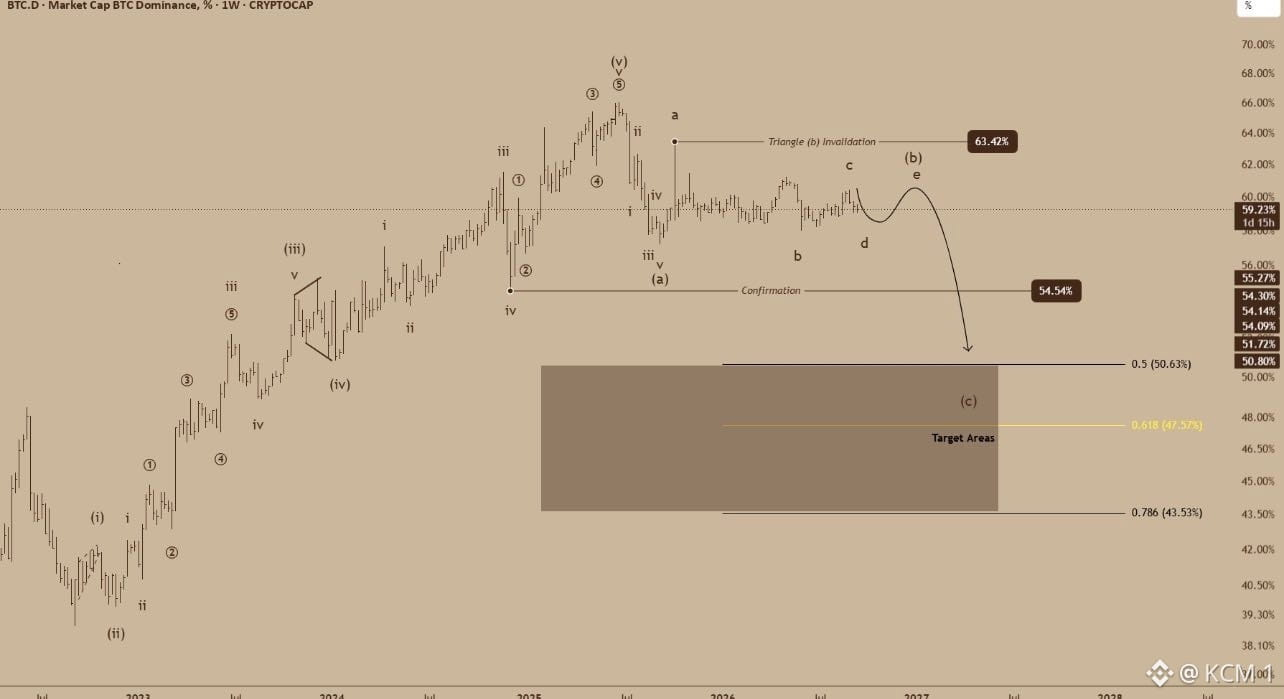
While Bitcoin maximalists position for higher dominance, this Elliott Wave triangle pattern on $BTC .D is signaling a macro breakdown that could pave the way for an extended altcoin expansion.
After completing a primary 5-wave motive structure, market dominance is now consolidating inside a corrective triangle wave (b) pattern around 59.23% . The Elliott Wave projection anticipates a final sub-wave completion within the triangle before resolving in an aggressive wave (c) impulse lower.
Holding below the triangle invalidation level at 63.42% preserves the corrective consolidation framework. A breakdown and weekly close below confirmation support at 54.54% triggers the wave (c) decline, targeting lower Fibonacci support zones at 50.63% (0.5 Fib), 47.57% (0.618 Fib), and 43.53% (0.786 Fib).
Don't ignore shifts in market dominance—watching $BTC .D breakdown confirms when liquidity flows aggressively into alts.
#BTC #BTC dominance #Altseason #CryptoAnalysis #TechnicalAnalysis
While Bitcoin maximalists position for higher dominance, this Elliott Wave triangle pattern on $BTC .D is signaling a macro breakdown that could pave the way for an extended altcoin expansion.
After completing a primary 5-wave motive structure, market dominance is now consolidating inside a corrective triangle wave (b) pattern around 59.23% . The Elliott Wave projection anticipates a final sub-wave completion within the triangle before resolving in an aggressive wave (c) impulse lower.
Holding below the triangle invalidation level at 63.42% preserves the corrective consolidation framework. A breakdown and weekly close below confirmation support at 54.54% triggers the wave (c) decline, targeting lower Fibonacci support zones at 50.63% (0.5 Fib), 47.57% (0.618 Fib), and 43.53% (0.786 Fib).
Don't ignore shifts in market dominance—watching $BTC .D breakdown confirms when liquidity flows aggressively into alts.
#BTC #BTC dominance #Altseason #CryptoAnalysis #TechnicalAnalysis
After completing a primary 5-wave motive structure, market dominance is now consolidating inside a corrective triangle wave (b) pattern around 59.23% . The Elliott Wave projection anticipates a final sub-wave completion within the triangle before resolving in an aggressive wave (c) impulse lower.
Holding below the triangle invalidation level at 63.42% preserves the corrective consolidation framework. A breakdown and weekly close below confirmation support at 54.54% triggers the wave (c) decline, targeting lower Fibonacci support zones at 50.63% (0.5 Fib), 47.57% (0.618 Fib), and 43.53% (0.786 Fib).
Don't ignore shifts in market dominance—watching $BTC .D breakdown confirms when liquidity flows aggressively into alts.
#BTC #BTC dominance #Altseason #CryptoAnalysis #TechnicalAnalysis
41
·
--
查看翻譯
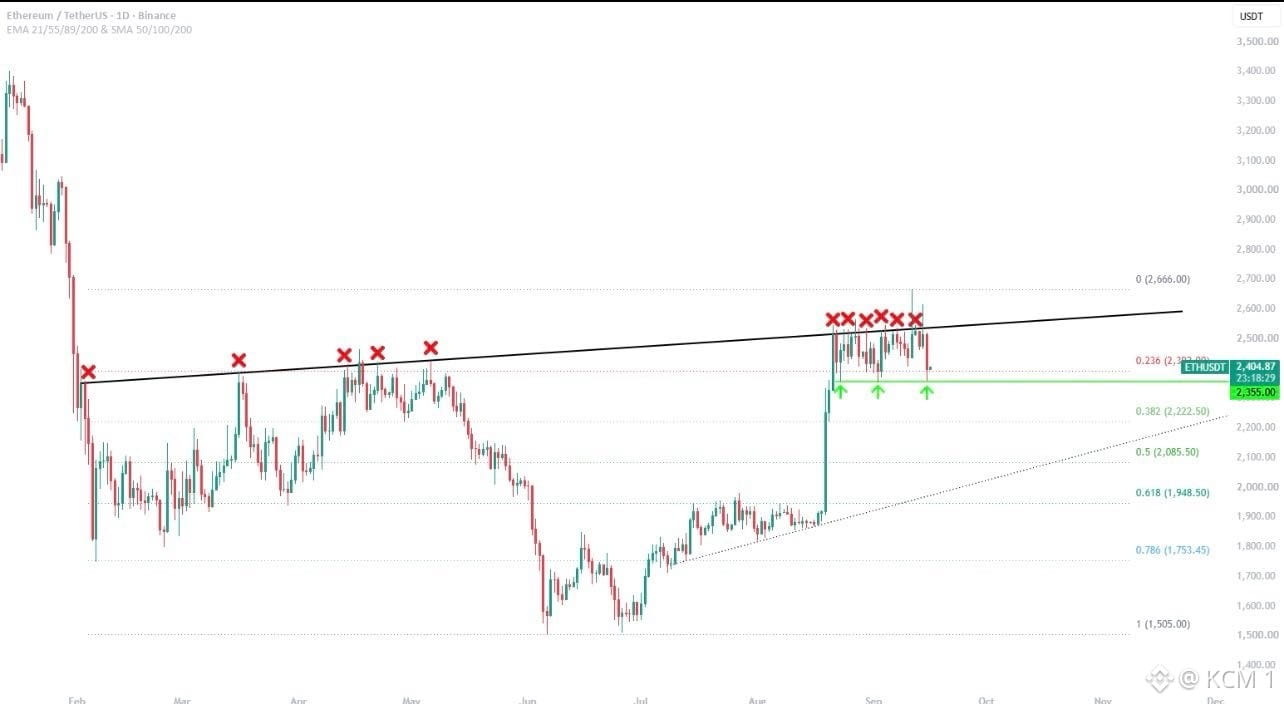
While many focus on the repeated overhead rejections, this consolidation range on $ETH is holding a crucial horizontal support level.
After failing multiple attempts to break through the ascending resistance line marked by red rejection X's, price has pulled back toward the horizontal demand line at $2,355.00 . The repeated green arrow bounces off this level indicate strong buying interest absorbing overhead selling pressure inside the consolidation range.
A solid hold above $2,355.00 keeps the bullish accumulation structure active, setting up another attempt to clear dynamic resistance near $2,600.00 . However, a daily close below $2,355.00 invalidates the range setup, opening downside potential toward lower Fibonacci levels at $2,222.50 and $2,085.50 .
Don't panic on repeated rejections—watch how price defends key horizontal support levels before the next major move.
#ETH #Ethereum #CryptoAnalysis #TechnicalAnalysis
While many focus on the repeated overhead rejections, this consolidation range on $ETH is holding a crucial horizontal support level.
After failing multiple attempts to break through the ascending resistance line marked by red rejection X's, price has pulled back toward the horizontal demand line at $2,355.00 . The repeated green arrow bounces off this level indicate strong buying interest absorbing overhead selling pressure inside the consolidation range.
A solid hold above $2,355.00 keeps the bullish accumulation structure active, setting up another attempt to clear dynamic resistance near $2,600.00 . However, a daily close below $2,355.00 invalidates the range setup, opening downside potential toward lower Fibonacci levels at $2,222.50 and $2,085.50 .
Don't panic on repeated rejections—watch how price defends key horizontal support levels before the next major move.
#ETH #Ethereum #CryptoAnalysis #TechnicalAnalysis
After failing multiple attempts to break through the ascending resistance line marked by red rejection X's, price has pulled back toward the horizontal demand line at $2,355.00 . The repeated green arrow bounces off this level indicate strong buying interest absorbing overhead selling pressure inside the consolidation range.
A solid hold above $2,355.00 keeps the bullish accumulation structure active, setting up another attempt to clear dynamic resistance near $2,600.00 . However, a daily close below $2,355.00 invalidates the range setup, opening downside potential toward lower Fibonacci levels at $2,222.50 and $2,085.50 .
Don't panic on repeated rejections—watch how price defends key horizontal support levels before the next major move.
#ETH #Ethereum #CryptoAnalysis #TechnicalAnalysis
55
·
--
查看翻譯
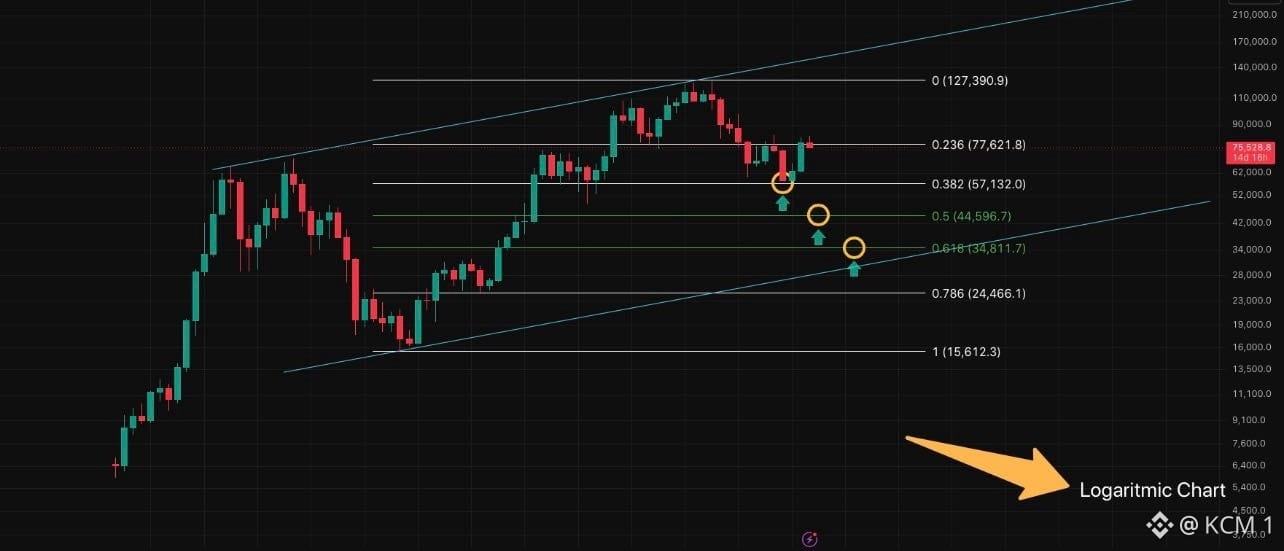
While bulls celebrate local bounces, this logarithmic channel setup on $BTC is signaling a macro correction targeting key Fibonacci retracement levels.
After peaking near the top channel boundary at $127,390.9 , price broke down through intermediate support and is now testing the 0.236 Fib level around $77,621.8 . The failure to hold upper range structure confirms a macro corrective cycle unfolding inside the multi-year channel.
Rejection beneath $77,621.8 opens sequential downside targets at the 0.382 Fib at $57,132.0 , followed by the 0.5 Fib at $44,596.7 and 0.618 Fib at $34,811.7 . Reclaiming and holding above $77,621.8 is required to invalidate the macro correction thesis and rebuild bullish momentum.
Don't ignore logarithmic channel boundaries—macro Fibonacci levels guide deep market corrections.
#BTC #Bitcoin #CryptoAnalysis #TechnicalAnalysis
While bulls celebrate local bounces, this logarithmic channel setup on $BTC is signaling a macro correction targeting key Fibonacci retracement levels.
After peaking near the top channel boundary at $127,390.9 , price broke down through intermediate support and is now testing the 0.236 Fib level around $77,621.8 . The failure to hold upper range structure confirms a macro corrective cycle unfolding inside the multi-year channel.
Rejection beneath $77,621.8 opens sequential downside targets at the 0.382 Fib at $57,132.0 , followed by the 0.5 Fib at $44,596.7 and 0.618 Fib at $34,811.7 . Reclaiming and holding above $77,621.8 is required to invalidate the macro correction thesis and rebuild bullish momentum.
Don't ignore logarithmic channel boundaries—macro Fibonacci levels guide deep market corrections.
#BTC #Bitcoin #CryptoAnalysis #TechnicalAnalysis
After peaking near the top channel boundary at $127,390.9 , price broke down through intermediate support and is now testing the 0.236 Fib level around $77,621.8 . The failure to hold upper range structure confirms a macro corrective cycle unfolding inside the multi-year channel.
Rejection beneath $77,621.8 opens sequential downside targets at the 0.382 Fib at $57,132.0 , followed by the 0.5 Fib at $44,596.7 and 0.618 Fib at $34,811.7 . Reclaiming and holding above $77,621.8 is required to invalidate the macro correction thesis and rebuild bullish momentum.
Don't ignore logarithmic channel boundaries—macro Fibonacci levels guide deep market corrections.
#BTC #Bitcoin #CryptoAnalysis #TechnicalAnalysis
72
·
--
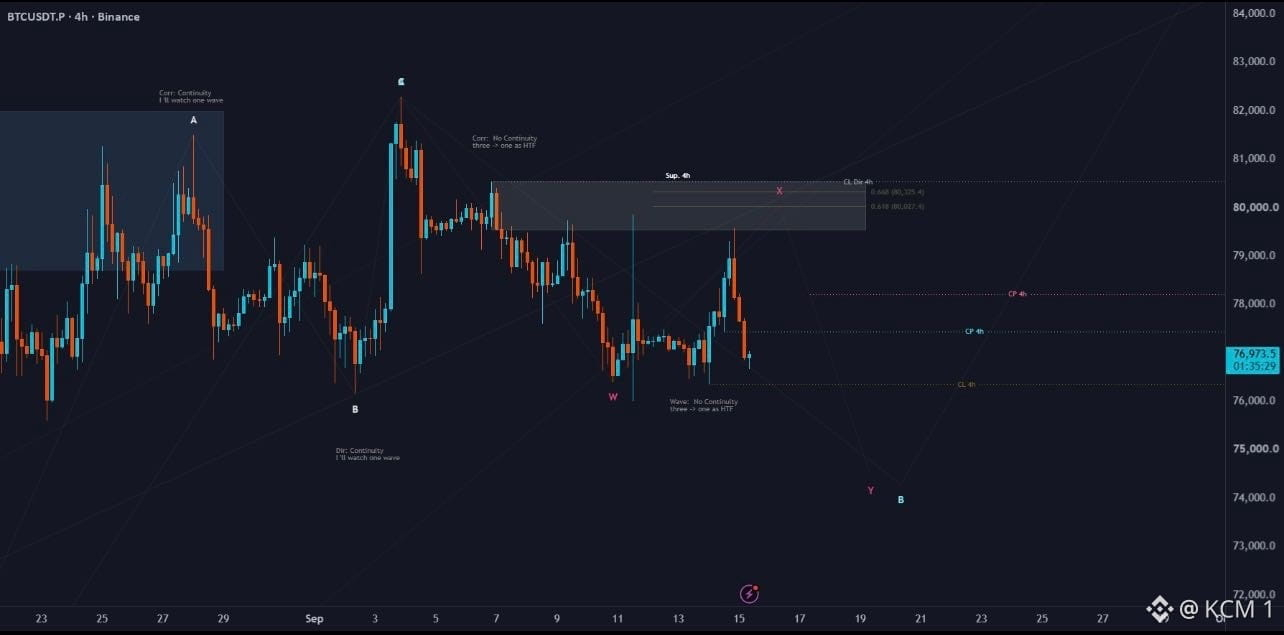
在大眾等待本地反彈之際,$BTC 上的這套波段修正結構顯示,後續可能還會有更深層的結構性下拉,以完成整個修正形態。
在 $80,000 附近的 4 小時供給區遭到拒絕後,價格跌破了較低時間框架的支撐,現正交易於約 $76,973。價格結構標誌出一段波段修正序列(W-X-Y);在上方供給區失敗的回測,證實空方在下一段下行中的主導地位。
若價格持續低於接近 $80,000 的 4 小時供給天花板,則修正論點仍維持有效,目標是在約 $74,000 附近完成下方波段。若出現堅實的反彈,並且日線收盤站上 $80,200,將使修正波形設定失效,並重新打開上行動能。
不要急著買入不完整的修正波——等候結構性需求確認最終的轉折點。
#BTC #Bitcoin #CryptoAnalysis #TechnicalAnalysis
在大眾等待本地反彈之際,$BTC 上的這套波段修正結構顯示,後續可能還會有更深層的結構性下拉,以完成整個修正形態。
在 $80,000 附近的 4 小時供給區遭到拒絕後,價格跌破了較低時間框架的支撐,現正交易於約 $76,973。價格結構標誌出一段波段修正序列(W-X-Y);在上方供給區失敗的回測,證實空方在下一段下行中的主導地位。
若價格持續低於接近 $80,000 的 4 小時供給天花板,則修正論點仍維持有效,目標是在約 $74,000 附近完成下方波段。若出現堅實的反彈,並且日線收盤站上 $80,200,將使修正波形設定失效,並重新打開上行動能。
不要急著買入不完整的修正波——等候結構性需求確認最終的轉折點。
#BTC #Bitcoin #CryptoAnalysis #TechnicalAnalysis
在 $80,000 附近的 4 小時供給區遭到拒絕後,價格跌破了較低時間框架的支撐,現正交易於約 $76,973。價格結構標誌出一段波段修正序列(W-X-Y);在上方供給區失敗的回測,證實空方在下一段下行中的主導地位。
若價格持續低於接近 $80,000 的 4 小時供給天花板,則修正論點仍維持有效,目標是在約 $74,000 附近完成下方波段。若出現堅實的反彈,並且日線收盤站上 $80,200,將使修正波形設定失效,並重新打開上行動能。
不要急著買入不完整的修正波——等候結構性需求確認最終的轉折點。
#BTC #Bitcoin #CryptoAnalysis #TechnicalAnalysis
69
·
--
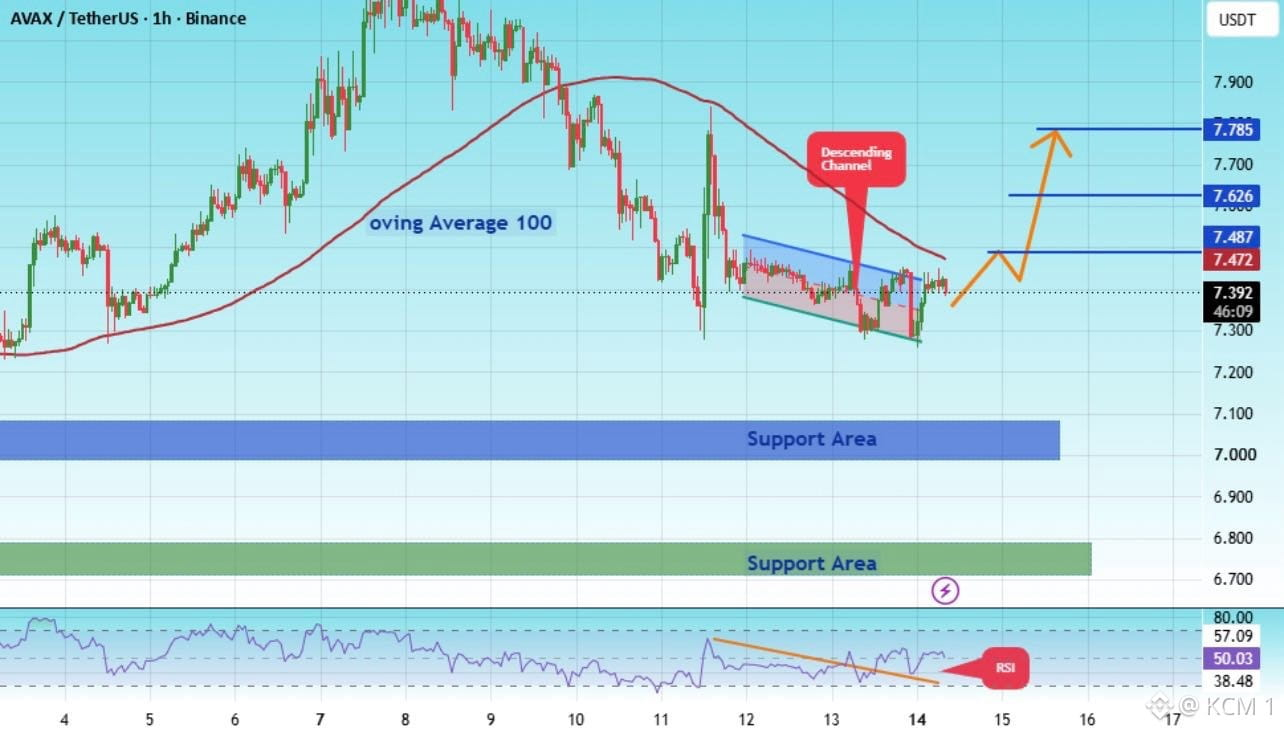
每個人都在盯著 $AVAX 這段緊密盤整,但卻忽略了 RSI 突破所暗示的重大通道反轉。
在 1 小時圖表中,價格先回落至 100 期移動平均線下方之後,便在 $7.300 上方於一段緊密的下行通道內盤整。同時,RSI 已突破其下跌趨勢線,顯示在價格展開走勢之前,已出現看漲動能的湧入。
只要有效突破 $7.472,即可確認該反轉型態,並清出通往後續上行目標 $7.626 與 $7.785 的路徑。只要能守住關鍵支撐區(約在 $7.050 與 $6.750)之上,這個看漲延續的機率就會保持完整。
不要等到價格擴張再行動——動能指標會先於價格確認突破。
#AVAX #Avalanche #CryptoAnalysis #TechnicalAnalysis
每個人都在盯著 $AVAX 這段緊密盤整,但卻忽略了 RSI 突破所暗示的重大通道反轉。
在 1 小時圖表中,價格先回落至 100 期移動平均線下方之後,便在 $7.300 上方於一段緊密的下行通道內盤整。同時,RSI 已突破其下跌趨勢線,顯示在價格展開走勢之前,已出現看漲動能的湧入。
只要有效突破 $7.472,即可確認該反轉型態,並清出通往後續上行目標 $7.626 與 $7.785 的路徑。只要能守住關鍵支撐區(約在 $7.050 與 $6.750)之上,這個看漲延續的機率就會保持完整。
不要等到價格擴張再行動——動能指標會先於價格確認突破。
#AVAX #Avalanche #CryptoAnalysis #TechnicalAnalysis
在 1 小時圖表中,價格先回落至 100 期移動平均線下方之後,便在 $7.300 上方於一段緊密的下行通道內盤整。同時,RSI 已突破其下跌趨勢線,顯示在價格展開走勢之前,已出現看漲動能的湧入。
只要有效突破 $7.472,即可確認該反轉型態,並清出通往後續上行目標 $7.626 與 $7.785 的路徑。只要能守住關鍵支撐區(約在 $7.050 與 $6.750)之上,這個看漲延續的機率就會保持完整。
不要等到價格擴張再行動——動能指標會先於價格確認突破。
#AVAX #Avalanche #CryptoAnalysis #TechnicalAnalysis
71
·
--
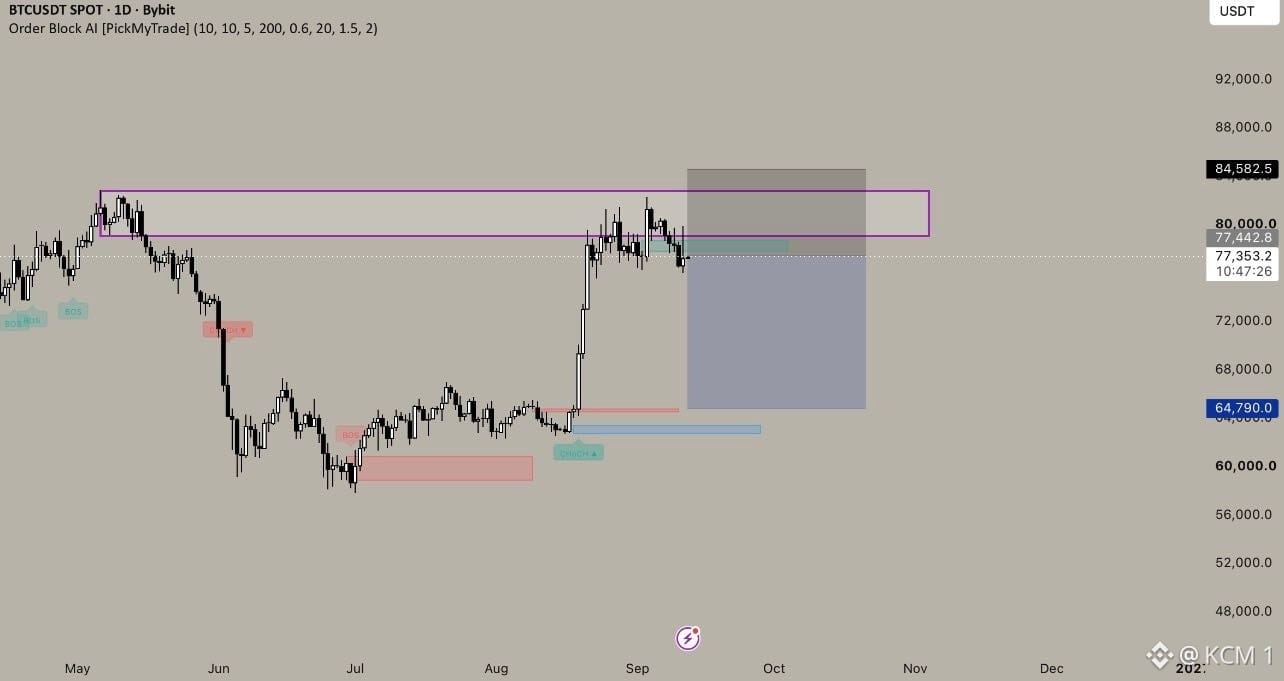
當突破買家追逐更高價位時,這個針對 $BTC 的短線交易設置正力圖實現對下方流動性的乾淨掃蕩。
在接近 $80,000 的主要日線訂單區進行回測之後,價格從約 $84,582 附近的供給區強勢反轉向下。當前的反應顯示在阻力位出現派發,使得看空思路依然有效,併爲回撤至主要需求區鋪路。
只要價格維持在 $84,582 的失效位之下,短線交易就依然有效,目標是將下方流動性全部掃到 $64,790。若出現突破並在 $84,582 上方完成日線收盤,則將使該設置失效,並重新打開宏觀看漲擴張。
不要在上方的訂單區追買;在交易回撤之前,讓阻力位確認拒絕。
#BTC #Bitcoin #CryptoAnalysis #TechnicalAnalysis
當突破買家追逐更高價位時,這個針對 $BTC 的短線交易設置正力圖實現對下方流動性的乾淨掃蕩。
在接近 $80,000 的主要日線訂單區進行回測之後,價格從約 $84,582 附近的供給區強勢反轉向下。當前的反應顯示在阻力位出現派發,使得看空思路依然有效,併爲回撤至主要需求區鋪路。
只要價格維持在 $84,582 的失效位之下,短線交易就依然有效,目標是將下方流動性全部掃到 $64,790。若出現突破並在 $84,582 上方完成日線收盤,則將使該設置失效,並重新打開宏觀看漲擴張。
不要在上方的訂單區追買;在交易回撤之前,讓阻力位確認拒絕。
#BTC #Bitcoin #CryptoAnalysis #TechnicalAnalysis
在接近 $80,000 的主要日線訂單區進行回測之後,價格從約 $84,582 附近的供給區強勢反轉向下。當前的反應顯示在阻力位出現派發,使得看空思路依然有效,併爲回撤至主要需求區鋪路。
只要價格維持在 $84,582 的失效位之下,短線交易就依然有效,目標是將下方流動性全部掃到 $64,790。若出現突破並在 $84,582 上方完成日線收盤,則將使該設置失效,並重新打開宏觀看漲擴張。
不要在上方的訂單區追買;在交易回撤之前,讓阻力位確認拒絕。
#BTC #Bitcoin #CryptoAnalysis #TechnicalAnalysis
51
·
--
每個人都在看這段銳利的形態彈跳,卻忽略了在 $79,800 附近的雙頂回絕測試所帶來的額外阻力成本。
在從上升楔形向下跌破後,並下探至 $77,800,價格隨即在關鍵阻力位置附近進行快速回抽。於虛線水平線處的回絕顯示賣方正在活躍,並使得潛在下行目標指向 $77,800 以及次一目標區約 $77,000 。
跌破 $78,828 之後,將確認看跌延續,朝向較低目標區域前進。不過,若強力推升站上 $79,800,將使空單論點失效,並重新打開上行動能,目標看向 $80,200 。
不要太早追買這波反彈;等待市場結構確認回絕之後,再去交易這個走勢。
#BTC #Bitcoin #CryptoAnalysis #TechnicalAnalysis
每個人都在看這段銳利的形態彈跳,卻忽略了在 $79,800 附近的雙頂回絕測試所帶來的額外阻力成本。
在從上升楔形向下跌破後,並下探至 $77,800,價格隨即在關鍵阻力位置附近進行快速回抽。於虛線水平線處的回絕顯示賣方正在活躍,並使得潛在下行目標指向 $77,800 以及次一目標區約 $77,000 。
跌破 $78,828 之後,將確認看跌延續,朝向較低目標區域前進。不過,若強力推升站上 $79,800,將使空單論點失效,並重新打開上行動能,目標看向 $80,200 。
不要太早追買這波反彈;等待市場結構確認回絕之後,再去交易這個走勢。
#BTC #Bitcoin #CryptoAnalysis #TechnicalAnalysis
在從上升楔形向下跌破後,並下探至 $77,800,價格隨即在關鍵阻力位置附近進行快速回抽。於虛線水平線處的回絕顯示賣方正在活躍,並使得潛在下行目標指向 $77,800 以及次一目標區約 $77,000 。
跌破 $78,828 之後,將確認看跌延續,朝向較低目標區域前進。不過,若強力推升站上 $79,800,將使空單論點失效,並重新打開上行動能,目標看向 $80,200 。
不要太早追買這波反彈;等待市場結構確認回絕之後,再去交易這個走勢。
#BTC #Bitcoin #CryptoAnalysis #TechnicalAnalysis

63
·
--
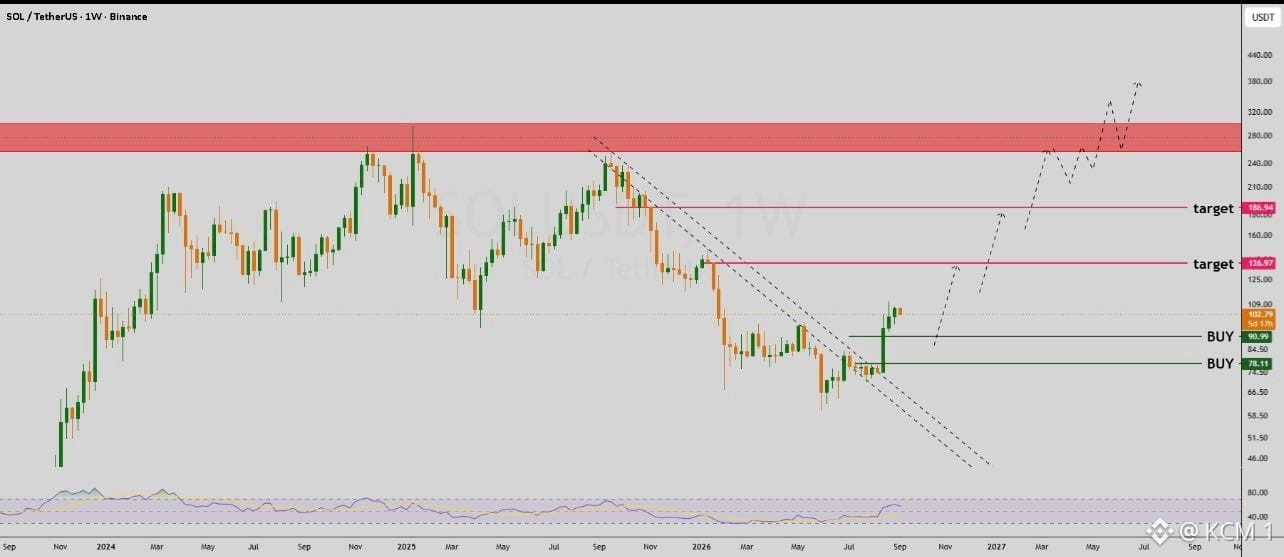
所有人都在盯着這次每週的反轉行情$SOL ,但卻錯過了用於確認重大全局(宏觀)拐點的多月期趨勢線突破。
在突破下降平行通道之後,價格已重新站回關鍵結構性支撐之上,即$90.99買入區。周線級別上的強勢看漲擴張表明長期格局的轉變,清除了數月的低高點(lower-high)盤整。
只要守在$90.99以及$78.11的累積區之上,就能驗證這套宏觀多頭佈局,並依次打開上行目標:$138.97和$186.94 。維持這種動能,將爲通往關鍵阻力上方$260.00的多階段衝擊鋪路。
別忽視周線趨勢線突破——宏觀結構的變化將帶來最大的宏觀行情。
#SOL #Solana #CryptoAnalysis #TechnicalAnalysis
所有人都在盯着這次每週的反轉行情$SOL ,但卻錯過了用於確認重大全局(宏觀)拐點的多月期趨勢線突破。
在突破下降平行通道之後,價格已重新站回關鍵結構性支撐之上,即$90.99買入區。周線級別上的強勢看漲擴張表明長期格局的轉變,清除了數月的低高點(lower-high)盤整。
只要守在$90.99以及$78.11的累積區之上,就能驗證這套宏觀多頭佈局,並依次打開上行目標:$138.97和$186.94 。維持這種動能,將爲通往關鍵阻力上方$260.00的多階段衝擊鋪路。
別忽視周線趨勢線突破——宏觀結構的變化將帶來最大的宏觀行情。
#SOL #Solana #CryptoAnalysis #TechnicalAnalysis
在突破下降平行通道之後,價格已重新站回關鍵結構性支撐之上,即$90.99買入區。周線級別上的強勢看漲擴張表明長期格局的轉變,清除了數月的低高點(lower-high)盤整。
只要守在$90.99以及$78.11的累積區之上,就能驗證這套宏觀多頭佈局,並依次打開上行目標:$138.97和$186.94 。維持這種動能,將爲通往關鍵阻力上方$260.00的多階段衝擊鋪路。
別忽視周線趨勢線突破——宏觀結構的變化將帶來最大的宏觀行情。
#SOL #Solana #CryptoAnalysis #TechnicalAnalysis
65
·
--
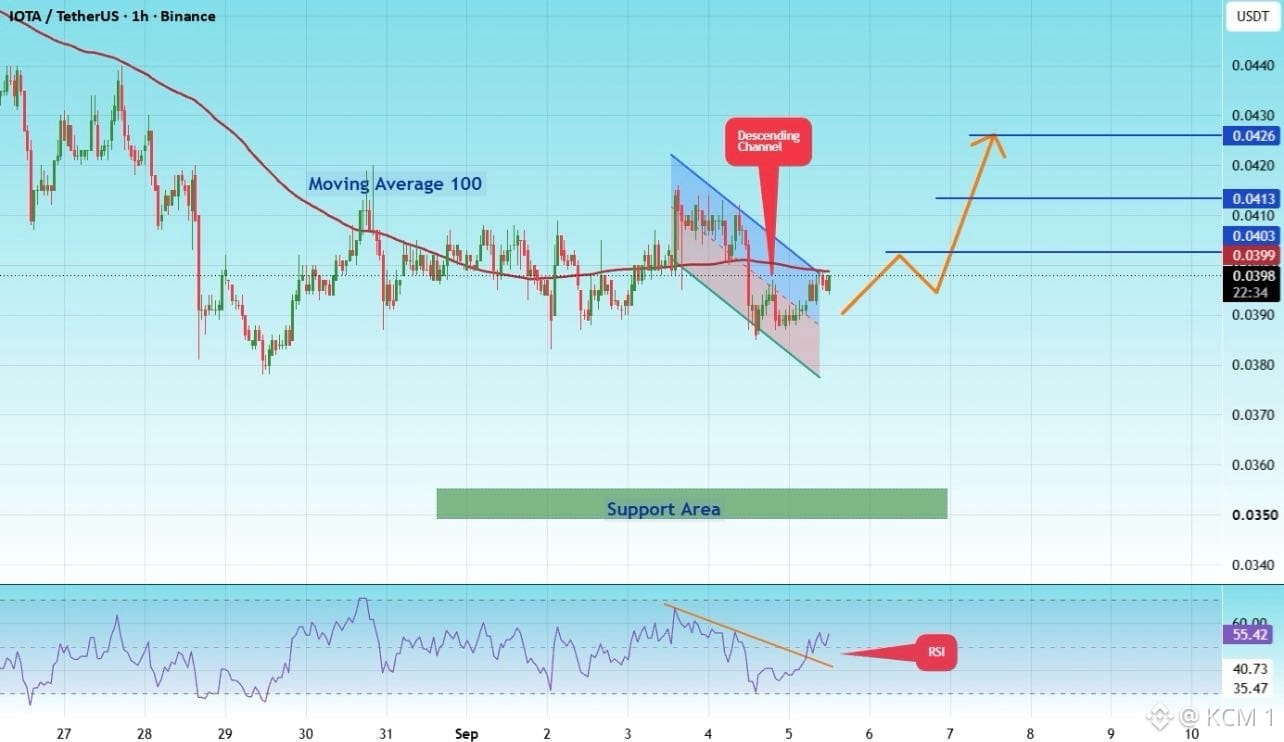
每個人都在關注 $IOTA 這個緊密的下行通道,但卻忽略了 RSI 上呈現的看漲背離。
在 1 小時圖表上,價格先在 100 期移動平均附近盤整後,正測試其局部下行斜率的上邊界。同時,RSI 已突破其下跌趨勢線,顯示在價格尚未反應之前,買盤動能正在表面下累積。
只要有效突破 $0.0399,即可確認這波反轉的設定,並打開通往中期阻力目標 $0.0403 、$0.0413 以及 $0.0426 的路徑。只要維持在接近 $0.0350 的局部支撐區之上,看漲論點就會完全保留。
不要等到整根K線充分展開——請觀察動能如何先於價格,走出局部盤整型態。
#IOTA #CryptoAnalysis #TechnicalAnalysis #Trading
每個人都在關注 $IOTA 這個緊密的下行通道,但卻忽略了 RSI 上呈現的看漲背離。
在 1 小時圖表上,價格先在 100 期移動平均附近盤整後,正測試其局部下行斜率的上邊界。同時,RSI 已突破其下跌趨勢線,顯示在價格尚未反應之前,買盤動能正在表面下累積。
只要有效突破 $0.0399,即可確認這波反轉的設定,並打開通往中期阻力目標 $0.0403 、$0.0413 以及 $0.0426 的路徑。只要維持在接近 $0.0350 的局部支撐區之上,看漲論點就會完全保留。
不要等到整根K線充分展開——請觀察動能如何先於價格,走出局部盤整型態。
#IOTA #CryptoAnalysis #TechnicalAnalysis #Trading
在 1 小時圖表上,價格先在 100 期移動平均附近盤整後,正測試其局部下行斜率的上邊界。同時,RSI 已突破其下跌趨勢線,顯示在價格尚未反應之前,買盤動能正在表面下累積。
只要有效突破 $0.0399,即可確認這波反轉的設定,並打開通往中期阻力目標 $0.0403 、$0.0413 以及 $0.0426 的路徑。只要維持在接近 $0.0350 的局部支撐區之上,看漲論點就會完全保留。
不要等到整根K線充分展開——請觀察動能如何先於價格,走出局部盤整型態。
#IOTA #CryptoAnalysis #TechnicalAnalysis #Trading
56
·
--
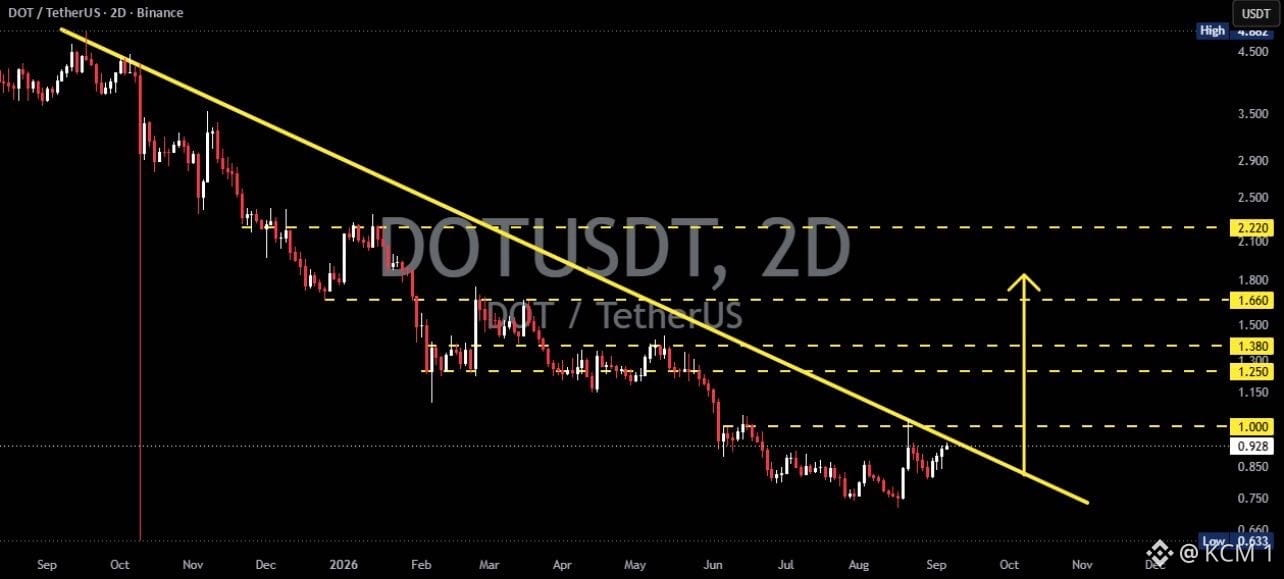
每個人都在關注這段持續多月的 $DOT 下跌趨勢,但卻忽略了在當地阻力附近、可能正在形成的趨勢線突破與盤整。
在數月的低點走低(更低的高點)被一條陡峭的黃色對角趨勢線所限制之後,價格正試圖挑戰位於 $0.928 附近的阻力,該位置接近宏觀的支撐基底。若能乾淨地突破這條對角線上方,就表示結構性特徵發生改變,將動能從長時間的分配(出貨)轉向早期的累積。
突破 $1.000 將確認趨勢線突破,並開啟依序向上的目標:$1.250 、$1.380 和 $1.660。然而,若未能突破對角線阻力,$DOT 仍可能面臨回到支撐附近(約 $0.750)的再測。
不要交易「線」本身——等待市場結構確認在主要阻力上方的突破。
#DOT #Polkadot #CryptoAnalysis #TechnicalAnalysis
每個人都在關注這段持續多月的 $DOT 下跌趨勢,但卻忽略了在當地阻力附近、可能正在形成的趨勢線突破與盤整。
在數月的低點走低(更低的高點)被一條陡峭的黃色對角趨勢線所限制之後,價格正試圖挑戰位於 $0.928 附近的阻力,該位置接近宏觀的支撐基底。若能乾淨地突破這條對角線上方,就表示結構性特徵發生改變,將動能從長時間的分配(出貨)轉向早期的累積。
突破 $1.000 將確認趨勢線突破,並開啟依序向上的目標:$1.250 、$1.380 和 $1.660。然而,若未能突破對角線阻力,$DOT 仍可能面臨回到支撐附近(約 $0.750)的再測。
不要交易「線」本身——等待市場結構確認在主要阻力上方的突破。
#DOT #Polkadot #CryptoAnalysis #TechnicalAnalysis
在數月的低點走低(更低的高點)被一條陡峭的黃色對角趨勢線所限制之後,價格正試圖挑戰位於 $0.928 附近的阻力,該位置接近宏觀的支撐基底。若能乾淨地突破這條對角線上方,就表示結構性特徵發生改變,將動能從長時間的分配(出貨)轉向早期的累積。
突破 $1.000 將確認趨勢線突破,並開啟依序向上的目標:$1.250 、$1.380 和 $1.660。然而,若未能突破對角線阻力,$DOT 仍可能面臨回到支撐附近(約 $0.750)的再測。
不要交易「線」本身——等待市場結構確認在主要阻力上方的突破。
#DOT #Polkadot #CryptoAnalysis #TechnicalAnalysis
75
·
--
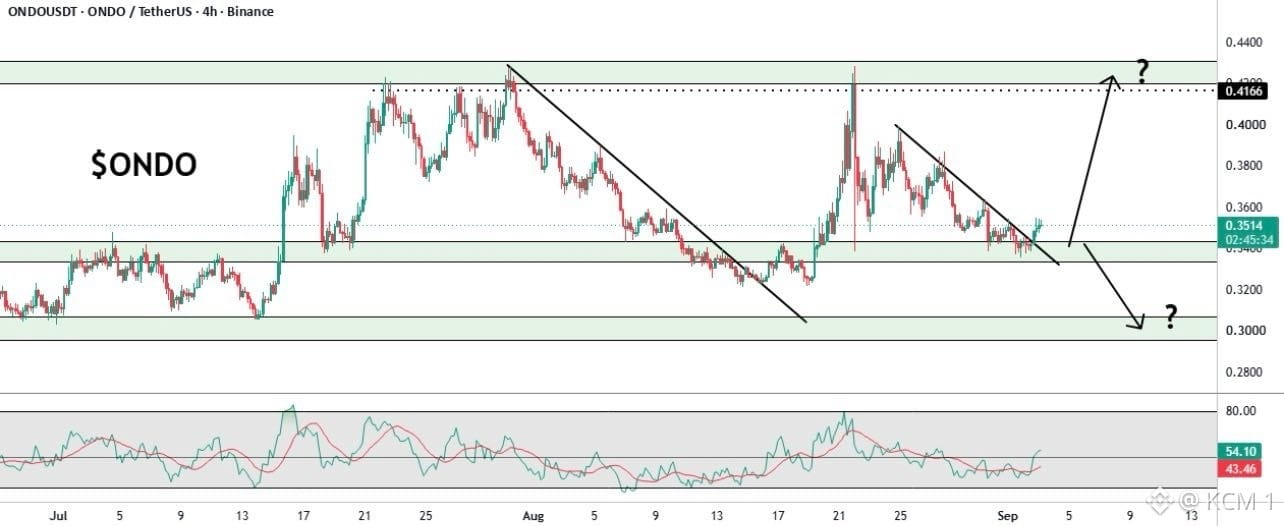
當市場在本地支撐位上爭論走勢方向時,$ONDO 的這個決策節點設置了一個明確的二元擴張觸發。
在突破本地下行趨勢線之後,價格正在於關鍵水平需求區內對接近 $0.3400 的動態支撐進行回測。RSI 重新回到 50 上方,表明基礎看漲動能正試圖奪回更低時間框架的結構控制權。
穩固站穩於 $0.3400 上方,將爲看漲上攻開闢一條直達路徑,目標指向上方阻力位 $0.4166 。然而,如果無法守住支撐,可能會面臨向下的跌破回測,進而回落至更低的宏觀需求區域約 $0.3000 。
不要過早預測結果——讓在支撐位的回測來確認擴張方向。
#ONDO #OndoFinance #CryptoAnalysis #TechnicalAnalysis
當市場在本地支撐位上爭論走勢方向時,$ONDO 的這個決策節點設置了一個明確的二元擴張觸發。
在突破本地下行趨勢線之後,價格正在於關鍵水平需求區內對接近 $0.3400 的動態支撐進行回測。RSI 重新回到 50 上方,表明基礎看漲動能正試圖奪回更低時間框架的結構控制權。
穩固站穩於 $0.3400 上方,將爲看漲上攻開闢一條直達路徑,目標指向上方阻力位 $0.4166 。然而,如果無法守住支撐,可能會面臨向下的跌破回測,進而回落至更低的宏觀需求區域約 $0.3000 。
不要過早預測結果——讓在支撐位的回測來確認擴張方向。
#ONDO #OndoFinance #CryptoAnalysis #TechnicalAnalysis
在突破本地下行趨勢線之後,價格正在於關鍵水平需求區內對接近 $0.3400 的動態支撐進行回測。RSI 重新回到 50 上方,表明基礎看漲動能正試圖奪回更低時間框架的結構控制權。
穩固站穩於 $0.3400 上方,將爲看漲上攻開闢一條直達路徑,目標指向上方阻力位 $0.4166 。然而,如果無法守住支撐,可能會面臨向下的跌破回測,進而回落至更低的宏觀需求區域約 $0.3000 。
不要過早預測結果——讓在支撐位的回測來確認擴張方向。
#ONDO #OndoFinance #CryptoAnalysis #TechnicalAnalysis
76
·
--
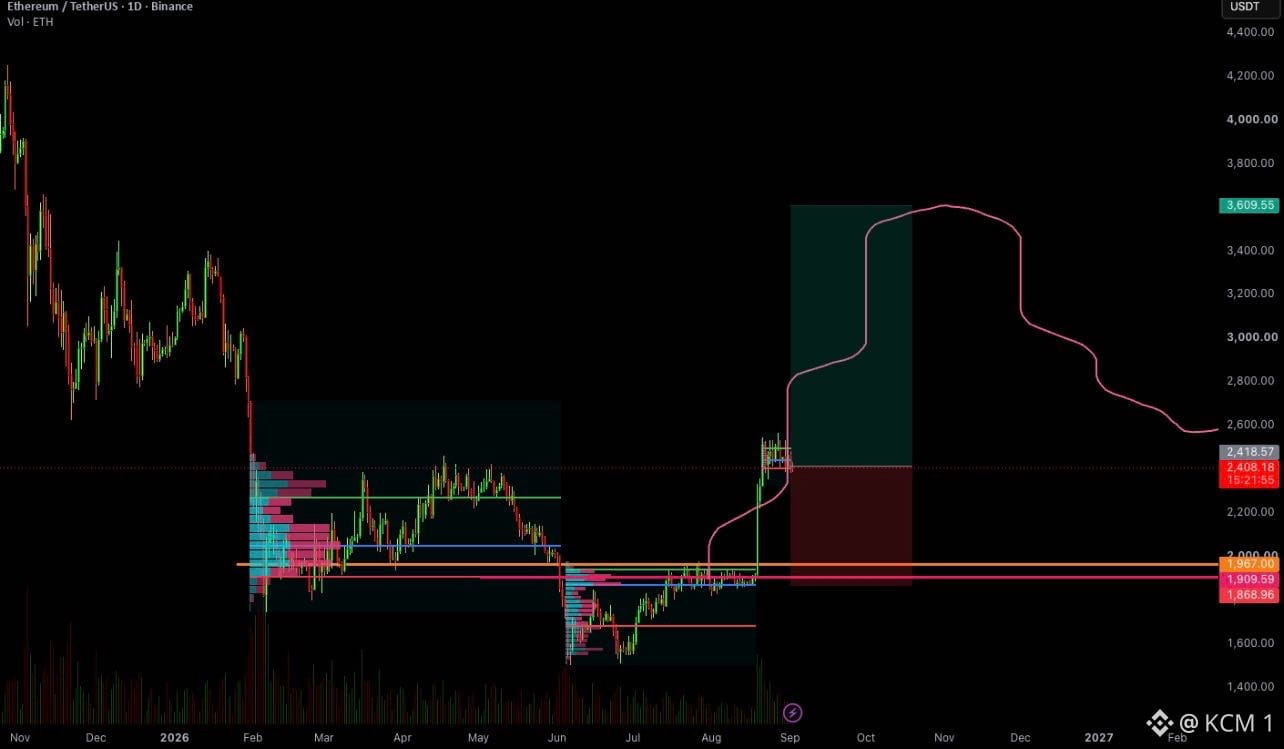
儘管市場一致預期走勢將直線上行,但這一基於 $ETH 的預測在下一輪週期的階段中,描繪了一條高信心的宏觀路線圖。
在重新奪回關鍵的 $2,400 橫盤整理節點之後,價格走勢正在主要成交量輪廓支撐之上形成更高的低點。所預測的曲線模型顯示,價格將先進行一波激進的擴張衝刺,目標指向 $3,600 ,隨後進入一段延續至 2027 年初的宏觀調整階段。
站穩接近 $1,900 的主要失效(無效)水平,可確保長期看漲的擴張路徑完全保持。重新奪回上方的供給壓力,將在市場觸及本輪週期峯值之前,爲大幅上行打開空間。
關注宏觀結構而非日常噪音——更大的趨勢框架纔會引導真正的走勢。
#ETH #Ethereum #CryptoAnalysis #TechnicalAnalysis
儘管市場一致預期走勢將直線上行,但這一基於 $ETH 的預測在下一輪週期的階段中,描繪了一條高信心的宏觀路線圖。
在重新奪回關鍵的 $2,400 橫盤整理節點之後,價格走勢正在主要成交量輪廓支撐之上形成更高的低點。所預測的曲線模型顯示,價格將先進行一波激進的擴張衝刺,目標指向 $3,600 ,隨後進入一段延續至 2027 年初的宏觀調整階段。
站穩接近 $1,900 的主要失效(無效)水平,可確保長期看漲的擴張路徑完全保持。重新奪回上方的供給壓力,將在市場觸及本輪週期峯值之前,爲大幅上行打開空間。
關注宏觀結構而非日常噪音——更大的趨勢框架纔會引導真正的走勢。
#ETH #Ethereum #CryptoAnalysis #TechnicalAnalysis
在重新奪回關鍵的 $2,400 橫盤整理節點之後,價格走勢正在主要成交量輪廓支撐之上形成更高的低點。所預測的曲線模型顯示,價格將先進行一波激進的擴張衝刺,目標指向 $3,600 ,隨後進入一段延續至 2027 年初的宏觀調整階段。
站穩接近 $1,900 的主要失效(無效)水平,可確保長期看漲的擴張路徑完全保持。重新奪回上方的供給壓力,將在市場觸及本輪週期峯值之前,爲大幅上行打開空間。
關注宏觀結構而非日常噪音——更大的趨勢框架纔會引導真正的走勢。
#ETH #Ethereum #CryptoAnalysis #TechnicalAnalysis
70
·
--
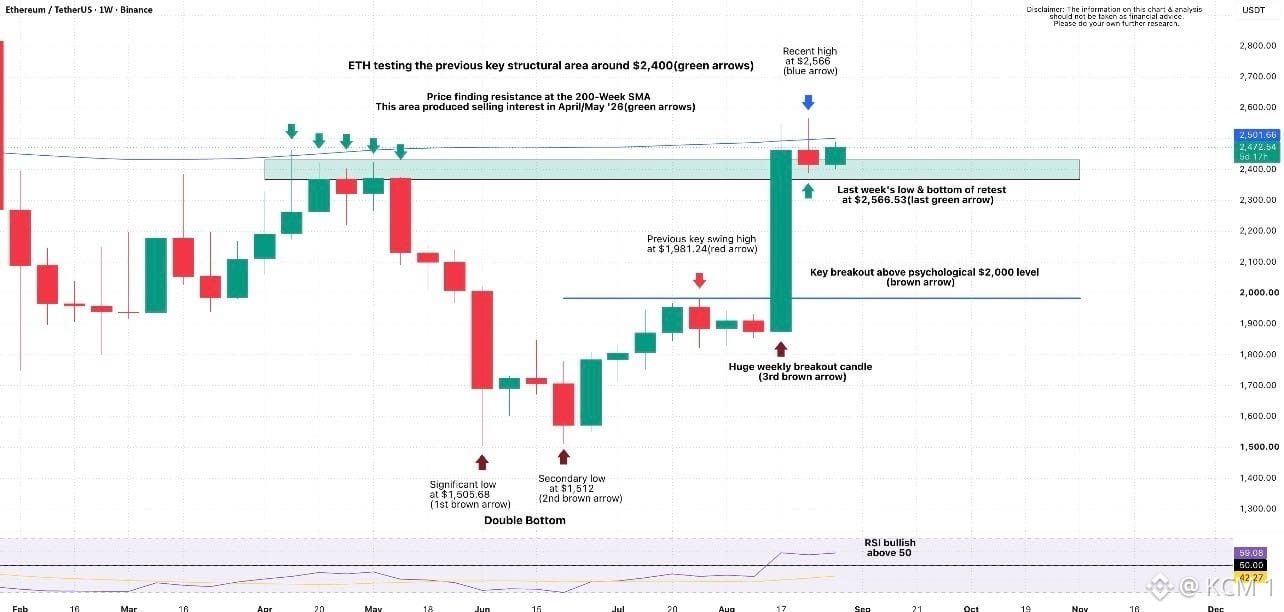
每個人都在關注這周的 $ETH 回測(retest),但卻錯過了推動突破的宏觀“雙底”基礎。
在 $1,505 附近構建了堅實的雙底基礎並突破心理關口 $2,000 之後,價格已直接擴展到關鍵的結構性阻力區域——約 $2,400 。巨大的綠色周線突破K線表明強勁的機構需求正在重新進入市場。
只要守住先前接近 $2,400 的水平天花板,歷史性的供給就會轉化爲新的結構性支撐。隨着周線 RSI 維持在 50 上方並呈看漲態勢,這一區域一旦回測成功,就將爲價格進一步突破近期高點 $2,566 打開道路。
別讓小幅回測動搖你——看看先前的阻力區域如何轉變爲穩固的多頭支撐。
#ETH #Ethereum #CryptoAnalysis #TechnicalAnalysis
每個人都在關注這周的 $ETH 回測(retest),但卻錯過了推動突破的宏觀“雙底”基礎。
在 $1,505 附近構建了堅實的雙底基礎並突破心理關口 $2,000 之後,價格已直接擴展到關鍵的結構性阻力區域——約 $2,400 。巨大的綠色周線突破K線表明強勁的機構需求正在重新進入市場。
只要守住先前接近 $2,400 的水平天花板,歷史性的供給就會轉化爲新的結構性支撐。隨着周線 RSI 維持在 50 上方並呈看漲態勢,這一區域一旦回測成功,就將爲價格進一步突破近期高點 $2,566 打開道路。
別讓小幅回測動搖你——看看先前的阻力區域如何轉變爲穩固的多頭支撐。
#ETH #Ethereum #CryptoAnalysis #TechnicalAnalysis
在 $1,505 附近構建了堅實的雙底基礎並突破心理關口 $2,000 之後,價格已直接擴展到關鍵的結構性阻力區域——約 $2,400 。巨大的綠色周線突破K線表明強勁的機構需求正在重新進入市場。
只要守住先前接近 $2,400 的水平天花板,歷史性的供給就會轉化爲新的結構性支撐。隨着周線 RSI 維持在 50 上方並呈看漲態勢,這一區域一旦回測成功,就將爲價格進一步突破近期高點 $2,566 打開道路。
別讓小幅回測動搖你——看看先前的阻力區域如何轉變爲穩固的多頭支撐。
#ETH #Ethereum #CryptoAnalysis #TechnicalAnalysis
97
登入以探索更多內容
加入幣安廣場中的全球加密貨幣用戶
⚡️ 獲取加密貨幣的最新和實用資訊。
💬 受到全球最大加密貨幣交易所的信任。
👍 發掘來自經過驗證創作者的真實見解。
電子郵件 / 電話號碼