
ajuxarjun
16 貼文

ajuxarjun
舉報
封鎖用戶
Visualisation is the key 💸
0 關注
0 粉絲
5 點讚數
貼文
·
--
🚨 $SOL 正在逼近一個可能會變得非常有趣的關鍵水平。
目前 SOL 交易在約 $118.79 附近,過去 24 小時上漲約 2%,24H 交易量約爲 $4.2B。(Binance)
但更重要的故事不只是圖表。
Solana 的 Alpenglow 升級目標是實現大約 150ms 的交易最終確認時間,而當前共識系統下約爲 12.8 秒。Solana 表示,該升級計劃在今年晚些時候上線主網。(Solana)
現在看圖表:
📍 $120 = 直接的心理關口阻力
📍 $115.95 = 近期 24H 低點/附近支撐
📍 $118.79 = 當前價格
如果 SOL 能夠突破並站穩 $120,同時成交量放大,那麼這次突破就會變得更有看點。
如果 $120 被回絕、價格跌破 $115.95,那麼動能形態就會走弱。
這次升級就是催化劑。
$120 是戰場。
[INSERT LIVE $SOL CANDLE CHART WIDGET HERE]
你會等 SOL 重新奪回 $120 — 還是先等回調?👇
#SOL #Solana #CryptoTrading #BinanceSquare #Altcoins #Crypto
🚨 $SOL 正在逼近一個可能會變得非常有趣的關鍵水平。
目前 SOL 交易在約 $118.79 附近,過去 24 小時上漲約 2%,24H 交易量約爲 $4.2B。(Binance)
但更重要的故事不只是圖表。
Solana 的 Alpenglow 升級目標是實現大約 150ms 的交易最終確認時間,而當前共識系統下約爲 12.8 秒。Solana 表示,該升級計劃在今年晚些時候上線主網。(Solana)
現在看圖表:
📍 $120 = 直接的心理關口阻力
📍 $115.95 = 近期 24H 低點/附近支撐
📍 $118.79 = 當前價格
如果 SOL 能夠突破並站穩 $120,同時成交量放大,那麼這次突破就會變得更有看點。
如果 $120 被回絕、價格跌破 $115.95,那麼動能形態就會走弱。
這次升級就是催化劑。
$120 是戰場。
[INSERT LIVE $SOL CANDLE CHART WIDGET HERE]
你會等 SOL 重新奪回 $120 — 還是先等回調?👇
#SOL #Solana #CryptoTrading #BinanceSquare #Altcoins #Crypto
目前 SOL 交易在約 $118.79 附近,過去 24 小時上漲約 2%,24H 交易量約爲 $4.2B。(Binance)
但更重要的故事不只是圖表。
Solana 的 Alpenglow 升級目標是實現大約 150ms 的交易最終確認時間,而當前共識系統下約爲 12.8 秒。Solana 表示,該升級計劃在今年晚些時候上線主網。(Solana)
現在看圖表:
📍 $120 = 直接的心理關口阻力
📍 $115.95 = 近期 24H 低點/附近支撐
📍 $118.79 = 當前價格
如果 SOL 能夠突破並站穩 $120,同時成交量放大,那麼這次突破就會變得更有看點。
如果 $120 被回絕、價格跌破 $115.95,那麼動能形態就會走弱。
這次升級就是催化劑。
$120 是戰場。
[INSERT LIVE $SOL CANDLE CHART WIDGET HERE]
你會等 SOL 重新奪回 $120 — 還是先等回調?👇
#SOL #Solana #CryptoTrading #BinanceSquare #Altcoins #Crypto

43
·
--
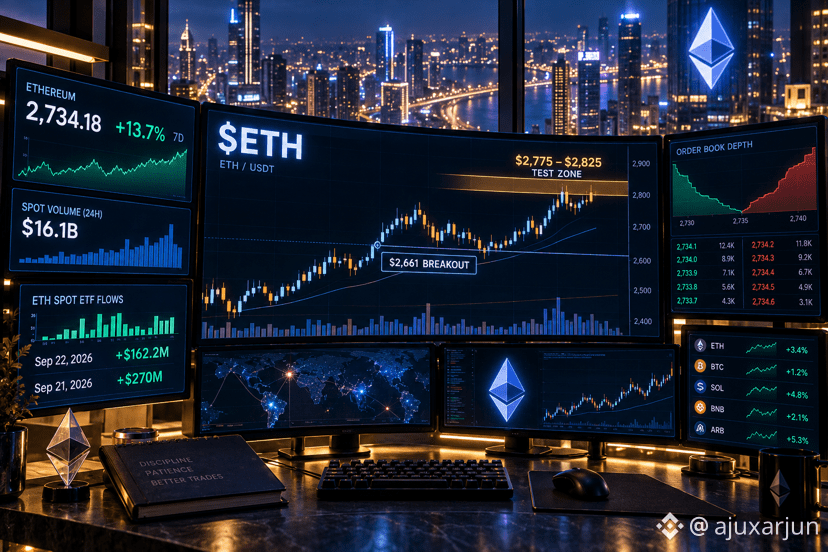
🚨 $ETH 已經處在關鍵的層級。
以太坊強勢反彈,但真正的戰場現在在 $2,775–$2,825。若出現乾淨的突破並站穩,可能會確認延續;若遭遇回落拒絕,ETH 可能會再次回到突破區域附近 $2,661。ETF 資金流入讓這一步變得更有意思——但價格仍需要用表現來證明自己。👀
你會等待突破,還是等待回踩測試?
#ETH #Ethereum #CryptoTrading #BinanceSquare #Crypto #Altcoins
🚨 $ETH 已經處在關鍵的層級。
以太坊強勢反彈,但真正的戰場現在在 $2,775–$2,825。若出現乾淨的突破並站穩,可能會確認延續;若遭遇回落拒絕,ETH 可能會再次回到突破區域附近 $2,661。ETF 資金流入讓這一步變得更有意思——但價格仍需要用表現來證明自己。👀
你會等待突破,還是等待回踩測試?
#ETH #Ethereum #CryptoTrading #BinanceSquare #Crypto #Altcoins
以太坊強勢反彈,但真正的戰場現在在 $2,775–$2,825。若出現乾淨的突破並站穩,可能會確認延續;若遭遇回落拒絕,ETH 可能會再次回到突破區域附近 $2,661。ETF 資金流入讓這一步變得更有意思——但價格仍需要用表現來證明自己。👀
你會等待突破,還是等待回踩測試?
#ETH #Ethereum #CryptoTrading #BinanceSquare #Crypto #Altcoins
82
·
--
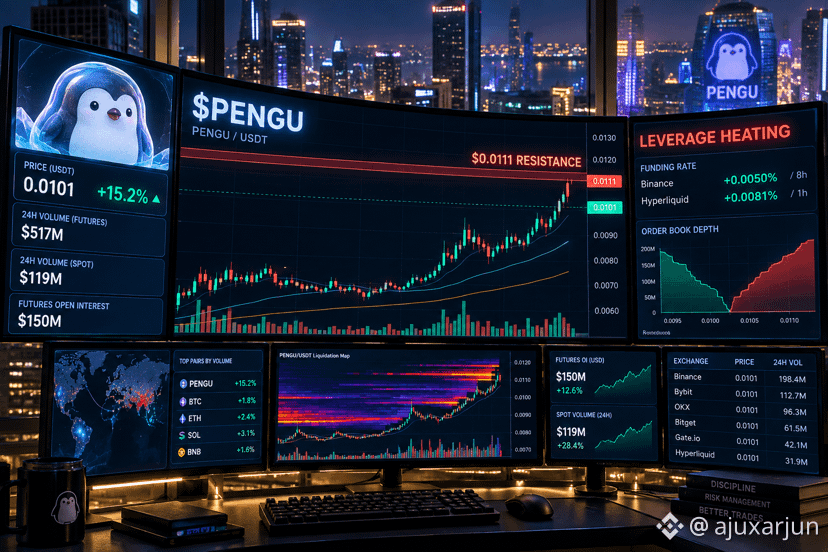
🚨 $PENGU 剛好撞上了真正重要的關鍵區域。
PENGU 正在一路上衝 — 但有趣的不是那個拉升。
而是接下來在這裡會發生什麼。
價格在經歷急速走勢後,正壓向 0.0111 美元的阻力區;同時,期貨持倉活動與未平倉量(open interest)也擴大了。
這就形成了一場簡單的對決:
🐂 多方情境:
乾淨的突破 + 強勁的成交量 + 在阻力之上站穩(被市場接受),可能為再走一段上漲打開空間。
🐻 空方情境:
如果 0.0111 美元遭到拒絕、而槓桿多單開始解倉(unwinding),這一波可能會很快回撤。
錯誤在於追逐那根K線。
關鍵在於這個水位。
📍 關鍵位:0.0111 美元阻力
📍 觀察:突破期間的成交量 + 未平倉量(OI)
⚠️ 無效判定:失敗回到突破結構之下
我在看反應,而不是在預測結果。
你會交易突破 — 還是等回測?👇
#PENGU #Crypto #BinanceSquare #Altcoins #Trading #CryptoTrading
🚨 $PENGU 剛好撞上了真正重要的關鍵區域。
PENGU 正在一路上衝 — 但有趣的不是那個拉升。
而是接下來在這裡會發生什麼。
價格在經歷急速走勢後,正壓向 0.0111 美元的阻力區;同時,期貨持倉活動與未平倉量(open interest)也擴大了。
這就形成了一場簡單的對決:
🐂 多方情境:
乾淨的突破 + 強勁的成交量 + 在阻力之上站穩(被市場接受),可能為再走一段上漲打開空間。
🐻 空方情境:
如果 0.0111 美元遭到拒絕、而槓桿多單開始解倉(unwinding),這一波可能會很快回撤。
錯誤在於追逐那根K線。
關鍵在於這個水位。
📍 關鍵位:0.0111 美元阻力
📍 觀察:突破期間的成交量 + 未平倉量(OI)
⚠️ 無效判定:失敗回到突破結構之下
我在看反應,而不是在預測結果。
你會交易突破 — 還是等回測?👇
#PENGU #Crypto #BinanceSquare #Altcoins #Trading #CryptoTrading
PENGU 正在一路上衝 — 但有趣的不是那個拉升。
而是接下來在這裡會發生什麼。
價格在經歷急速走勢後,正壓向 0.0111 美元的阻力區;同時,期貨持倉活動與未平倉量(open interest)也擴大了。
這就形成了一場簡單的對決:
🐂 多方情境:
乾淨的突破 + 強勁的成交量 + 在阻力之上站穩(被市場接受),可能為再走一段上漲打開空間。
🐻 空方情境:
如果 0.0111 美元遭到拒絕、而槓桿多單開始解倉(unwinding),這一波可能會很快回撤。
錯誤在於追逐那根K線。
關鍵在於這個水位。
📍 關鍵位:0.0111 美元阻力
📍 觀察:突破期間的成交量 + 未平倉量(OI)
⚠️ 無效判定:失敗回到突破結構之下
我在看反應,而不是在預測結果。
你會交易突破 — 還是等回測?👇
#PENGU #Crypto #BinanceSquare #Altcoins #Trading #CryptoTrading
174
·
--
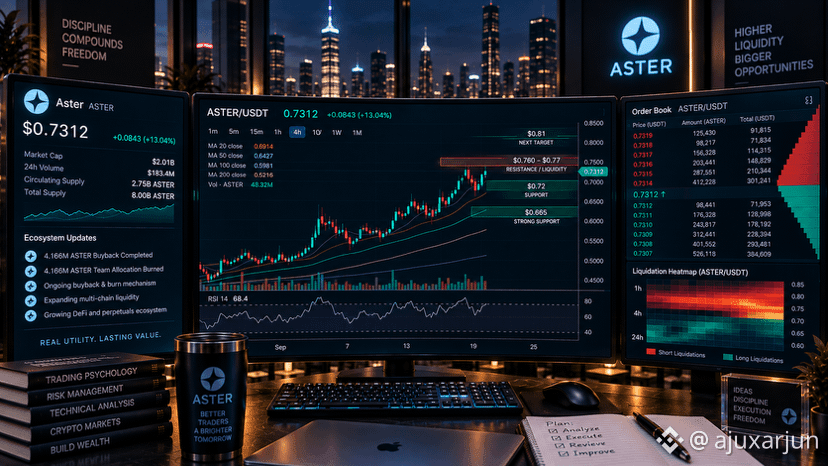
⚡ $ASTER 正坐在一面重大的流動性牆下方
$ASTER 目前約爲 $0.73,較前一日下跌約 1%,此前在未能守住近期的 $0.76–$0.77 區域後走弱。關鍵技術位在於 $0.7606 的阻力位與 $0.6655 的支撐位;若買盤在阻力位上方建立有效承接,$0.81 將成爲下一個看漲參考。(Binance)
更大的故事在代幣經濟模型:Aster 最新一輪週期中,從 9 月 7 日至 21 日動用了 99% 的平臺費用用於回購 416.6 萬枚 $ASTER;同時,另有 416.6 萬枚 $ASTER 來自團隊分配被銷燬。更廣泛的機制旨在將總供應量從 80 億降低至 30 億左右,不過實際速度取決於平臺費用的真實水平。(Bitrue)
衍生品纔是有趣之處:追蹤的 ASTER 永續合約未平倉持倉約爲 1.48 億美元,其中 Binance 約佔 60%,而資金費率仍保持爲正。當前清算數據顯示,約有 680 萬美元的做空清算敞口,這意味着若發生突破,可能引發波動事件——但槓桿同樣也會讓反轉來得更快。(Squeeze Insights Lab)
🎯 $ASTER 關鍵位
* 🔴 $0.760–$0.77 — 突破 / 流動性區域
* 🚀 $0.81 — 下一處上行參考
* 🟢 $0.72 — 直接支撐
* 🟢 $0.665 — 主要支撐
* 🔻 $0.573 — 更深層的結構性支撐
圖表被壓縮了。槓桿是真實存在的。讓價格來選擇方向。⚡📊
#ASTER #Aster #Crypto #Altcoins #BinanceSquare
⚡ $ASTER 正坐在一面重大的流動性牆下方
$ASTER 目前約爲 $0.73,較前一日下跌約 1%,此前在未能守住近期的 $0.76–$0.77 區域後走弱。關鍵技術位在於 $0.7606 的阻力位與 $0.6655 的支撐位;若買盤在阻力位上方建立有效承接,$0.81 將成爲下一個看漲參考。(Binance)
更大的故事在代幣經濟模型:Aster 最新一輪週期中,從 9 月 7 日至 21 日動用了 99% 的平臺費用用於回購 416.6 萬枚 $ASTER;同時,另有 416.6 萬枚 $ASTER 來自團隊分配被銷燬。更廣泛的機制旨在將總供應量從 80 億降低至 30 億左右,不過實際速度取決於平臺費用的真實水平。(Bitrue)
衍生品纔是有趣之處:追蹤的 ASTER 永續合約未平倉持倉約爲 1.48 億美元,其中 Binance 約佔 60%,而資金費率仍保持爲正。當前清算數據顯示,約有 680 萬美元的做空清算敞口,這意味着若發生突破,可能引發波動事件——但槓桿同樣也會讓反轉來得更快。(Squeeze Insights Lab)
🎯 $ASTER 關鍵位
* 🔴 $0.760–$0.77 — 突破 / 流動性區域
* 🚀 $0.81 — 下一處上行參考
* 🟢 $0.72 — 直接支撐
* 🟢 $0.665 — 主要支撐
* 🔻 $0.573 — 更深層的結構性支撐
圖表被壓縮了。槓桿是真實存在的。讓價格來選擇方向。⚡📊
#ASTER #Aster #Crypto #Altcoins #BinanceSquare
$ASTER 目前約爲 $0.73,較前一日下跌約 1%,此前在未能守住近期的 $0.76–$0.77 區域後走弱。關鍵技術位在於 $0.7606 的阻力位與 $0.6655 的支撐位;若買盤在阻力位上方建立有效承接,$0.81 將成爲下一個看漲參考。(Binance)
更大的故事在代幣經濟模型:Aster 最新一輪週期中,從 9 月 7 日至 21 日動用了 99% 的平臺費用用於回購 416.6 萬枚 $ASTER;同時,另有 416.6 萬枚 $ASTER 來自團隊分配被銷燬。更廣泛的機制旨在將總供應量從 80 億降低至 30 億左右,不過實際速度取決於平臺費用的真實水平。(Bitrue)
衍生品纔是有趣之處:追蹤的 ASTER 永續合約未平倉持倉約爲 1.48 億美元,其中 Binance 約佔 60%,而資金費率仍保持爲正。當前清算數據顯示,約有 680 萬美元的做空清算敞口,這意味着若發生突破,可能引發波動事件——但槓桿同樣也會讓反轉來得更快。(Squeeze Insights Lab)
🎯 $ASTER 關鍵位
* 🔴 $0.760–$0.77 — 突破 / 流動性區域
* 🚀 $0.81 — 下一處上行參考
* 🟢 $0.72 — 直接支撐
* 🟢 $0.665 — 主要支撐
* 🔻 $0.573 — 更深層的結構性支撐
圖表被壓縮了。槓桿是真實存在的。讓價格來選擇方向。⚡📊
#ASTER #Aster #Crypto #Altcoins #BinanceSquare
624
·
--
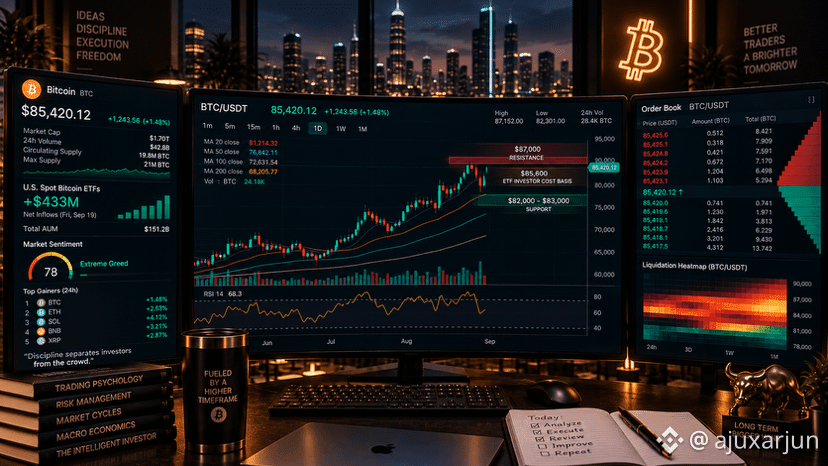
🚨 $BTC 只剩最後一面“牆”要突破——$87K
$BTC 首次在 1 月以來衝破 $86K,並短暫交易於 $87K 之上;同時,更廣泛的加密市場也推動回到約 $3T 的總市值附近。本輪上漲的一部分動力來自機構需求:美國現貨比特幣 ETF 在週五錄得約 4.33 億美元的淨流入,而 Strategy 買入了約 7,570 萬美元的 BTC。(華爾街日報)
接下來纔是關鍵:擠壓(squeeze)已經發生。過去一天內,已有超過 10 億美元的加密倉位被清算,據稱其中約 82% 是做空倉位;這意味着下一段行情需要真正的現貨買盤,而不是再來一波被動清算的浪潮。(CoinDesk)
從技術面看,$87K 是直接的上方天花板。若能持續向上突破,將使市場進入相對近期區間的“價格發現”(price discovery)區域;但若出現回落拒絕,則 $85.6K 仍將成爲重要參考位,而 $82K–$83K 則是主要支撐區。這是確認型設置——不是追逐一根直線上漲 K 線的理由。
🎯 最終 $BTC 關鍵價位
* 🔴 $87,000 — 突破 / 流動性牆
* 🟡 $85,600 — 關鍵短線參考
* 🟢 $82,000–$83,000 — 主要支撐
* 🔻 $78,500 — 更深層的結構性支撐
$87K 決定下一章。盯的是反應,而不是標題。👀📊⚡
#BTC #Bitcoin #Crypto #BinanceSquare #Trading
🚨 $BTC 只剩最後一面“牆”要突破——$87K
$BTC 首次在 1 月以來衝破 $86K,並短暫交易於 $87K 之上;同時,更廣泛的加密市場也推動回到約 $3T 的總市值附近。本輪上漲的一部分動力來自機構需求:美國現貨比特幣 ETF 在週五錄得約 4.33 億美元的淨流入,而 Strategy 買入了約 7,570 萬美元的 BTC。(華爾街日報)
接下來纔是關鍵:擠壓(squeeze)已經發生。過去一天內,已有超過 10 億美元的加密倉位被清算,據稱其中約 82% 是做空倉位;這意味着下一段行情需要真正的現貨買盤,而不是再來一波被動清算的浪潮。(CoinDesk)
從技術面看,$87K 是直接的上方天花板。若能持續向上突破,將使市場進入相對近期區間的“價格發現”(price discovery)區域;但若出現回落拒絕,則 $85.6K 仍將成爲重要參考位,而 $82K–$83K 則是主要支撐區。這是確認型設置——不是追逐一根直線上漲 K 線的理由。
🎯 最終 $BTC 關鍵價位
* 🔴 $87,000 — 突破 / 流動性牆
* 🟡 $85,600 — 關鍵短線參考
* 🟢 $82,000–$83,000 — 主要支撐
* 🔻 $78,500 — 更深層的結構性支撐
$87K 決定下一章。盯的是反應,而不是標題。👀📊⚡
#BTC #Bitcoin #Crypto #BinanceSquare #Trading
$BTC 首次在 1 月以來衝破 $86K,並短暫交易於 $87K 之上;同時,更廣泛的加密市場也推動回到約 $3T 的總市值附近。本輪上漲的一部分動力來自機構需求:美國現貨比特幣 ETF 在週五錄得約 4.33 億美元的淨流入,而 Strategy 買入了約 7,570 萬美元的 BTC。(華爾街日報)
接下來纔是關鍵:擠壓(squeeze)已經發生。過去一天內,已有超過 10 億美元的加密倉位被清算,據稱其中約 82% 是做空倉位;這意味着下一段行情需要真正的現貨買盤,而不是再來一波被動清算的浪潮。(CoinDesk)
從技術面看,$87K 是直接的上方天花板。若能持續向上突破,將使市場進入相對近期區間的“價格發現”(price discovery)區域;但若出現回落拒絕,則 $85.6K 仍將成爲重要參考位,而 $82K–$83K 則是主要支撐區。這是確認型設置——不是追逐一根直線上漲 K 線的理由。
🎯 最終 $BTC 關鍵價位
* 🔴 $87,000 — 突破 / 流動性牆
* 🟡 $85,600 — 關鍵短線參考
* 🟢 $82,000–$83,000 — 主要支撐
* 🔻 $78,500 — 更深層的結構性支撐
$87K 決定下一章。盯的是反應,而不是標題。👀📊⚡
#BTC #Bitcoin #Crypto #BinanceSquare #Trading
8
·
--
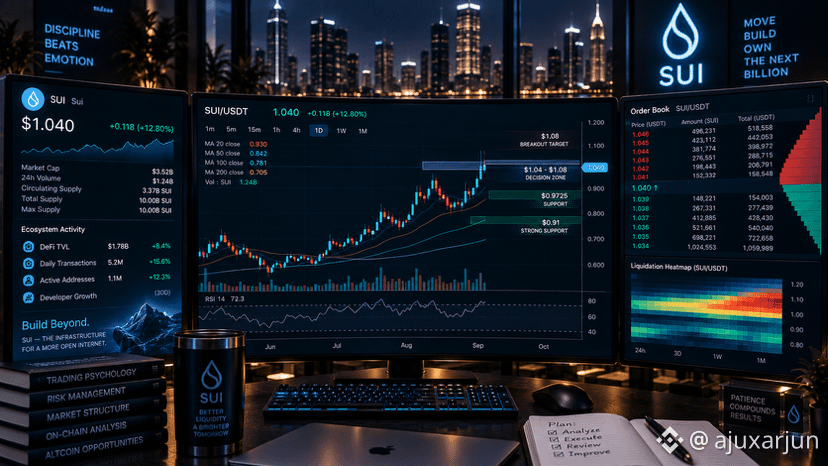
🚨 $SUI 剛剛收復 $1 — 現在真正的考驗開始 ⚡
$SUI 已重新站上關鍵心理價位 $1.00,憑藉一輪強勁的動能爆發,目前交易在約 $1.04 附近。24 小時成交量約爲 $1.7B,而過去七天 SUI 累計上漲約 44%——這已經不是“安靜的修復”了。(CoinStats)
目前圖表正處於 $1.04–$1.08 的關鍵決策區。若能在 $1.08 上方獲得明確的站穩接受,$1.16–$1.28 便將進入視野;但一旦失守 $0.9725 這一突破水平,局勢將轉弱,並可能暴露 $0.91 區域。(CoinMarketCap)
這波行情背後還有基本面敘事:Suilend 推出了 V2.0,整合了借貸與資本管理工具;同時 Sui 生態系統的活動量已接近 50 億筆交易。交易者也在關注 10 月 7–8 日即將舉行的 Sui Basecamp 活動,以及此前預告的金融產品相關預期。(CoinStats)
但需要注意的是:風險正在累積。槓桿正在快速上升。數據顯示 SUI 未平倉合約規模已達到約 $1B,較過去七天增長近 65%;與此同時,在部分技術指標源上,日 RSI 讀數已經進入超買區域。動能是真實的;但盲目追逐它存在風險。(CoinStats)
🎯 SUI 關鍵位
* 🔥 $1.08 — 突破確認
* 🚀 $1.16–$1.28 — 下一段動能區
* 🟢 $0.9725 — 關鍵突破支撐
* 🟢 $0.91 — 更深層支撐
$1 是這場心理層面的博弈。$1.08 纔是圖表真正開始變得有意思的地方。👀📊
#SUI #SuiNetwork #Crypto #Altcoins #BinanceSquare
🚨 $SUI 剛剛收復 $1 — 現在真正的考驗開始 ⚡
$SUI 已重新站上關鍵心理價位 $1.00,憑藉一輪強勁的動能爆發,目前交易在約 $1.04 附近。24 小時成交量約爲 $1.7B,而過去七天 SUI 累計上漲約 44%——這已經不是“安靜的修復”了。(CoinStats)
目前圖表正處於 $1.04–$1.08 的關鍵決策區。若能在 $1.08 上方獲得明確的站穩接受,$1.16–$1.28 便將進入視野;但一旦失守 $0.9725 這一突破水平,局勢將轉弱,並可能暴露 $0.91 區域。(CoinMarketCap)
這波行情背後還有基本面敘事:Suilend 推出了 V2.0,整合了借貸與資本管理工具;同時 Sui 生態系統的活動量已接近 50 億筆交易。交易者也在關注 10 月 7–8 日即將舉行的 Sui Basecamp 活動,以及此前預告的金融產品相關預期。(CoinStats)
但需要注意的是:風險正在累積。槓桿正在快速上升。數據顯示 SUI 未平倉合約規模已達到約 $1B,較過去七天增長近 65%;與此同時,在部分技術指標源上,日 RSI 讀數已經進入超買區域。動能是真實的;但盲目追逐它存在風險。(CoinStats)
🎯 SUI 關鍵位
* 🔥 $1.08 — 突破確認
* 🚀 $1.16–$1.28 — 下一段動能區
* 🟢 $0.9725 — 關鍵突破支撐
* 🟢 $0.91 — 更深層支撐
$1 是這場心理層面的博弈。$1.08 纔是圖表真正開始變得有意思的地方。👀📊
#SUI #SuiNetwork #Crypto #Altcoins #BinanceSquare
$SUI 已重新站上關鍵心理價位 $1.00,憑藉一輪強勁的動能爆發,目前交易在約 $1.04 附近。24 小時成交量約爲 $1.7B,而過去七天 SUI 累計上漲約 44%——這已經不是“安靜的修復”了。(CoinStats)
目前圖表正處於 $1.04–$1.08 的關鍵決策區。若能在 $1.08 上方獲得明確的站穩接受,$1.16–$1.28 便將進入視野;但一旦失守 $0.9725 這一突破水平,局勢將轉弱,並可能暴露 $0.91 區域。(CoinMarketCap)
這波行情背後還有基本面敘事:Suilend 推出了 V2.0,整合了借貸與資本管理工具;同時 Sui 生態系統的活動量已接近 50 億筆交易。交易者也在關注 10 月 7–8 日即將舉行的 Sui Basecamp 活動,以及此前預告的金融產品相關預期。(CoinStats)
但需要注意的是:風險正在累積。槓桿正在快速上升。數據顯示 SUI 未平倉合約規模已達到約 $1B,較過去七天增長近 65%;與此同時,在部分技術指標源上,日 RSI 讀數已經進入超買區域。動能是真實的;但盲目追逐它存在風險。(CoinStats)
🎯 SUI 關鍵位
* 🔥 $1.08 — 突破確認
* 🚀 $1.16–$1.28 — 下一段動能區
* 🟢 $0.9725 — 關鍵突破支撐
* 🟢 $0.91 — 更深層支撐
$1 是這場心理層面的博弈。$1.08 纔是圖表真正開始變得有意思的地方。👀📊
#SUI #SuiNetwork #Crypto #Altcoins #BinanceSquare
68
·
--
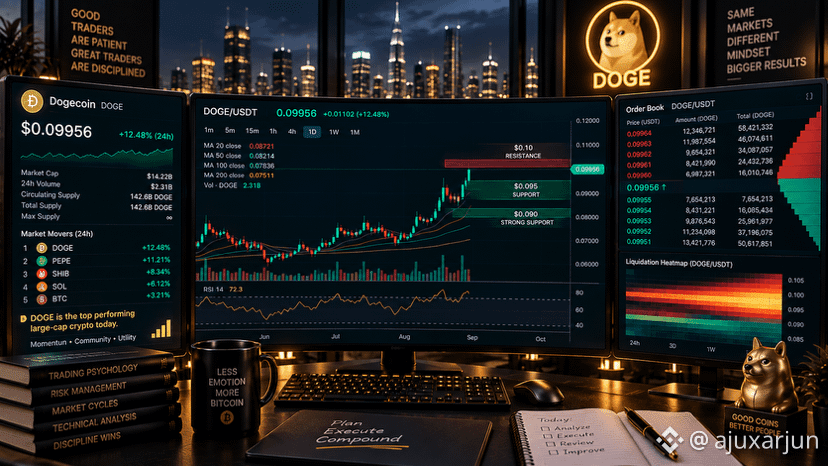
🐕🚨 $DOGE剛剛成爲今天值得關注的山寨幣
$DOGE 目前約爲 $0.0996,漲幅約 ~12.5%,在一份實時加密快照中成爲領漲者;同時整體加密市場的廣度也很強。Binance 的行情數據顯示,BTC 約 $85.5K(+4.7%)、ETH 約 $2.73K(+2.6%)、SOL 約 $116.7(+4.1%)——這意味着 DOGE 參與的是更廣泛的“風險偏好”走勢,而不是單獨上漲。(InteractiveCrypto)
技術面設置正在變得更有意思:$0.10 是心理關口阻力位,$0.095 是首次回踩測試區域,而 $0.090 則是更強的支撐區域。動能很強,但這份實時快照顯示加密情緒已接近 78 / 極度貪婪;追逐一根直線上漲的K線會帶來比“等待價格先建立支撐”更高得多的波動。(InteractiveCrypto)
我正在盯的觸發條件是:在 $0.10 上方突破並站穩,且成交量同步放大;相反,如果回落並重新跌回 $0.095 下方則視爲被拒絕。若買方在阻力上方建立了有效的承接,那麼接下來的上行區間將變成一個“動量交易”的問題;如果 $0.095 失守,市場也會有一個明確的近端水平可供重新評估,而不是在走弱時盲目攤平加倉。
🎯 $DOGE 關鍵位
* 🔴 $0.100 — 心理阻力 / 突破觸發
* 🟢 $0.095 — 首次回踩測試區
* 🟢 $0.090 — 更強支撐
* ⚠️ RSI ~72 — 動能強勁,但偏過熱
DOGE 不需要預測。它需要的是一個要突破的價位。🐕📊
#DOGE #Dogecoin #Memecoin #Crypto #BinanceSquare
🐕🚨 $DOGE剛剛成爲今天值得關注的山寨幣
$DOGE 目前約爲 $0.0996,漲幅約 ~12.5%,在一份實時加密快照中成爲領漲者;同時整體加密市場的廣度也很強。Binance 的行情數據顯示,BTC 約 $85.5K(+4.7%)、ETH 約 $2.73K(+2.6%)、SOL 約 $116.7(+4.1%)——這意味着 DOGE 參與的是更廣泛的“風險偏好”走勢,而不是單獨上漲。(InteractiveCrypto)
技術面設置正在變得更有意思:$0.10 是心理關口阻力位,$0.095 是首次回踩測試區域,而 $0.090 則是更強的支撐區域。動能很強,但這份實時快照顯示加密情緒已接近 78 / 極度貪婪;追逐一根直線上漲的K線會帶來比“等待價格先建立支撐”更高得多的波動。(InteractiveCrypto)
我正在盯的觸發條件是:在 $0.10 上方突破並站穩,且成交量同步放大;相反,如果回落並重新跌回 $0.095 下方則視爲被拒絕。若買方在阻力上方建立了有效的承接,那麼接下來的上行區間將變成一個“動量交易”的問題;如果 $0.095 失守,市場也會有一個明確的近端水平可供重新評估,而不是在走弱時盲目攤平加倉。
🎯 $DOGE 關鍵位
* 🔴 $0.100 — 心理阻力 / 突破觸發
* 🟢 $0.095 — 首次回踩測試區
* 🟢 $0.090 — 更強支撐
* ⚠️ RSI ~72 — 動能強勁,但偏過熱
DOGE 不需要預測。它需要的是一個要突破的價位。🐕📊
#DOGE #Dogecoin #Memecoin #Crypto #BinanceSquare
$DOGE 目前約爲 $0.0996,漲幅約 ~12.5%,在一份實時加密快照中成爲領漲者;同時整體加密市場的廣度也很強。Binance 的行情數據顯示,BTC 約 $85.5K(+4.7%)、ETH 約 $2.73K(+2.6%)、SOL 約 $116.7(+4.1%)——這意味着 DOGE 參與的是更廣泛的“風險偏好”走勢,而不是單獨上漲。(InteractiveCrypto)
技術面設置正在變得更有意思:$0.10 是心理關口阻力位,$0.095 是首次回踩測試區域,而 $0.090 則是更強的支撐區域。動能很強,但這份實時快照顯示加密情緒已接近 78 / 極度貪婪;追逐一根直線上漲的K線會帶來比“等待價格先建立支撐”更高得多的波動。(InteractiveCrypto)
我正在盯的觸發條件是:在 $0.10 上方突破並站穩,且成交量同步放大;相反,如果回落並重新跌回 $0.095 下方則視爲被拒絕。若買方在阻力上方建立了有效的承接,那麼接下來的上行區間將變成一個“動量交易”的問題;如果 $0.095 失守,市場也會有一個明確的近端水平可供重新評估,而不是在走弱時盲目攤平加倉。
🎯 $DOGE 關鍵位
* 🔴 $0.100 — 心理阻力 / 突破觸發
* 🟢 $0.095 — 首次回踩測試區
* 🟢 $0.090 — 更強支撐
* ⚠️ RSI ~72 — 動能強勁,但偏過熱
DOGE 不需要預測。它需要的是一個要突破的價位。🐕📊
#DOGE #Dogecoin #Memecoin #Crypto #BinanceSquare
17
·
--
查看翻譯
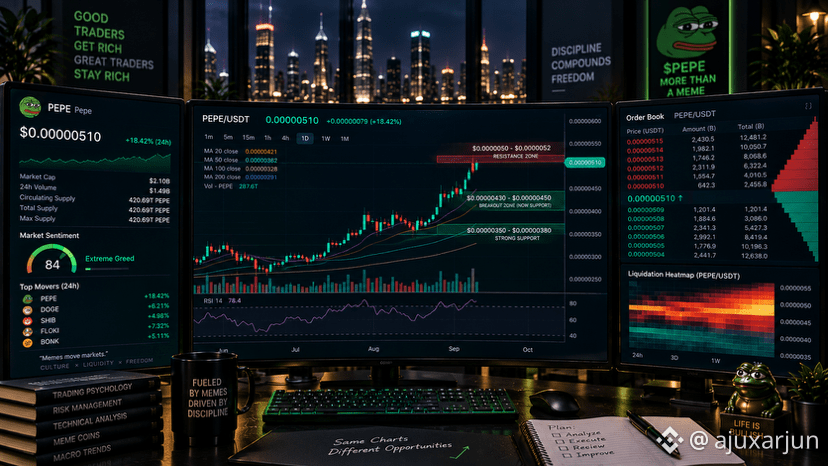
🐸🚨 $PEPE JUST EXPLODED 26% — MEMECOIN ROTATION IS ON
$PEPE is trading around $0.0000051, up roughly 26% in 24 hours, with approximately $1.5B in 24h volume and a market cap near $2.1B. The move is part of a broader risk-on rotation into meme coins as $BTC strengthens, but PEPE is currently moving much faster than the majors. (CoinMarketCap)
The interesting technical level is the $0.00000430–$0.00000450 breakout zone. PEPE has reclaimed that area and pushed toward $0.0000052, while hourly momentum remains positive; however, daily RSI is around 75, meaning the move is already stretched and a retest/consolidation would not be surprising. (InteractiveCrypto)
There’s another layer: recent reporting points to significant whale accumulation, while PEPE’s enormous trading volume shows just how aggressively speculative capital is rotating into the token. The flip side is equally important—meme coins can reverse violently, and PEPE’s high wallet concentration adds additional volatility risk. (InteractiveCrypto)
🎯 PEPE LEVELS
* 🔴 $0.00000520 — immediate breakout area
* 🚀 $0.00000550–$0.00000600 — momentum zone
* 🟢 $0.00000430–$0.00000450 — critical breakout-retest support
* 🟢 $0.00000350–$0.00000380 — stronger support
🐸 Meme season doesn’t announce itself. Volume usually does. 📊⚡
#PEPE #Memecoin #Crypto #BinanceSquare
🐸🚨 $PEPE JUST EXPLODED 26% — MEMECOIN ROTATION IS ON
$PEPE is trading around $0.0000051, up roughly 26% in 24 hours, with approximately $1.5B in 24h volume and a market cap near $2.1B. The move is part of a broader risk-on rotation into meme coins as $BTC strengthens, but PEPE is currently moving much faster than the majors. (CoinMarketCap)
The interesting technical level is the $0.00000430–$0.00000450 breakout zone. PEPE has reclaimed that area and pushed toward $0.0000052, while hourly momentum remains positive; however, daily RSI is around 75, meaning the move is already stretched and a retest/consolidation would not be surprising. (InteractiveCrypto)
There’s another layer: recent reporting points to significant whale accumulation, while PEPE’s enormous trading volume shows just how aggressively speculative capital is rotating into the token. The flip side is equally important—meme coins can reverse violently, and PEPE’s high wallet concentration adds additional volatility risk. (InteractiveCrypto)
🎯 PEPE LEVELS
* 🔴 $0.00000520 — immediate breakout area
* 🚀 $0.00000550–$0.00000600 — momentum zone
* 🟢 $0.00000430–$0.00000450 — critical breakout-retest support
* 🟢 $0.00000350–$0.00000380 — stronger support
🐸 Meme season doesn’t announce itself. Volume usually does. 📊⚡
#PEPE #Memecoin #Crypto #BinanceSquare
$PEPE is trading around $0.0000051, up roughly 26% in 24 hours, with approximately $1.5B in 24h volume and a market cap near $2.1B. The move is part of a broader risk-on rotation into meme coins as $BTC strengthens, but PEPE is currently moving much faster than the majors. (CoinMarketCap)
The interesting technical level is the $0.00000430–$0.00000450 breakout zone. PEPE has reclaimed that area and pushed toward $0.0000052, while hourly momentum remains positive; however, daily RSI is around 75, meaning the move is already stretched and a retest/consolidation would not be surprising. (InteractiveCrypto)
There’s another layer: recent reporting points to significant whale accumulation, while PEPE’s enormous trading volume shows just how aggressively speculative capital is rotating into the token. The flip side is equally important—meme coins can reverse violently, and PEPE’s high wallet concentration adds additional volatility risk. (InteractiveCrypto)
🎯 PEPE LEVELS
* 🔴 $0.00000520 — immediate breakout area
* 🚀 $0.00000550–$0.00000600 — momentum zone
* 🟢 $0.00000430–$0.00000450 — critical breakout-retest support
* 🟢 $0.00000350–$0.00000380 — stronger support
🐸 Meme season doesn’t announce itself. Volume usually does. 📊⚡
#PEPE #Memecoin #Crypto #BinanceSquare
25
·
--
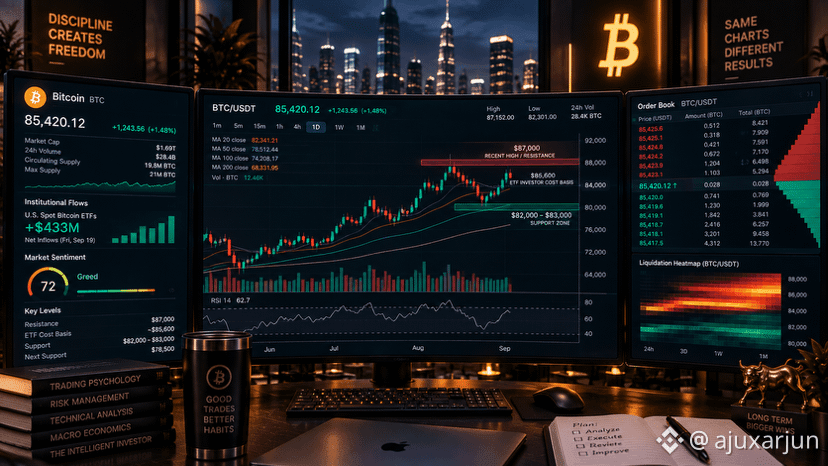
🚨 $BTC 刷新 8 個月高點 — 現在看 $87K
9 月 21 日,$BTC 突破 87,000 美元,觸及自去年 1 月以來的最高水平,隨後回落至 85,000 多美元區間附近。該上漲與強勁的美國現貨 ETF 資金流入以及一波巨大的空頭回補同時發生;據報道,週五 ETF 資金流入約 4.33 億美元,整個加密市場的空頭回補/強平總額接近 9.19 億美元。(華爾街日報)
技術結構也發生了變化:比特幣在大約 45 周低於其 50 周移動平均線之後重新站回該均線;同時,據稱當前 ETF 投資者的成本基礎約爲 85,600 美元。這意味着 85,000–86,000 美元區域是需要重點觀察的關鍵地帶,若要維持突破,那裏將至關重要。(經濟時報)
但重要的是:$87K 是阻力位,而不是確認信號。若能明確站穩近期高點,將有助於保持動能;如果出現拒絕並跌破 85,000 美元,注意力可能轉向 82,000–83,000 美元,78,500 美元則是更深層的結構性支撐。與此同時,宏觀面仍較爲複雜:美國國債收益率接近 4.9%,市場也在繼續關注地緣政治與美聯儲加息進展。(路透社)
🎯 關注的關鍵價位
* 🔴 $87,000 — 近期高點 / 主要阻力
* 🟡 $85,600 — 報道的 ETF 投資者成本基礎
* 🟢 $82,000–$83,000 — 關鍵支撐
* 🔻 $78,500 — 更深層支撐
突破還是多頭陷阱?讓價格來證明。📊⚡
🚨 $BTC 刷新 8 個月高點 — 現在看 $87K
9 月 21 日,$BTC 突破 87,000 美元,觸及自去年 1 月以來的最高水平,隨後回落至 85,000 多美元區間附近。該上漲與強勁的美國現貨 ETF 資金流入以及一波巨大的空頭回補同時發生;據報道,週五 ETF 資金流入約 4.33 億美元,整個加密市場的空頭回補/強平總額接近 9.19 億美元。(華爾街日報)
技術結構也發生了變化:比特幣在大約 45 周低於其 50 周移動平均線之後重新站回該均線;同時,據稱當前 ETF 投資者的成本基礎約爲 85,600 美元。這意味着 85,000–86,000 美元區域是需要重點觀察的關鍵地帶,若要維持突破,那裏將至關重要。(經濟時報)
但重要的是:$87K 是阻力位,而不是確認信號。若能明確站穩近期高點,將有助於保持動能;如果出現拒絕並跌破 85,000 美元,注意力可能轉向 82,000–83,000 美元,78,500 美元則是更深層的結構性支撐。與此同時,宏觀面仍較爲複雜:美國國債收益率接近 4.9%,市場也在繼續關注地緣政治與美聯儲加息進展。(路透社)
🎯 關注的關鍵價位
* 🔴 $87,000 — 近期高點 / 主要阻力
* 🟡 $85,600 — 報道的 ETF 投資者成本基礎
* 🟢 $82,000–$83,000 — 關鍵支撐
* 🔻 $78,500 — 更深層支撐
突破還是多頭陷阱?讓價格來證明。📊⚡
9 月 21 日,$BTC 突破 87,000 美元,觸及自去年 1 月以來的最高水平,隨後回落至 85,000 多美元區間附近。該上漲與強勁的美國現貨 ETF 資金流入以及一波巨大的空頭回補同時發生;據報道,週五 ETF 資金流入約 4.33 億美元,整個加密市場的空頭回補/強平總額接近 9.19 億美元。(華爾街日報)
技術結構也發生了變化:比特幣在大約 45 周低於其 50 周移動平均線之後重新站回該均線;同時,據稱當前 ETF 投資者的成本基礎約爲 85,600 美元。這意味着 85,000–86,000 美元區域是需要重點觀察的關鍵地帶,若要維持突破,那裏將至關重要。(經濟時報)
但重要的是:$87K 是阻力位,而不是確認信號。若能明確站穩近期高點,將有助於保持動能;如果出現拒絕並跌破 85,000 美元,注意力可能轉向 82,000–83,000 美元,78,500 美元則是更深層的結構性支撐。與此同時,宏觀面仍較爲複雜:美國國債收益率接近 4.9%,市場也在繼續關注地緣政治與美聯儲加息進展。(路透社)
🎯 關注的關鍵價位
* 🔴 $87,000 — 近期高點 / 主要阻力
* 🟡 $85,600 — 報道的 ETF 投資者成本基礎
* 🟢 $82,000–$83,000 — 關鍵支撐
* 🔻 $78,500 — 更深層支撐
突破還是多頭陷阱?讓價格來證明。📊⚡
10
·
--
查看翻譯
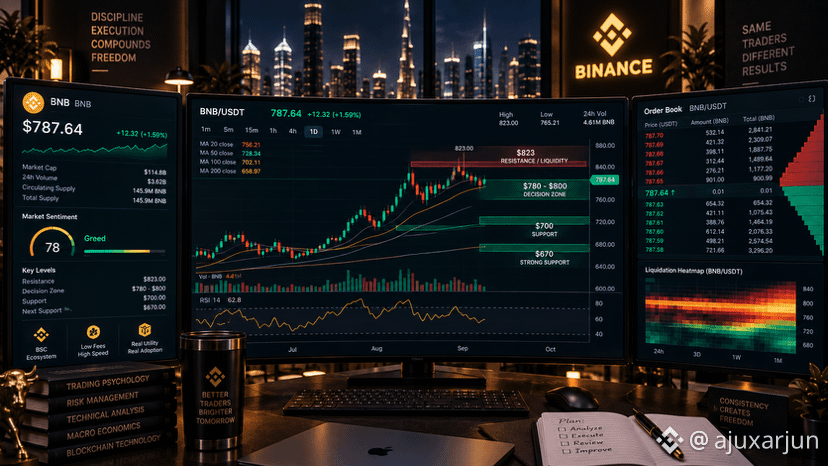
⚡ $BNB IS APPROACHING $823 — THE NEXT BREAKOUT TEST IS HERE
$BNB has climbed sharply from the July lows and is now hovering around the $780–$800 decision zone, with recent analysis placing $823.20 as the key resistance overhead. Momentum remains constructive on the higher timeframes, but price is also showing signs of cooling after the latest advance. (Pluang)
The technical structure is straightforward: $823 is the liquidity/resistance ceiling, while $780–$800 is the immediate battleground. A sustained move above $823 would change the short-term structure; rejection keeps $700 and then $670 as the major downside reference zones. (AMBCrypto)
There is also an important ecosystem backdrop. Binance completed a scheduled system upgrade today, while Binance announced a $100M investment in Circle and an expanded USDC partnership, including plans to integrate USDC into Binance digital-asset products. Separately, BNB’s U.S. ETF story remains an institutional catalyst to monitor. (Binance)
🎯 Key levels
* 🔴 $823 — major resistance / liquidity
* 🟡 $780–$800 — decision zone
* 🟢 $700 — primary support
* 🟢 $670 — strong lower support
$823 is the level to watch — confirmation matters more than prediction. 📊⚡
⚡ $BNB IS APPROACHING $823 — THE NEXT BREAKOUT TEST IS HERE
$BNB has climbed sharply from the July lows and is now hovering around the $780–$800 decision zone, with recent analysis placing $823.20 as the key resistance overhead. Momentum remains constructive on the higher timeframes, but price is also showing signs of cooling after the latest advance. (Pluang)
The technical structure is straightforward: $823 is the liquidity/resistance ceiling, while $780–$800 is the immediate battleground. A sustained move above $823 would change the short-term structure; rejection keeps $700 and then $670 as the major downside reference zones. (AMBCrypto)
There is also an important ecosystem backdrop. Binance completed a scheduled system upgrade today, while Binance announced a $100M investment in Circle and an expanded USDC partnership, including plans to integrate USDC into Binance digital-asset products. Separately, BNB’s U.S. ETF story remains an institutional catalyst to monitor. (Binance)
🎯 Key levels
* 🔴 $823 — major resistance / liquidity
* 🟡 $780–$800 — decision zone
* 🟢 $700 — primary support
* 🟢 $670 — strong lower support
$823 is the level to watch — confirmation matters more than prediction. 📊⚡
$BNB has climbed sharply from the July lows and is now hovering around the $780–$800 decision zone, with recent analysis placing $823.20 as the key resistance overhead. Momentum remains constructive on the higher timeframes, but price is also showing signs of cooling after the latest advance. (Pluang)
The technical structure is straightforward: $823 is the liquidity/resistance ceiling, while $780–$800 is the immediate battleground. A sustained move above $823 would change the short-term structure; rejection keeps $700 and then $670 as the major downside reference zones. (AMBCrypto)
There is also an important ecosystem backdrop. Binance completed a scheduled system upgrade today, while Binance announced a $100M investment in Circle and an expanded USDC partnership, including plans to integrate USDC into Binance digital-asset products. Separately, BNB’s U.S. ETF story remains an institutional catalyst to monitor. (Binance)
🎯 Key levels
* 🔴 $823 — major resistance / liquidity
* 🟡 $780–$800 — decision zone
* 🟢 $700 — primary support
* 🟢 $670 — strong lower support
$823 is the level to watch — confirmation matters more than prediction. 📊⚡
29
·
--
查看翻譯
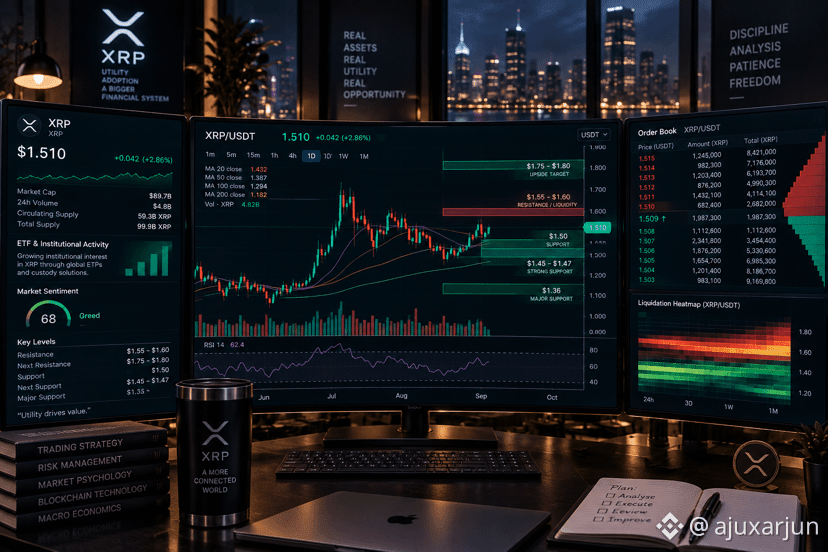
🚨 $XRP IS BREAKING OUT — $1.60 IS THE DECISION ZONE
$XRP has pushed through a multi-week descending channel and is trading around $1.51, with momentum accelerating after the breakout. Current technical readings put the next major test around $1.55–$1.60, while the $1.50 area becomes the first level to defend if price retests the breakout. (CoinStats)
The derivatives tape is expanding alongside price: reported XRP futures open interest has risen roughly 19%, while short liquidations accounted for the overwhelming majority of recent liquidations. That confirms aggressive positioning behind the move, but it also means a failed breakout could produce elevated volatility in either direction. (CoinStats)
There is also a fundamental catalyst window: XRP spot ETFs have maintained a reported 10-week consecutive weekly inflow streak, while the XRPL is scheduled for a Batch V1.1 upgrade around September 29. The combination of improving technical structure and institutional/ledger developments makes $1.55–$1.60 the area I would watch for confirmation rather than blindly chasing the current move. (Coin Edition)
🎯 Key levels
* 🔴 $1.55–$1.60 — breakout / liquidity zone
* 🚀 $1.75–$1.80 — next upside resistance
* 🟢 $1.50 — immediate support
* 🟢 $1.45–$1.47 — stronger retest zone
* 🔻 $1.36 — major structural support
The breakout is interesting. The retest is where the information is. 📊⚡
🚨 $XRP IS BREAKING OUT — $1.60 IS THE DECISION ZONE
$XRP has pushed through a multi-week descending channel and is trading around $1.51, with momentum accelerating after the breakout. Current technical readings put the next major test around $1.55–$1.60, while the $1.50 area becomes the first level to defend if price retests the breakout. (CoinStats)
The derivatives tape is expanding alongside price: reported XRP futures open interest has risen roughly 19%, while short liquidations accounted for the overwhelming majority of recent liquidations. That confirms aggressive positioning behind the move, but it also means a failed breakout could produce elevated volatility in either direction. (CoinStats)
There is also a fundamental catalyst window: XRP spot ETFs have maintained a reported 10-week consecutive weekly inflow streak, while the XRPL is scheduled for a Batch V1.1 upgrade around September 29. The combination of improving technical structure and institutional/ledger developments makes $1.55–$1.60 the area I would watch for confirmation rather than blindly chasing the current move. (Coin Edition)
🎯 Key levels
* 🔴 $1.55–$1.60 — breakout / liquidity zone
* 🚀 $1.75–$1.80 — next upside resistance
* 🟢 $1.50 — immediate support
* 🟢 $1.45–$1.47 — stronger retest zone
* 🔻 $1.36 — major structural support
The breakout is interesting. The retest is where the information is. 📊⚡
$XRP has pushed through a multi-week descending channel and is trading around $1.51, with momentum accelerating after the breakout. Current technical readings put the next major test around $1.55–$1.60, while the $1.50 area becomes the first level to defend if price retests the breakout. (CoinStats)
The derivatives tape is expanding alongside price: reported XRP futures open interest has risen roughly 19%, while short liquidations accounted for the overwhelming majority of recent liquidations. That confirms aggressive positioning behind the move, but it also means a failed breakout could produce elevated volatility in either direction. (CoinStats)
There is also a fundamental catalyst window: XRP spot ETFs have maintained a reported 10-week consecutive weekly inflow streak, while the XRPL is scheduled for a Batch V1.1 upgrade around September 29. The combination of improving technical structure and institutional/ledger developments makes $1.55–$1.60 the area I would watch for confirmation rather than blindly chasing the current move. (Coin Edition)
🎯 Key levels
* 🔴 $1.55–$1.60 — breakout / liquidity zone
* 🚀 $1.75–$1.80 — next upside resistance
* 🟢 $1.50 — immediate support
* 🟢 $1.45–$1.47 — stronger retest zone
* 🔻 $1.36 — major structural support
The breakout is interesting. The retest is where the information is. 📊⚡
70
·
--
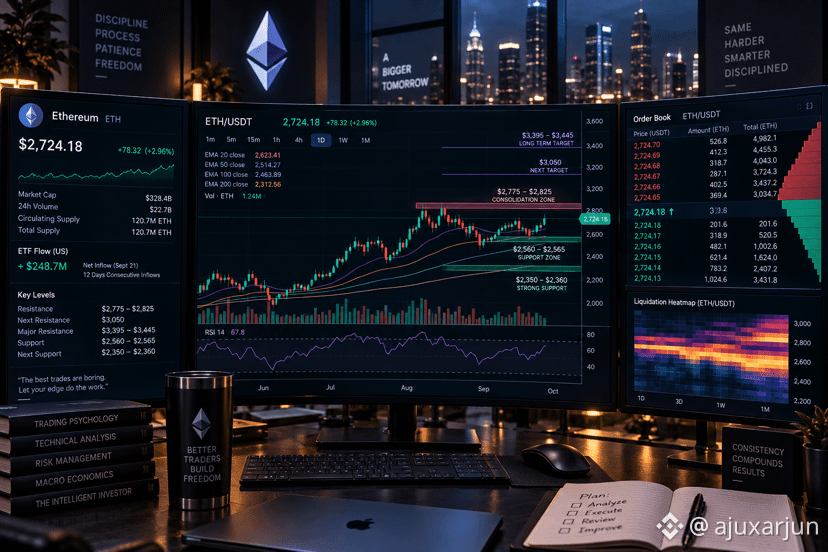
⚡ $ETH 剛剛突破牛旗形態 — $3,050 在前嗎?
$ETH 目前交易在約 $2,725,先是突破了此前限制近期橫盤的 $2,661.52 阻力位。路透的技術分析將其視爲從牛旗結構中的突破,量度目標約爲 $3,050,中間的整固區間在 $2,775–$2,825。(Reuters)
動能面表現強勁,但市場可能已被推得有點“過熱”。ETH 位於主要移動均線之上,而 RSI 讀數正在逼近上沿區間;因此,$2,775–$2,825 是需要重點觀察的關鍵區域:看它是繼續上行還是出現回落拒絕。(The Cryptonomist)
資金流在加油:據報道,截至 9 月 21 日,現貨以太坊 ETF 錄得約 2.7 億美元資金淨流入,爲 2026 年迄今單日最強的流入。與此同時,ETH 仍對更廣泛的風險偏好以及由比特幣主導的市場走勢高度敏感,因此需要確認信號,而不是盲目追逐動能。(FinanceFeeds)
🎯 我關注的關鍵位
* 🔥 $2,775–$2,825 — 直接阻力 / 突破確認
* 🚀 $3,050 — 量度突破目標
* 🟣 $3,395–$3,445 — 更高週期的主要阻力
* 🟢 $2,560–$2,565 — 第一重要支撐
* 🔻 $2,350–$2,360 — 更深層的結構性支撐
突破已確認?還是在下一段行情前再來一次回踩?📊⚡
⚡ $ETH 剛剛突破牛旗形態 — $3,050 在前嗎?
$ETH 目前交易在約 $2,725,先是突破了此前限制近期橫盤的 $2,661.52 阻力位。路透的技術分析將其視爲從牛旗結構中的突破,量度目標約爲 $3,050,中間的整固區間在 $2,775–$2,825。(Reuters)
動能面表現強勁,但市場可能已被推得有點“過熱”。ETH 位於主要移動均線之上,而 RSI 讀數正在逼近上沿區間;因此,$2,775–$2,825 是需要重點觀察的關鍵區域:看它是繼續上行還是出現回落拒絕。(The Cryptonomist)
資金流在加油:據報道,截至 9 月 21 日,現貨以太坊 ETF 錄得約 2.7 億美元資金淨流入,爲 2026 年迄今單日最強的流入。與此同時,ETH 仍對更廣泛的風險偏好以及由比特幣主導的市場走勢高度敏感,因此需要確認信號,而不是盲目追逐動能。(FinanceFeeds)
🎯 我關注的關鍵位
* 🔥 $2,775–$2,825 — 直接阻力 / 突破確認
* 🚀 $3,050 — 量度突破目標
* 🟣 $3,395–$3,445 — 更高週期的主要阻力
* 🟢 $2,560–$2,565 — 第一重要支撐
* 🔻 $2,350–$2,360 — 更深層的結構性支撐
突破已確認?還是在下一段行情前再來一次回踩?📊⚡
$ETH 目前交易在約 $2,725,先是突破了此前限制近期橫盤的 $2,661.52 阻力位。路透的技術分析將其視爲從牛旗結構中的突破,量度目標約爲 $3,050,中間的整固區間在 $2,775–$2,825。(Reuters)
動能面表現強勁,但市場可能已被推得有點“過熱”。ETH 位於主要移動均線之上,而 RSI 讀數正在逼近上沿區間;因此,$2,775–$2,825 是需要重點觀察的關鍵區域:看它是繼續上行還是出現回落拒絕。(The Cryptonomist)
資金流在加油:據報道,截至 9 月 21 日,現貨以太坊 ETF 錄得約 2.7 億美元資金淨流入,爲 2026 年迄今單日最強的流入。與此同時,ETH 仍對更廣泛的風險偏好以及由比特幣主導的市場走勢高度敏感,因此需要確認信號,而不是盲目追逐動能。(FinanceFeeds)
🎯 我關注的關鍵位
* 🔥 $2,775–$2,825 — 直接阻力 / 突破確認
* 🚀 $3,050 — 量度突破目標
* 🟣 $3,395–$3,445 — 更高週期的主要阻力
* 🟢 $2,560–$2,565 — 第一重要支撐
* 🔻 $2,350–$2,360 — 更深層的結構性支撐
突破已確認?還是在下一段行情前再來一次回踩?📊⚡
3
116
·
--
查看翻譯
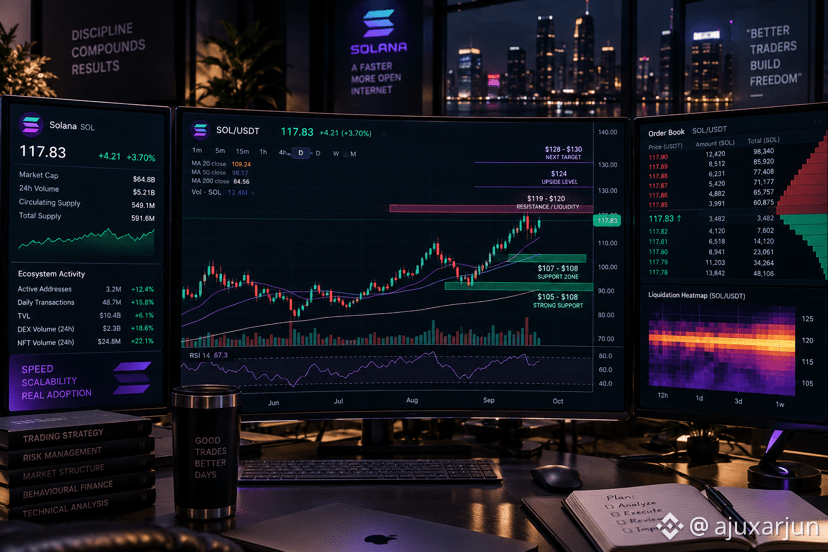
⚡ $SOL IS TESTING THE $120 WALL — BREAKOUT OR REJECTION?
$SOL is trading around $117–$118 after a strong recovery, with the daily structure firmly above its major moving averages. The key battle is now $119–$120, where recent price action has encountered sellers. (Invezz)
Momentum is strong, but the setup is getting extended: daily RSI is around 70, while SOL remains above the 20/50/100/200-day averages. That creates a classic momentum-continuation vs. exhaustion decision point rather than a level to chase blindly. (CoinLore)
The demand backdrop is notable: U.S. spot SOL ETFs recorded approximately $26.1M of net inflows on Sept. 21, extending the reported inflow streak to 12 weeks, while DeFi Development Corp. disclosed an additional 101,381 SOL accumulation. (Invezz)
My systematic framework: acceptance above $120 would put $124 and then $128–$130 into focus; failure at resistance keeps $107–$108 as the first major support zone, with roughly $105 as deeper trend support. 📊
Watch the confirmation. Don’t chase the candle. ⚡📈
⚡ $SOL IS TESTING THE $120 WALL — BREAKOUT OR REJECTION?
$SOL is trading around $117–$118 after a strong recovery, with the daily structure firmly above its major moving averages. The key battle is now $119–$120, where recent price action has encountered sellers. (Invezz)
Momentum is strong, but the setup is getting extended: daily RSI is around 70, while SOL remains above the 20/50/100/200-day averages. That creates a classic momentum-continuation vs. exhaustion decision point rather than a level to chase blindly. (CoinLore)
The demand backdrop is notable: U.S. spot SOL ETFs recorded approximately $26.1M of net inflows on Sept. 21, extending the reported inflow streak to 12 weeks, while DeFi Development Corp. disclosed an additional 101,381 SOL accumulation. (Invezz)
My systematic framework: acceptance above $120 would put $124 and then $128–$130 into focus; failure at resistance keeps $107–$108 as the first major support zone, with roughly $105 as deeper trend support. 📊
Watch the confirmation. Don’t chase the candle. ⚡📈
$SOL is trading around $117–$118 after a strong recovery, with the daily structure firmly above its major moving averages. The key battle is now $119–$120, where recent price action has encountered sellers. (Invezz)
Momentum is strong, but the setup is getting extended: daily RSI is around 70, while SOL remains above the 20/50/100/200-day averages. That creates a classic momentum-continuation vs. exhaustion decision point rather than a level to chase blindly. (CoinLore)
The demand backdrop is notable: U.S. spot SOL ETFs recorded approximately $26.1M of net inflows on Sept. 21, extending the reported inflow streak to 12 weeks, while DeFi Development Corp. disclosed an additional 101,381 SOL accumulation. (Invezz)
My systematic framework: acceptance above $120 would put $124 and then $128–$130 into focus; failure at resistance keeps $107–$108 as the first major support zone, with roughly $105 as deeper trend support. 📊
Watch the confirmation. Don’t chase the candle. ⚡📈
1
76
·
--
查看翻譯
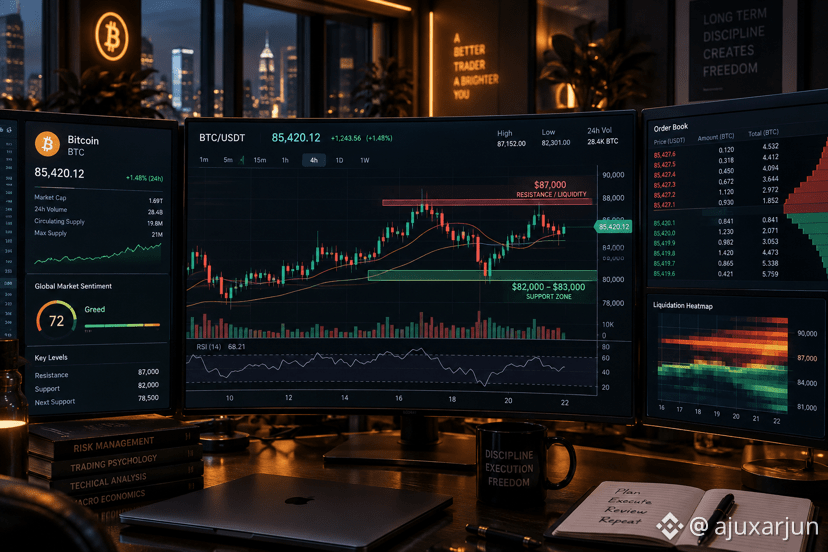
🚨 $BTC IS BACK ABOVE $85K — BUT THE NEXT MOVE MATTERS
$BTC has rebounded sharply into the $85K–$87K area, with price recently reaching roughly $87K before pulling back. The broader structure remains constructive, but momentum is becoming stretched: one current technical reading places daily RSI around 69, while the market’s Fear & Greed reading is in extreme-greed territory. (The Cryptonomist)
The key battle is now $87,000 resistance/liquidity. A clean breakout and acceptance above that zone would strengthen the bullish structure; rejection could send price back toward the $82,000–$83,000 support zone, which is currently being watched as an important area for buyers. (Moneycontrol)
Institutional flows are also part of the backdrop: Strategy recently added about 950 BTC (~$75–76M), while recent reporting pointed to meaningful spot-Bitcoin ETF inflows. At the same time, BTC has been sensitive to broader risk sentiment, Treasury yields and geopolitical developments, so chasing an extended candle carries additional volatility risk. (The Wall Street Journal)
My framework: bullish while the higher-timeframe structure holds, but I want confirmation rather than blindly buying into resistance. 📊⚡
🎯 Key levels
* 🔴 $87,000 — breakout / liquidity zone
* 🟢 $82,000–$83,000 — major support
* 🟡 $78,500 — deeper invalidation area
BTC setup: breakout confirmation > emotional FOMO. 📈
🚨 $BTC IS BACK ABOVE $85K — BUT THE NEXT MOVE MATTERS
$BTC has rebounded sharply into the $85K–$87K area, with price recently reaching roughly $87K before pulling back. The broader structure remains constructive, but momentum is becoming stretched: one current technical reading places daily RSI around 69, while the market’s Fear & Greed reading is in extreme-greed territory. (The Cryptonomist)
The key battle is now $87,000 resistance/liquidity. A clean breakout and acceptance above that zone would strengthen the bullish structure; rejection could send price back toward the $82,000–$83,000 support zone, which is currently being watched as an important area for buyers. (Moneycontrol)
Institutional flows are also part of the backdrop: Strategy recently added about 950 BTC (~$75–76M), while recent reporting pointed to meaningful spot-Bitcoin ETF inflows. At the same time, BTC has been sensitive to broader risk sentiment, Treasury yields and geopolitical developments, so chasing an extended candle carries additional volatility risk. (The Wall Street Journal)
My framework: bullish while the higher-timeframe structure holds, but I want confirmation rather than blindly buying into resistance. 📊⚡
🎯 Key levels
* 🔴 $87,000 — breakout / liquidity zone
* 🟢 $82,000–$83,000 — major support
* 🟡 $78,500 — deeper invalidation area
BTC setup: breakout confirmation > emotional FOMO. 📈
$BTC has rebounded sharply into the $85K–$87K area, with price recently reaching roughly $87K before pulling back. The broader structure remains constructive, but momentum is becoming stretched: one current technical reading places daily RSI around 69, while the market’s Fear & Greed reading is in extreme-greed territory. (The Cryptonomist)
The key battle is now $87,000 resistance/liquidity. A clean breakout and acceptance above that zone would strengthen the bullish structure; rejection could send price back toward the $82,000–$83,000 support zone, which is currently being watched as an important area for buyers. (Moneycontrol)
Institutional flows are also part of the backdrop: Strategy recently added about 950 BTC (~$75–76M), while recent reporting pointed to meaningful spot-Bitcoin ETF inflows. At the same time, BTC has been sensitive to broader risk sentiment, Treasury yields and geopolitical developments, so chasing an extended candle carries additional volatility risk. (The Wall Street Journal)
My framework: bullish while the higher-timeframe structure holds, but I want confirmation rather than blindly buying into resistance. 📊⚡
🎯 Key levels
* 🔴 $87,000 — breakout / liquidity zone
* 🟢 $82,000–$83,000 — major support
* 🟡 $78,500 — deeper invalidation area
BTC setup: breakout confirmation > emotional FOMO. 📈
1
124
登入以探索更多內容
加入幣安廣場中的全球加密貨幣用戶
⚡️ 獲取加密貨幣的最新和實用資訊。
💬 受到全球最大加密貨幣交易所的信任。
👍 發掘來自經過驗證創作者的真實見解。
電子郵件 / 電話號碼
熱門話題
AI股持续上涨还有哪些投资机会
627,396 次瀏覽
2,438 討論中
快問快答!參與發佈熱門話題贏流量
✨本期話題: AI股持續上漲還有哪些投資機會?
👉參與方式:
發佈短文或是長文並帶主話題 #AI股持续上涨还有哪些投资机会
分享您是看漲還是看跌,或是曬出您的持倉
內容正文建議,如:
- 英偉達稱明年芯片銷量或將翻倍,頭部AI公司營收預測屢創新高,背後算力投入同樣驚人。你認爲AI需求真的起飛了嗎?這種需求能持續多久?近日AI股上漲,你覺得這波AI股票行情是強勢反攻,還是短期反彈?
- Anthropic、OpenAI 等行業大佬呼籲放緩AI發展速度,特朗普卻計劃組建AI軍隊,稱AI未來或佔美國GDP的25%。你更認同哪一方?政府下場會成爲AI股的長期利好嗎?
- 你會佈局AI股嗎?請使用曬單卡片曬出你的AI股票相關標的交易/持倉。
⏰本期開放投稿時間:
- 2026年9月22日 15:00 - 2026年9月24日12:00 (東八區時間)
🎁活動獎勵:
- 流量扶持:符合活動要求且被評選上的優質內容,隨機獲得500 - 3000流量扶持激勵(最少發佈100字,按以上方向發佈的帖文被選上的機會更大哦, 獲得流量激勵的帖文作者將收到小祕書通知)
- 官方曝光:評選上的優質內容將有機會被官方賬號推薦
獲取內容發佈靈感,請參考話題頁#AI股持续上涨还有哪些投资机会 或廣場内容流量诊断清单
币安广场
·632 人按讚
·713.7k 次瀏覽
比特币两度受阻87300美元
2,486 次瀏覽
62 討論中
BCH因CME期货上线涨约28%
4,385 次瀏覽
55 討論中