Binance Square
BuilderOG
150 貼文

BuilderOG

CryptoGuru 📈 || Blockchain 📊 || Tech King 🖥
0 關注
3 粉絲
5 點讚數
貼文
·
--
查看翻譯
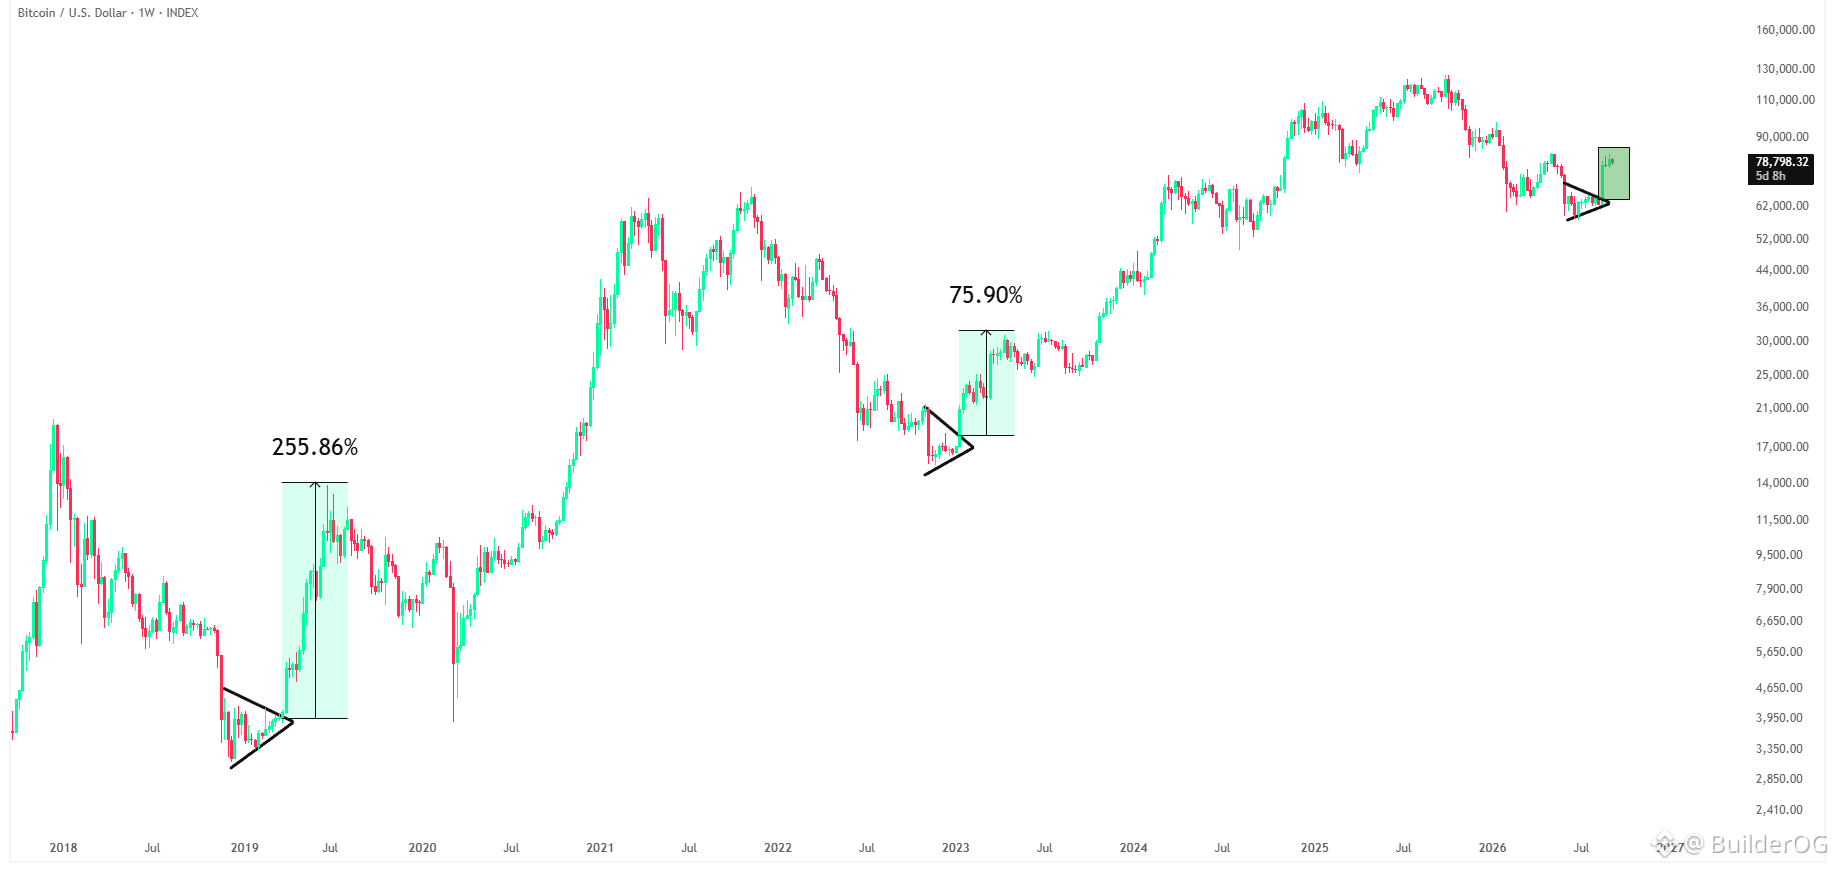
$BTC has officially broken out of the symmetrical triangle. Previous cycle bottoms took time to form before breaking out, followed by moves of roughly +255%, and +76%. This time, the bottom formation took its own time too. Let’s see how much higher $BTC goes before we look for the retrace, just like previous cycles.
查看翻譯
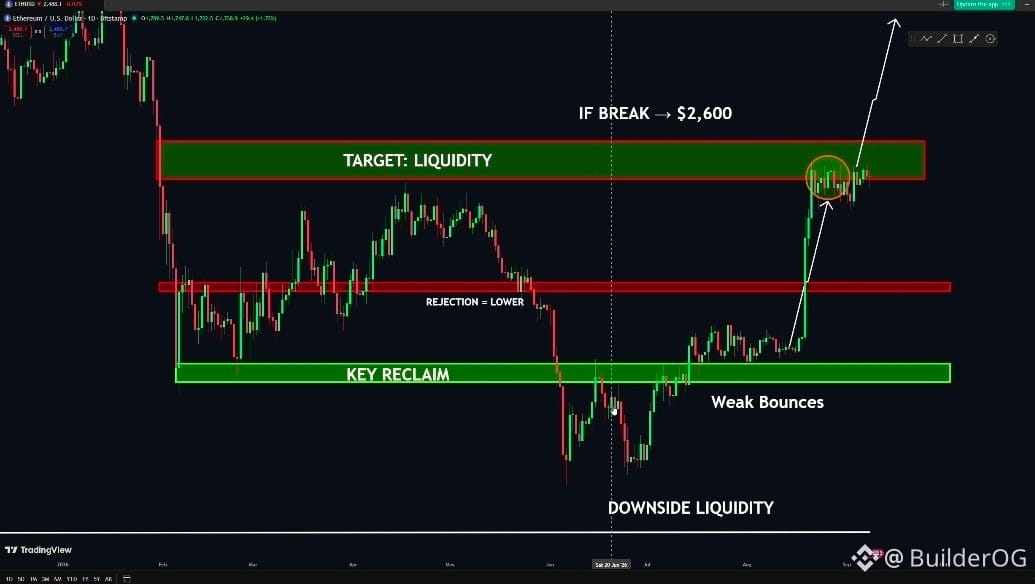
$ETH IS RIGHT AT THE BREAKOUT ZONE. 👀 ETH has already made the impulsive move into the $2.45K–$2.65K liquidity zone and is now consolidating inside it. This is the key part of the setup: Breakout → consolidation → hold the zone → continuation. The level to watch is $2,600. BREAK ABOVE $2.6K → NEXT LEG HIGHER 🚀 REJECTION → deeper pullback possible. And above $2.6K, the chart opens up toward the previous highs around $3K+. ETH is sitting right on the line between consolidation and expansion. $2.6K is the trigger. 👀🔥
查看翻譯
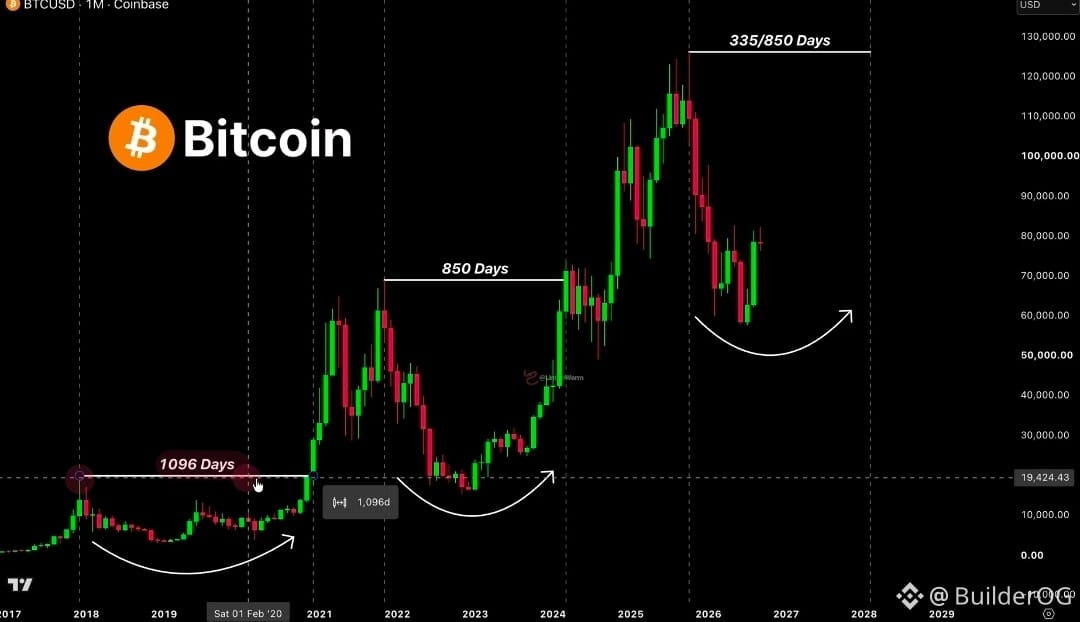
🚨 BITCOIN $BTC CYCLE TIMELINE IS COMPRESSING FASTER THAN EVER Each historical cycle, Bitcoin has taken significantly less time to break out and set a brand new all-time high The gap between peaks compressed from 1,096 days down to 850 days in recent cycles, showing the market is accelerating over time Because the recent market bottom formed roughly 3 to 4 months earlier than usual, the timeline for the next expansion has pulled forward even faster Following this cycle compression model, we could see Bitcoin reaching a new all-time high in late Q4 2027 rather than waiting until 2028 If this accelerated math plays out, price could easily be trading well above $126,000 by November 2027 Patience is key while the macro structure builds toward that next major expansion leg Follow + notifs on, I will keep you updated
查看翻譯
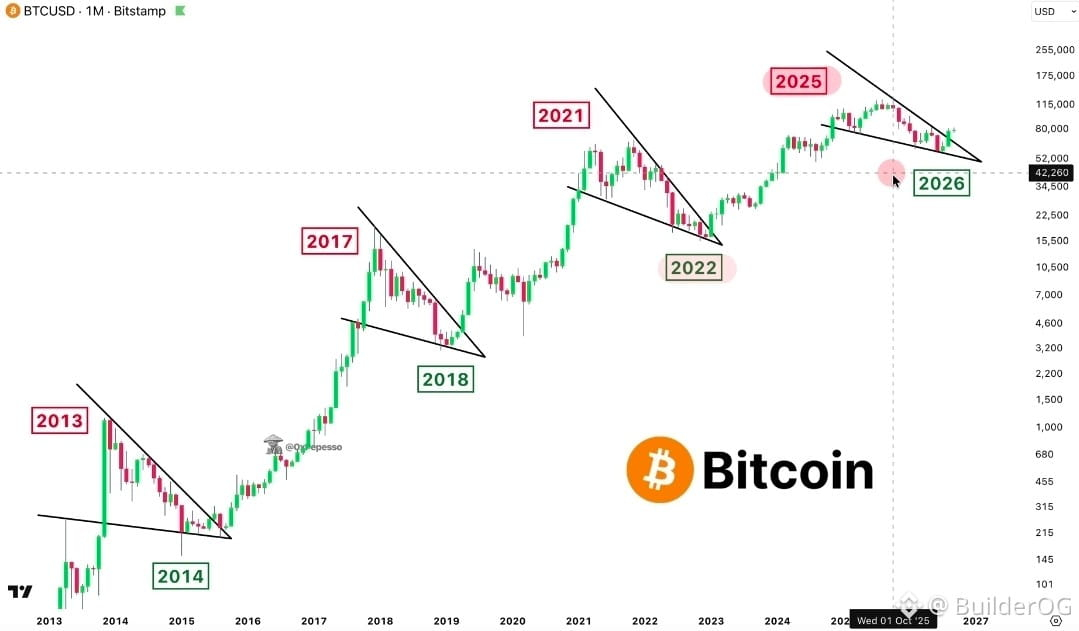
🚨 BITCOIN FRACTAL SHOWS HOW EVERY CYCLE TOP ACTUALLY RESETS Major Bitcoin $BTC cycle tops rarely end in immediate straight-line collapses Instead, price historically forms a descending consolidation structure, grinding down to clear out leverage before breaking out into the next macro expansion We saw this exact pattern unfold following the 2013, 2017, and 2021 market peaks Now Bitcoin is building that same descending structure following the 2025 high, with price currently testing the upper boundary near $83.4k This fractal matters because it shows how the market systematically resets momentum before attempting its next major move higher If price breaks out above the upper trendline, probability supports the start of another macro expansion phase Follow + notifs on, I will keep you updated
查看翻譯
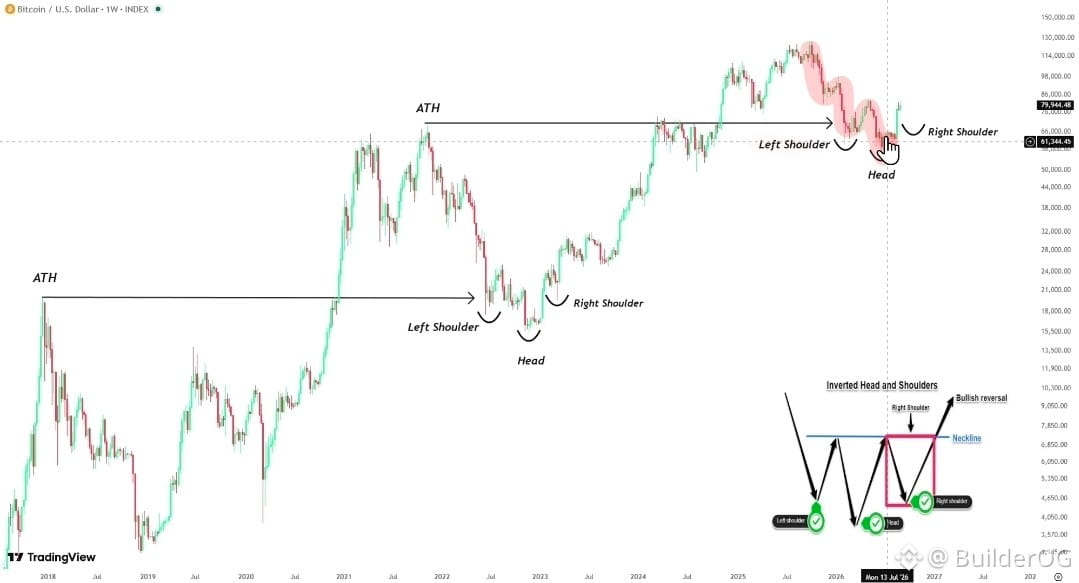
$BTC could be approaching its final test before the next major move. The right shoulder is forming and this retest could be the last shakeout before the structure confirms. We’ve seen similar price behavior and reversal structure around the previous cycle bottom. If this zone holds and $BTC reclaims the $82K–$84K neckline the setup gets very interesting. For now I’m watching the right shoulder closely.
查看翻譯
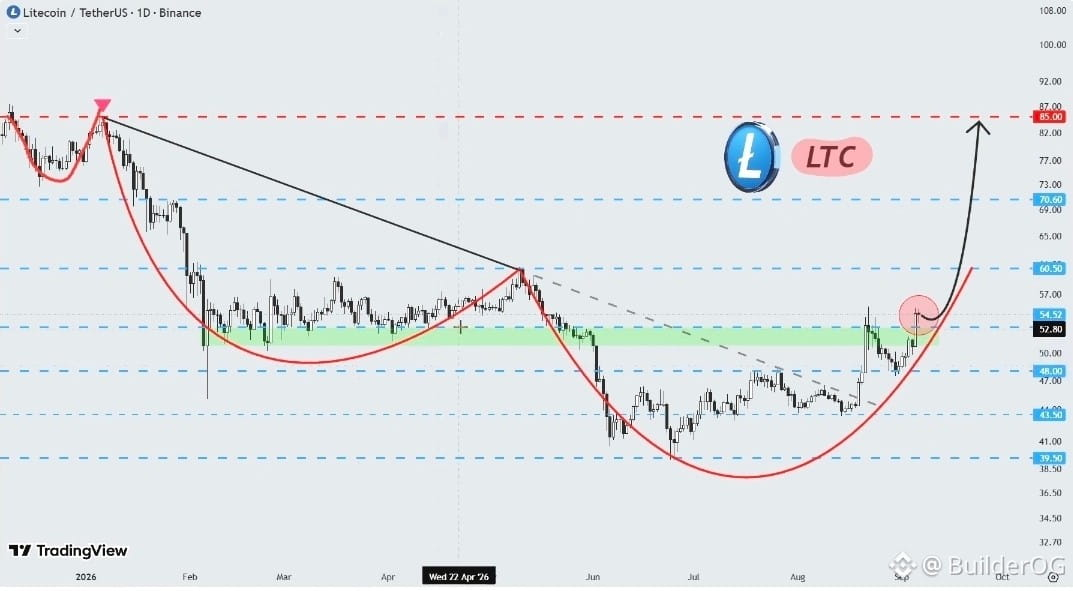
$LTC Guess You Missed This Breakout 🤔 Litecoin has broken through the main s/r zone on the daily timeframe, a move backed by fundamentals that most people completely ignored. - LitVM mainnet is launching. - Float is shrinking due to supply dormancy. - Merged mining with $DOGE adds network strength. - Clarity Act still is still ahead as a potential institutional catalyst. This is what a real setup looks like before it goes mainstream. Target levels: 🎯 $60.5 🎯 $70.6 🎯 $85
查看翻譯
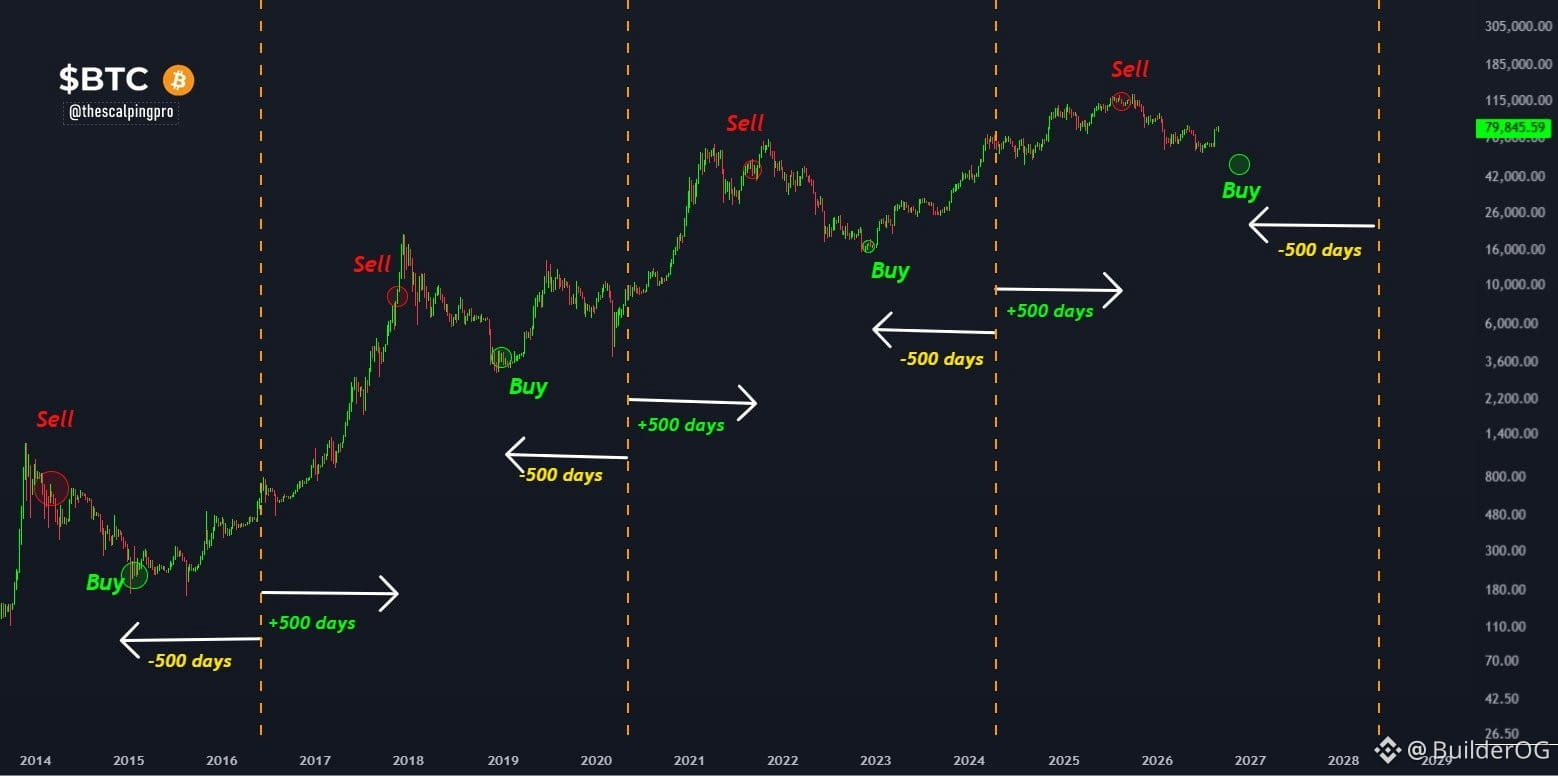
#Bitcoin : Buy BTC in the next 85 days 🚨 According to the 500-Day Bitcoin Strategy : 1) Buy Bitcoin 500 days before the halving 2) Hold & don’t get shaken out 3) Sell 500 days after the halving 4) Repeat This strategy has worked remarkably well in previous cycles. The next Bitcoin halving is only ~585 days away. That means, according to this strategy, we have roughly 85 days left to accumulate BTC. 85 days from today = November 30th. The best time to buy Bitcoin & Crypto is coming. Don't miss $BTC
查看翻譯
I told you all almost 2 weeks ago that $BTC will pump to $82K and then will dump back to $70K. Be ready for continuous $BTC dump now. The real bottom is still not in. $BTC needs to go below $65K before having a real pump towards $100K.
查看翻譯
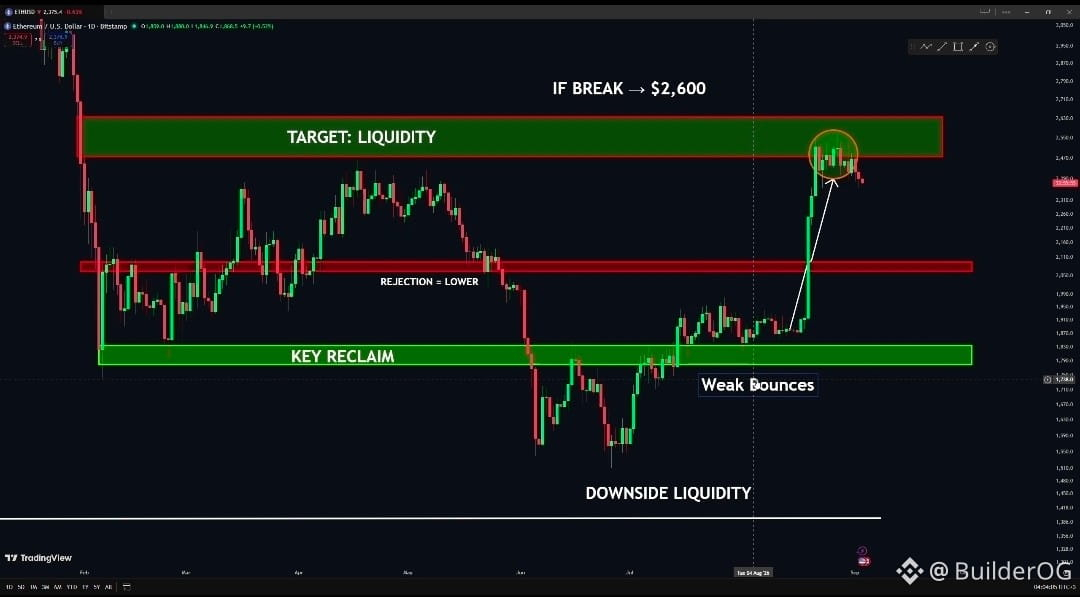
$ETH JUST BROKE OUT OF THE SAME STRUCTURE AGAIN. 🚨 We’ve seen this cycle repeat: Distribution → lower highs → breakdown. But this time, ETH has reclaimed the $2.2K–$2.3K range high and pushed above the previous fakeout zone. Now the important level is overhead: $3.4K = OPEN LIQUIDITY. 🎯 If ETH can hold this breakout and continue expanding, $3.4K becomes the obvious next major target. The structure is changing. Breakout → retest → expansion? 👀🔥
查看翻譯
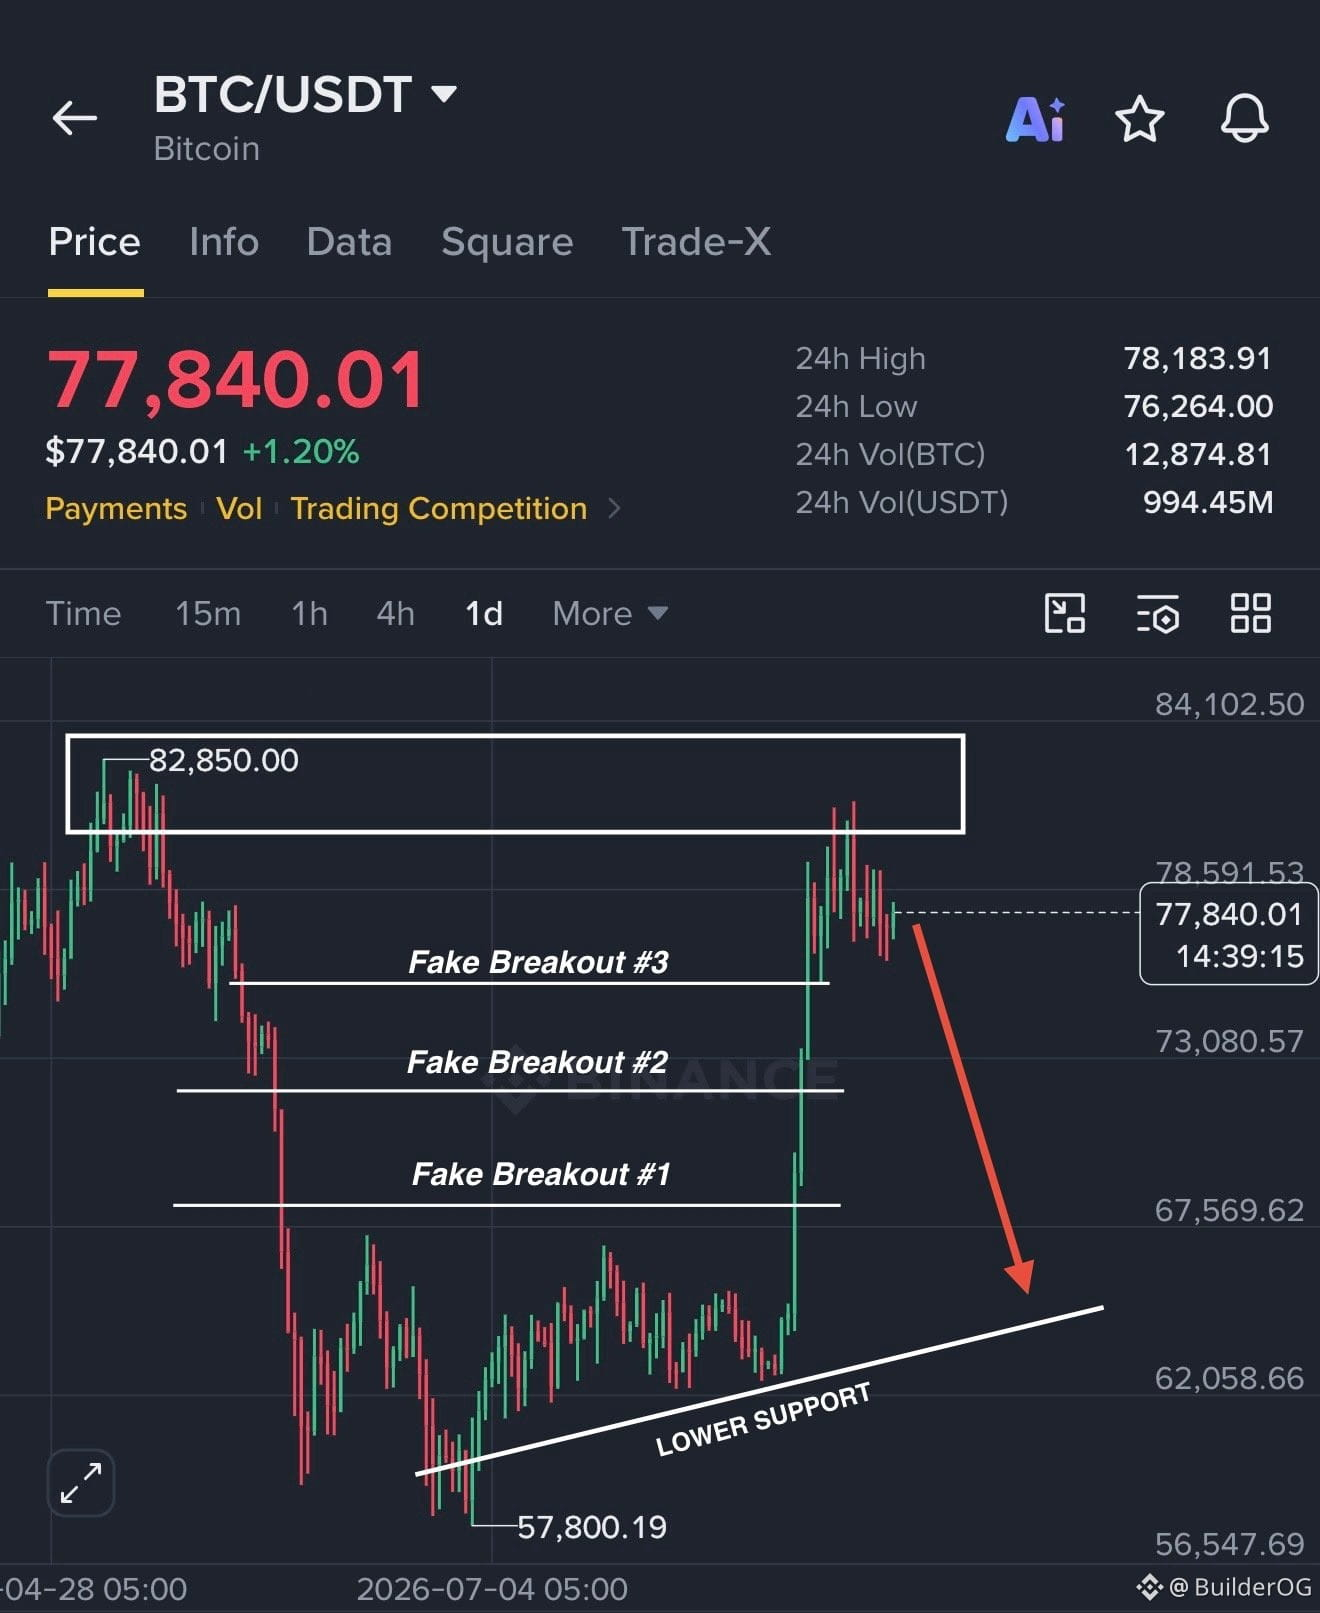
You don’t need to have multiple indicators to predict the next $BTC move. $BTC is performing exactly as I told you all. After the big pump from around $62K, BTC failed to continue above $80K and now it is struggling even around $76K-$78K. If $76K breaks, I think $73K comes very quickly and then a dump towards $62K is inevitable. I will only change this bearish view if BTC gets back above $80K–$83K and holds there with good strength. #BTC Price Analysis#
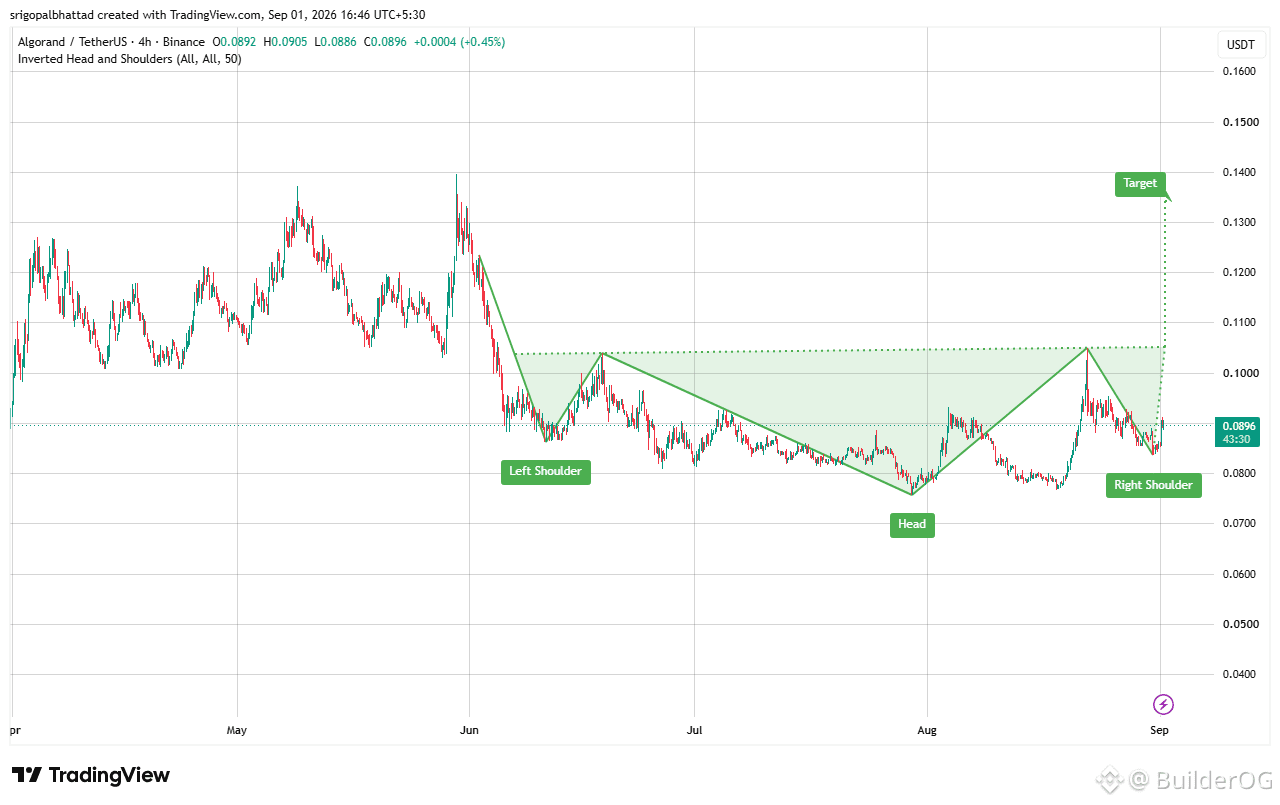
#ALGORAND (ALGO) 🟢 📈 反向頭肩形態! $ALGO 已形成清晰的反向頭肩形態,頸線約在 $0.105。若價格突破該阻力位,可能確認看漲反轉。 🚀 當前:約 $0.0896 🎯 目標:約 $0.14 🔑 關鍵阻力:約 $0.105 若能持續向上突破頸線,可能推動價格朝向所預測的目標方向運行。 #ALGO
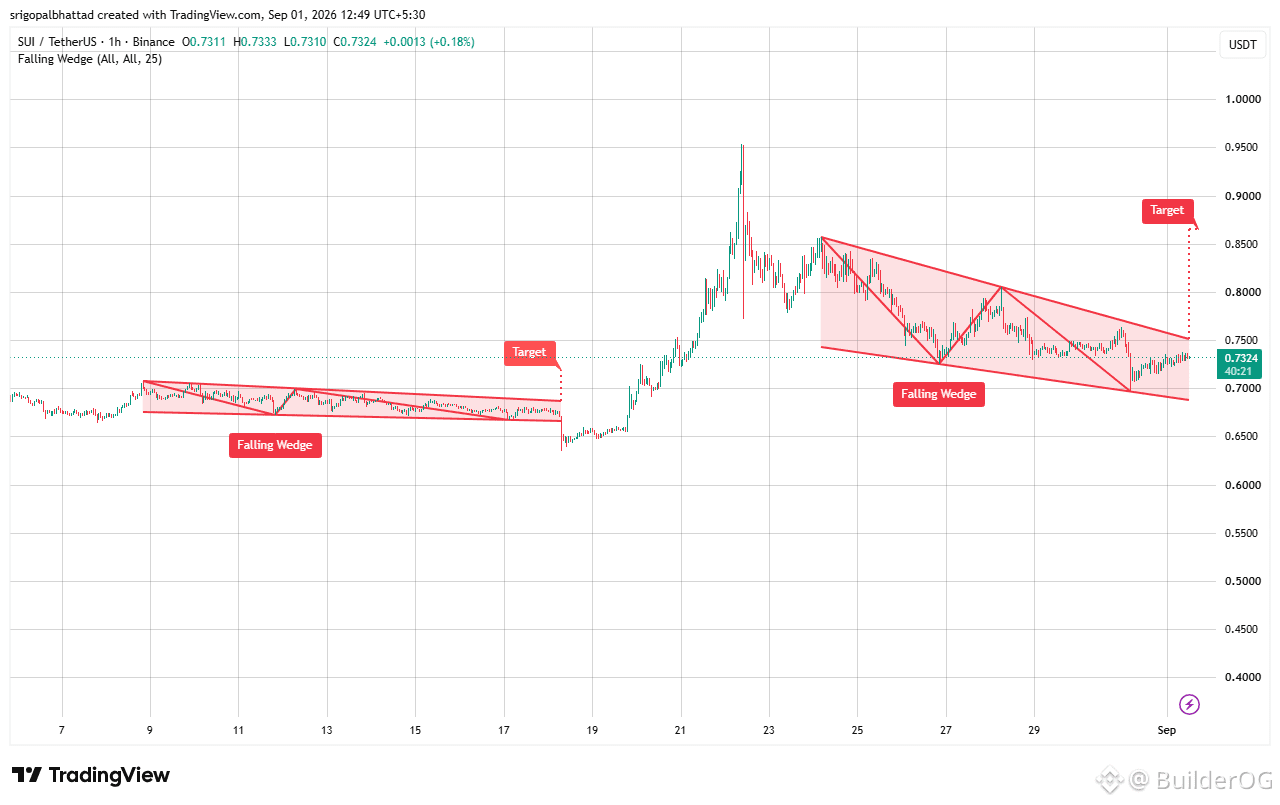
$SUI 正在形成下跌楔形 👀📈 價格在下降趨勢線之間走出收斂形態,同時買家繼續在約 $0.70 的下方支撐位進行防守。 若能幹淨利落地向楔形上方突破,可能引發強勁的動能上漲,目標指向 $0.88 🔥 市場情緒:謹慎看多——多頭正在蓄勢待發。 #SUI #Sui #Crypto
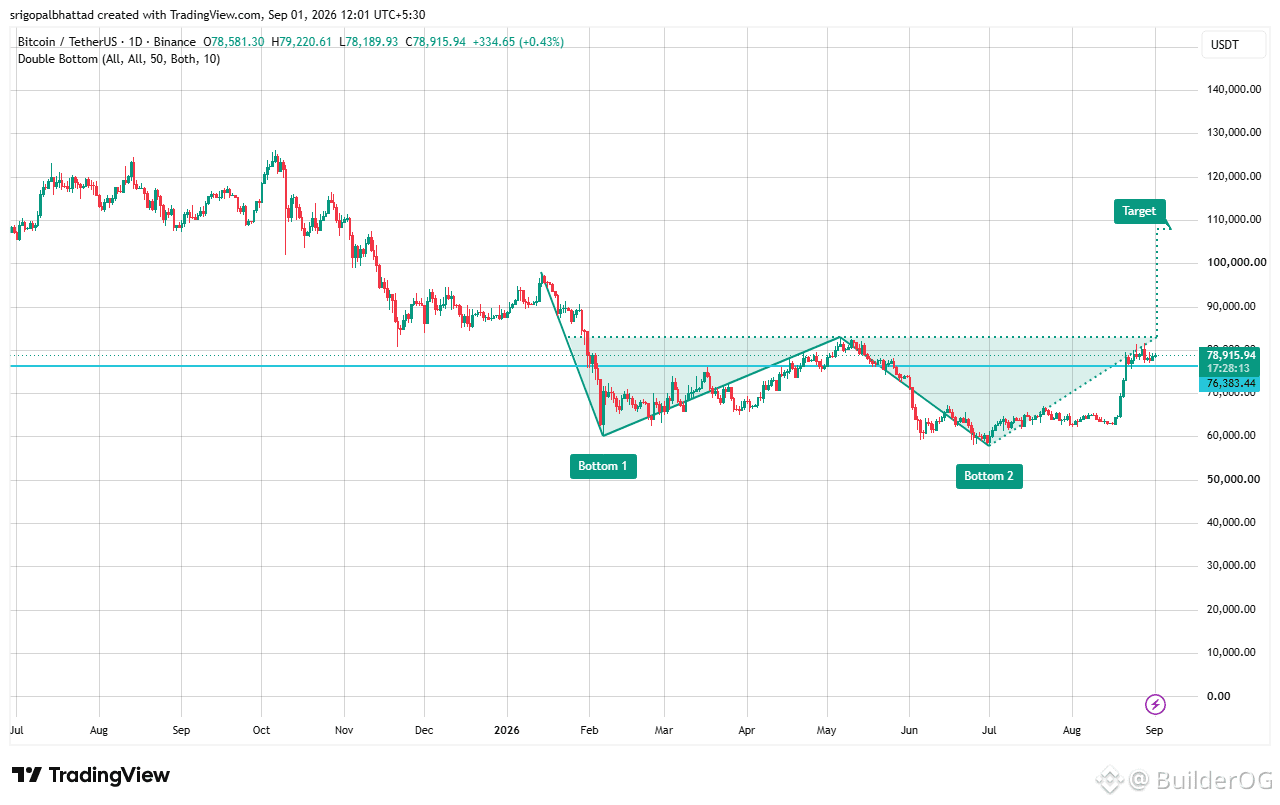
$BTC 正在形成教科書級別的雙底形態 👀📈 買方對 $60K–$62K 的支撐區進行了積極防守,如今價格重新站上頸線阻力位,約在 $83K 附近。 如果能在頸線上方實現乾淨突破,可能觸發一輪重大的擴張行情,目標看向 $110K 🔥 市場情緒:謹慎偏多——多頭正在慢慢奪回控制權。 #Bitcoin #BTC
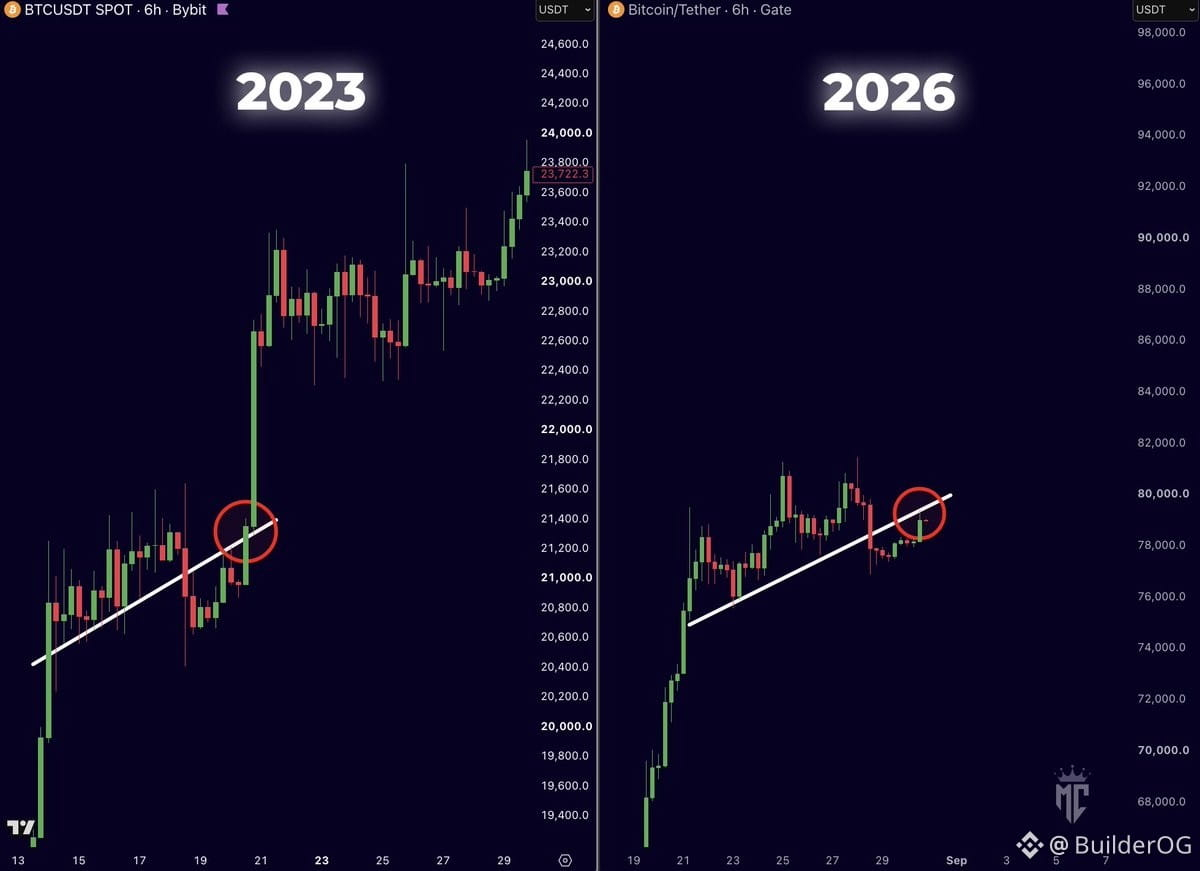
比特幣 $BTC 正顯示出一種熟悉的走勢形態。2023 年,價格曾短暫跌破這條趨勢線,隨後重新站回其上並繼續上行。現在在 2026 年,我們看到的情況非常相似。在這裏重新收復該位置,並伴隨強勁的收盤K線,值得密切關注。
最新:📊 美國現貨 $XRP ETF 上週淨流入 1.1049 億美元,創下 2026 年本週最佳表現。
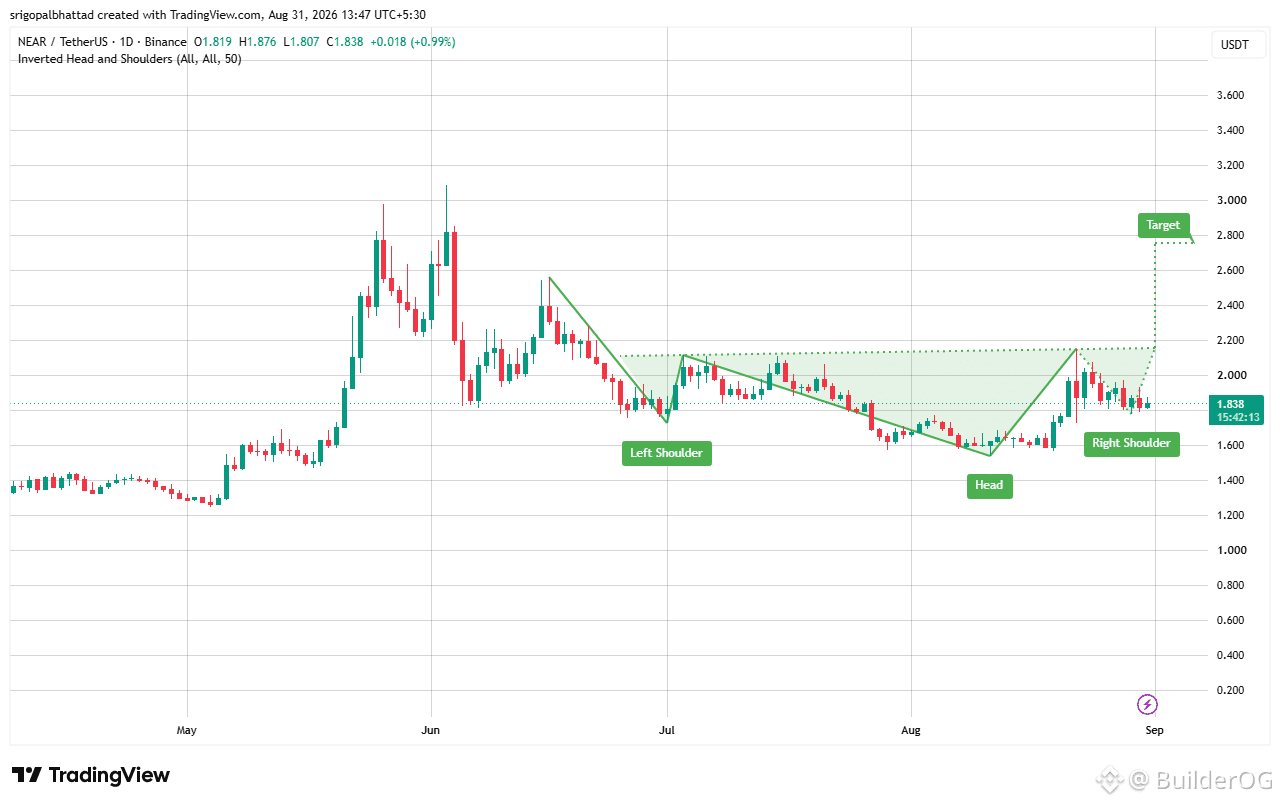
$NEAR (NEAR) 📈 反向頭肩形態正在形成中!🚀 價格目前在約 $1.84,頸線位於約 $2.15 附近。右肩正在守住 $1.60–$1.70 區域之上,從而保持看漲結構。若確認有效突破 $2.15,可能引發更大幅度的上漲。 🎯 目標:約 $2.80 📌 頸線:約 $2.15 🛡️ 關鍵支撐:$1.60–$1.70 留意出現乾淨的突破,並在頸線之上收盤以作確認。 🔥 #NEAR #Crypto

🇺🇸 謠言正在升溫 🇺🇸 有傳言稱,美國參議院已在閉門會談中就《CLARITY法案》達成協議。若屬實,9月對加密貨幣和 $XRP 可能會非常巨大。 👀🔥
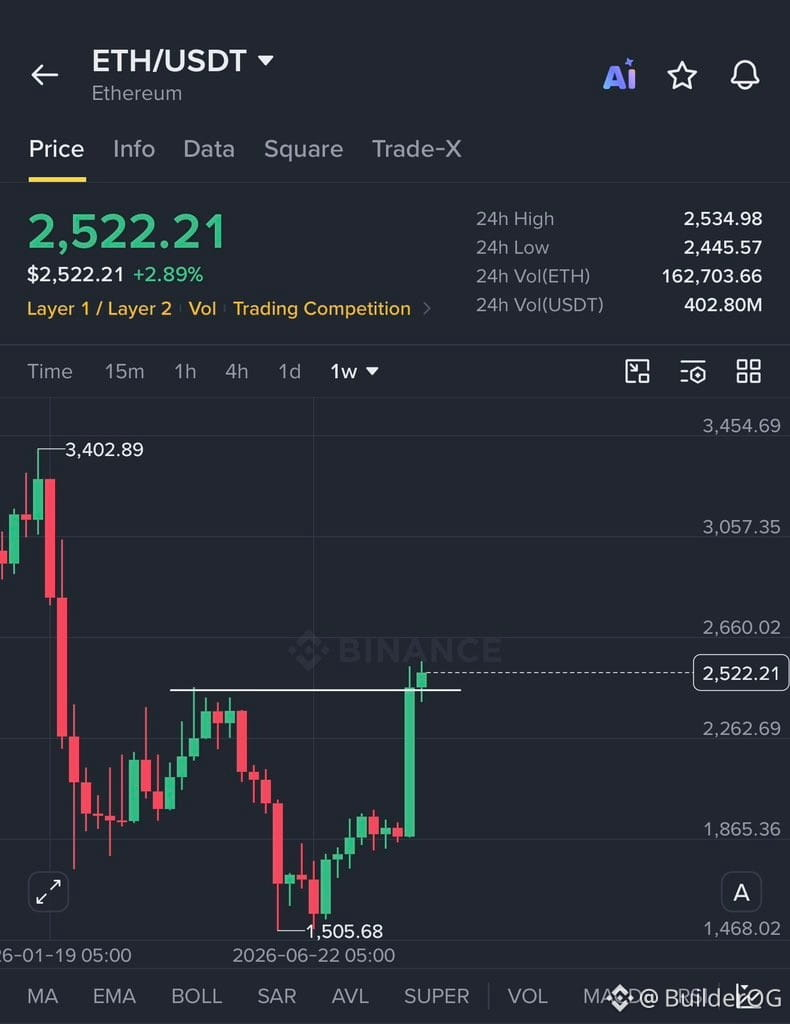
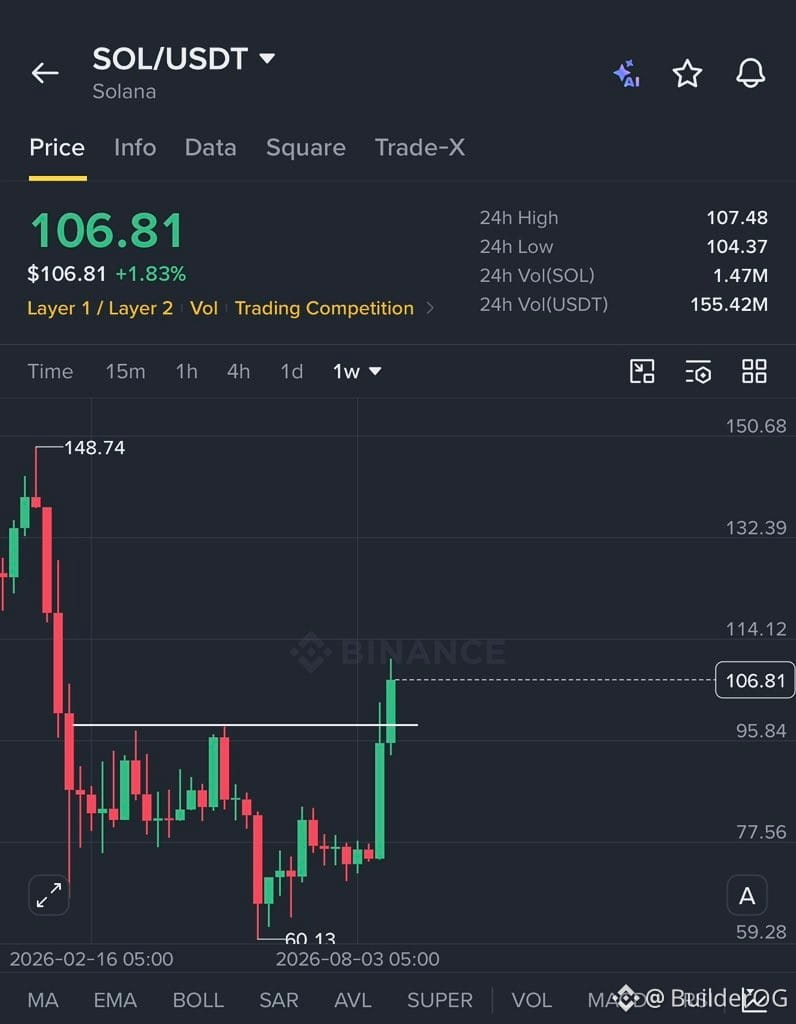
$SOL 和 $ETH 正在出現有趣的每週收盤走勢。 $SOL 試圖在數月都未能突破後,於 $98-$100 區間之上完成收盤;而 $ETH 也幾乎同樣在 $2,465-$2,500 附近運作。 如果兩者都能在這些水位之上收在本週週線,對我來說,這將是非常強烈的信號:近期這波走勢不只是短期的拉抬行情。 SOL 可能會在拋售下探至 $80 之前觸及 $120;同樣地,ETH 也可能在拋售下探至 $1800 之前觸及 $2800。 有一點很明確:底部尚未出現。 我們先看看這些每週K線會收在何處。
🚨 有一個原因:比特幣 $BTC 正在拒絕 $82,000 這個關卡 我早就警告過你,比特幣尚未進入牛市。 這波反彈的行情已經正式結束。 而且比特幣會再次回落到 $57,000。 只有在那之後,真正朝向 $230,000 的行情才會開始。 2022 年,我公開揭露了比特幣的 $17,000 底部。 接著,我又公開揭露了 2025 年的 $126,000 高點。 下一個預測我將會先在這裡發布。 關注並打開通知。
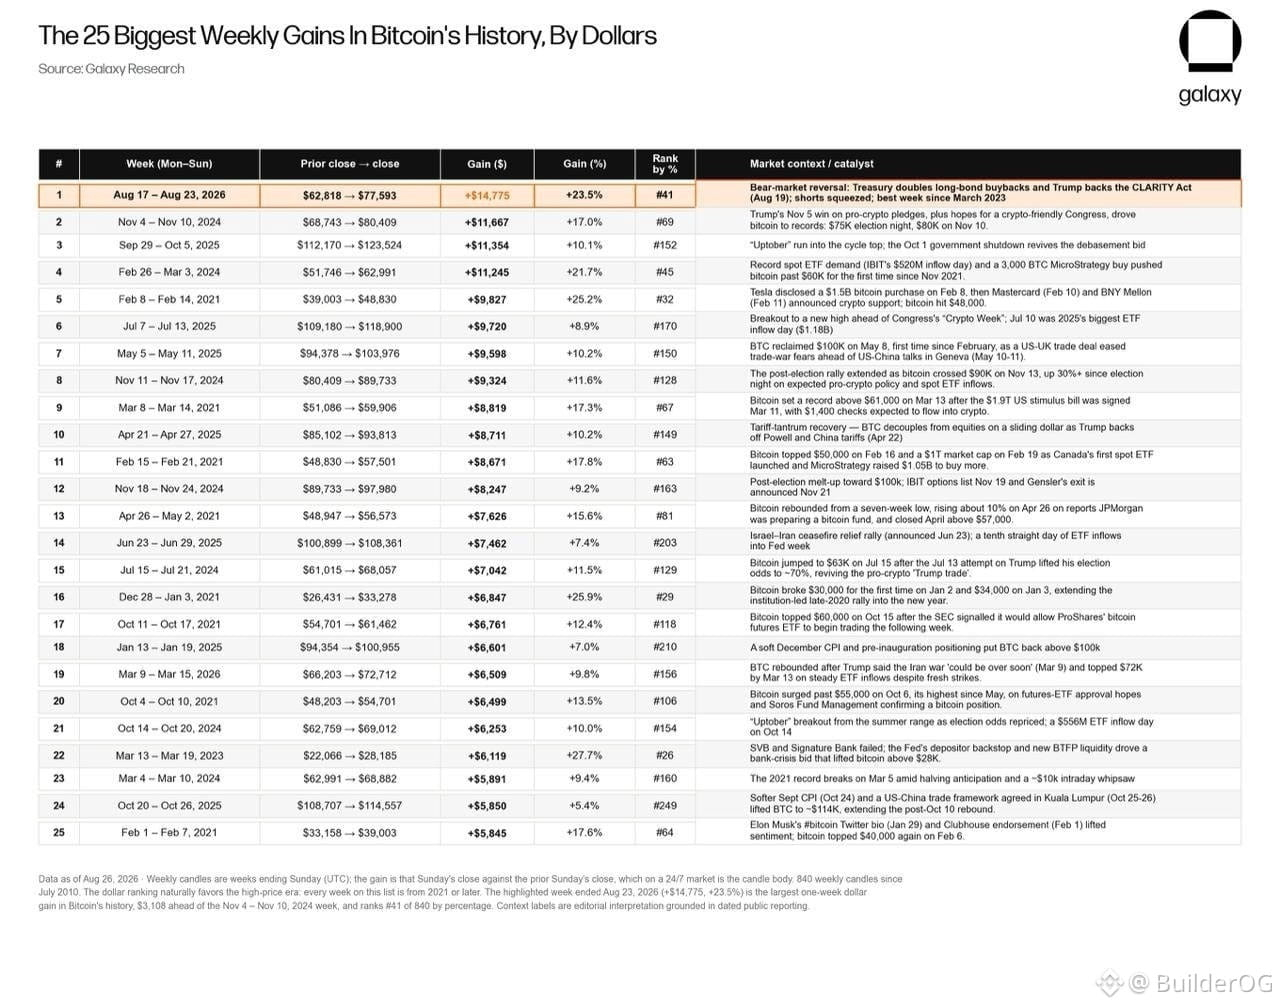
🚨 比特幣 $BTC 剛剛迎來一個史詩級的一週!🔥📈 $BTC 剛剛創下歷史上最大單週美元漲幅。💰 更令人印象深刻的是——根據 Galaxy Research 的說法,它也錄得自 2023 年 3 月以來最大單週百分比漲幅。👀 比特幣多頭回來了,而且勢頭非常強勁。🐂🔥 那接下來呢?…… #Bitcoin #BTC 價格分析#
登入以探索更多內容
加入幣安廣場中的全球加密貨幣用戶
⚡️ 獲取加密貨幣的最新和實用資訊。
💬 受到全球最大加密貨幣交易所的信任。
👍 發掘來自經過驗證創作者的真實見解。
電子郵件 / 電話號碼
網站地圖
Cookie 偏好設定
平台條款