

BitcoinGuide
89 貼文

BitcoinGuide
舉報
封鎖用戶
I've been working as a chart analyst at TradingView for 10 years. You can check "Bitcoin" entry prices, target prices, stop-loss and trading paths in real time daily on a 30-minute candle chart. You'll be the experience a new world. Thank you.
0 關注
2 粉絲
1 點讚數
貼文
全部
影片
·
--
查看翻譯
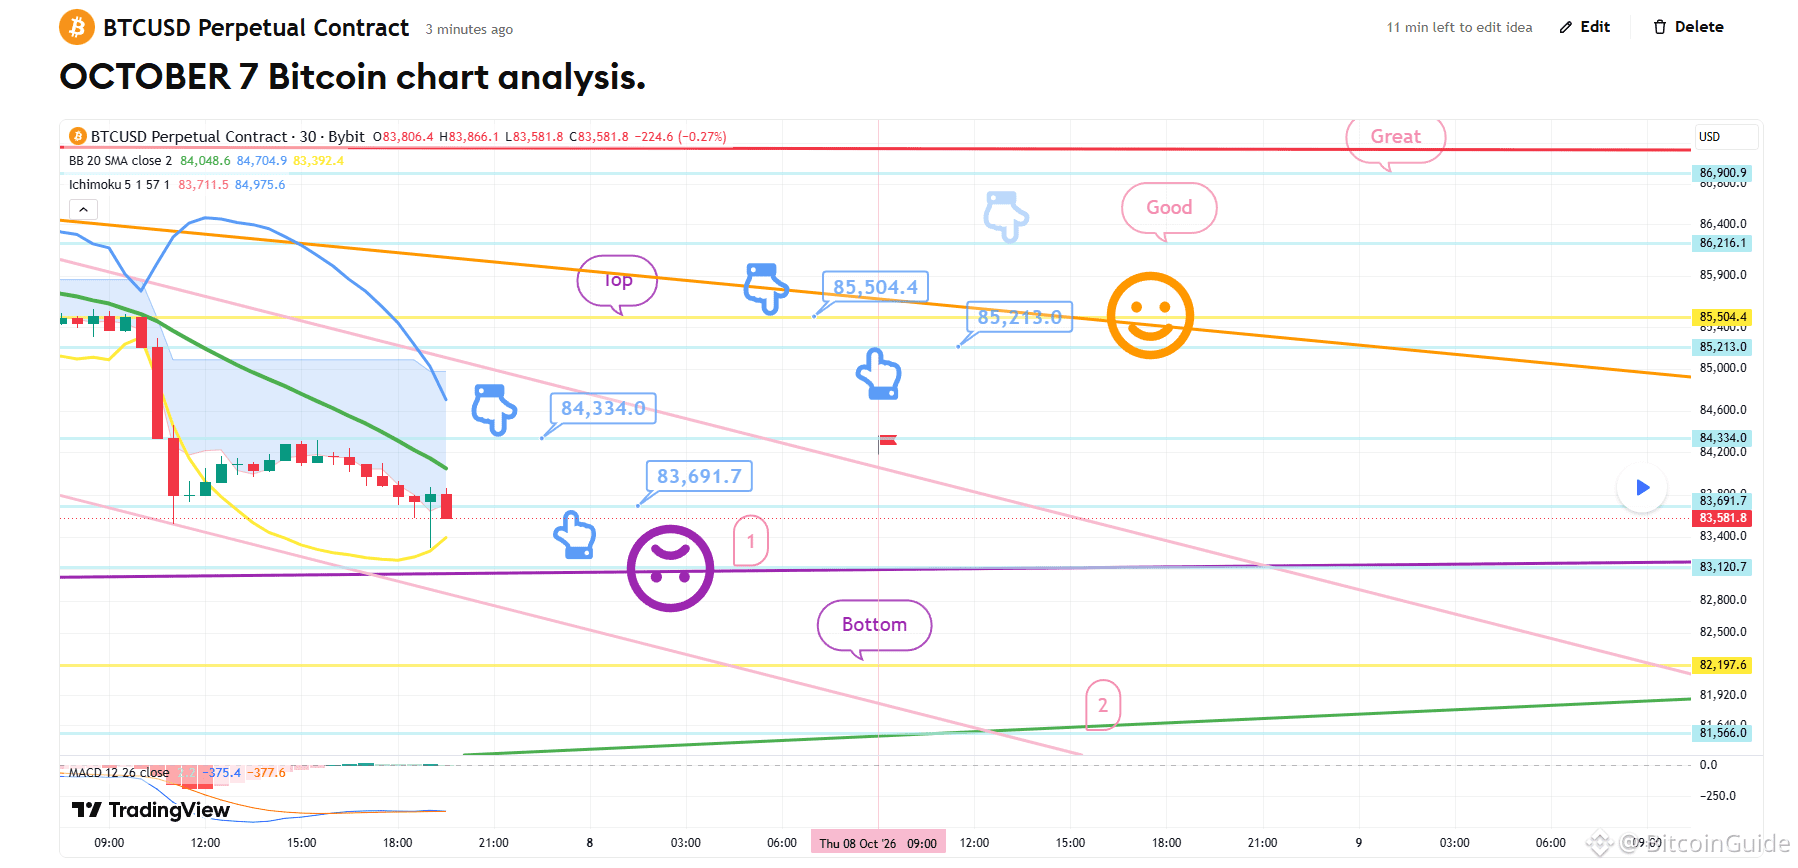
[OCTOBER 7 Bitcoin chart analysis]
BTCUSD 30Min Chart
*My analysis is optimized for TradingView.
If you press the replay button, you can check real-time movements.
-Neutral strategy-
I have formulated a strategy based on today's Nasdaq support zones.
*Scenario following the light blue arrow path:
Short-to-long position switching / Neutral (hedged) strategy
1) Upper zone: Short position entry at $84,334 / Stop-loss if the pink resistance line is broken.
2) Switch to long position at $83,691.7 / Stop-loss if the price drops below the purple support line.
3) Top zone ($85.5K): Long position 1st target -> Subsequent targets in the order of "Good" and "Great."
- If the strategy succeeds, the $85.2K level (indicated by the light blue arrow) serves as a re-entry point for long positions.
4) If the price drops directly without touching the upper short entry zone ($84.3K):
Wait to go long at the lower "Zone 1."
- A crucial point here is:
If the candle falls below the purple support line in Zone 1,
the monthly candle's low will be breached.
This could lead to a prolonged period of sideways movement and a failure to achieve a vertical rally this month;
therefore, maintaining the low without breaking it is of utmost importance.
If the price breaks below the purple support line,
the downside is open toward the "Bottom" zone—extending down to "Zone 2."
I post the analysis results as a Comment every day.
Thank you.
(You can find the link on my profile.)
- Click Follow to receive faster information every day.
- Check the results using the replay button on TradingView.
#Altcoin Season# #BTC Price Analysis# #Crypto# #Gold $USDT $ETH $XRP $BTC
[OCTOBER 7 Bitcoin chart analysis]
BTCUSD 30Min Chart
*My analysis is optimized for TradingView.
If you press the replay button, you can check real-time movements.
-Neutral strategy-
I have formulated a strategy based on today's Nasdaq support zones.
*Scenario following the light blue arrow path:
Short-to-long position switching / Neutral (hedged) strategy
1) Upper zone: Short position entry at $84,334 / Stop-loss if the pink resistance line is broken.
2) Switch to long position at $83,691.7 / Stop-loss if the price drops below the purple support line.
3) Top zone ($85.5K): Long position 1st target -> Subsequent targets in the order of "Good" and "Great."
- If the strategy succeeds, the $85.2K level (indicated by the light blue arrow) serves as a re-entry point for long positions.
4) If the price drops directly without touching the upper short entry zone ($84.3K):
Wait to go long at the lower "Zone 1."
- A crucial point here is:
If the candle falls below the purple support line in Zone 1,
the monthly candle's low will be breached.
This could lead to a prolonged period of sideways movement and a failure to achieve a vertical rally this month;
therefore, maintaining the low without breaking it is of utmost importance.
If the price breaks below the purple support line,
the downside is open toward the "Bottom" zone—extending down to "Zone 2."
I post the analysis results as a Comment every day.
Thank you.
(You can find the link on my profile.)
- Click Follow to receive faster information every day.
- Check the results using the replay button on TradingView.
#Altcoin Season# #BTC Price Analysis# #Crypto# #Gold $USDT $ETH $XRP $BTC
BTCUSD 30Min Chart
*My analysis is optimized for TradingView.
If you press the replay button, you can check real-time movements.
-Neutral strategy-
I have formulated a strategy based on today's Nasdaq support zones.
*Scenario following the light blue arrow path:
Short-to-long position switching / Neutral (hedged) strategy
1) Upper zone: Short position entry at $84,334 / Stop-loss if the pink resistance line is broken.
2) Switch to long position at $83,691.7 / Stop-loss if the price drops below the purple support line.
3) Top zone ($85.5K): Long position 1st target -> Subsequent targets in the order of "Good" and "Great."
- If the strategy succeeds, the $85.2K level (indicated by the light blue arrow) serves as a re-entry point for long positions.
4) If the price drops directly without touching the upper short entry zone ($84.3K):
Wait to go long at the lower "Zone 1."
- A crucial point here is:
If the candle falls below the purple support line in Zone 1,
the monthly candle's low will be breached.
This could lead to a prolonged period of sideways movement and a failure to achieve a vertical rally this month;
therefore, maintaining the low without breaking it is of utmost importance.
If the price breaks below the purple support line,
the downside is open toward the "Bottom" zone—extending down to "Zone 2."
I post the analysis results as a Comment every day.
Thank you.
(You can find the link on my profile.)
- Click Follow to receive faster information every day.
- Check the results using the replay button on TradingView.
#Altcoin Season# #BTC Price Analysis# #Crypto# #Gold $USDT $ETH $XRP $BTC
75
·
--
查看翻譯
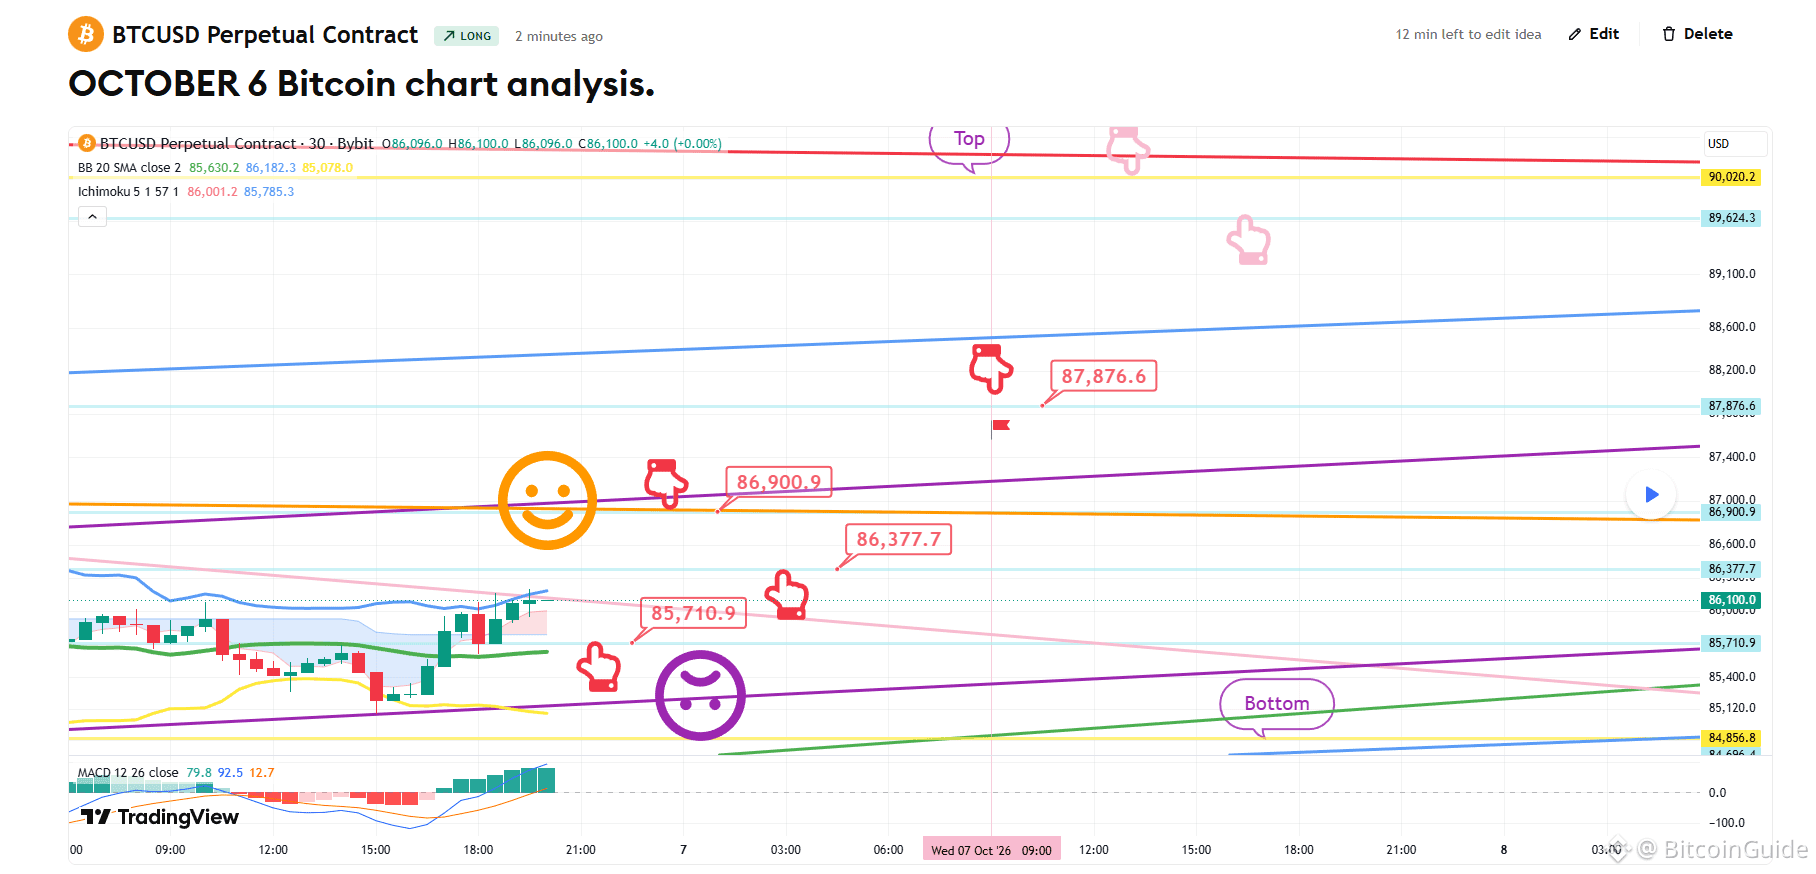
[OCTOBER 6 Bitcoin chart analysis]
BTCUSD 30Min Chart
*My analysis is optimized for TradingView.
If you press the replay button, you can check real-time movements.
This is the Bitcoin 30-minute chart.
The current price level coincides with a MACD "death cross" on the 6-hour and 12-hour charts,
meaning the market could see either an upward move or a correction.
I have decided to disregard the warning signal and formulate a long position strategy.
*Scenario following the red arrow path
Long position strategy
1) Entry zone: $85,710.9 / Stop-loss: If the price breaks below the purple support line
2) Targets: 1st target at $86,900.9 -> followed by $87.8K and the "Top" zone
If the strategy succeeds, the $86.3K level can be used for re-entering a long position.
I have also provided a simulation based on the pink arrow path, depending on tomorrow's movements.
If the price breaks below the purple support line:
The downside is open all the way to the "Bottom" level.
If the price drops to this zone:
Please be aware that the MACD death cross on the 6-hour and 12-hour charts will be in effect.
Please treat this analysis merely as a reference for your own trading.
I post the analysis results as a Comment every day.
Thank you.
(You can find the link on my profile.)
- Click Follow to receive faster information every day.
- Check the results using the replay button on TradingView.
#BTC Price Analysis# #BTC100K #Crypto# #Altcoin Season# $BTC $ETH $USDT $XRP
[OCTOBER 6 Bitcoin chart analysis]
BTCUSD 30Min Chart
*My analysis is optimized for TradingView.
If you press the replay button, you can check real-time movements.
This is the Bitcoin 30-minute chart.
The current price level coincides with a MACD "death cross" on the 6-hour and 12-hour charts,
meaning the market could see either an upward move or a correction.
I have decided to disregard the warning signal and formulate a long position strategy.
*Scenario following the red arrow path
Long position strategy
1) Entry zone: $85,710.9 / Stop-loss: If the price breaks below the purple support line
2) Targets: 1st target at $86,900.9 -> followed by $87.8K and the "Top" zone
If the strategy succeeds, the $86.3K level can be used for re-entering a long position.
I have also provided a simulation based on the pink arrow path, depending on tomorrow's movements.
If the price breaks below the purple support line:
The downside is open all the way to the "Bottom" level.
If the price drops to this zone:
Please be aware that the MACD death cross on the 6-hour and 12-hour charts will be in effect.
Please treat this analysis merely as a reference for your own trading.
I post the analysis results as a Comment every day.
Thank you.
(You can find the link on my profile.)
- Click Follow to receive faster information every day.
- Check the results using the replay button on TradingView.
#BTC Price Analysis# #BTC100K #Crypto# #Altcoin Season# $BTC $ETH $USDT $XRP
BTCUSD 30Min Chart
*My analysis is optimized for TradingView.
If you press the replay button, you can check real-time movements.
This is the Bitcoin 30-minute chart.
The current price level coincides with a MACD "death cross" on the 6-hour and 12-hour charts,
meaning the market could see either an upward move or a correction.
I have decided to disregard the warning signal and formulate a long position strategy.
*Scenario following the red arrow path
Long position strategy
1) Entry zone: $85,710.9 / Stop-loss: If the price breaks below the purple support line
2) Targets: 1st target at $86,900.9 -> followed by $87.8K and the "Top" zone
If the strategy succeeds, the $86.3K level can be used for re-entering a long position.
I have also provided a simulation based on the pink arrow path, depending on tomorrow's movements.
If the price breaks below the purple support line:
The downside is open all the way to the "Bottom" level.
If the price drops to this zone:
Please be aware that the MACD death cross on the 6-hour and 12-hour charts will be in effect.
Please treat this analysis merely as a reference for your own trading.
I post the analysis results as a Comment every day.
Thank you.
(You can find the link on my profile.)
- Click Follow to receive faster information every day.
- Check the results using the replay button on TradingView.
#BTC Price Analysis# #BTC100K #Crypto# #Altcoin Season# $BTC $ETH $USDT $XRP
59
·
--
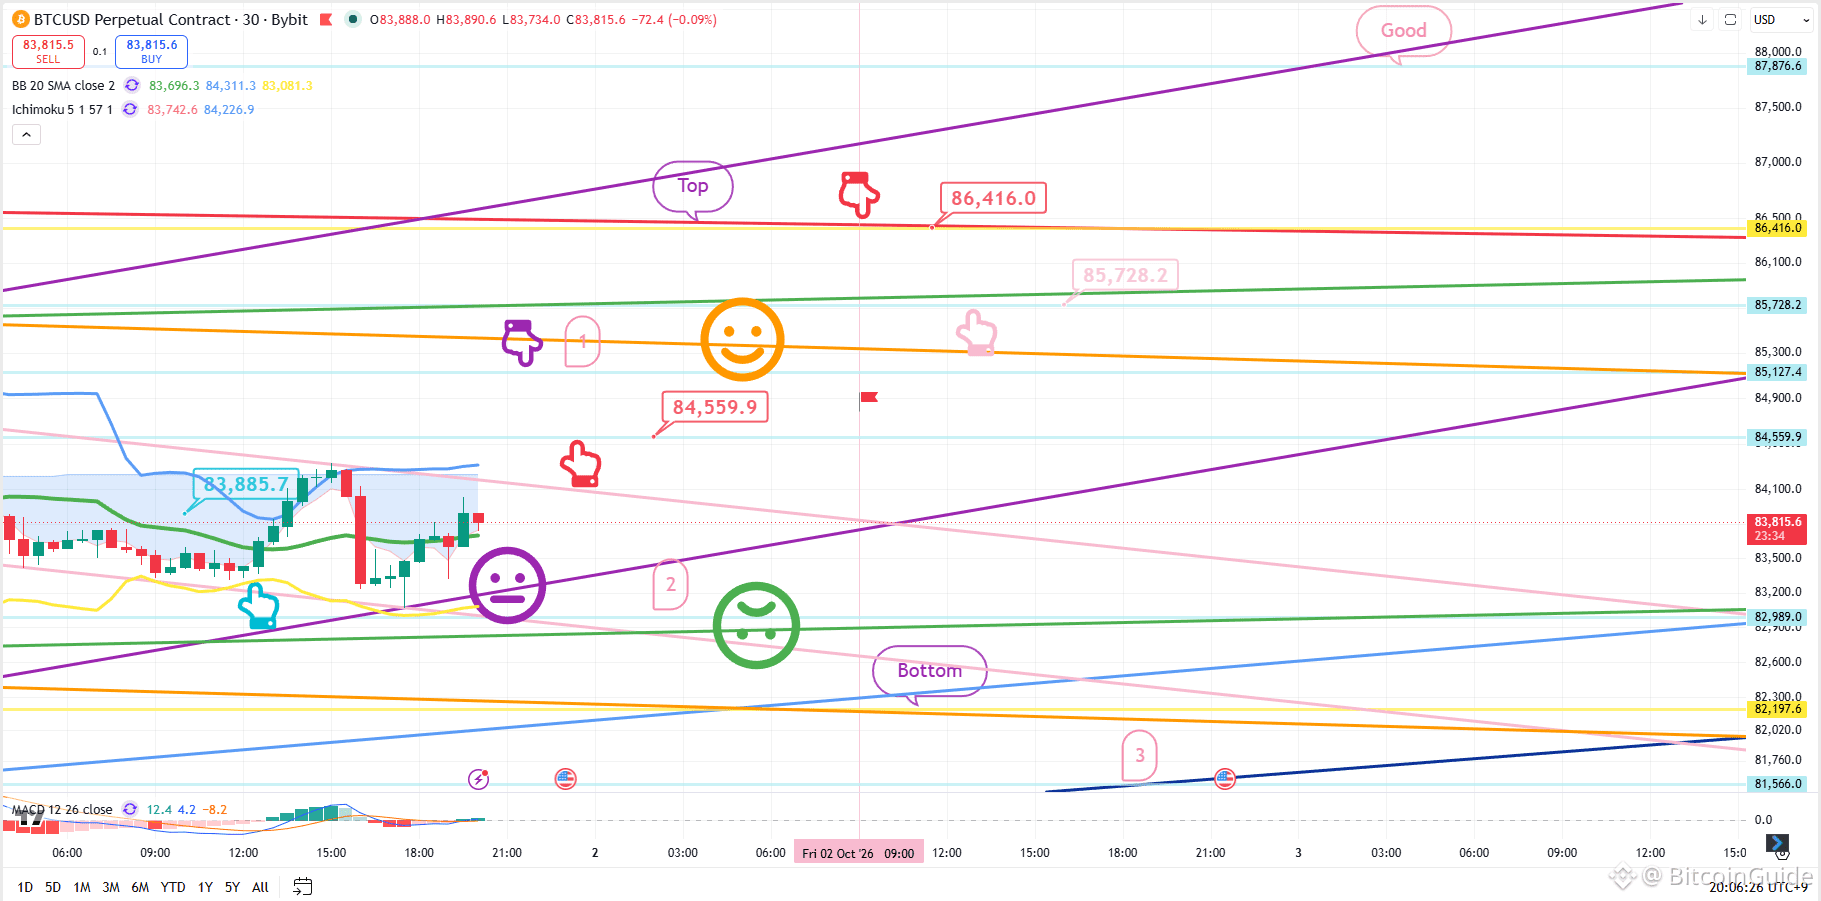
[10月1日 比特幣走勢分析]
BTCUSD 30分鐘圖表
*我的分析已針對 TradingView 進行最佳化。
如果你按下重播按鈕,你可以查看即時走勢。
-多單策略-
在左下角,由淺藍色手指所指示的位置,我已維持昨日建立的、以 83,885.7 美元作為多單進場點的策略。
那斯達克的經濟數據預計在 11:00 發布。
*根據在頂部「紫色手指 1」區域觸碰來進行多單策略:
1) 確認觸碰「紫色手指 1」後:
多單進場在紅色手指標記(84,559.9 美元)/ 若紫色支撐線被跌破則止損。
2) 頂部區域(86,416 美元)作為多單的第一目標 -> 第二目標的「Good」級別。
若策略成功,可使用 85.7K 美元這個水位作為再度進場多單的依據。
3) 若價格在未觸及區域 1 的情況下下跌:
多單進場在區域 2(82,989 美元)/ 若綠色支撐線被跌破則止損。
對於持有昨日 83.8K 美元多單的人,
建議同樣採用以綠色支撐線為依據的止損水位。
一旦綠色支撐線被跌破,
價格可能會朝下方標示的「Bottom」區域下探——可能下到區域 3,
所以請務必小心。
儘管昨天的月線收在較低的位置,
但它觸及了布林帶的中軌;
因此,只要它在不跌破紫色支撐線的前提下守住,
上升趨勢仍可能繼續。
我每天會以評論的方式發布分析結果。
謝謝。
(你可以在我的個人資料中找到連結。)
- 按下「追蹤」,即可每天更快收到資訊。
- 在 TradingView 上使用重播按鈕查看結果。
#BTC100K #Altcoin Season# #Crypto #BTC Price Analysis# $ETH $XRP $USDT $BTC
[10月1日 比特幣走勢分析]
BTCUSD 30分鐘圖表
*我的分析已針對 TradingView 進行最佳化。
如果你按下重播按鈕,你可以查看即時走勢。
-多單策略-
在左下角,由淺藍色手指所指示的位置,我已維持昨日建立的、以 83,885.7 美元作為多單進場點的策略。
那斯達克的經濟數據預計在 11:00 發布。
*根據在頂部「紫色手指 1」區域觸碰來進行多單策略:
1) 確認觸碰「紫色手指 1」後:
多單進場在紅色手指標記(84,559.9 美元)/ 若紫色支撐線被跌破則止損。
2) 頂部區域(86,416 美元)作為多單的第一目標 -> 第二目標的「Good」級別。
若策略成功,可使用 85.7K 美元這個水位作為再度進場多單的依據。
3) 若價格在未觸及區域 1 的情況下下跌:
多單進場在區域 2(82,989 美元)/ 若綠色支撐線被跌破則止損。
對於持有昨日 83.8K 美元多單的人,
建議同樣採用以綠色支撐線為依據的止損水位。
一旦綠色支撐線被跌破,
價格可能會朝下方標示的「Bottom」區域下探——可能下到區域 3,
所以請務必小心。
儘管昨天的月線收在較低的位置,
但它觸及了布林帶的中軌;
因此,只要它在不跌破紫色支撐線的前提下守住,
上升趨勢仍可能繼續。
我每天會以評論的方式發布分析結果。
謝謝。
(你可以在我的個人資料中找到連結。)
- 按下「追蹤」,即可每天更快收到資訊。
- 在 TradingView 上使用重播按鈕查看結果。
#BTC100K #Altcoin Season# #Crypto #BTC Price Analysis# $ETH $XRP $USDT $BTC
BTCUSD 30分鐘圖表
*我的分析已針對 TradingView 進行最佳化。
如果你按下重播按鈕,你可以查看即時走勢。
-多單策略-
在左下角,由淺藍色手指所指示的位置,我已維持昨日建立的、以 83,885.7 美元作為多單進場點的策略。
那斯達克的經濟數據預計在 11:00 發布。
*根據在頂部「紫色手指 1」區域觸碰來進行多單策略:
1) 確認觸碰「紫色手指 1」後:
多單進場在紅色手指標記(84,559.9 美元)/ 若紫色支撐線被跌破則止損。
2) 頂部區域(86,416 美元)作為多單的第一目標 -> 第二目標的「Good」級別。
若策略成功,可使用 85.7K 美元這個水位作為再度進場多單的依據。
3) 若價格在未觸及區域 1 的情況下下跌:
多單進場在區域 2(82,989 美元)/ 若綠色支撐線被跌破則止損。
對於持有昨日 83.8K 美元多單的人,
建議同樣採用以綠色支撐線為依據的止損水位。
一旦綠色支撐線被跌破,
價格可能會朝下方標示的「Bottom」區域下探——可能下到區域 3,
所以請務必小心。
儘管昨天的月線收在較低的位置,
但它觸及了布林帶的中軌;
因此,只要它在不跌破紫色支撐線的前提下守住,
上升趨勢仍可能繼續。
我每天會以評論的方式發布分析結果。
謝謝。
(你可以在我的個人資料中找到連結。)
- 按下「追蹤」,即可每天更快收到資訊。
- 在 TradingView 上使用重播按鈕查看結果。
#BTC100K #Altcoin Season# #Crypto #BTC Price Analysis# $ETH $XRP $USDT $BTC
76
·
--
查看翻譯
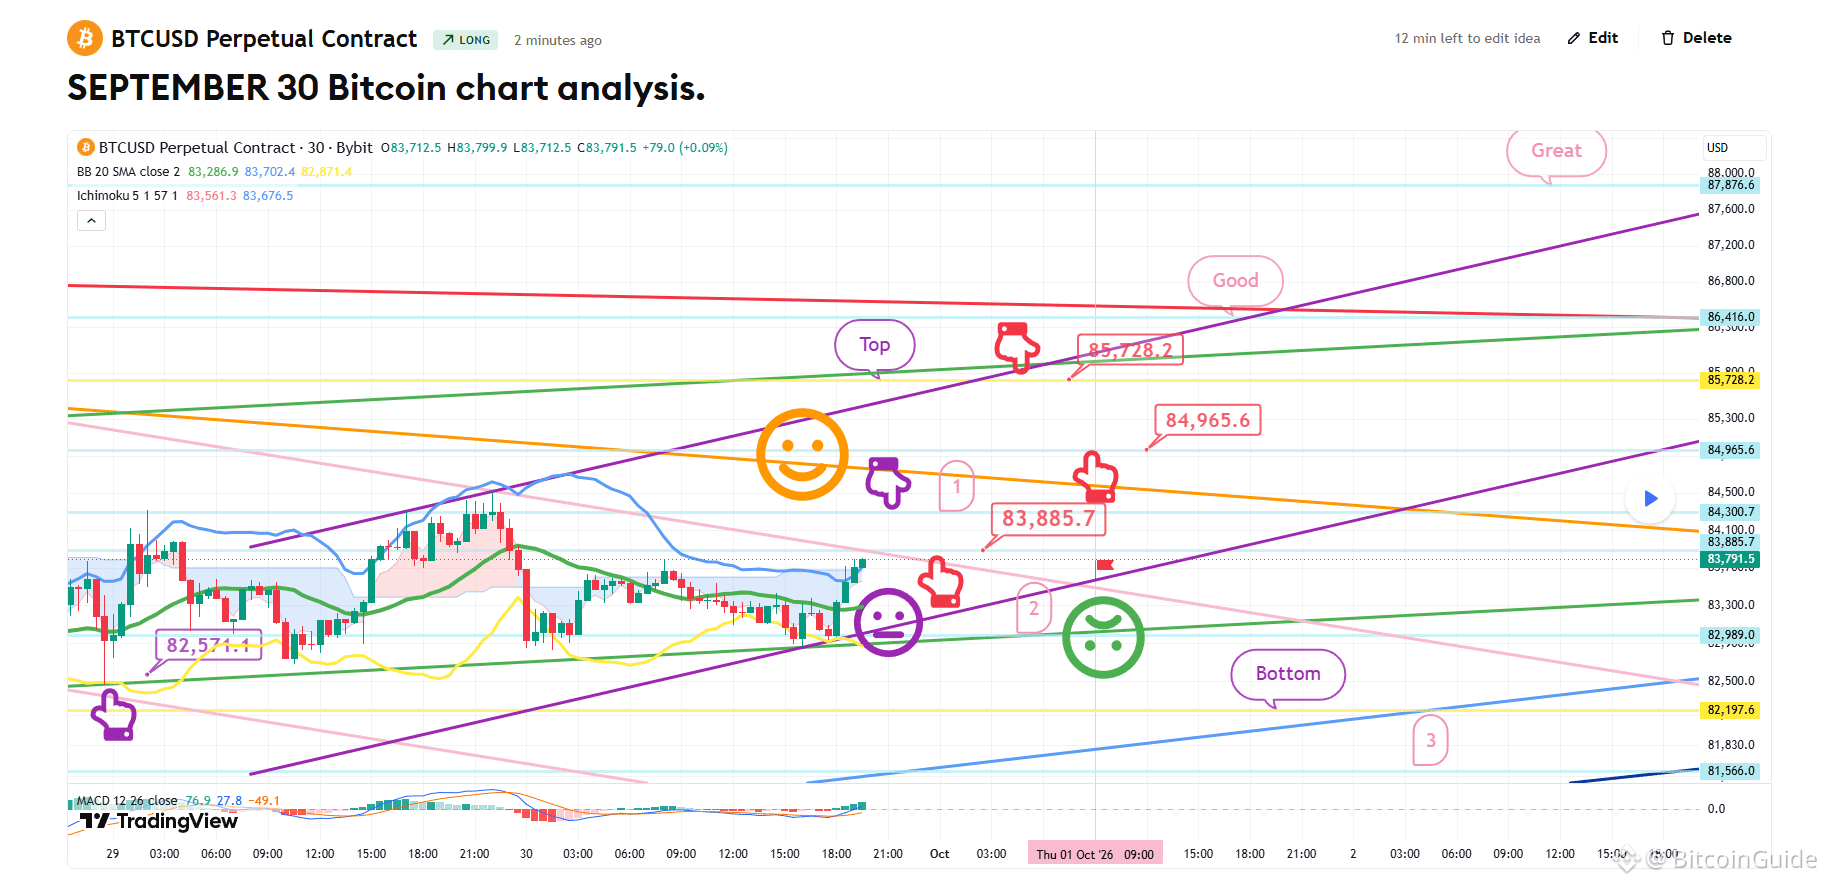
[September 30 Bitcoin chart analysis]
BTCUSD 30Min Chart
*My analysis is optimized for TradingView.
If you press the replay button, you can check real-time movements.
-Long position strategy-
At the bottom left, indicated by a purple finger,
I have maintained the strategy for the long position entered on the 28th at $82,571.1.
*Long position strategy regarding the touch of the area marked by purple finger 1 at the top:
1) After confirming a touch on the area marked by purple finger 1 at the top,
look for a long entry at the level marked by the red finger ($83,885.7)
/ Stop-loss if the green support line is breached.
2) Top target area: $85,728.2 (1st target) -> Targets follow the sequence of "Good" then "Great."
If the strategy succeeds, the 84.9K level serves as a zone for re-entering a long position.
3) If the price drops without touching the area marked by purple finger 1,
wait for a long entry at the bottom area marked 1 / Stop-loss if the green support line is breached.
The same stop-loss level applies to those currently holding the 82.5K long position.
- Although the probability is very low before the new monthly candle forms tomorrow,
if the "Great" target is touched, a strong upward trend could continue.
This would increase the likelihood of hitting a new all-time high by the end of the year.
- If the price holds without breaking below the purple parallel lines,
there is a possibility of a vertical or strong upward surge.
- If the green support line is breached,
be aware that the price could drop toward the "Bottom" area—potentially down to the 3rd zone.
I post the analysis results as a Comment every day.
Thank you.
(You can find the link on my profile.)
- Click Follow to receive faster information every day.
- Check the results using the replay button on TradingView.
#BTC100K #BTC Price Analysis# #Altcoin Season# #Crypto #Trading $ETH $XRP $USDT $BTC
[September 30 Bitcoin chart analysis]
BTCUSD 30Min Chart
*My analysis is optimized for TradingView.
If you press the replay button, you can check real-time movements.
-Long position strategy-
At the bottom left, indicated by a purple finger,
I have maintained the strategy for the long position entered on the 28th at $82,571.1.
*Long position strategy regarding the touch of the area marked by purple finger 1 at the top:
1) After confirming a touch on the area marked by purple finger 1 at the top,
look for a long entry at the level marked by the red finger ($83,885.7)
/ Stop-loss if the green support line is breached.
2) Top target area: $85,728.2 (1st target) -> Targets follow the sequence of "Good" then "Great."
If the strategy succeeds, the 84.9K level serves as a zone for re-entering a long position.
3) If the price drops without touching the area marked by purple finger 1,
wait for a long entry at the bottom area marked 1 / Stop-loss if the green support line is breached.
The same stop-loss level applies to those currently holding the 82.5K long position.
- Although the probability is very low before the new monthly candle forms tomorrow,
if the "Great" target is touched, a strong upward trend could continue.
This would increase the likelihood of hitting a new all-time high by the end of the year.
- If the price holds without breaking below the purple parallel lines,
there is a possibility of a vertical or strong upward surge.
- If the green support line is breached,
be aware that the price could drop toward the "Bottom" area—potentially down to the 3rd zone.
I post the analysis results as a Comment every day.
Thank you.
(You can find the link on my profile.)
- Click Follow to receive faster information every day.
- Check the results using the replay button on TradingView.
#BTC100K #BTC Price Analysis# #Altcoin Season# #Crypto #Trading $ETH $XRP $USDT $BTC
BTCUSD 30Min Chart
*My analysis is optimized for TradingView.
If you press the replay button, you can check real-time movements.
-Long position strategy-
At the bottom left, indicated by a purple finger,
I have maintained the strategy for the long position entered on the 28th at $82,571.1.
*Long position strategy regarding the touch of the area marked by purple finger 1 at the top:
1) After confirming a touch on the area marked by purple finger 1 at the top,
look for a long entry at the level marked by the red finger ($83,885.7)
/ Stop-loss if the green support line is breached.
2) Top target area: $85,728.2 (1st target) -> Targets follow the sequence of "Good" then "Great."
If the strategy succeeds, the 84.9K level serves as a zone for re-entering a long position.
3) If the price drops without touching the area marked by purple finger 1,
wait for a long entry at the bottom area marked 1 / Stop-loss if the green support line is breached.
The same stop-loss level applies to those currently holding the 82.5K long position.
- Although the probability is very low before the new monthly candle forms tomorrow,
if the "Great" target is touched, a strong upward trend could continue.
This would increase the likelihood of hitting a new all-time high by the end of the year.
- If the price holds without breaking below the purple parallel lines,
there is a possibility of a vertical or strong upward surge.
- If the green support line is breached,
be aware that the price could drop toward the "Bottom" area—potentially down to the 3rd zone.
I post the analysis results as a Comment every day.
Thank you.
(You can find the link on my profile.)
- Click Follow to receive faster information every day.
- Check the results using the replay button on TradingView.
#BTC100K #BTC Price Analysis# #Altcoin Season# #Crypto #Trading $ETH $XRP $USDT $BTC
61
·
--
查看翻譯
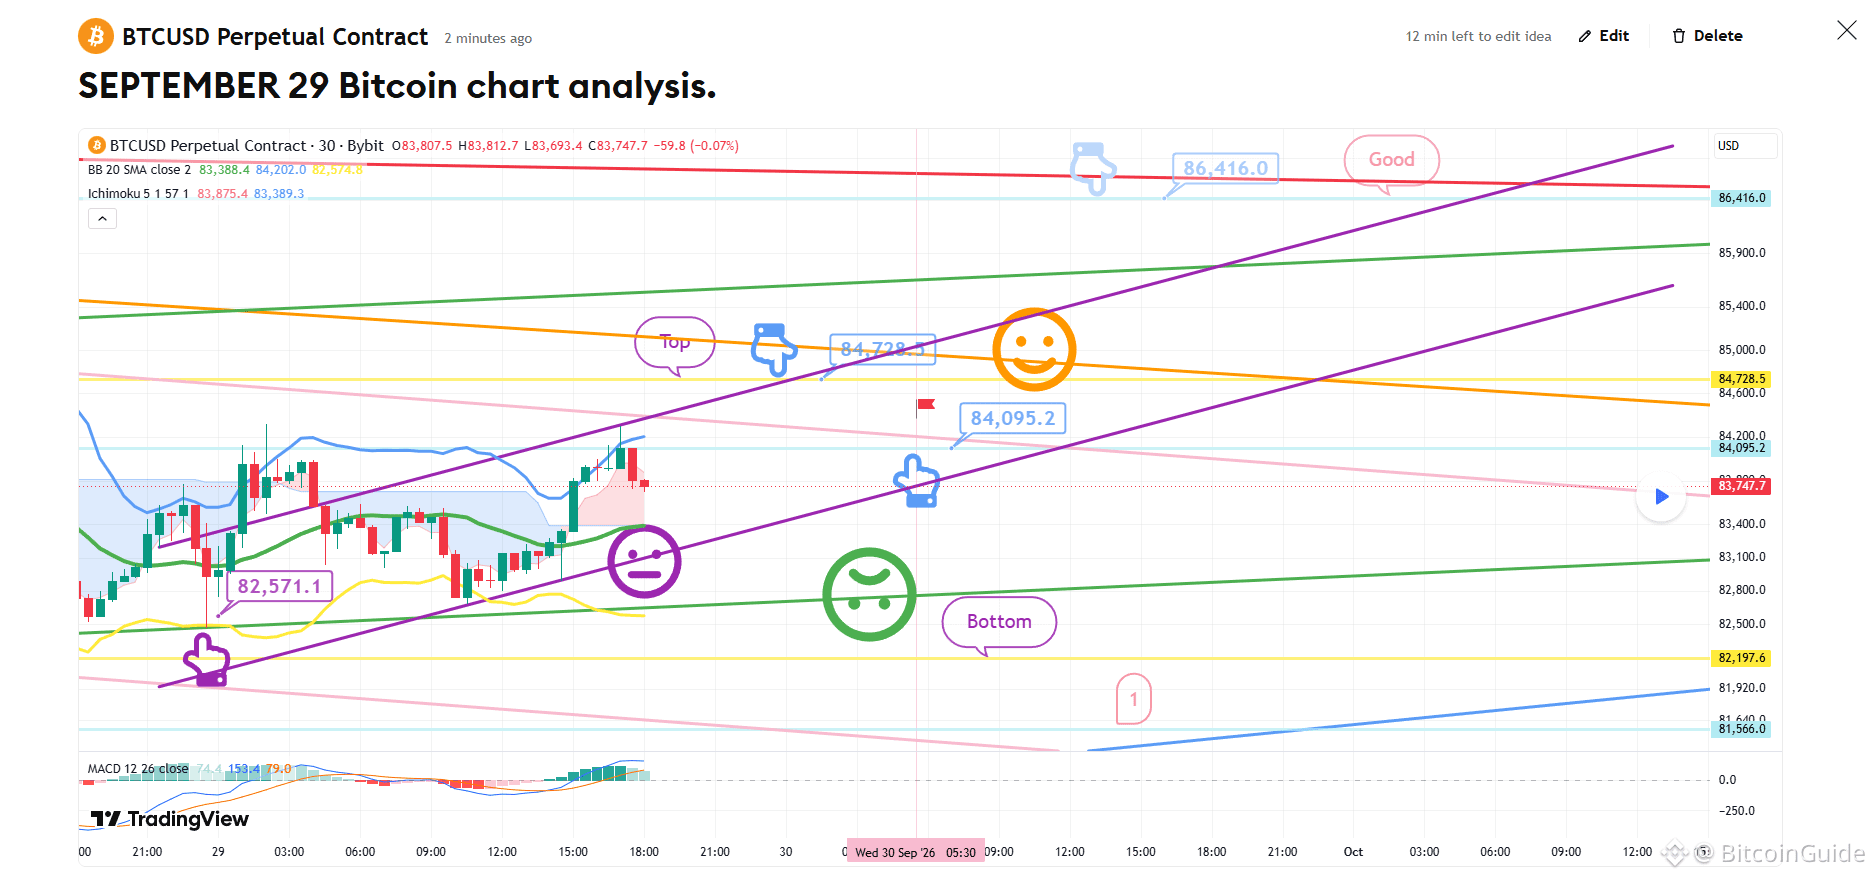
[September 29 Bitcoin chart analysis]
BTCUSD 30Min Chart
*My analysis is optimized for TradingView.
If you press the replay button, you can check real-time movements.
- Neutral strategy-
This is the 30-minute Bitcoin chart.
At the bottom left, indicated by a purple finger,
I have maintained the strategy for the long position entered on the 28th at $82,571.1.
*If the price follows the path of the light blue finger:
A two-way neutral strategy
1) Top zone (light blue finger):
Short position entry at $84,728.5 / Stop-loss if the orange resistance line is broken.
2) Re-entry zone for long position at $84,095.2 / Stop-loss if the purple support line is broken.
3) Final target zone (post-tomorrow): $86,416
/ Watch for a confirmed MACD "death cross" on the daily chart.
4) If the purple support line is broken,
there is a possibility of sideways movement or further decline.
For those currently holding positions above $82.5K,
it is advisable to set a stop-loss based on a break of the final green support line.
If the green support line is broken,
the price could drop to the "Bottom" zone marked at the lower end (down to Zone 1),
so please exercise caution.
As there is currently a strong correlation ("forced coupling") with the Nasdaq,
please keep a close eye on Nasdaq movements.
I post the analysis results as a Comment every day.
Thank you.
(You can find the link on my profile.)
- Click Follow to receive faster information every day.
- Check the results using the replay button on TradingView.
#BTC Price Analysis# #Crypto #Gold #Altcoin Season# $XRP $USDC $USDT $BTC
[September 29 Bitcoin chart analysis]
BTCUSD 30Min Chart
*My analysis is optimized for TradingView.
If you press the replay button, you can check real-time movements.
- Neutral strategy-
This is the 30-minute Bitcoin chart.
At the bottom left, indicated by a purple finger,
I have maintained the strategy for the long position entered on the 28th at $82,571.1.
*If the price follows the path of the light blue finger:
A two-way neutral strategy
1) Top zone (light blue finger):
Short position entry at $84,728.5 / Stop-loss if the orange resistance line is broken.
2) Re-entry zone for long position at $84,095.2 / Stop-loss if the purple support line is broken.
3) Final target zone (post-tomorrow): $86,416
/ Watch for a confirmed MACD "death cross" on the daily chart.
4) If the purple support line is broken,
there is a possibility of sideways movement or further decline.
For those currently holding positions above $82.5K,
it is advisable to set a stop-loss based on a break of the final green support line.
If the green support line is broken,
the price could drop to the "Bottom" zone marked at the lower end (down to Zone 1),
so please exercise caution.
As there is currently a strong correlation ("forced coupling") with the Nasdaq,
please keep a close eye on Nasdaq movements.
I post the analysis results as a Comment every day.
Thank you.
(You can find the link on my profile.)
- Click Follow to receive faster information every day.
- Check the results using the replay button on TradingView.
#BTC Price Analysis# #Crypto #Gold #Altcoin Season# $XRP $USDC $USDT $BTC
BTCUSD 30Min Chart
*My analysis is optimized for TradingView.
If you press the replay button, you can check real-time movements.
- Neutral strategy-
This is the 30-minute Bitcoin chart.
At the bottom left, indicated by a purple finger,
I have maintained the strategy for the long position entered on the 28th at $82,571.1.
*If the price follows the path of the light blue finger:
A two-way neutral strategy
1) Top zone (light blue finger):
Short position entry at $84,728.5 / Stop-loss if the orange resistance line is broken.
2) Re-entry zone for long position at $84,095.2 / Stop-loss if the purple support line is broken.
3) Final target zone (post-tomorrow): $86,416
/ Watch for a confirmed MACD "death cross" on the daily chart.
4) If the purple support line is broken,
there is a possibility of sideways movement or further decline.
For those currently holding positions above $82.5K,
it is advisable to set a stop-loss based on a break of the final green support line.
If the green support line is broken,
the price could drop to the "Bottom" zone marked at the lower end (down to Zone 1),
so please exercise caution.
As there is currently a strong correlation ("forced coupling") with the Nasdaq,
please keep a close eye on Nasdaq movements.
I post the analysis results as a Comment every day.
Thank you.
(You can find the link on my profile.)
- Click Follow to receive faster information every day.
- Check the results using the replay button on TradingView.
#BTC Price Analysis# #Crypto #Gold #Altcoin Season# $XRP $USDC $USDT $BTC
69
·
--
查看翻譯
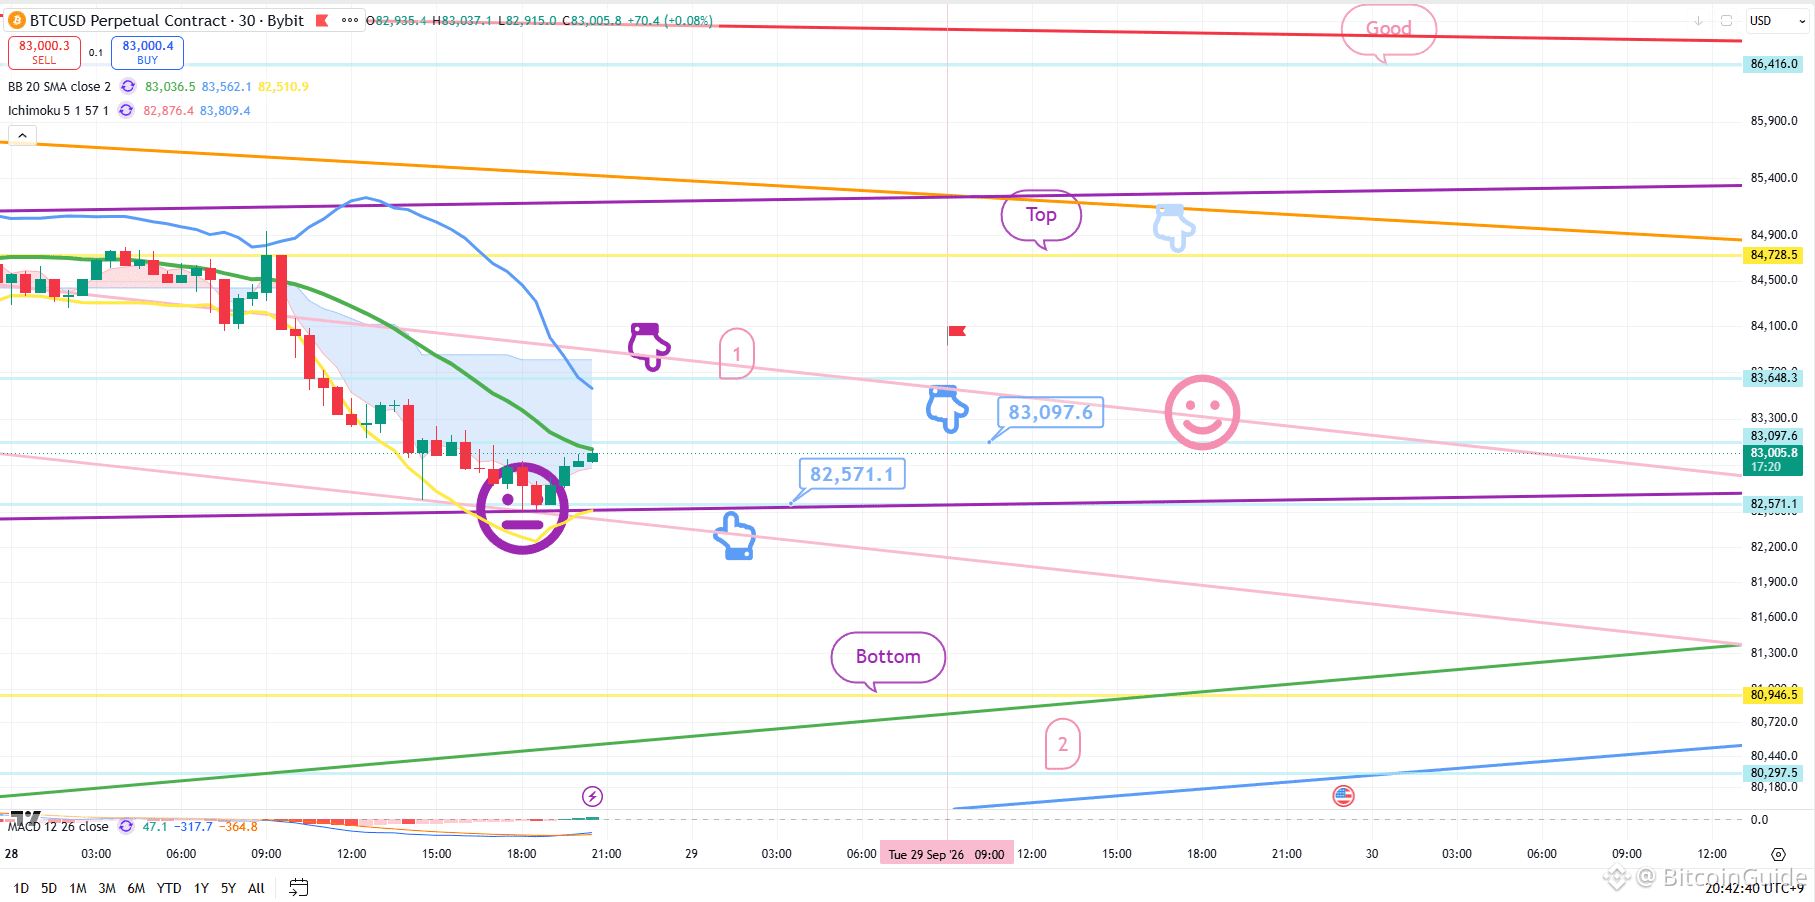
[September 28 Bitcoin chart analysis]
BTCUSD 30Min Chart
*My analysis is optimized for TradingView.
If you press the replay button, you can check real-time movements.
-Neutral two-way strategy-
Currently, the Nasdaq is showing a MACD "death cross" on the 12-hour chart,
while Bitcoin is undergoing a MACD death cross on the daily chart.
Given that we are at a point where a correction is highly likely,
I have prepared a neutral, two-way strategy.
*Strategy involving a switch from short to long, or waiting for a long position,
based on touching the "purple finger" zone (Zone 1) at the top:
1) Upon touching the "purple finger" zone (Zone 1) at the top:
Entry point for a short position; stop-loss if the pink resistance line is broken.
2) Switch to a long position at the "sky-blue finger" level ($82,571.1) at the bottom;
stop-loss if the purple support line is breached.
-> Final target price set for the "Top" zone from tomorrow onwards.
- If the price breaks below the purple support line immediately:
The final long position entry point is at "Zone 2" (the very bottom).
If the price touches the "Bottom" zone and closes there:
Further downward movement could follow from tomorrow onwards.
I post the analysis results as a Comment every day.
Thank you.
(You can find the link on my profile.)
- Click Follow to receive faster information every day.
- Check the results using the replay button on TradingView.
#BTC Price Analysis# #Crypto #Altcoin Season# #Gold #ETH $USDC $TRX $XRP $BTC
[September 28 Bitcoin chart analysis]
BTCUSD 30Min Chart
*My analysis is optimized for TradingView.
If you press the replay button, you can check real-time movements.
-Neutral two-way strategy-
Currently, the Nasdaq is showing a MACD "death cross" on the 12-hour chart,
while Bitcoin is undergoing a MACD death cross on the daily chart.
Given that we are at a point where a correction is highly likely,
I have prepared a neutral, two-way strategy.
*Strategy involving a switch from short to long, or waiting for a long position,
based on touching the "purple finger" zone (Zone 1) at the top:
1) Upon touching the "purple finger" zone (Zone 1) at the top:
Entry point for a short position; stop-loss if the pink resistance line is broken.
2) Switch to a long position at the "sky-blue finger" level ($82,571.1) at the bottom;
stop-loss if the purple support line is breached.
-> Final target price set for the "Top" zone from tomorrow onwards.
- If the price breaks below the purple support line immediately:
The final long position entry point is at "Zone 2" (the very bottom).
If the price touches the "Bottom" zone and closes there:
Further downward movement could follow from tomorrow onwards.
I post the analysis results as a Comment every day.
Thank you.
(You can find the link on my profile.)
- Click Follow to receive faster information every day.
- Check the results using the replay button on TradingView.
#BTC Price Analysis# #Crypto #Altcoin Season# #Gold #ETH $USDC $TRX $XRP $BTC
BTCUSD 30Min Chart
*My analysis is optimized for TradingView.
If you press the replay button, you can check real-time movements.
-Neutral two-way strategy-
Currently, the Nasdaq is showing a MACD "death cross" on the 12-hour chart,
while Bitcoin is undergoing a MACD death cross on the daily chart.
Given that we are at a point where a correction is highly likely,
I have prepared a neutral, two-way strategy.
*Strategy involving a switch from short to long, or waiting for a long position,
based on touching the "purple finger" zone (Zone 1) at the top:
1) Upon touching the "purple finger" zone (Zone 1) at the top:
Entry point for a short position; stop-loss if the pink resistance line is broken.
2) Switch to a long position at the "sky-blue finger" level ($82,571.1) at the bottom;
stop-loss if the purple support line is breached.
-> Final target price set for the "Top" zone from tomorrow onwards.
- If the price breaks below the purple support line immediately:
The final long position entry point is at "Zone 2" (the very bottom).
If the price touches the "Bottom" zone and closes there:
Further downward movement could follow from tomorrow onwards.
I post the analysis results as a Comment every day.
Thank you.
(You can find the link on my profile.)
- Click Follow to receive faster information every day.
- Check the results using the replay button on TradingView.
#BTC Price Analysis# #Crypto #Altcoin Season# #Gold #ETH $USDC $TRX $XRP $BTC
61
·
--
查看翻譯
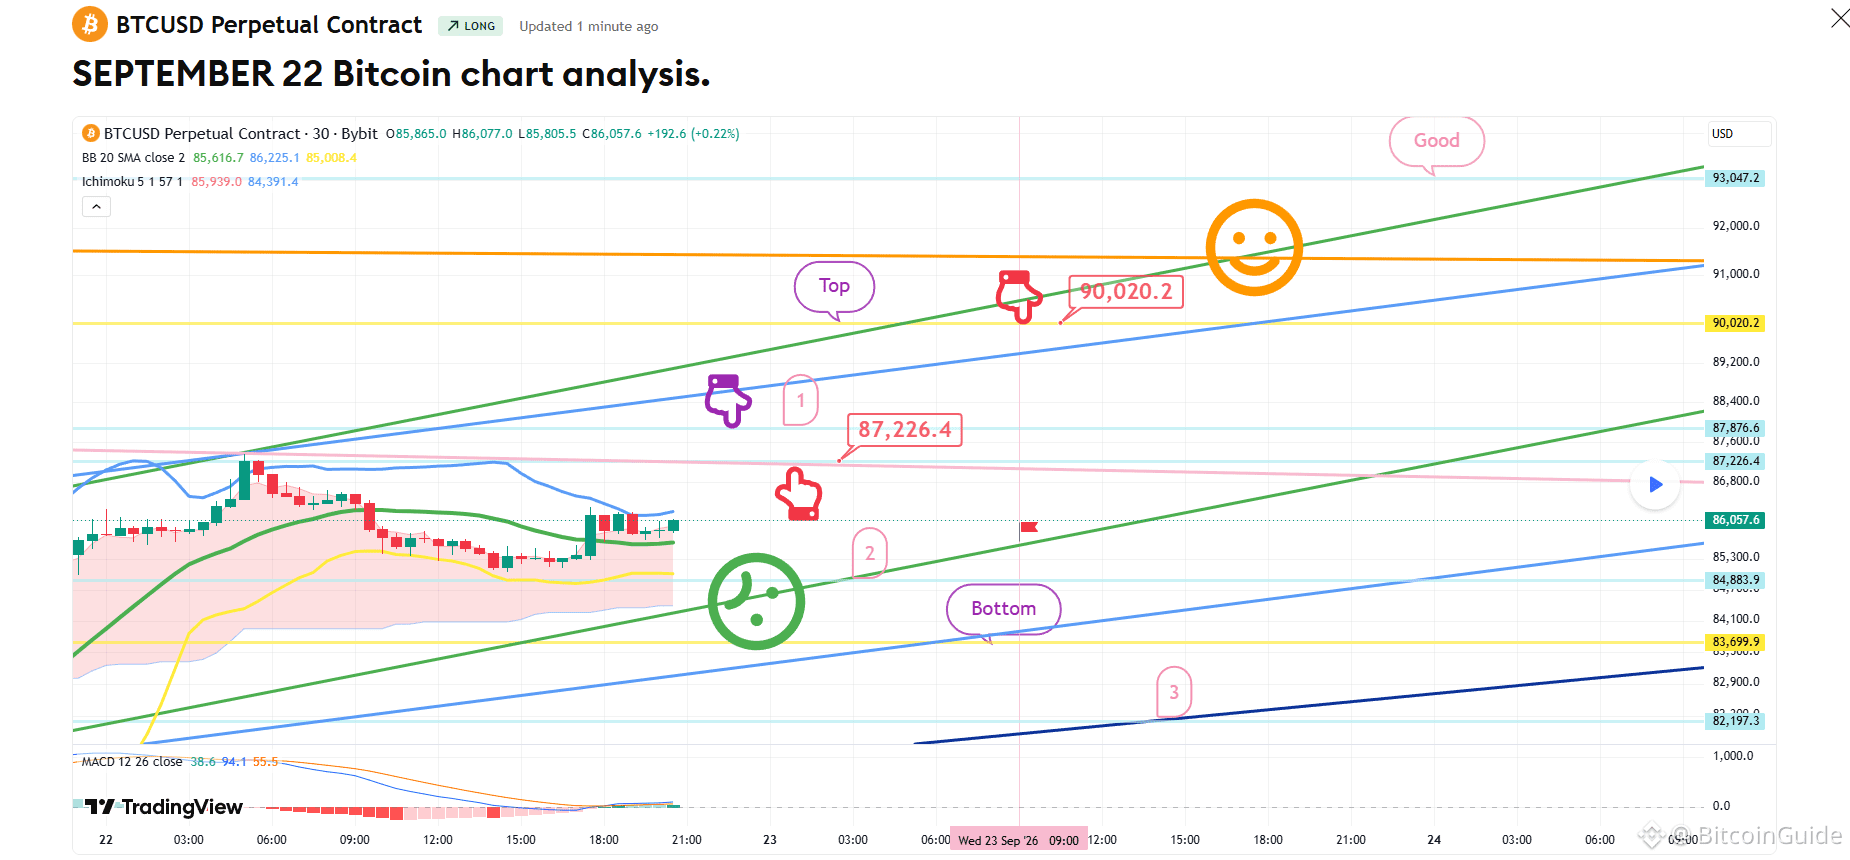
[September 23 Bitcoin chart analysis]
BTCUSD 30Min Chart
*My analysis is optimized for TradingView.
If you press the replay button, you can check real-time movements.
-Long position strategy-
This is the 30-minute Bitcoin chart.
While a correction is likely for the Nasdaq,
Bitcoin appears highly likely to move sideways at this level.
I have disregarded the MACD "death cross" on the 6-hour chart.
Also, I am interpreting the monthly chart as not having touched the middle line of the Bollinger Bands.
*If the price follows the path indicated by the red arrow:
Long position strategy
1) Long entry zone: $85,871.9 / Stop-loss level: If the purple support line is breached
2) Long position 1st target: $87,876.6 -> 2nd target: Top zone
The $87,114.4 level is a zone to consider for re-entering a long position.
Even if the price drops after a period of sideways movement, the bullish pattern remains intact,
so the area down to the "Bottom" level is considered a safe zone.
If the purple support line is breached,
please be aware that the price could drop to the "Bottom" level marked below,
then to level 1, and potentially as low as $83,699.9 by the weekend.
South Korea observes the Chuseok (Mid-Autumn Festival) holiday from tomorrow until the 27th.
I’ll take a good rest over the weekend and return next Monday.
I post the analysis results as a Comment every day.
Thank you.
(You can find the link on my profile.)
- Click Follow to receive faster information every day.
- Check the results using the replay button on TradingView.
#Bitcoin #BTC100K #Crypto #Altcoin Season# #BTC Price Analysis# $ETH $USDT $BTC $BNB $XRP
[September 23 Bitcoin chart analysis]
BTCUSD 30Min Chart
*My analysis is optimized for TradingView.
If you press the replay button, you can check real-time movements.
-Long position strategy-
This is the 30-minute Bitcoin chart.
While a correction is likely for the Nasdaq,
Bitcoin appears highly likely to move sideways at this level.
I have disregarded the MACD "death cross" on the 6-hour chart.
Also, I am interpreting the monthly chart as not having touched the middle line of the Bollinger Bands.
*If the price follows the path indicated by the red arrow:
Long position strategy
1) Long entry zone: $85,871.9 / Stop-loss level: If the purple support line is breached
2) Long position 1st target: $87,876.6 -> 2nd target: Top zone
The $87,114.4 level is a zone to consider for re-entering a long position.
Even if the price drops after a period of sideways movement, the bullish pattern remains intact,
so the area down to the "Bottom" level is considered a safe zone.
If the purple support line is breached,
please be aware that the price could drop to the "Bottom" level marked below,
then to level 1, and potentially as low as $83,699.9 by the weekend.
South Korea observes the Chuseok (Mid-Autumn Festival) holiday from tomorrow until the 27th.
I’ll take a good rest over the weekend and return next Monday.
I post the analysis results as a Comment every day.
Thank you.
(You can find the link on my profile.)
- Click Follow to receive faster information every day.
- Check the results using the replay button on TradingView.
#Bitcoin #BTC100K #Crypto #Altcoin Season# #BTC Price Analysis# $ETH $USDT $BTC $BNB $XRP
BTCUSD 30Min Chart
*My analysis is optimized for TradingView.
If you press the replay button, you can check real-time movements.
-Long position strategy-
This is the 30-minute Bitcoin chart.
While a correction is likely for the Nasdaq,
Bitcoin appears highly likely to move sideways at this level.
I have disregarded the MACD "death cross" on the 6-hour chart.
Also, I am interpreting the monthly chart as not having touched the middle line of the Bollinger Bands.
*If the price follows the path indicated by the red arrow:
Long position strategy
1) Long entry zone: $85,871.9 / Stop-loss level: If the purple support line is breached
2) Long position 1st target: $87,876.6 -> 2nd target: Top zone
The $87,114.4 level is a zone to consider for re-entering a long position.
Even if the price drops after a period of sideways movement, the bullish pattern remains intact,
so the area down to the "Bottom" level is considered a safe zone.
If the purple support line is breached,
please be aware that the price could drop to the "Bottom" level marked below,
then to level 1, and potentially as low as $83,699.9 by the weekend.
South Korea observes the Chuseok (Mid-Autumn Festival) holiday from tomorrow until the 27th.
I’ll take a good rest over the weekend and return next Monday.
I post the analysis results as a Comment every day.
Thank you.
(You can find the link on my profile.)
- Click Follow to receive faster information every day.
- Check the results using the replay button on TradingView.
#Bitcoin #BTC100K #Crypto #Altcoin Season# #BTC Price Analysis# $ETH $USDT $BTC $BNB $XRP
86
·
--
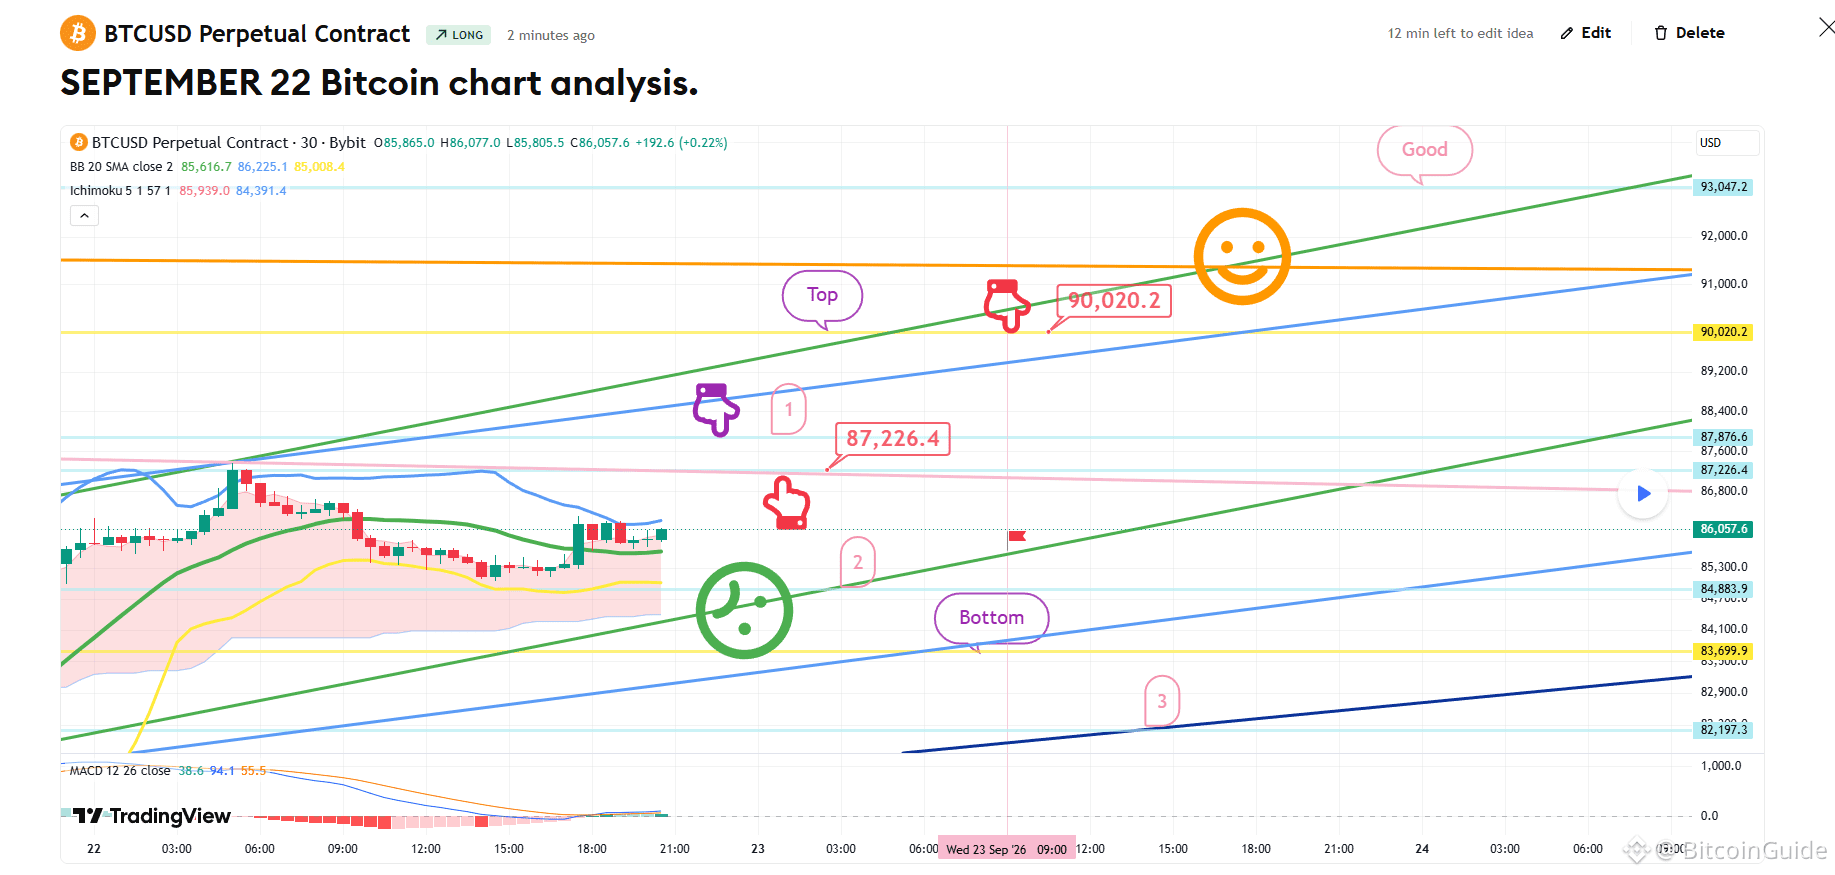
[2023年9月22日比特幣圖表分析] BTCUSD 30分鐘圖表 *我的分析已針對 TradingView 最佳化。若你按下重播按鈕,可以查看即時走勢。 -多單策略- *多單策略聚焦於紫色手指標記的區域(標示為「1」)—也就是觸碰之前與觸碰之後的走勢。 1) 確認在紫色手指區域(87,876.6 美元)觸碰後:在紅色手指區域進場做多(87,226.4 美元);停損設在綠色支撐線被跌破的位置。 2) 上方區域(90,0020.2 美元)是多單的第一目標 ->「Good」區是第二目標。 3) 若價格在未觸碰紫色手指區域的情況下立刻下跌:策略是等待在標示「2」的下方區域做多進場。 請注意:若綠色支撐線被跌破,價格可能會下探至「Bottom」所標示的水準,甚至下跌至區域「3」。 我每天都會以 Comment 發布分析結果。 謝謝。 (你可以在我的個人檔案中找到連結。) - 點擊 Follow 以便每天更快收到資訊。 - 在 TradingView 使用重播按鈕查看結果。 #Bitcoin #Crypto# #XRP #BTC100K $USDT $XRP $BTC $ETH
[2023年9月22日比特幣圖表分析] BTCUSD 30分鐘圖表 *我的分析已針對 TradingView 最佳化。若你按下重播按鈕,可以查看即時走勢。 -多單策略- *多單策略聚焦於紫色手指標記的區域(標示為「1」)—也就是觸碰之前與觸碰之後的走勢。 1) 確認在紫色手指區域(87,876.6 美元)觸碰後:在紅色手指區域進場做多(87,226.4 美元);停損設在綠色支撐線被跌破的位置。 2) 上方區域(90,0020.2 美元)是多單的第一目標 ->「Good」區是第二目標。 3) 若價格在未觸碰紫色手指區域的情況下立刻下跌:策略是等待在標示「2」的下方區域做多進場。 請注意:若綠色支撐線被跌破,價格可能會下探至「Bottom」所標示的水準,甚至下跌至區域「3」。 我每天都會以 Comment 發布分析結果。 謝謝。 (你可以在我的個人檔案中找到連結。) - 點擊 Follow 以便每天更快收到資訊。 - 在 TradingView 使用重播按鈕查看結果。 #Bitcoin #Crypto# #XRP #BTC100K $USDT $XRP $BTC $ETH
55
·
--
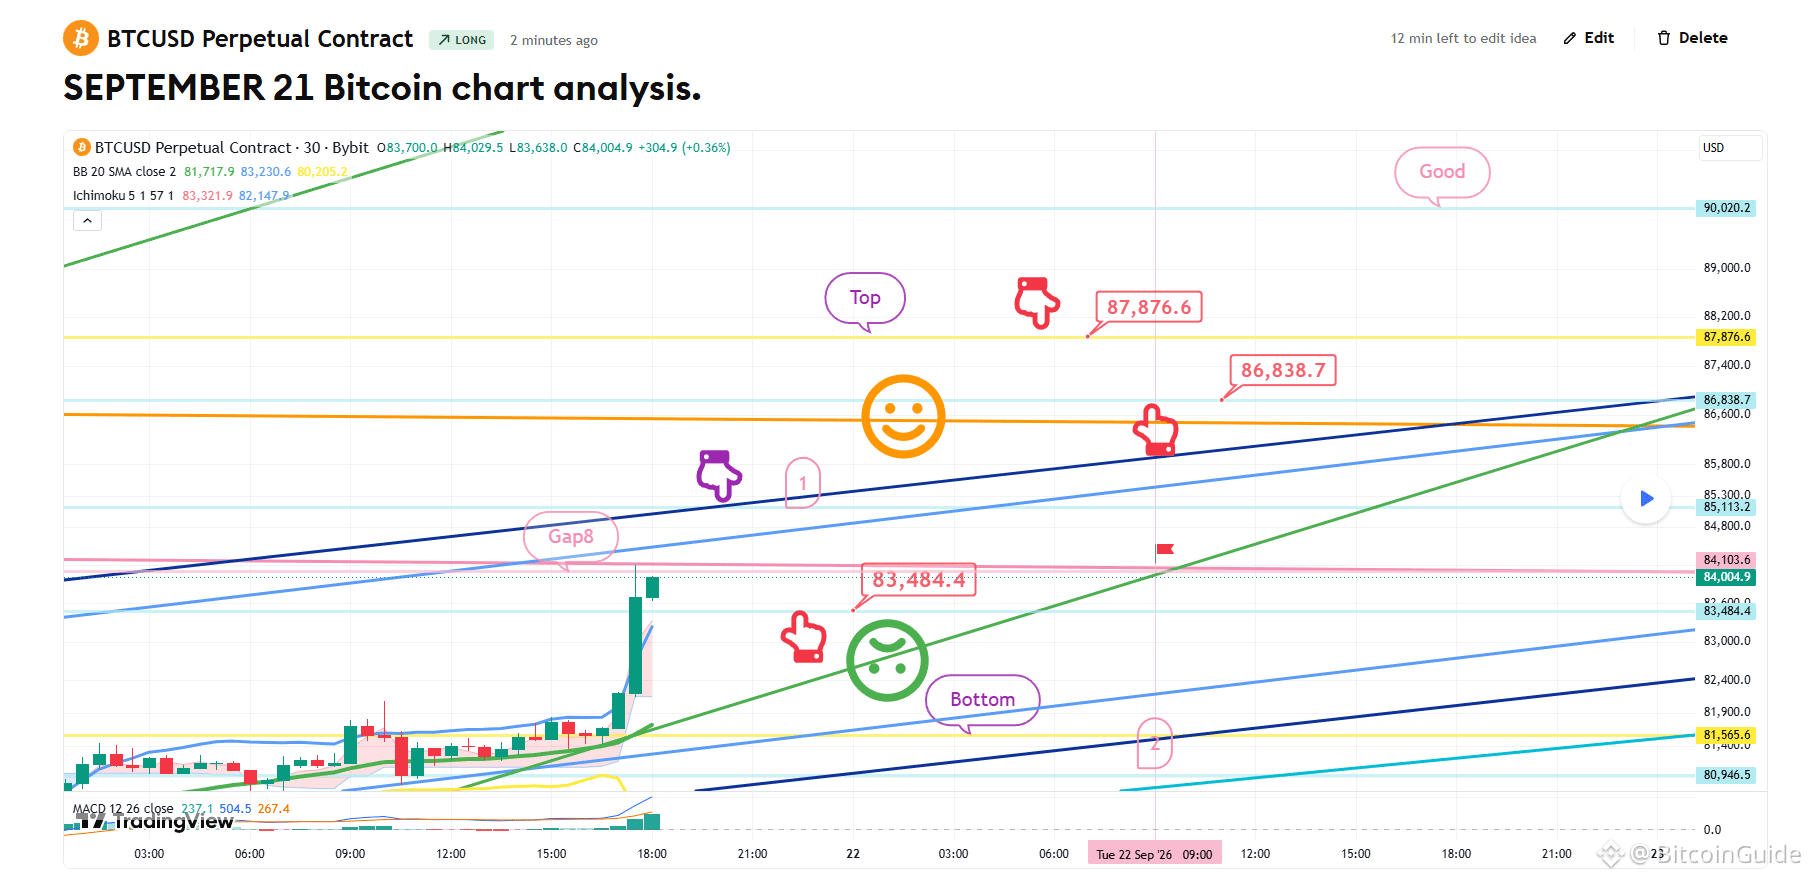
[9月21日比特幣K線分析]
BTCUSD 30分鐘圖表
*我的分析已針對 TradingView 優化。
如果你按下重播按鈕,就可以查看即時走勢。
-多單策略-
1) 不論價格是否觸及紫色箭頭標記(標示為「1」)—通常隨之而來的是垂直拉升—
在紅色箭頭位置進場做多($83,484.4);止損設在綠色支撐線被跌破的點位。
2) 做多的主要目標是 $87,876.6「頂部」區;「Good」等級作為第二目標。
若策略成功,標記的 86.8K 區可用於再次進場做多。
若綠色支撐線被跌破:
價格可能滑落至下方所標示的「Bottom」區—並可能延伸至「2」標記的位置。
我每天把分析結果以「評論」形式發布。
謝謝。
(你可以在我的個人檔案中找到連結。)
- 點擊「追蹤」以便每天接收更快的資訊。
- 在 TradingView 上用重播按鈕查看結果。
#BTC 價格分析# #Altcoin季# #加密貨幣# #BTC100K $BTC $USDT $XRP $ETH
[9月21日比特幣K線分析]
BTCUSD 30分鐘圖表
*我的分析已針對 TradingView 優化。
如果你按下重播按鈕,就可以查看即時走勢。
-多單策略-
1) 不論價格是否觸及紫色箭頭標記(標示為「1」)—通常隨之而來的是垂直拉升—
在紅色箭頭位置進場做多($83,484.4);止損設在綠色支撐線被跌破的點位。
2) 做多的主要目標是 $87,876.6「頂部」區;「Good」等級作為第二目標。
若策略成功,標記的 86.8K 區可用於再次進場做多。
若綠色支撐線被跌破:
價格可能滑落至下方所標示的「Bottom」區—並可能延伸至「2」標記的位置。
我每天把分析結果以「評論」形式發布。
謝謝。
(你可以在我的個人檔案中找到連結。)
- 點擊「追蹤」以便每天接收更快的資訊。
- 在 TradingView 上用重播按鈕查看結果。
#BTC 價格分析# #Altcoin季# #加密貨幣# #BTC100K $BTC $USDT $XRP $ETH
BTCUSD 30分鐘圖表
*我的分析已針對 TradingView 優化。
如果你按下重播按鈕,就可以查看即時走勢。
-多單策略-
1) 不論價格是否觸及紫色箭頭標記(標示為「1」)—通常隨之而來的是垂直拉升—
在紅色箭頭位置進場做多($83,484.4);止損設在綠色支撐線被跌破的點位。
2) 做多的主要目標是 $87,876.6「頂部」區;「Good」等級作為第二目標。
若策略成功,標記的 86.8K 區可用於再次進場做多。
若綠色支撐線被跌破:
價格可能滑落至下方所標示的「Bottom」區—並可能延伸至「2」標記的位置。
我每天把分析結果以「評論」形式發布。
謝謝。
(你可以在我的個人檔案中找到連結。)
- 點擊「追蹤」以便每天接收更快的資訊。
- 在 TradingView 上用重播按鈕查看結果。
#BTC 價格分析# #Altcoin季# #加密貨幣# #BTC100K $BTC $USDT $XRP $ETH
62
·
--
[2024年9月11日比特幣走勢分析]
BTCUSD 30分鐘圖表
*我的分析已針對 TradingView 最佳化。
如果你按下重播按鈕,就可以查看即時走勢。
-多單策略-
在左下角,我已保留多單進場點策略為 76,999.4 美元(以紫色手指標示),該策略於 9 月 10 日建立。
CPI 數據發布時間預計在 9:30 左右。
*關於上方「紫色手指 1」區域的多單策略:
1) 確認觸及「紫色手指 1」區域,價格為 78,360.4 美元:
多單進場:77,743.5 美元(紅色手指);若紫色支撐線被跌破,則停損。
2) 多單第一目標為 79,558.7 美元 ->
週末後續目標:「Good」接著「Great」。
- 若策略成功,可使用 78.9K 水位作為重新進多單的依據。
3) 若價格直接下跌,未觸及「紫色手指 1」區域:
多單進場:下方「區域 2」(76,748.2 美元);若紫色支撐線被跌破,則停損。
- 對於目前持有 76.9K 多單的人,你可以套用相同的停損規則(若紫色支撐線被跌破,則離場)。
- 若紫色支撐線被打破,價格將移動至「Bottom」區域(上升通道的最終支撐線)。
- 雖然圖表上看不到,但在該水位之下仍可能有下行空間,最多可到 74.9K。
請僅將此分析用於參考與規劃。
我希望你能在遵守自己的原則並使用停損單的情況下安全交易。
我每天會把分析結果以「留言(Comment)」形式發布。
謝謝。
(你可以在我的個人檔案中找到連結。)
- 點擊「追蹤(Follow)」以便每天更快收到資訊。
- 使用 TradingView 的重播按鈕檢查結果。
#BTC價格分析# #BNBChain# #BTC100K #Altcoin季# $USDT $ETH $XRP $SOL $BTC
[2024年9月11日比特幣走勢分析]
BTCUSD 30分鐘圖表
*我的分析已針對 TradingView 最佳化。
如果你按下重播按鈕,就可以查看即時走勢。
-多單策略-
在左下角,我已保留多單進場點策略為 76,999.4 美元(以紫色手指標示),該策略於 9 月 10 日建立。
CPI 數據發布時間預計在 9:30 左右。
*關於上方「紫色手指 1」區域的多單策略:
1) 確認觸及「紫色手指 1」區域,價格為 78,360.4 美元:
多單進場:77,743.5 美元(紅色手指);若紫色支撐線被跌破,則停損。
2) 多單第一目標為 79,558.7 美元 ->
週末後續目標:「Good」接著「Great」。
- 若策略成功,可使用 78.9K 水位作為重新進多單的依據。
3) 若價格直接下跌,未觸及「紫色手指 1」區域:
多單進場:下方「區域 2」(76,748.2 美元);若紫色支撐線被跌破,則停損。
- 對於目前持有 76.9K 多單的人,你可以套用相同的停損規則(若紫色支撐線被跌破,則離場)。
- 若紫色支撐線被打破,價格將移動至「Bottom」區域(上升通道的最終支撐線)。
- 雖然圖表上看不到,但在該水位之下仍可能有下行空間,最多可到 74.9K。
請僅將此分析用於參考與規劃。
我希望你能在遵守自己的原則並使用停損單的情況下安全交易。
我每天會把分析結果以「留言(Comment)」形式發布。
謝謝。
(你可以在我的個人檔案中找到連結。)
- 點擊「追蹤(Follow)」以便每天更快收到資訊。
- 使用 TradingView 的重播按鈕檢查結果。
#BTC價格分析# #BNBChain# #BTC100K #Altcoin季# $USDT $ETH $XRP $SOL $BTC
BTCUSD 30分鐘圖表
*我的分析已針對 TradingView 最佳化。
如果你按下重播按鈕,就可以查看即時走勢。
-多單策略-
在左下角,我已保留多單進場點策略為 76,999.4 美元(以紫色手指標示),該策略於 9 月 10 日建立。
CPI 數據發布時間預計在 9:30 左右。
*關於上方「紫色手指 1」區域的多單策略:
1) 確認觸及「紫色手指 1」區域,價格為 78,360.4 美元:
多單進場:77,743.5 美元(紅色手指);若紫色支撐線被跌破,則停損。
2) 多單第一目標為 79,558.7 美元 ->
週末後續目標:「Good」接著「Great」。
- 若策略成功,可使用 78.9K 水位作為重新進多單的依據。
3) 若價格直接下跌,未觸及「紫色手指 1」區域:
多單進場:下方「區域 2」(76,748.2 美元);若紫色支撐線被跌破,則停損。
- 對於目前持有 76.9K 多單的人,你可以套用相同的停損規則(若紫色支撐線被跌破,則離場)。
- 若紫色支撐線被打破,價格將移動至「Bottom」區域(上升通道的最終支撐線)。
- 雖然圖表上看不到,但在該水位之下仍可能有下行空間,最多可到 74.9K。
請僅將此分析用於參考與規劃。
我希望你能在遵守自己的原則並使用停損單的情況下安全交易。
我每天會把分析結果以「留言(Comment)」形式發布。
謝謝。
(你可以在我的個人檔案中找到連結。)
- 點擊「追蹤(Follow)」以便每天更快收到資訊。
- 使用 TradingView 的重播按鈕檢查結果。
#BTC價格分析# #BNBChain# #BTC100K #Altcoin季# $USDT $ETH $XRP $SOL $BTC

59
·
--
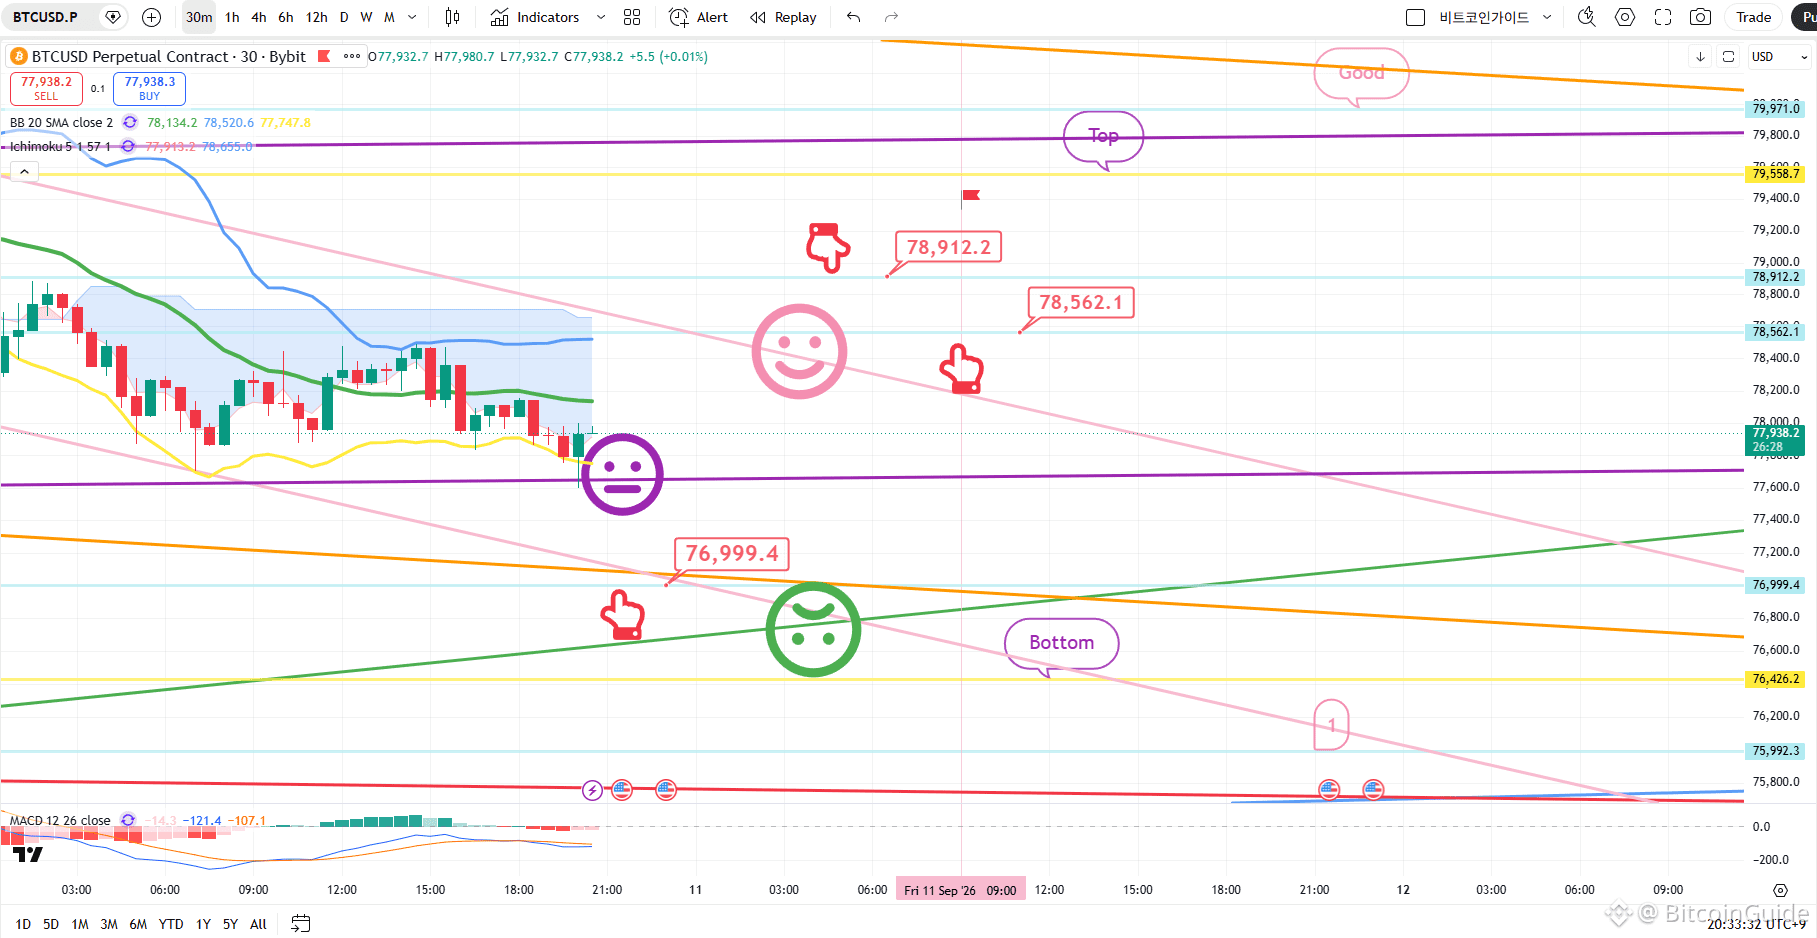
[9月10日 比特幣圖表分析]
BTCUSD 30分鐘圖表
*我的分析已針對 TradingView 最佳化。
如果你按下重播按鈕,你可以查看即時走勢。
-多單策略-
*如果價格沿著紅色箭頭所指的路徑移動:
多單策略
1)多單進場區:$76,999.4 / 停損:若價格跌破綠色支撐線
2)多單第一目標:$78,912.2 -> 後續目標:先到『頂部(Top)』再到『良好(Good)』
- 若策略成功,$78.5K 這個位置(由紅色箭頭標示)可作為多單的再進場區。
- 若價格跌破綠色支撐線,
上升通道將失效,而價格要再次上漲可能需要很長時間。
- 目前,納斯達克在 12 小時圖表上顯示 MACD「死亡交叉」,
因此橫向盤整的機率很高。
如果價格守在紫色支撐線之上,市場可能以向上漂移的橫盤走勢收盤。
若跌破綠色支撐線,價格可能下跌至下方標示的『底部(Bottom)』水位
-> 甚至可能延伸到『1』區域。
我每天會以「留言(Comment)」形式發布分析結果。
謝謝。
(你可以在我的個人資料頁面找到連結。)
- 點擊「追蹤(Follow)」以接收每日更快的資訊。
- 請在 TradingView 上使用重播按鈕查看結果。
#BTC Price Analysis# #Altcoin Season# #Crypto# $USDT $BTC $ETH
[9月10日 比特幣圖表分析]
BTCUSD 30分鐘圖表
*我的分析已針對 TradingView 最佳化。
如果你按下重播按鈕,你可以查看即時走勢。
-多單策略-
*如果價格沿著紅色箭頭所指的路徑移動:
多單策略
1)多單進場區:$76,999.4 / 停損:若價格跌破綠色支撐線
2)多單第一目標:$78,912.2 -> 後續目標:先到『頂部(Top)』再到『良好(Good)』
- 若策略成功,$78.5K 這個位置(由紅色箭頭標示)可作為多單的再進場區。
- 若價格跌破綠色支撐線,
上升通道將失效,而價格要再次上漲可能需要很長時間。
- 目前,納斯達克在 12 小時圖表上顯示 MACD「死亡交叉」,
因此橫向盤整的機率很高。
如果價格守在紫色支撐線之上,市場可能以向上漂移的橫盤走勢收盤。
若跌破綠色支撐線,價格可能下跌至下方標示的『底部(Bottom)』水位
-> 甚至可能延伸到『1』區域。
我每天會以「留言(Comment)」形式發布分析結果。
謝謝。
(你可以在我的個人資料頁面找到連結。)
- 點擊「追蹤(Follow)」以接收每日更快的資訊。
- 請在 TradingView 上使用重播按鈕查看結果。
#BTC Price Analysis# #Altcoin Season# #Crypto# $USDT $BTC $ETH
BTCUSD 30分鐘圖表
*我的分析已針對 TradingView 最佳化。
如果你按下重播按鈕,你可以查看即時走勢。
-多單策略-
*如果價格沿著紅色箭頭所指的路徑移動:
多單策略
1)多單進場區:$76,999.4 / 停損:若價格跌破綠色支撐線
2)多單第一目標:$78,912.2 -> 後續目標:先到『頂部(Top)』再到『良好(Good)』
- 若策略成功,$78.5K 這個位置(由紅色箭頭標示)可作為多單的再進場區。
- 若價格跌破綠色支撐線,
上升通道將失效,而價格要再次上漲可能需要很長時間。
- 目前,納斯達克在 12 小時圖表上顯示 MACD「死亡交叉」,
因此橫向盤整的機率很高。
如果價格守在紫色支撐線之上,市場可能以向上漂移的橫盤走勢收盤。
若跌破綠色支撐線,價格可能下跌至下方標示的『底部(Bottom)』水位
-> 甚至可能延伸到『1』區域。
我每天會以「留言(Comment)」形式發布分析結果。
謝謝。
(你可以在我的個人資料頁面找到連結。)
- 點擊「追蹤(Follow)」以接收每日更快的資訊。
- 請在 TradingView 上使用重播按鈕查看結果。
#BTC Price Analysis# #Altcoin Season# #Crypto# $USDT $BTC $ETH
69
·
--
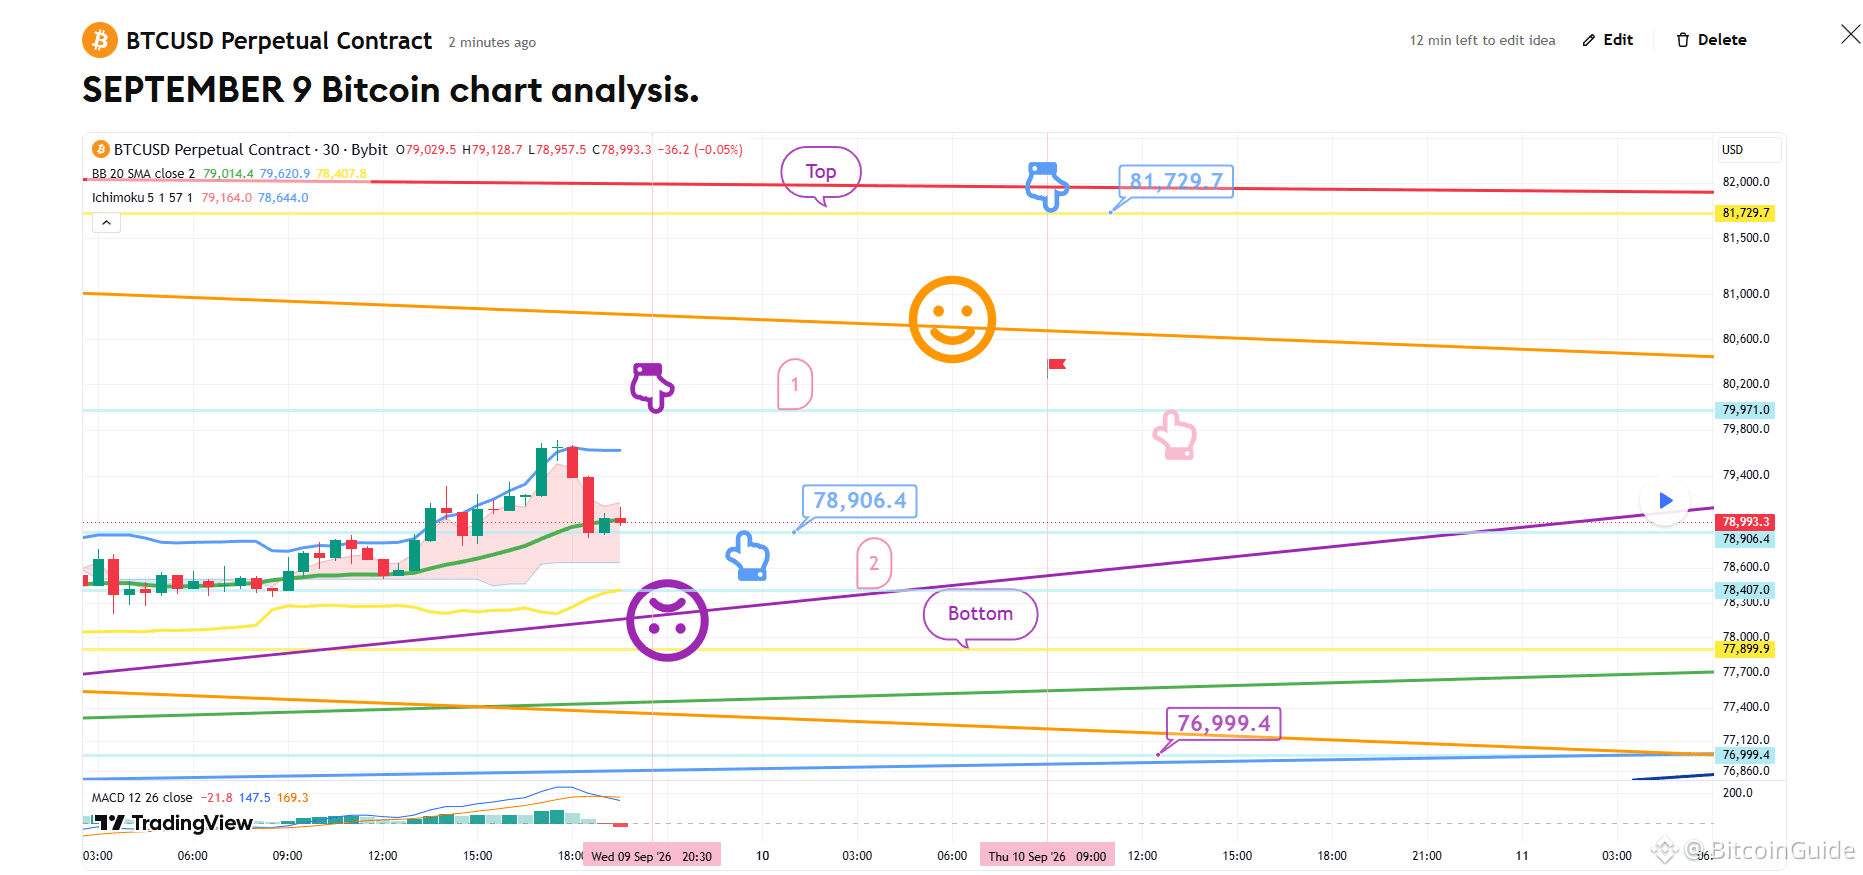
[9月9日比特幣圖表分析]
*我的分析已針對 TradingView 進行最佳化。
如果你按下重播按鈕,就能查看即時走勢。
這是比特幣 30 分鐘圖。
由於整體中期結構已經破壞,
我們可能在雙方向都看到明顯的波動。
*在頂部「紫色手指 1」區域附近採用中性策略(雙向交易):
1)確認價格觸及「紫色手指 1」區域 $79,791(可考慮做空)之後,
觀察在標示的較低區位進場做多:淺藍色手指($78,906.4)。
/ 若紫色支撐線被跌破,則設為停損。
2)在 $81,729.7 切換成做空 / 若紅色阻力線被突破,則設為停損。
這同時也是重新進場做多的最終區域。
3)若價格在未觸及頂部的 1 區時就立刻下跌,
那麼「第 2 區」的 $78.4K 將是做多的最後等待點。
停損條件(若紫色支撐線被跌破)維持不變。
一旦紫色支撐線被跌破,
價格可能下探到下方標示的「底部」區域——可能低至 $76.9K——
因此請務必謹慎。
若 $76.9K 的淺藍色支撐線也被跌破,
中期看漲通道將被否定,對做多不利。
我會每天以留言(Comment)形式發布分析結果。
謝謝。
(你可以在我的個人資料中找到連結。)
- 按下追蹤(Follow)以便每天更快取得資訊。
- 可在 TradingView 透過重播按鈕查看結果。
#Crypto# #BTC Price Analysis# #Altcoin Season# #BNBChain# #ㅠㅆ
[9月9日比特幣圖表分析]
*我的分析已針對 TradingView 進行最佳化。
如果你按下重播按鈕,就能查看即時走勢。
這是比特幣 30 分鐘圖。
由於整體中期結構已經破壞,
我們可能在雙方向都看到明顯的波動。
*在頂部「紫色手指 1」區域附近採用中性策略(雙向交易):
1)確認價格觸及「紫色手指 1」區域 $79,791(可考慮做空)之後,
觀察在標示的較低區位進場做多:淺藍色手指($78,906.4)。
/ 若紫色支撐線被跌破,則設為停損。
2)在 $81,729.7 切換成做空 / 若紅色阻力線被突破,則設為停損。
這同時也是重新進場做多的最終區域。
3)若價格在未觸及頂部的 1 區時就立刻下跌,
那麼「第 2 區」的 $78.4K 將是做多的最後等待點。
停損條件(若紫色支撐線被跌破)維持不變。
一旦紫色支撐線被跌破,
價格可能下探到下方標示的「底部」區域——可能低至 $76.9K——
因此請務必謹慎。
若 $76.9K 的淺藍色支撐線也被跌破,
中期看漲通道將被否定,對做多不利。
我會每天以留言(Comment)形式發布分析結果。
謝謝。
(你可以在我的個人資料中找到連結。)
- 按下追蹤(Follow)以便每天更快取得資訊。
- 可在 TradingView 透過重播按鈕查看結果。
#Crypto# #BTC Price Analysis# #Altcoin Season# #BNBChain# #ㅠㅆ
*我的分析已針對 TradingView 進行最佳化。
如果你按下重播按鈕,就能查看即時走勢。
這是比特幣 30 分鐘圖。
由於整體中期結構已經破壞,
我們可能在雙方向都看到明顯的波動。
*在頂部「紫色手指 1」區域附近採用中性策略(雙向交易):
1)確認價格觸及「紫色手指 1」區域 $79,791(可考慮做空)之後,
觀察在標示的較低區位進場做多:淺藍色手指($78,906.4)。
/ 若紫色支撐線被跌破,則設為停損。
2)在 $81,729.7 切換成做空 / 若紅色阻力線被突破,則設為停損。
這同時也是重新進場做多的最終區域。
3)若價格在未觸及頂部的 1 區時就立刻下跌,
那麼「第 2 區」的 $78.4K 將是做多的最後等待點。
停損條件(若紫色支撐線被跌破)維持不變。
一旦紫色支撐線被跌破,
價格可能下探到下方標示的「底部」區域——可能低至 $76.9K——
因此請務必謹慎。
若 $76.9K 的淺藍色支撐線也被跌破,
中期看漲通道將被否定,對做多不利。
我會每天以留言(Comment)形式發布分析結果。
謝謝。
(你可以在我的個人資料中找到連結。)
- 按下追蹤(Follow)以便每天更快取得資訊。
- 可在 TradingView 透過重播按鈕查看結果。
#Crypto# #BTC Price Analysis# #Altcoin Season# #BNBChain# #ㅠㅆ
56
·
--
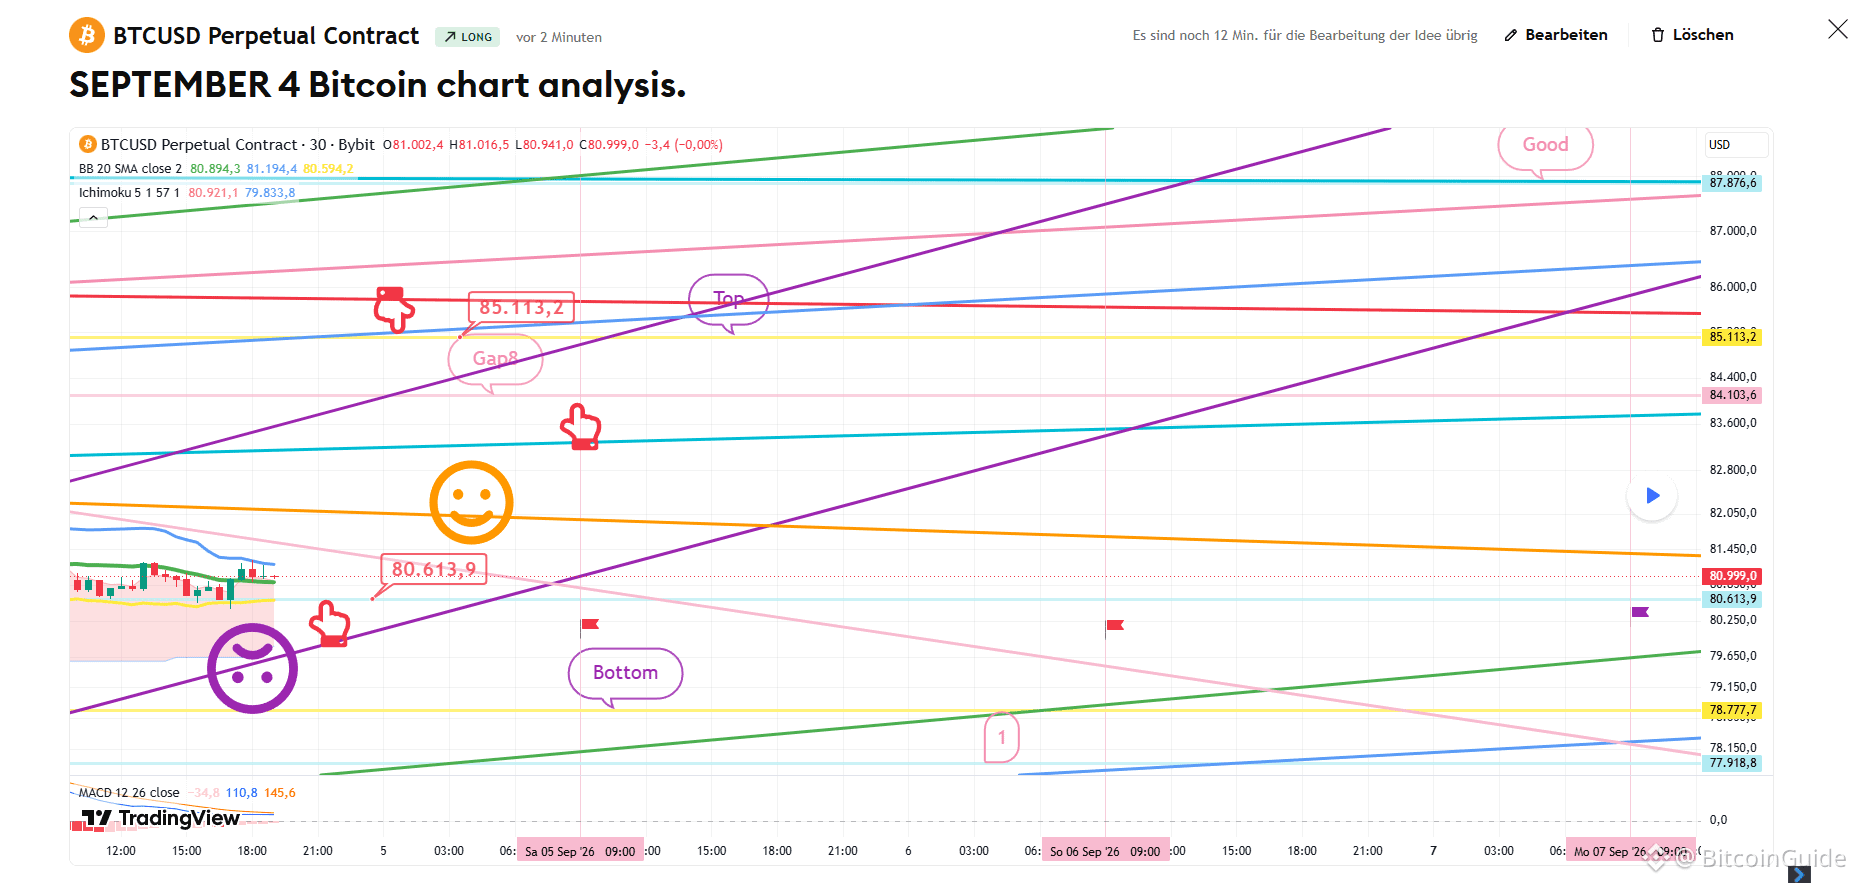
[9月4日比特幣走勢分析]
BTCUSD 30分鐘圖表
*我的分析已針對 TradingView 進行最佳化。
如果你按下回放按鈕,你可以查看即時走勢。
-多單策略-
*如果價格沿著紅色箭頭所示的路徑走:
多單策略
1)多單進場區:$80,613.9 / 停損:若紫色支撐線被跌破
2)第一目標:$85,113.2 -> 第二目標:"Good" 區(有效至週末)
若策略成功,"Gap 8" 區可用於重新進場做多。
-「Good」區是本月最關鍵的阻力位。
若能強勢突破此區,可能會帶來強大的上升趨勢延續。
若紫色支撐線被跌破,
請留意價格可能會下跌至「Bottom」水位
或最低到「Zone 1」(標示在下方)。
2小時圖上的 MACD 目前顯示「死亡交叉」,
因此在管理你的交易時,請留意今天價格可能會呈現盤整橫移。
請將本分析僅視為參考。
我每天會把分析結果以評論(Comment)的形式發布。
謝謝。
(你可以在我的個人資料中找到連結。)
- 按一下「追蹤(Follow)」以便每天更快收到資訊。
- 在 TradingView 使用回放按鈕查看結果。
#BTC100K #Macro Insights# #Altcoin Season# #BTCCharts# $USDT $TRX $BTC $ETH
[9月4日比特幣走勢分析]
BTCUSD 30分鐘圖表
*我的分析已針對 TradingView 進行最佳化。
如果你按下回放按鈕,你可以查看即時走勢。
-多單策略-
*如果價格沿著紅色箭頭所示的路徑走:
多單策略
1)多單進場區:$80,613.9 / 停損:若紫色支撐線被跌破
2)第一目標:$85,113.2 -> 第二目標:"Good" 區(有效至週末)
若策略成功,"Gap 8" 區可用於重新進場做多。
-「Good」區是本月最關鍵的阻力位。
若能強勢突破此區,可能會帶來強大的上升趨勢延續。
若紫色支撐線被跌破,
請留意價格可能會下跌至「Bottom」水位
或最低到「Zone 1」(標示在下方)。
2小時圖上的 MACD 目前顯示「死亡交叉」,
因此在管理你的交易時,請留意今天價格可能會呈現盤整橫移。
請將本分析僅視為參考。
我每天會把分析結果以評論(Comment)的形式發布。
謝謝。
(你可以在我的個人資料中找到連結。)
- 按一下「追蹤(Follow)」以便每天更快收到資訊。
- 在 TradingView 使用回放按鈕查看結果。
#BTC100K #Macro Insights# #Altcoin Season# #BTCCharts# $USDT $TRX $BTC $ETH
BTCUSD 30分鐘圖表
*我的分析已針對 TradingView 進行最佳化。
如果你按下回放按鈕,你可以查看即時走勢。
-多單策略-
*如果價格沿著紅色箭頭所示的路徑走:
多單策略
1)多單進場區:$80,613.9 / 停損:若紫色支撐線被跌破
2)第一目標:$85,113.2 -> 第二目標:"Good" 區(有效至週末)
若策略成功,"Gap 8" 區可用於重新進場做多。
-「Good」區是本月最關鍵的阻力位。
若能強勢突破此區,可能會帶來強大的上升趨勢延續。
若紫色支撐線被跌破,
請留意價格可能會下跌至「Bottom」水位
或最低到「Zone 1」(標示在下方)。
2小時圖上的 MACD 目前顯示「死亡交叉」,
因此在管理你的交易時,請留意今天價格可能會呈現盤整橫移。
請將本分析僅視為參考。
我每天會把分析結果以評論(Comment)的形式發布。
謝謝。
(你可以在我的個人資料中找到連結。)
- 按一下「追蹤(Follow)」以便每天更快收到資訊。
- 在 TradingView 使用回放按鈕查看結果。
#BTC100K #Macro Insights# #Altcoin Season# #BTCCharts# $USDT $TRX $BTC $ETH
70
·
--
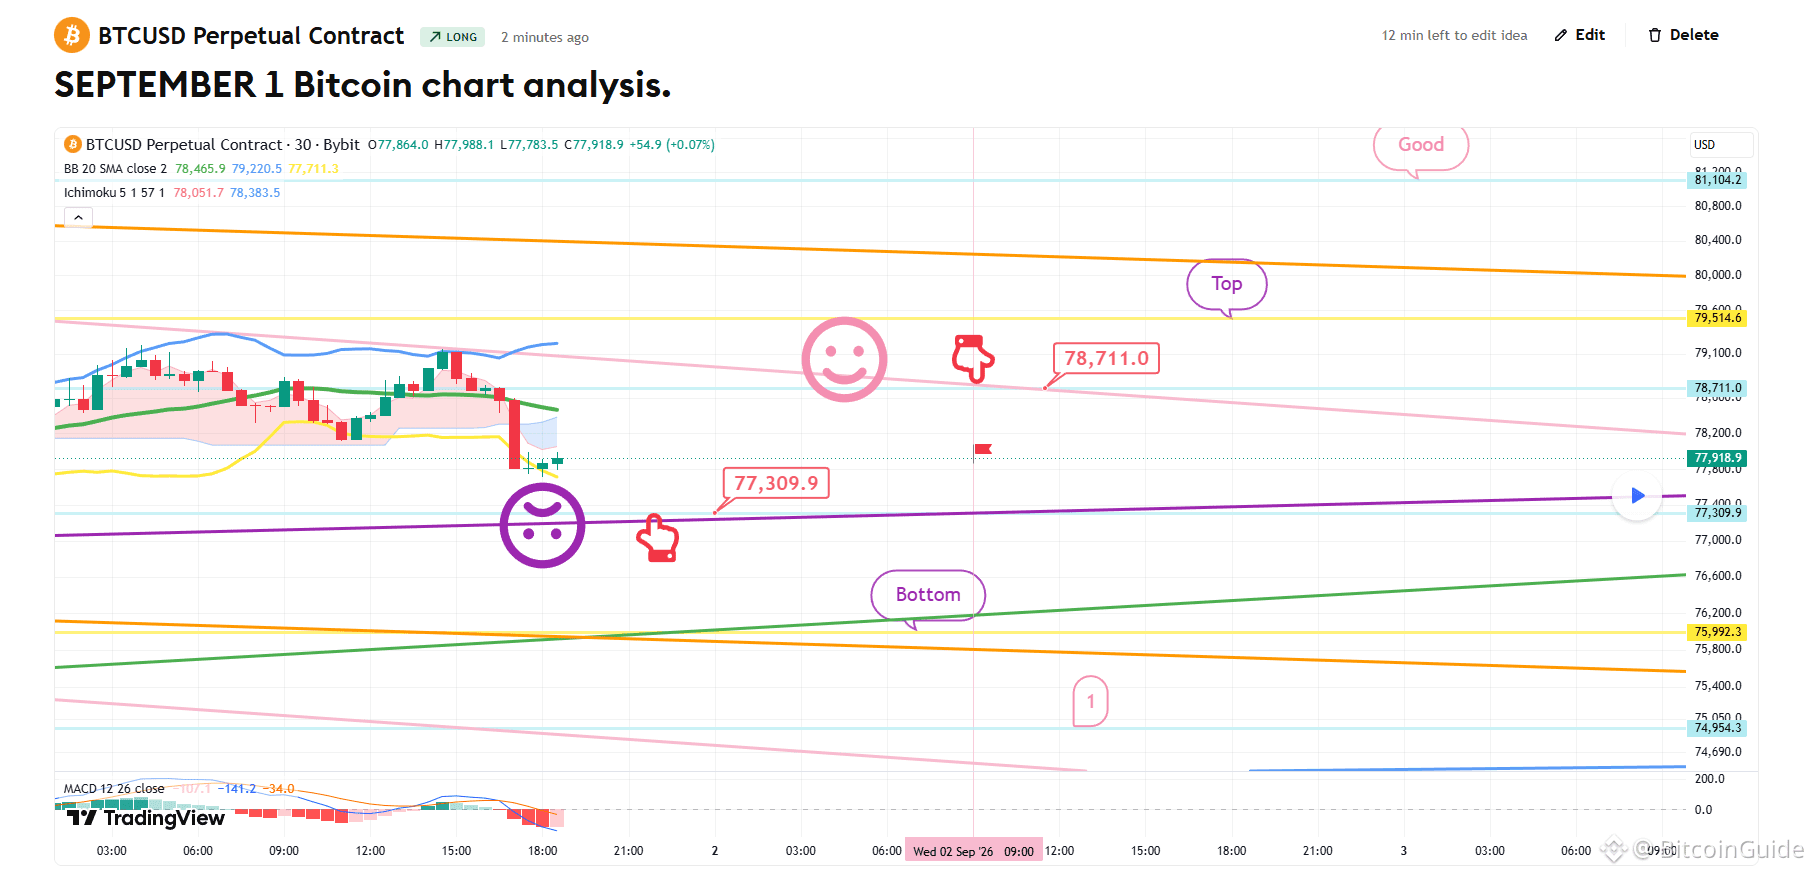
[9月1日 比特幣K線分析]
BTCUSD 30分鐘圖
*我的分析已針對 TradingView 進行優化。
如果你按下“重播”按鈕,就可以查看實時走勢。
-多頭持倉策略-
這是比特幣30分鐘圖。
日線圖目前正在形成 MACD 死叉。
需要謹慎,因爲此倉位存在出現急劇下跌的潛力。
我制定了一套基於橫盤市場、維持通道運行的策略。
*基於紅色手指的運動路徑的多頭持倉策略
1)多頭進場點位:77,309.9 美元 / 若紫色支撐線被跌破則止損
2)多頭第一目標:78,711 美元 -> 目標價格按“頂部、優先”順序排列
雖然整體趨勢表明下方底部區域很可能在形成,
但我還是依據納斯達克的走勢來執行該策略。
如果底部被跌破,達到1號區域的可能性仍然存在。
我每天都會將分析結果以“評論”的形式發佈。
謝謝。
(你可以在我的個人主頁找到鏈接。)
- 點擊“關注”,即可每天更快收到信息。
- 使用 TradingView 上的“重播”按鈕查看結果。
#BTC價格分析# #山寨季# #BTC100K #XRP $ETH $USDT $BTC $GOLD
[9月1日 比特幣K線分析]
BTCUSD 30分鐘圖
*我的分析已針對 TradingView 進行優化。
如果你按下“重播”按鈕,就可以查看實時走勢。
-多頭持倉策略-
這是比特幣30分鐘圖。
日線圖目前正在形成 MACD 死叉。
需要謹慎,因爲此倉位存在出現急劇下跌的潛力。
我制定了一套基於橫盤市場、維持通道運行的策略。
*基於紅色手指的運動路徑的多頭持倉策略
1)多頭進場點位:77,309.9 美元 / 若紫色支撐線被跌破則止損
2)多頭第一目標:78,711 美元 -> 目標價格按“頂部、優先”順序排列
雖然整體趨勢表明下方底部區域很可能在形成,
但我還是依據納斯達克的走勢來執行該策略。
如果底部被跌破,達到1號區域的可能性仍然存在。
我每天都會將分析結果以“評論”的形式發佈。
謝謝。
(你可以在我的個人主頁找到鏈接。)
- 點擊“關注”,即可每天更快收到信息。
- 使用 TradingView 上的“重播”按鈕查看結果。
#BTC價格分析# #山寨季# #BTC100K #XRP $ETH $USDT $BTC $GOLD
BTCUSD 30分鐘圖
*我的分析已針對 TradingView 進行優化。
如果你按下“重播”按鈕,就可以查看實時走勢。
-多頭持倉策略-
這是比特幣30分鐘圖。
日線圖目前正在形成 MACD 死叉。
需要謹慎,因爲此倉位存在出現急劇下跌的潛力。
我制定了一套基於橫盤市場、維持通道運行的策略。
*基於紅色手指的運動路徑的多頭持倉策略
1)多頭進場點位:77,309.9 美元 / 若紫色支撐線被跌破則止損
2)多頭第一目標:78,711 美元 -> 目標價格按“頂部、優先”順序排列
雖然整體趨勢表明下方底部區域很可能在形成,
但我還是依據納斯達克的走勢來執行該策略。
如果底部被跌破,達到1號區域的可能性仍然存在。
我每天都會將分析結果以“評論”的形式發佈。
謝謝。
(你可以在我的個人主頁找到鏈接。)
- 點擊“關注”,即可每天更快收到信息。
- 使用 TradingView 上的“重播”按鈕查看結果。
#BTC價格分析# #山寨季# #BTC100K #XRP $ETH $USDT $BTC $GOLD
79
·
--
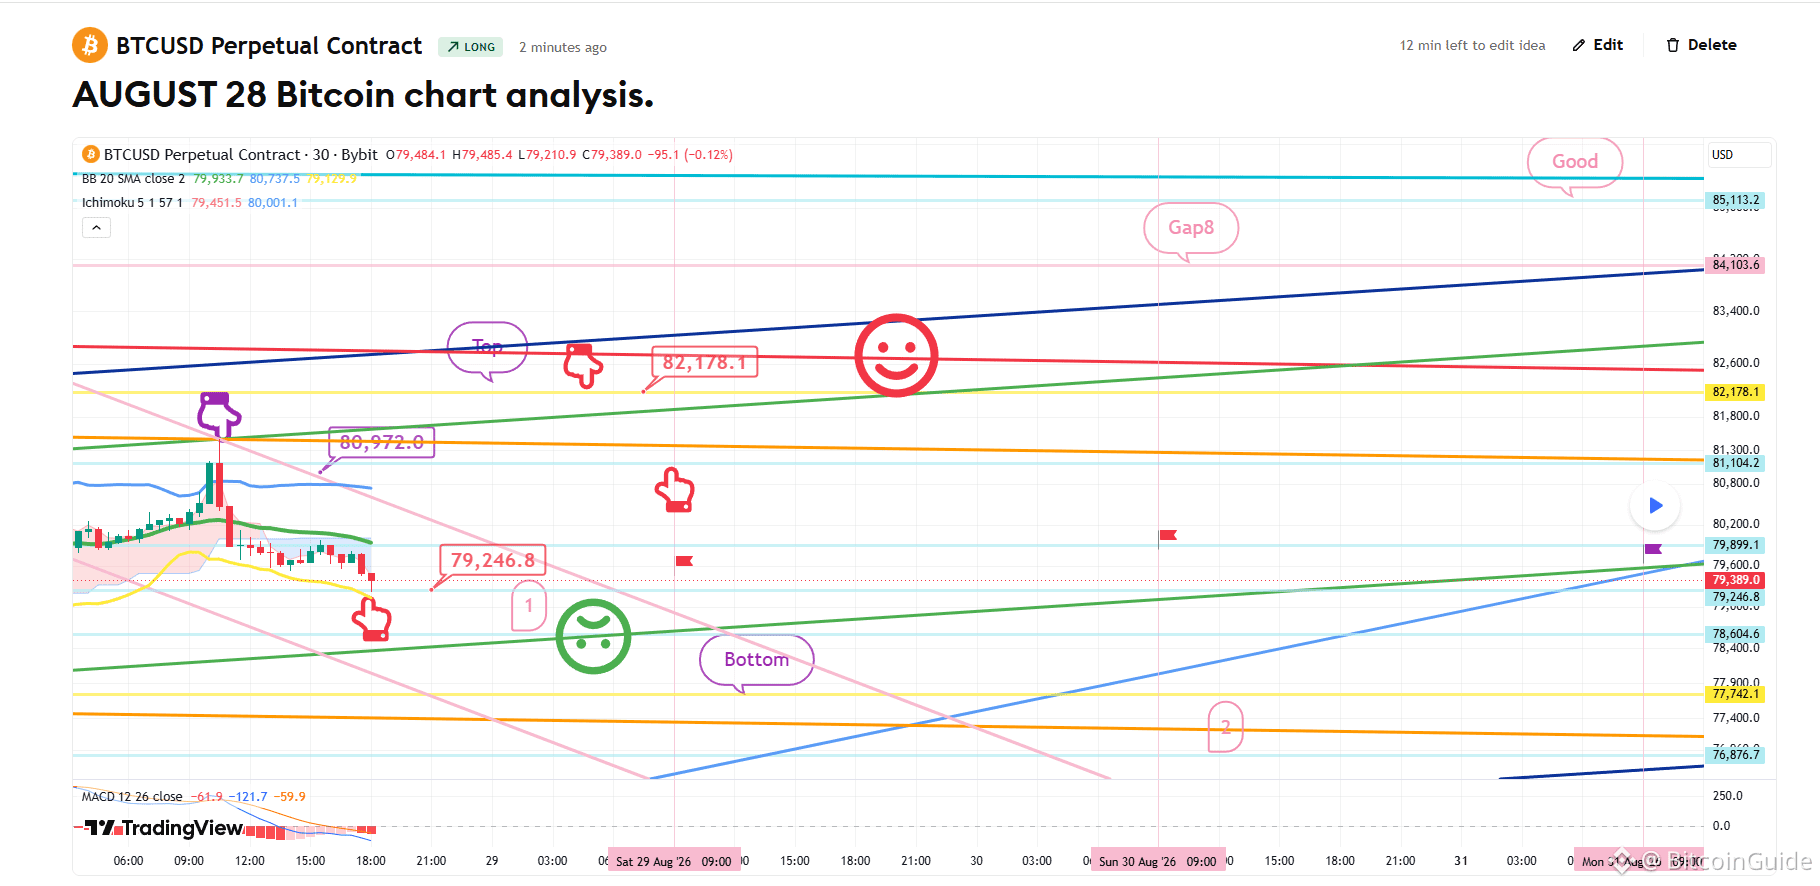
[8月28日 比特幣K線分析]
BTCUSD 30分鐘圖
*我的分析已針對 TradingView 進行優化。
如果你按下回放按鈕,就能查看實時走勢。
-做多倉位策略-
這是比特幣30分鐘圖。
左上角,我用紫色手指標註了上一筆短倉進場點 $80,792。
修正力度比預期更強,是因爲在 26 日觸及6小時布林帶的中軌時,中期形態被打破了——這點我上次已經解釋過。
既然修正很強,我推測你們當中可能有人已經迅速切換到做多倉位,所以我採取了更積極的操作。
*跟隨紅色手指的移動路徑時的追買並做多策略。
1) $79,246.8 做多進場點 / 若綠色支撐線被跌破則止損。
可能會回落到下方的1號區域;我認爲這是做多最安全的進場點。
2) $82,178.1 做多第一目標 -> 週末期間“最佳(Good)”區域內的最高目標價
如果策略成功,那麼 $80.9K 的紅色手指所指區域就是用於重新進場做多的時機。
請務必謹慎,因爲一旦底部線(Bottom)跌破綠色支撐線,底部將展開至2號區域。
我會每天將分析結果發佈爲評論(Comment)。
謝謝。
(你可以在我的主頁找到鏈接。)
- 點擊關注(Follow),每天更快收到信息。
- 在 TradingView 上使用回放按鈕查看結果。
#BTC100K #Altcoin Season# #BTC Price Analysis# #Crypto $USDT $BTC $ETH $XRP
[8月28日 比特幣K線分析]
BTCUSD 30分鐘圖
*我的分析已針對 TradingView 進行優化。
如果你按下回放按鈕,就能查看實時走勢。
-做多倉位策略-
這是比特幣30分鐘圖。
左上角,我用紫色手指標註了上一筆短倉進場點 $80,792。
修正力度比預期更強,是因爲在 26 日觸及6小時布林帶的中軌時,中期形態被打破了——這點我上次已經解釋過。
既然修正很強,我推測你們當中可能有人已經迅速切換到做多倉位,所以我採取了更積極的操作。
*跟隨紅色手指的移動路徑時的追買並做多策略。
1) $79,246.8 做多進場點 / 若綠色支撐線被跌破則止損。
可能會回落到下方的1號區域;我認爲這是做多最安全的進場點。
2) $82,178.1 做多第一目標 -> 週末期間“最佳(Good)”區域內的最高目標價
如果策略成功,那麼 $80.9K 的紅色手指所指區域就是用於重新進場做多的時機。
請務必謹慎,因爲一旦底部線(Bottom)跌破綠色支撐線,底部將展開至2號區域。
我會每天將分析結果發佈爲評論(Comment)。
謝謝。
(你可以在我的主頁找到鏈接。)
- 點擊關注(Follow),每天更快收到信息。
- 在 TradingView 上使用回放按鈕查看結果。
#BTC100K #Altcoin Season# #BTC Price Analysis# #Crypto $USDT $BTC $ETH $XRP
BTCUSD 30分鐘圖
*我的分析已針對 TradingView 進行優化。
如果你按下回放按鈕,就能查看實時走勢。
-做多倉位策略-
這是比特幣30分鐘圖。
左上角,我用紫色手指標註了上一筆短倉進場點 $80,792。
修正力度比預期更強,是因爲在 26 日觸及6小時布林帶的中軌時,中期形態被打破了——這點我上次已經解釋過。
既然修正很強,我推測你們當中可能有人已經迅速切換到做多倉位,所以我採取了更積極的操作。
*跟隨紅色手指的移動路徑時的追買並做多策略。
1) $79,246.8 做多進場點 / 若綠色支撐線被跌破則止損。
可能會回落到下方的1號區域;我認爲這是做多最安全的進場點。
2) $82,178.1 做多第一目標 -> 週末期間“最佳(Good)”區域內的最高目標價
如果策略成功,那麼 $80.9K 的紅色手指所指區域就是用於重新進場做多的時機。
請務必謹慎,因爲一旦底部線(Bottom)跌破綠色支撐線,底部將展開至2號區域。
我會每天將分析結果發佈爲評論(Comment)。
謝謝。
(你可以在我的主頁找到鏈接。)
- 點擊關注(Follow),每天更快收到信息。
- 在 TradingView 上使用回放按鈕查看結果。
#BTC100K #Altcoin Season# #BTC Price Analysis# #Crypto $USDT $BTC $ETH $XRP
64
·
--
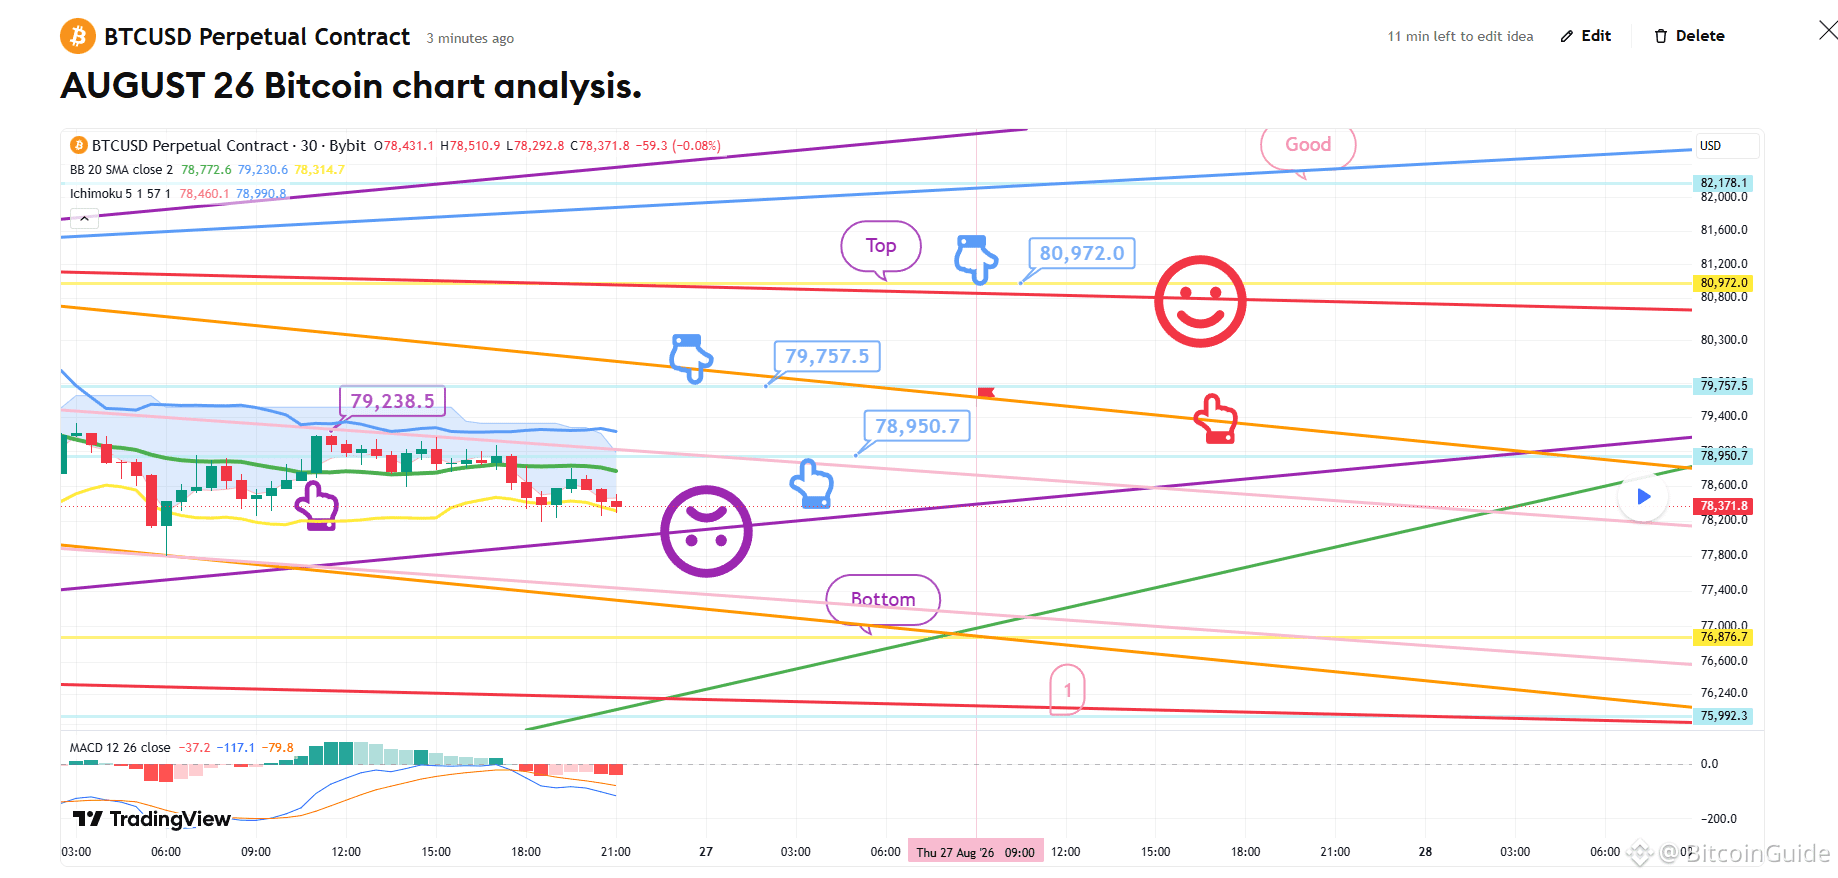
[8月26日比特幣圖表分析]
BTCUSD 30分鐘圖
*我的分析已針對 TradingView 進行優化。
如果你按下重放按鈕,你可以查看實時走勢。
-左側由紫色手指標註,我已將策略完整連接爲:在 25 日進入多單、79.2K 的入場點時的樣子。
12小時圖目前正在形成 MACD 死叉。
*根據淺藍色手指的運行路徑:
空單 -> 多單 -> 雙向中性策略
1)空單入場點:$79,757.5 / 跳出橙色阻力線後的止損
2)切換爲多單:$78,950.7 / 跳出紫色支撐線後的止損
(對維持 79.2K 多單的倉位,同樣適用該止損)
3)切換爲做空:$80,972 / 跳出紅色阻力線後的止損
這是從明天起,在 79.7K 附近重新入場多單時需要使用的區域。
- 如果今天價格到達“Good(良好)”區域,
則不需要操作空單,且今天橫盤波動的可能性很高。
請務必謹慎,因爲一旦跌破紫色支撐線,可能會導致下探至底部 -> 上到 1號區域。
我每天都會把分析結果作爲評論發佈。
謝謝。
(你可以在我的個人資料裏找到鏈接。)
- 點擊關注(Follow),每天獲取更快的信息。
- 在 TradingView 上使用重放按鈕查看結果。
#BTC100K #Altcoin Season# #ETH #BTC價格分析# $CRYPTO $GOLD $XRP $BTC
[8月26日比特幣圖表分析]
BTCUSD 30分鐘圖
*我的分析已針對 TradingView 進行優化。
如果你按下重放按鈕,你可以查看實時走勢。
-左側由紫色手指標註,我已將策略完整連接爲:在 25 日進入多單、79.2K 的入場點時的樣子。
12小時圖目前正在形成 MACD 死叉。
*根據淺藍色手指的運行路徑:
空單 -> 多單 -> 雙向中性策略
1)空單入場點:$79,757.5 / 跳出橙色阻力線後的止損
2)切換爲多單:$78,950.7 / 跳出紫色支撐線後的止損
(對維持 79.2K 多單的倉位,同樣適用該止損)
3)切換爲做空:$80,972 / 跳出紅色阻力線後的止損
這是從明天起,在 79.7K 附近重新入場多單時需要使用的區域。
- 如果今天價格到達“Good(良好)”區域,
則不需要操作空單,且今天橫盤波動的可能性很高。
請務必謹慎,因爲一旦跌破紫色支撐線,可能會導致下探至底部 -> 上到 1號區域。
我每天都會把分析結果作爲評論發佈。
謝謝。
(你可以在我的個人資料裏找到鏈接。)
- 點擊關注(Follow),每天獲取更快的信息。
- 在 TradingView 上使用重放按鈕查看結果。
#BTC100K #Altcoin Season# #ETH #BTC價格分析# $CRYPTO $GOLD $XRP $BTC
BTCUSD 30分鐘圖
*我的分析已針對 TradingView 進行優化。
如果你按下重放按鈕,你可以查看實時走勢。
-左側由紫色手指標註,我已將策略完整連接爲:在 25 日進入多單、79.2K 的入場點時的樣子。
12小時圖目前正在形成 MACD 死叉。
*根據淺藍色手指的運行路徑:
空單 -> 多單 -> 雙向中性策略
1)空單入場點:$79,757.5 / 跳出橙色阻力線後的止損
2)切換爲多單:$78,950.7 / 跳出紫色支撐線後的止損
(對維持 79.2K 多單的倉位,同樣適用該止損)
3)切換爲做空:$80,972 / 跳出紅色阻力線後的止損
這是從明天起,在 79.7K 附近重新入場多單時需要使用的區域。
- 如果今天價格到達“Good(良好)”區域,
則不需要操作空單,且今天橫盤波動的可能性很高。
請務必謹慎,因爲一旦跌破紫色支撐線,可能會導致下探至底部 -> 上到 1號區域。
我每天都會把分析結果作爲評論發佈。
謝謝。
(你可以在我的個人資料裏找到鏈接。)
- 點擊關注(Follow),每天獲取更快的信息。
- 在 TradingView 上使用重放按鈕查看結果。
#BTC100K #Altcoin Season# #ETH #BTC價格分析# $CRYPTO $GOLD $XRP $BTC
71
·
--
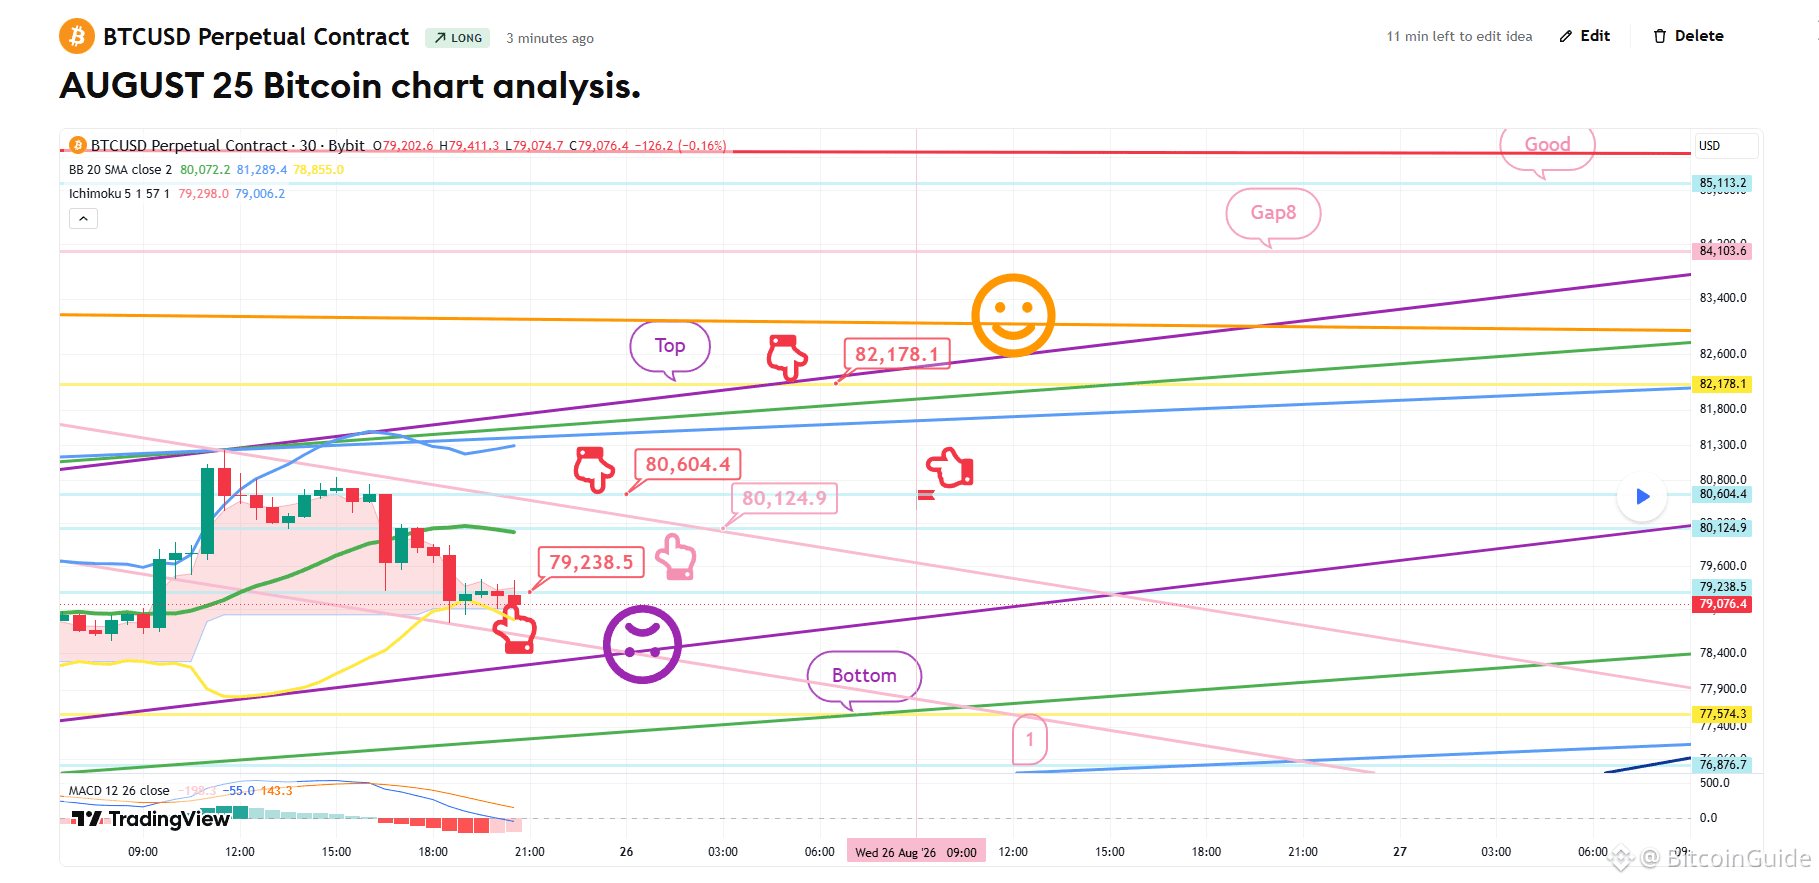
[8月25日 比特幣圖表分析]
BTCUSD 30分鐘圖表
*我的分析已針對 TradingView 進行優化。
如果你點擊回放按鈕,你可以查看實時走勢。
-做多倉位策略-
這是比特幣30分鐘圖表。
11:00 有納斯達克指標發佈。
*基於紅色手指的移動路徑的做多策略
1) 在 $79,238.5 買入 / 若跌破紫色支撐線則止損
2) 做多的第一個目標位在 $82,178.1 頂部區域 -> 按順序依次爲:Gap 8 和 Good 的目標價
- 如果跌破紫色支撐線
請注意價格可能會跌至底部所示的 Bottom 區域 -> 最高到 1 區間。
我每天都會以評論形式發佈分析結果。
謝謝。
(你可以在我的主頁找到鏈接。)
- 點擊關注以便每天更快收到信息。
- 在 TradingView 使用回放按鈕查看結果。
#BTC 價格分析# #山寨幣季# #比特幣 #加密貨幣# $XRP $ETH $BTC $USDT
[8月25日 比特幣圖表分析]
BTCUSD 30分鐘圖表
*我的分析已針對 TradingView 進行優化。
如果你點擊回放按鈕,你可以查看實時走勢。
-做多倉位策略-
這是比特幣30分鐘圖表。
11:00 有納斯達克指標發佈。
*基於紅色手指的移動路徑的做多策略
1) 在 $79,238.5 買入 / 若跌破紫色支撐線則止損
2) 做多的第一個目標位在 $82,178.1 頂部區域 -> 按順序依次爲:Gap 8 和 Good 的目標價
- 如果跌破紫色支撐線
請注意價格可能會跌至底部所示的 Bottom 區域 -> 最高到 1 區間。
我每天都會以評論形式發佈分析結果。
謝謝。
(你可以在我的主頁找到鏈接。)
- 點擊關注以便每天更快收到信息。
- 在 TradingView 使用回放按鈕查看結果。
#BTC 價格分析# #山寨幣季# #比特幣 #加密貨幣# $XRP $ETH $BTC $USDT
BTCUSD 30分鐘圖表
*我的分析已針對 TradingView 進行優化。
如果你點擊回放按鈕,你可以查看實時走勢。
-做多倉位策略-
這是比特幣30分鐘圖表。
11:00 有納斯達克指標發佈。
*基於紅色手指的移動路徑的做多策略
1) 在 $79,238.5 買入 / 若跌破紫色支撐線則止損
2) 做多的第一個目標位在 $82,178.1 頂部區域 -> 按順序依次爲:Gap 8 和 Good 的目標價
- 如果跌破紫色支撐線
請注意價格可能會跌至底部所示的 Bottom 區域 -> 最高到 1 區間。
我每天都會以評論形式發佈分析結果。
謝謝。
(你可以在我的主頁找到鏈接。)
- 點擊關注以便每天更快收到信息。
- 在 TradingView 使用回放按鈕查看結果。
#BTC 價格分析# #山寨幣季# #比特幣 #加密貨幣# $XRP $ETH $BTC $USDT
93
·
--
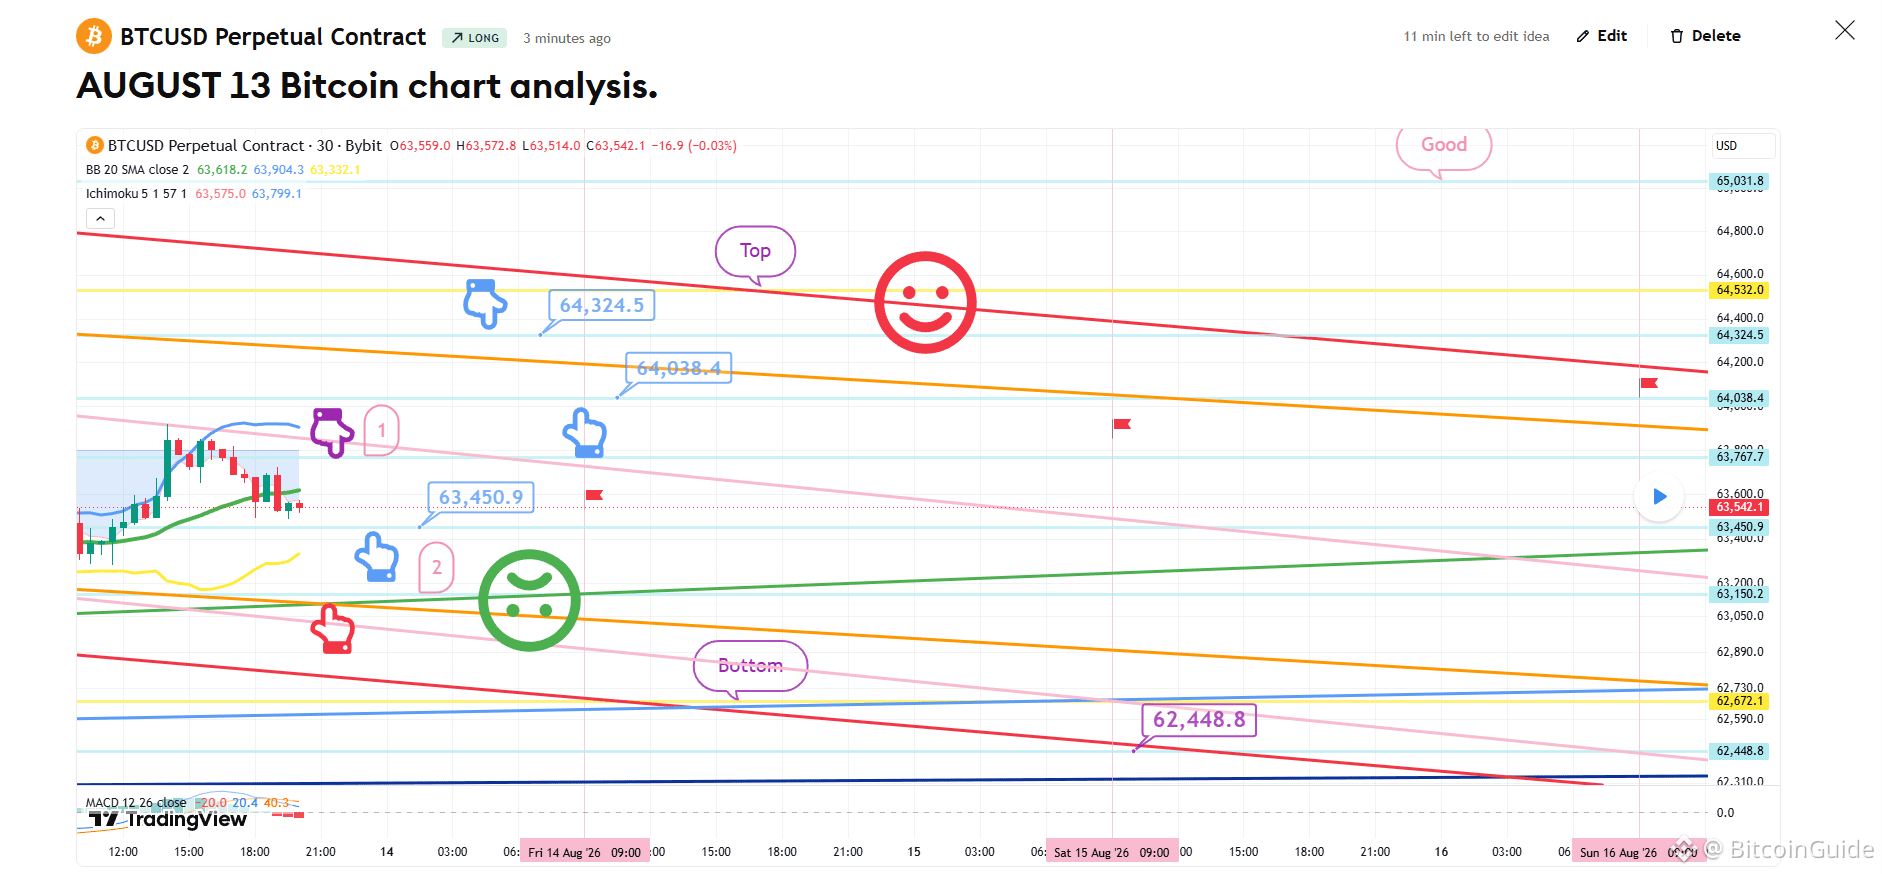
[8月13日 比特幣走勢分析]
BTCUSD 30分鐘圖表
*我的分析已針對 TradingView 優化。
如果你按下重播按鈕,就能查看即時走勢。
-多頭部位策略-
至於那斯達克,由於 12 小時圖表出現 MACD 死亡交叉,
因此高度可能會在明天之前進行盤整。
*多頭部位策略(紫色手指在頂部觸碰 1 的時段)
1) 確認紫色手指區 1 觸碰到 $63.7K 之後,
多頭部位的進場點為 $63,450.9(淺藍色手指)/ 若綠色支撐線被跌破則止損。
2) $64,324.5 是多頭部位的第一個目標 -> 目標價格依序為:頂部、良好。
- 若達到 $64.3K 目標價,則使用 $64,038.4 區間重新進場做多。
3) 若價格未能觸及區 1 並立即下跌:
多頭部位的進場點為底部紅色手指區 2 的 $63,150.2 / 若綠色支撐線被跌破則止損 -> 剩餘目標價格維持不變。
- 底部區塊位於中期上升趨勢線,因此
若其跌破則不建議,因為可能會出現進一步下跌。
上限開放至最高 $62,448.8。
請將我的分析貼文僅作為參考,並用於實務用途。
我希望你能透過嚴格遵守交易原則與停損指令來安全操作。
我每天都會以「留言(Comment)」形式發布分析結果。
謝謝。
(你可以在我的個人資料中找到連結。)
- 點擊「追蹤(Follow)」以便每天更快收到資訊。
- 透過 TradingView 的重播按鈕查看結果。
#Crypto #BTC100K #Altcoin Season# #BTC Price Analysis# $ETH $USDT $BTC $USDT
[8月13日 比特幣走勢分析]
BTCUSD 30分鐘圖表
*我的分析已針對 TradingView 優化。
如果你按下重播按鈕,就能查看即時走勢。
-多頭部位策略-
至於那斯達克,由於 12 小時圖表出現 MACD 死亡交叉,
因此高度可能會在明天之前進行盤整。
*多頭部位策略(紫色手指在頂部觸碰 1 的時段)
1) 確認紫色手指區 1 觸碰到 $63.7K 之後,
多頭部位的進場點為 $63,450.9(淺藍色手指)/ 若綠色支撐線被跌破則止損。
2) $64,324.5 是多頭部位的第一個目標 -> 目標價格依序為:頂部、良好。
- 若達到 $64.3K 目標價,則使用 $64,038.4 區間重新進場做多。
3) 若價格未能觸及區 1 並立即下跌:
多頭部位的進場點為底部紅色手指區 2 的 $63,150.2 / 若綠色支撐線被跌破則止損 -> 剩餘目標價格維持不變。
- 底部區塊位於中期上升趨勢線,因此
若其跌破則不建議,因為可能會出現進一步下跌。
上限開放至最高 $62,448.8。
請將我的分析貼文僅作為參考,並用於實務用途。
我希望你能透過嚴格遵守交易原則與停損指令來安全操作。
我每天都會以「留言(Comment)」形式發布分析結果。
謝謝。
(你可以在我的個人資料中找到連結。)
- 點擊「追蹤(Follow)」以便每天更快收到資訊。
- 透過 TradingView 的重播按鈕查看結果。
#Crypto #BTC100K #Altcoin Season# #BTC Price Analysis# $ETH $USDT $BTC $USDT
BTCUSD 30分鐘圖表
*我的分析已針對 TradingView 優化。
如果你按下重播按鈕,就能查看即時走勢。
-多頭部位策略-
至於那斯達克,由於 12 小時圖表出現 MACD 死亡交叉,
因此高度可能會在明天之前進行盤整。
*多頭部位策略(紫色手指在頂部觸碰 1 的時段)
1) 確認紫色手指區 1 觸碰到 $63.7K 之後,
多頭部位的進場點為 $63,450.9(淺藍色手指)/ 若綠色支撐線被跌破則止損。
2) $64,324.5 是多頭部位的第一個目標 -> 目標價格依序為:頂部、良好。
- 若達到 $64.3K 目標價,則使用 $64,038.4 區間重新進場做多。
3) 若價格未能觸及區 1 並立即下跌:
多頭部位的進場點為底部紅色手指區 2 的 $63,150.2 / 若綠色支撐線被跌破則止損 -> 剩餘目標價格維持不變。
- 底部區塊位於中期上升趨勢線,因此
若其跌破則不建議,因為可能會出現進一步下跌。
上限開放至最高 $62,448.8。
請將我的分析貼文僅作為參考,並用於實務用途。
我希望你能透過嚴格遵守交易原則與停損指令來安全操作。
我每天都會以「留言(Comment)」形式發布分析結果。
謝謝。
(你可以在我的個人資料中找到連結。)
- 點擊「追蹤(Follow)」以便每天更快收到資訊。
- 透過 TradingView 的重播按鈕查看結果。
#Crypto #BTC100K #Altcoin Season# #BTC Price Analysis# $ETH $USDT $BTC $USDT
89
·
--
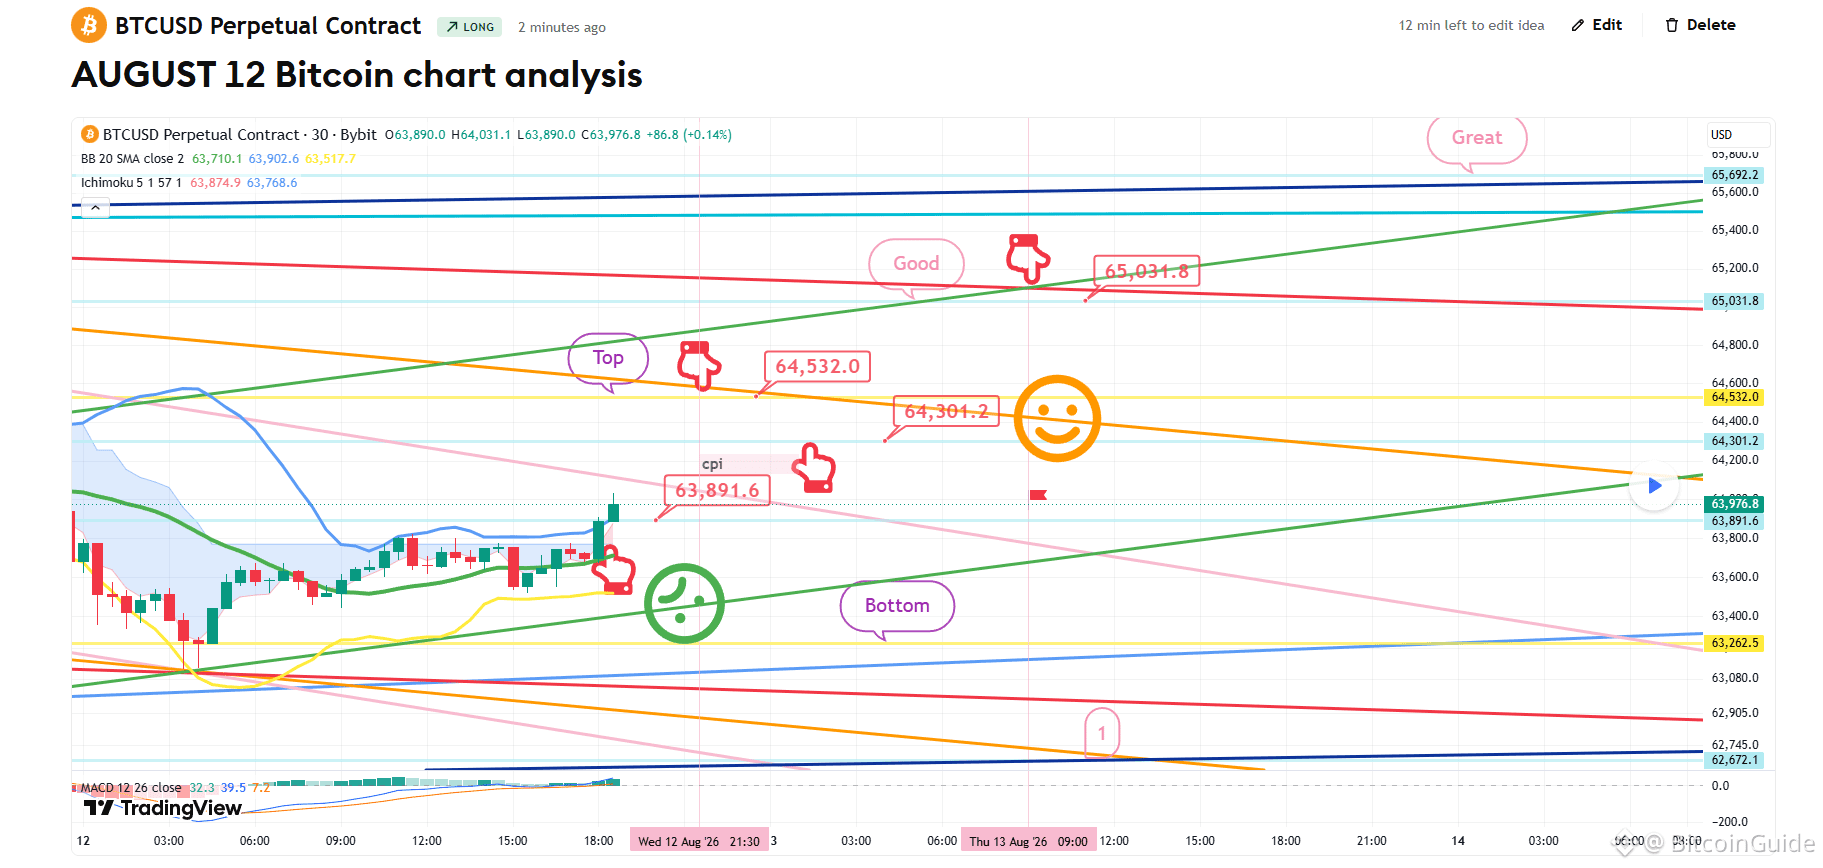
[8月12日 比特幣K線分析]
BTCUSD 30分鐘K線圖
*我的分析已針對 TradingView 進行最佳化。
如果你按下重播按鈕,就可以查看即時走勢。
-多單策略-
CPI 指標將在 9:30 即將發布。
*這是一個追隨價格沿著紅色手指移動路徑的多單策略。
1) 多單進場點位在 $63,891.6 / 若綠色支撐線被跌破則停損。
2) 多單第一目標價在 $64,532 -> 良好第二目標。
- 若策略成功,則使用 64.3K 區間重新進場多單。
- 明天之後的「偉大區間」最終目標價。
若綠色支撐線被跌破,
請小心,因為下方第一個區間是向下開放的。
考量近期參與率與天氣炎熱,若今天發生停損,我這週會暫停發布分析文章。
我每天會以「評論」的形式發布分析結果。
謝謝。
(你可以在我的個人資料中找到連結。)
- 點擊追蹤以便每天更快獲得資訊。
- 使用 TradingView 的重播按鈕查看結果。
#BTC100K #Altcoin Season# #BTC Price Analysis# #BNBChain# $BTC $ETH $USDT $ALT $XRP
[8月12日 比特幣K線分析]
BTCUSD 30分鐘K線圖
*我的分析已針對 TradingView 進行最佳化。
如果你按下重播按鈕,就可以查看即時走勢。
-多單策略-
CPI 指標將在 9:30 即將發布。
*這是一個追隨價格沿著紅色手指移動路徑的多單策略。
1) 多單進場點位在 $63,891.6 / 若綠色支撐線被跌破則停損。
2) 多單第一目標價在 $64,532 -> 良好第二目標。
- 若策略成功,則使用 64.3K 區間重新進場多單。
- 明天之後的「偉大區間」最終目標價。
若綠色支撐線被跌破,
請小心,因為下方第一個區間是向下開放的。
考量近期參與率與天氣炎熱,若今天發生停損,我這週會暫停發布分析文章。
我每天會以「評論」的形式發布分析結果。
謝謝。
(你可以在我的個人資料中找到連結。)
- 點擊追蹤以便每天更快獲得資訊。
- 使用 TradingView 的重播按鈕查看結果。
#BTC100K #Altcoin Season# #BTC Price Analysis# #BNBChain# $BTC $ETH $USDT $ALT $XRP
BTCUSD 30分鐘K線圖
*我的分析已針對 TradingView 進行最佳化。
如果你按下重播按鈕,就可以查看即時走勢。
-多單策略-
CPI 指標將在 9:30 即將發布。
*這是一個追隨價格沿著紅色手指移動路徑的多單策略。
1) 多單進場點位在 $63,891.6 / 若綠色支撐線被跌破則停損。
2) 多單第一目標價在 $64,532 -> 良好第二目標。
- 若策略成功,則使用 64.3K 區間重新進場多單。
- 明天之後的「偉大區間」最終目標價。
若綠色支撐線被跌破,
請小心,因為下方第一個區間是向下開放的。
考量近期參與率與天氣炎熱,若今天發生停損,我這週會暫停發布分析文章。
我每天會以「評論」的形式發布分析結果。
謝謝。
(你可以在我的個人資料中找到連結。)
- 點擊追蹤以便每天更快獲得資訊。
- 使用 TradingView 的重播按鈕查看結果。
#BTC100K #Altcoin Season# #BTC Price Analysis# #BNBChain# $BTC $ETH $USDT $ALT $XRP
75
·
--
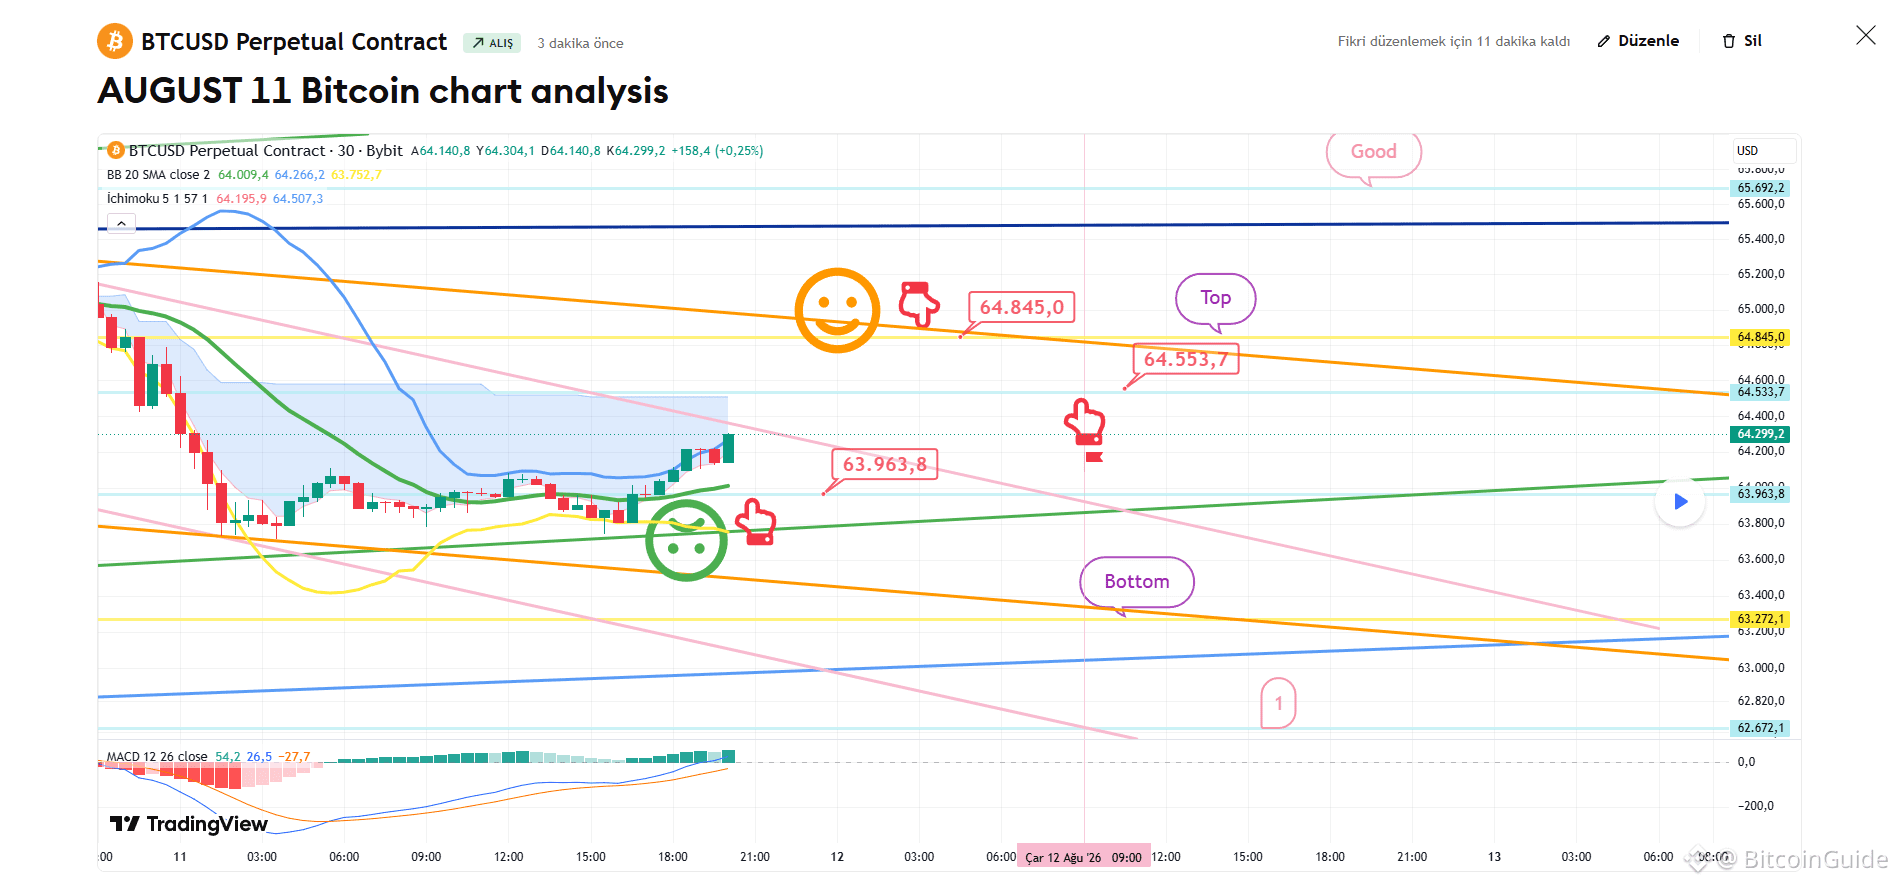
[8月11日 比特幣圖表分析]
BTCUSD 30分鐘圖表
*我的分析已針對 TradingView 進行最佳化。
如果你按下重播按鈕,你可以查看即時走勢。
-多單策略-
目前,12小時與日線圖上正在進行 MACD 死叉。
從此刻開始,這裡是進行空單的最佳進場區。
*這是依照紅色手指所指示的移動路徑來進行的多單策略。
1) $63,963.8 多單進場區 / 若跌破綠色支撐線則止損
2) $64,845 多單第一目標 -> 好的第二目標
- 若策略成功,$64.5K 將作為多單的再進場區。
- 當觸及「好的」區域時,日線圖上的 MACD 死叉將被忽略。
請務必小心,因為綠色支撐線以下的區域將打開通往底部 -> 直到區間 1。
我每天會以評論形式發布分析結果。
謝謝。
(你可以在我的個人檔案中找到連結。)
- 點擊追蹤以便每天更快收到資訊。
- 請使用 TradingView 的重播按鈕查看結果。
#BTC 價格分析# #加密貨幣 #山寨季# #BTC100K $USDT $BTC $GOLD $XRP $ETH
[8月11日 比特幣圖表分析]
BTCUSD 30分鐘圖表
*我的分析已針對 TradingView 進行最佳化。
如果你按下重播按鈕,你可以查看即時走勢。
-多單策略-
目前,12小時與日線圖上正在進行 MACD 死叉。
從此刻開始,這裡是進行空單的最佳進場區。
*這是依照紅色手指所指示的移動路徑來進行的多單策略。
1) $63,963.8 多單進場區 / 若跌破綠色支撐線則止損
2) $64,845 多單第一目標 -> 好的第二目標
- 若策略成功,$64.5K 將作為多單的再進場區。
- 當觸及「好的」區域時,日線圖上的 MACD 死叉將被忽略。
請務必小心,因為綠色支撐線以下的區域將打開通往底部 -> 直到區間 1。
我每天會以評論形式發布分析結果。
謝謝。
(你可以在我的個人檔案中找到連結。)
- 點擊追蹤以便每天更快收到資訊。
- 請使用 TradingView 的重播按鈕查看結果。
#BTC 價格分析# #加密貨幣 #山寨季# #BTC100K $USDT $BTC $GOLD $XRP $ETH
BTCUSD 30分鐘圖表
*我的分析已針對 TradingView 進行最佳化。
如果你按下重播按鈕,你可以查看即時走勢。
-多單策略-
目前,12小時與日線圖上正在進行 MACD 死叉。
從此刻開始,這裡是進行空單的最佳進場區。
*這是依照紅色手指所指示的移動路徑來進行的多單策略。
1) $63,963.8 多單進場區 / 若跌破綠色支撐線則止損
2) $64,845 多單第一目標 -> 好的第二目標
- 若策略成功,$64.5K 將作為多單的再進場區。
- 當觸及「好的」區域時,日線圖上的 MACD 死叉將被忽略。
請務必小心,因為綠色支撐線以下的區域將打開通往底部 -> 直到區間 1。
我每天會以評論形式發布分析結果。
謝謝。
(你可以在我的個人檔案中找到連結。)
- 點擊追蹤以便每天更快收到資訊。
- 請使用 TradingView 的重播按鈕查看結果。
#BTC 價格分析# #加密貨幣 #山寨季# #BTC100K $USDT $BTC $GOLD $XRP $ETH
72
登入以探索更多內容
加入幣安廣場中的全球加密貨幣用戶
⚡️ 獲取加密貨幣的最新和實用資訊。
💬 受到全球最大加密貨幣交易所的信任。
👍 發掘來自經過驗證創作者的真實見解。
電子郵件 / 電話號碼
熱門話題
币安推出BinanceIntelligence
1.5M 次瀏覽
2,736 討論中
#币安推出BinanceIntelligence 昨天全程聽完了一姐的AMA,不得不說一姐真的太拼了,懷孕了還在每天高強度工作。這次bn的新產品,確實也有點東西。
對於普通用戶來說,平時刷新聞、盯行情、看各種分析,信息看了一大堆,最後還是會困惑:這條消息到底是利好還是利空?
Binance Intelligence這次是根據不同用戶類型找準了痛點:
1.瞭解市場(給所有人)
Binance AI會在App裏提供個性化市場分析,包括市場簡報、資產跟蹤、智能提醒和盈虧回顧,簡報還可以直接聽音頻。
對我來說,這部分最實用的地方就是省時間。不用每天在一堆消息裏翻來翻去,先看看哪些值得關注、哪些跟自己的持倉有關,再決定要不要深入研究。
2.把想法變成策略(給交易者)
比如,你想“監測持倉有沒有明顯變化”,AI Pro的方向是把這類自然語言需求,變成可以查看、修改的工作流,並在你設置的限制內運行。
它介紹了模擬交易能力,讓你有機會先用虛擬資金試一試,可以過過高倍槓桿的癮。
不過,新版AI Pro預計要等到10月下旬才能上線,現在還在內測階段。
3.支持把常用AI接入幣安(給開發者)
Agent OS可以讓兼容的外部AI工具,在授權後查詢行情、查看持倉,甚至進行交易操作。
看到這裏,估計有人跟我一樣,第一反應是:AI會不會亂動我的錢?
我查了下,官方MCP接入文檔寫明:Agent在獨立子賬戶內操作,需要你手動轉入資金,沒有提現權限;下單、撤單、內部劃轉等操作需要先獲得你的確認。
當然,這不代表交給AI就沒風險了。別想着有了AI制定策略,就能次次精準抄底逃頂。畢竟交易是一個長期、動態的博弈過程,行情不會因爲你用了AI就變得好猜。
價格這一塊,Binance AI是免費使用的、AI Pro採用免費+付費模式,價格爲19.99 U/月,更適合高頻交易者。
华尔街Alex
·42 人按讚
·102.1k 次瀏覽
Evernorth推迟纳斯达克上市至10月12日
44,518 次瀏覽
73 討論中
美联储纪要聚焦10月暂停加息
181,610 次瀏覽
434 討論中