



If you hold or plan to hold stock tokens, this chapter answers three questions. Is the price you pay fair? Where did the dividends go? And does the onchain price on weekends carry any information?
A Conclusion We Almost Got Wrong
The most natural first step in studying stock tokens is to put the onchain price next to the price of the underlying shares. We compared GeckoTerminal's hourly candles (the SPY/USDG pool) with Yahoo Finance's 60-minute SPY bars (including pre-market and after-hours), and the first result was clear: the SPY token was almost always more expensive than the shares, with the median holding steady at about +20 basis points from mid-September. It was more expensive during trading hours, at night, and on weekends, by roughly the same amount.
That makes for a neat conclusion: there is a persistent onchain premium, and buying stock tokens costs an extra 0.2%.
The conclusion is wrong. The ruler was wrong.
How Many Shares Is One Token?
Robinhood's stock-token contracts include a function called uiMultiplier(). It returns a multiplier: how many underlying shares one token represents.
At launch, every token's multiplier was 1.0. Since then, whenever the underlying stock pays a dividend, Robinhood does not pay cash to token holders. Instead it raises the multiplier, reinvesting the dividend. We used the RPC to read the current multiplier and every change event for seven major tokens:
SPY: Current multiplier: 1.001718; Effective date: 2026-09-18; Dividend: $1.889; Dividend ÷ share price: 24.79 bp; Multiplier increase ÷ dividend yield: 0.693
QQQ: Current multiplier: 1.000701; Effective date: 2026-09-22; Dividend: $0.751; Dividend ÷ share price: 10.11 bp; Multiplier increase ÷ dividend yield: 0.693
NVDA: Current multiplier: 1.000775; Effective date: 2026-09-10; Dividend: $0.25; Dividend ÷ share price: 11.18 bp; Multiplier increase ÷ dividend yield: 0.694
META: Current multiplier: 1.000541; Effective date: 2026-09-21; Dividend: $0.525; Dividend ÷ share price: 7.85 bp; Multiplier increase ÷ dividend yield: 0.689
MU: Current multiplier: 1.000183; Effective date: Twice: Jul. 24, Oct. 14; Dividend: $0.15 each; Dividend ÷ share price: 1.57 bp (October); Multiplier increase ÷ dividend yield: 0.690
GOOGL: Current multiplier: 1.000194; Effective date: 2026-09-15; Dividend: $0.22; Dividend ÷ share price: —; Multiplier increase ÷ dividend yield: —
TSLA: Current multiplier: 1.0; Effective date: None; Dividend: No dividend; Dividend ÷ share price: —; Multiplier increase ÷ dividend yield: —
So after September 18, one SPY token represents 1.001718 SPY shares. Multiply the share price by this multiplier before comparing, and most of the "persistent premium" disappears (Figure 2-3).
The last column was an unexpected bonus. For all five tokens, the multiplier increase is almost exactly 0.69 times the dividend yield. In other words, about 31% of the dividend is deducted before it is reinvested. The most plausible explanation is the 30% U.S. withholding tax on dividends paid to non-U.S. persons (the stock-token offering documents mention withholding tax and Section 871(m)), plus about 1% in processing costs.
For long-term holders, this is a real cost:
SPY's annual dividend yield is about 1.0%. Token holders actually receive about 0.69%, about 0.31 percentage points less every year.
An investor who opens an account in a country with a tax treaty (15% withholding) and holds SPY directly loses only about 0.15 percentage points a year.
Stocks that pay no dividend (TSLA) are unaffected; high-dividend stocks are affected the most.
Stock-token dividends do not vanish. They are cut by about 30% and then quietly turned into more shares.
After Calibration: Tight in Trading Hours, a Premium Only on Weekends
After correcting for the multiplier, we recomputed all the hourly data for seven tokens from launch to November 2 (1,600 to 2,800 hours per token, excluding hours with less than $500 of volume) and grouped the data into three periods:
Trading hours: hours when U.S. shares have quotes, including pre-market and after-hours;
Weekday nights: from the U.S. close to the next day's pre-market;
Weekends: from the end of Friday after-hours to the start of Monday pre-market.
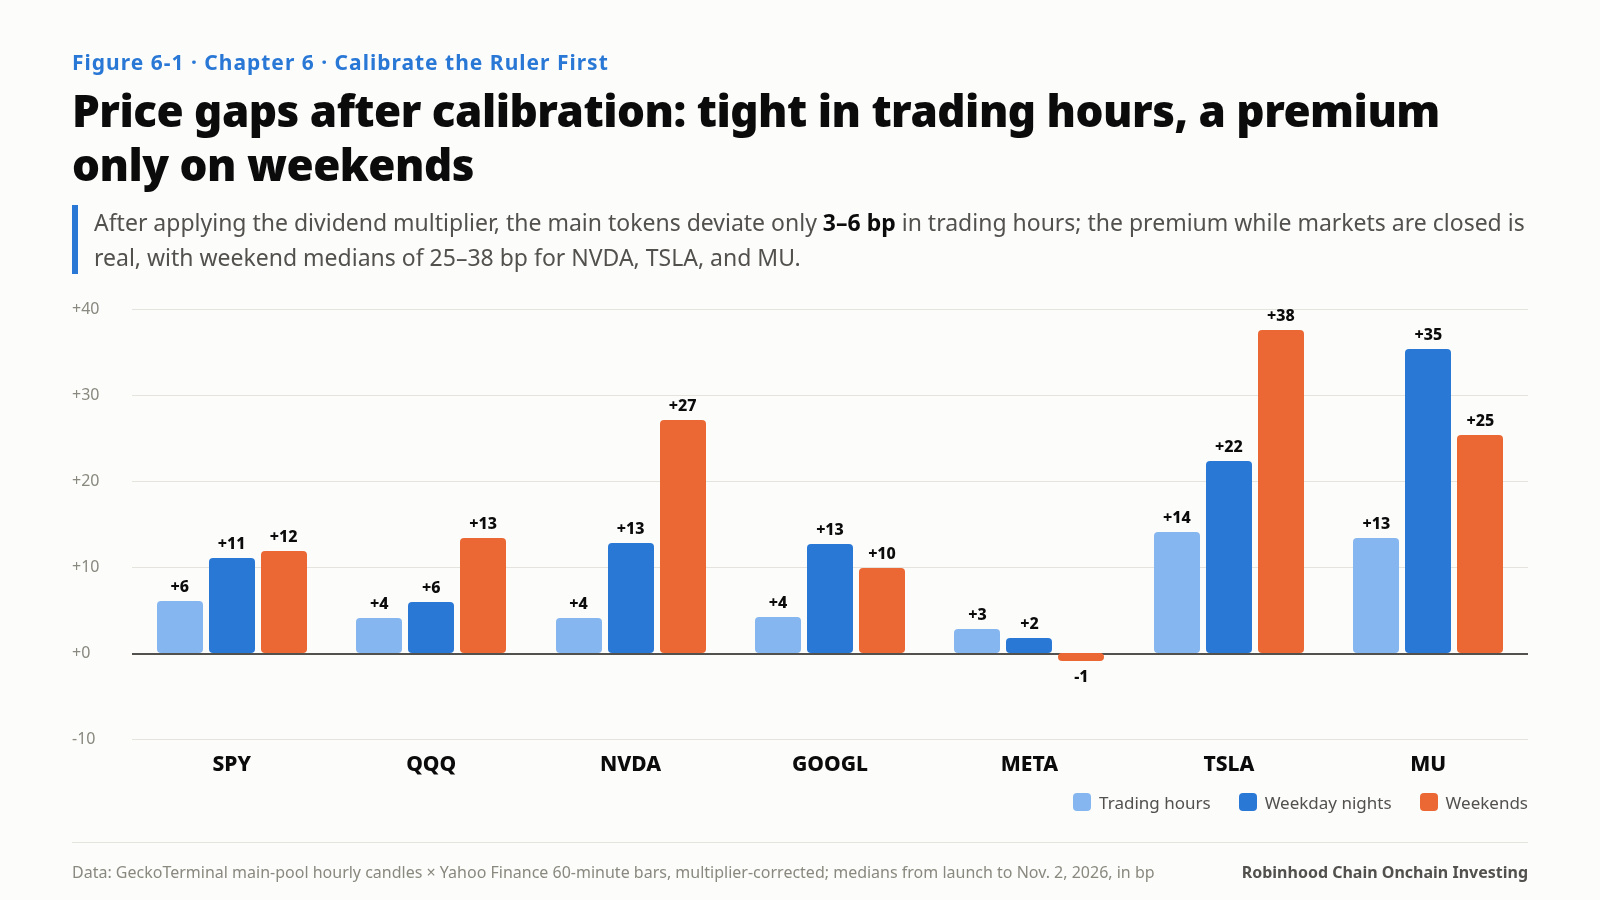
SPY (USDG 0.3%): Trading hours: +6.0 bp; Weekday nights: +11.0 bp; Weekends: +11.8 bp; Weekend P95: 83 bp
QQQ (USDG 0.05%): Trading hours: +4.0 bp; Weekday nights: +5.9 bp; Weekends: +13.3 bp; Weekend P95: 88 bp
NVDA (USDG 0.05%): Trading hours: +4.0 bp; Weekday nights: +12.7 bp; Weekends: +27.1 bp; Weekend P95: 258 bp
GOOGL (USDG 0.05%): Trading hours: +4.2 bp; Weekday nights: +12.6 bp; Weekends: +9.8 bp; Weekend P95: 143 bp
META (USDG 0.3%): Trading hours: +2.8 bp; Weekday nights: +1.7 bp; Weekends: −1.0 bp; Weekend P95: 147 bp
TSLA (USDG 0.3%): Trading hours: +14.0 bp; Weekday nights: +22.3 bp; Weekends: +37.5 bp; Weekend P95: 150 bp
MU (USDG 0.3%): Trading hours: +13.3 bp; Weekday nights: +35.3 bp; Weekends: +25.3 bp; Weekend P95: 321 bp
(Values are median deviations of the token price from the shares, after multiplier correction. P95 is the 95th percentile of the absolute deviation.)
Three conclusions:
1. Spreads during trading hours are tight. When U.S. shares are quoted, the main tokens deviate by a median of only 3–6 bp, a fraction of the pool fee. This shows that arbitrageurs are watching: when the shares can trade, token prices are pulled in close. TSLA and MU are slightly wider (about 13–14 bp); their main pools charge 0.3%, which raises the bar for arbitrage.
2. There is a real premium while the market is closed. After correction, the weekend premium actually comes into view: about 27 bp for NVDA, about 38 bp for TSLA, about 25 bp for MU, and about 12–13 bp for SPY and QQQ. META is the exception, with a median weekend deviation near zero.
3. The tails are wide. The 95th percentile of weekend deviation is about 83 bp for SPY and more than 250 bp for NVDA and MU. In other words, in one of every twenty weekend hours, the price deviates by more than that.
Why is there a weekend premium? The most direct explanation is one-sided demand. When U.S. markets are closed, anyone who wants to buy can only buy onchain, and few market makers can hedge (the shares cannot trade, so hedging can only be done with perpetuals or by waiting until Monday). Market makers carry a whole weekend of price risk and naturally demand compensation. The premium is the price of weekend liquidity.
Do Weekend Prices Carry Information?
If weekend onchain prices are only noise, the premium is a pure cost. If they contain information, they are a signal.
We ran a test. For each weekend, we calculated the token's move from the last Friday quote of the shares to early Monday (about 3 hours before pre-market trading in the shares begins), and compared it with the gap between Friday's close and the first pre-market quote of the shares on Monday.
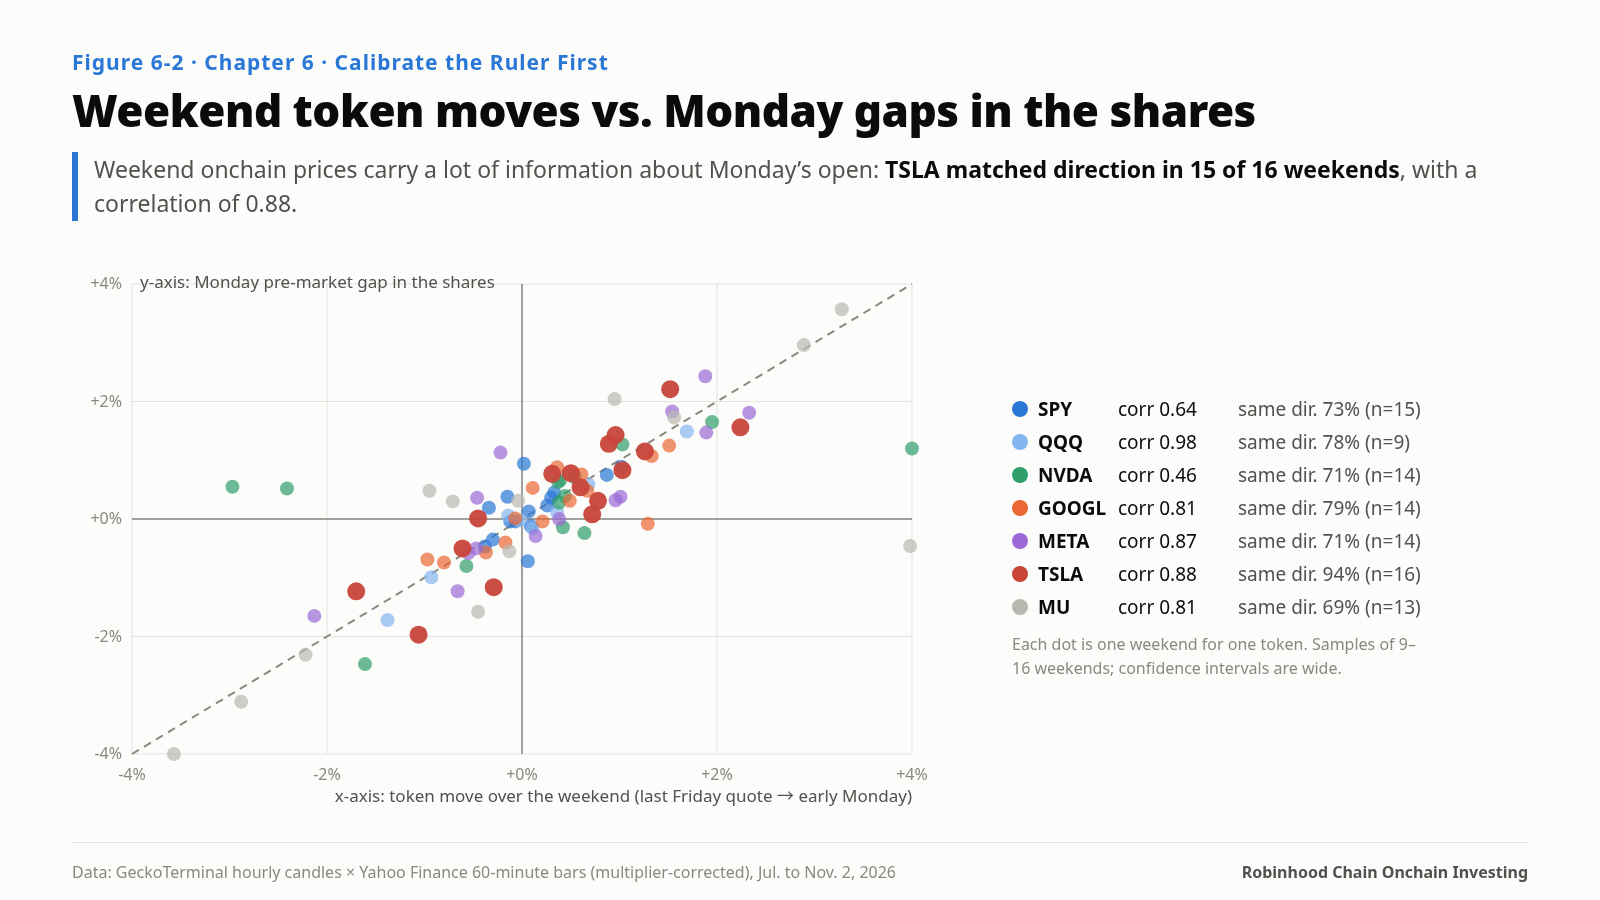
TSLA: Weekends: 16; Correlation: 0.88; Same direction: 94%
QQQ: Weekends: 9; Correlation: 0.98; Same direction: 78%
META: Weekends: 14; Correlation: 0.87; Same direction: 71%
GOOGL: Weekends: 14; Correlation: 0.81; Same direction: 79%
MU: Weekends: 13; Correlation: 0.81; Same direction: 69%
SPY: Weekends: 15; Correlation: 0.64; Same direction: 73%
NVDA: Weekends: 14; Correlation: 0.46; Same direction: 71%
Weekend onchain prices carry a great deal of information about Monday's open. TSLA is the clearest case: in 15 of 16 weekends, the direction of the token's weekend move matched the direction of the Monday gap.
Two limits need to be stated. First, the samples cover only 9 to 16 weekends, so the confidence intervals around the correlations are wide, especially for QQQ, with only 9. Second, the test shows that "weekend prices reflect weekend news," not that "weekend prices let you make money on Monday." By the time you can trade the shares in Monday's pre-market, the gap has already happened. Its usefulness lies elsewhere (see below).
What This Means for Holders
Putting the three findings together:
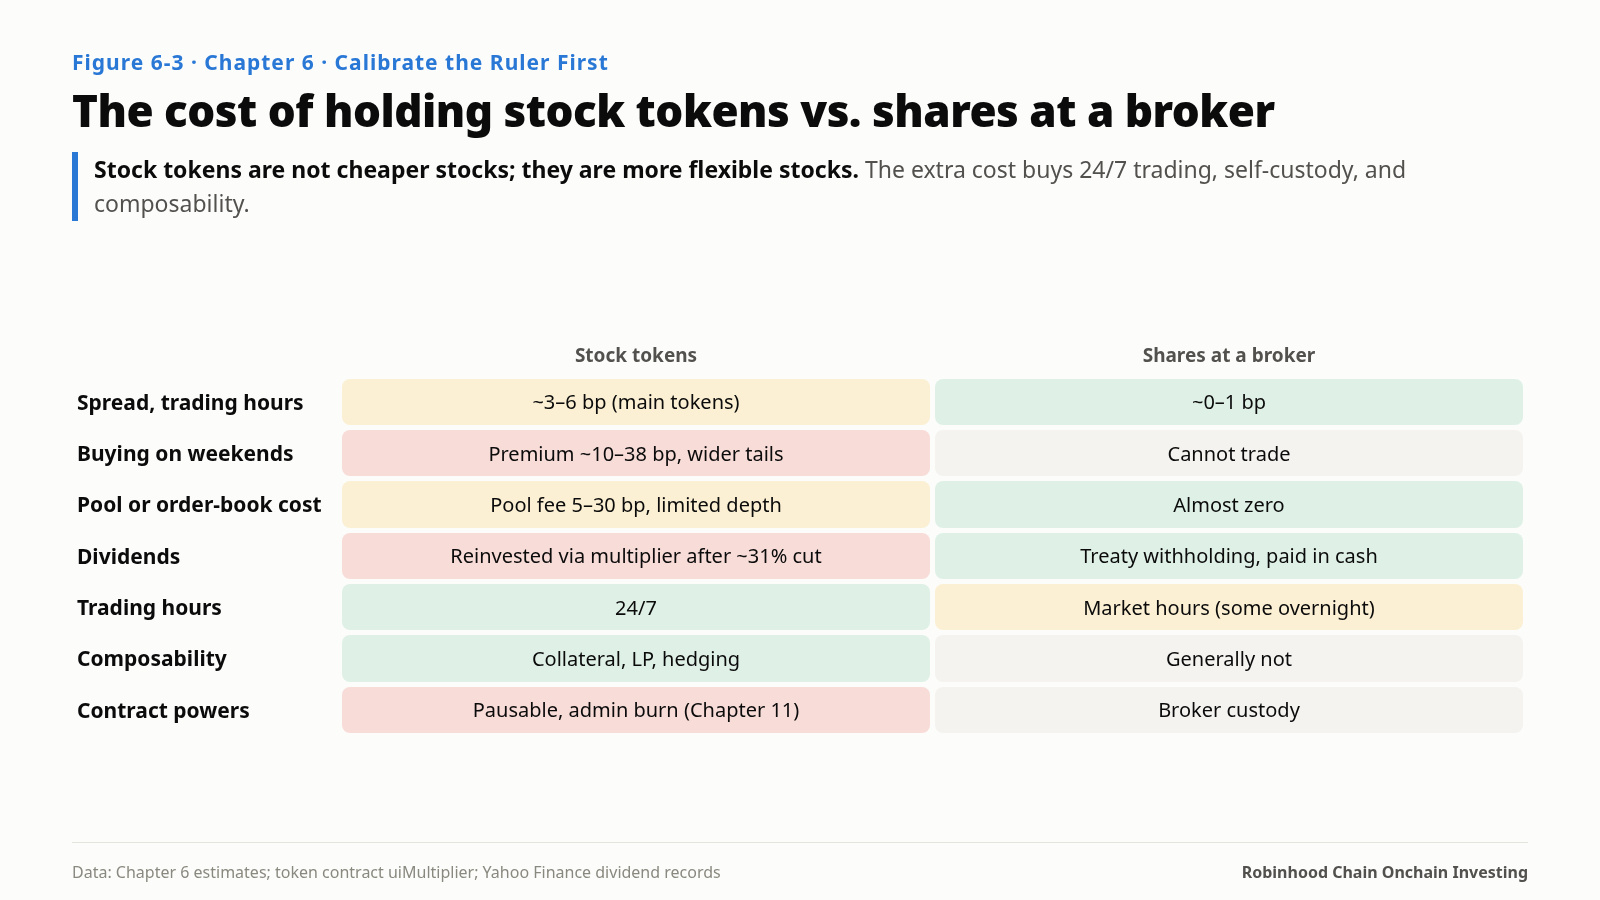
Spread when buying in trading hours: Stock tokens: ~3–6 bp (main tokens); Shares held at a broker: ~0–1 bp
Premium when buying on weekends: Stock tokens: ~10–38 bp, wider tails; Shares held at a broker: Cannot trade
Pool or order-book cost: Stock tokens: 5–30 bp (pool fee), limited depth; Shares held at a broker: Almost zero
Dividends: Stock tokens: Reinvested via multiplier after ~31% deduction; Shares held at a broker: Withheld per tax treaty, paid in cash
Trading hours: Stock tokens: 24/7; Shares held at a broker: Market hours (some overnight sessions)
Composability: Stock tokens: Can be collateral, go in pools, be hedged; Shares held at a broker: Generally not
Stock tokens are not cheaper stocks. They are more flexible stocks. The extra cost buys 24/7 trading, self-custody, and composability. Whether that is worth it depends on whether you use them.
If You Trade or Hold Stock Tokens
Always apply the multiplier first. Calibrate every price comparison and every "premium" judgment with uiMultiplier(). The contracts are public; reading one takes a single RPC call.
Do not buy on weekends unless you have to. Weekend purchases cost an extra 10–38 bp on average. If you are simply building a position, wait for U.S. trading hours.
Selling on weekends may actually work in your favor. The premium benefits sellers. If you hold tokens and want to trim on a weekend, the onchain premium is your gain.
Treat weekend prices as intelligence, not a trading opportunity. If you will adjust positions in a brokerage account on Monday, the weekend move in the token is a more timely and more quantitative guide than the headlines.
For high-dividend stocks, consider other ways to hold them first. A 31% haircut on dividends matters little for something like SPY, which yields about 1%. For stocks yielding 3–4%, it costs more than a percentage point a year.
Calibrate the ruler before reading the marks: the "persistent premium" on stock tokens is an illusion created by the dividend multiplier. The real premium is on weekends, and it is the price of 24/7 liquidity.
Sources for This Chapter
Stock-token contracts (Robinhood Chain RPC): current uiMultiplier() values and all UIMultiplierUpdated(uint256,uint256,uint256) events (November 2, 2026); contract function list (smarts source search: updateMultiplier, pause, adminBurn, pauseOracle)
GeckoTerminal: hourly candles for each of the seven tokens' main USDG pools (from pool creation to November 2, 2026)
Yahoo Finance: 60-minute bars (including pre-market and after-hours) and dividend records for the seven underlying stocks (May to November 2026)
Dividend handling and withholding tax: descriptions in stock-token materials of the multiplier mechanism, withholding tax, and Section 871(m) (as relayed by insights4.vc, datawallet, and others)
Method: hourly closes aligned to the most recent quote for the shares in the same hour; hours with less than $500 of volume excluded; points with an absolute deviation above 1,500 bp treated as bad data and excluded; weekends identified as gaps of more than 40 hours between the last Friday quote and the first Monday quote
—
This is Chapter 6 of 14 from my new book Where the Yield Comes From, serialized one chapter a day. For research only; not investment advice.
Author: Blue Lotus