


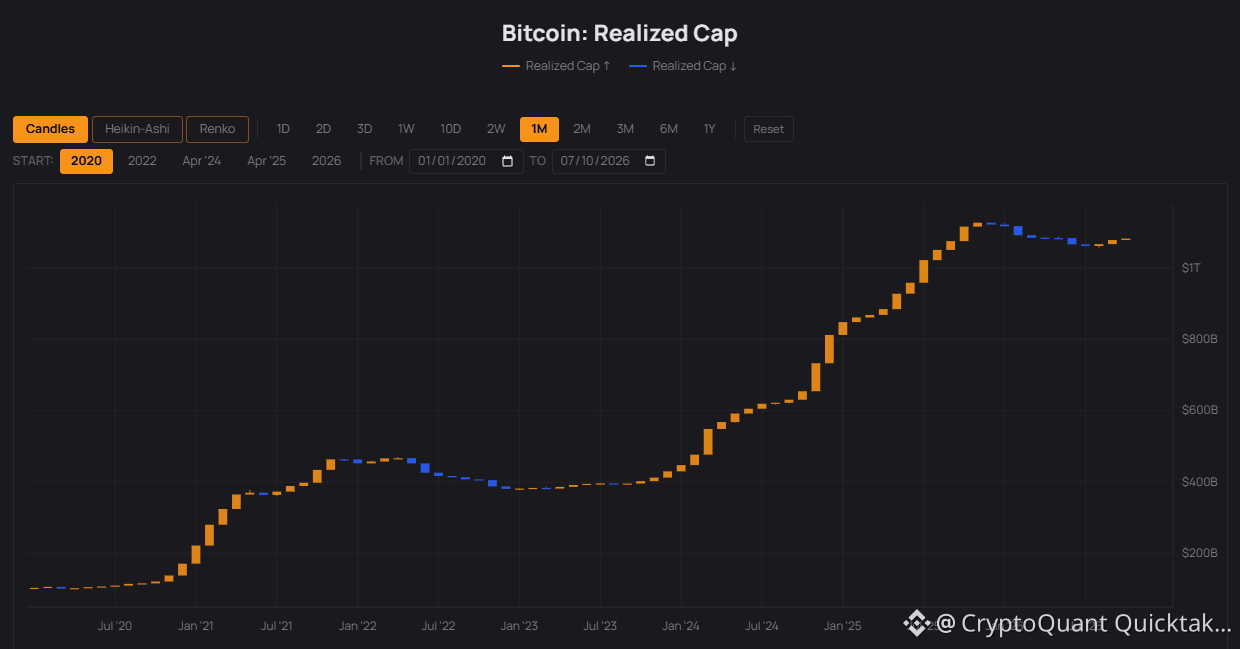
1) On the monthly timeframe, the RC closed bearish for the first time in December 2025, at 1.12T, and continued this trend until July of this year, when it closed at 1.06T. This represents an approximate 5% decline, while the market price fell by around 28% over the same period.
2) In September, despite the price moving sideways, the RC formed a bullish candle. This indicates that the aggregate cost basis of the network is increasing even without a comparable appreciation in spot price. Since the bearish July close, it has risen by approximately 1.9%.
3) The last time that, after a prolonged bearish period, the RC began to recover was in January 2023, which preceded a major bullish trend that extended through 2025.
4) At the same time, the LTH-SOPR has remained mostly above 1 since mid-August, indicating that Long-Term Holders are spending coins at a profit relative to their cost basis. This upward repricing is one of the factors contributing to the recent increase in the RC.
5) On-chain data downloaded from CryptoQuant.
Written by Facundo Fama