Binance Square
Odunerd
54 个内容

Odunerd

BP-24948D0AD5FF
94 关注
432 粉丝
1.3K+ 点赞
帖子
置顶
·
--
看涨
很多时候,我们忽视了我们的信念,而当事情发生时,你会大喊“哎呀”。 除了TA和FA 有一种东西叫情感分析 您对加密货币领域的特定叙述有何看法?您的看法对您有何影响?是好是坏? 我的意思是,无论是看涨还是看跌,重要的是你的心态,而不仅仅是图表或 MM 发布的内容。 保持专注🤳 代币 我正在推动我对 rn 的信念 #memes #L2s #AI #exchtokens
很多时候,我们忽视了我们的信念,而当事情发生时,你会大喊“哎呀”。

除了TA和FA
有一种东西叫情感分析

您对加密货币领域的特定叙述有何看法?您的看法对您有何影响?是好是坏?

我的意思是,无论是看涨还是看跌,重要的是你的心态,而不仅仅是图表或 MM 发布的内容。

保持专注🤳

代币 我正在推动我对 rn 的信念
#memes
#L2s
#AI
#exchtokens
一个代币几乎快要支撑不住了,又试图重新站起来——对瑞波家族来说现在可不太妙…… #BitgetHackerMoves$83MStolenXRP
一个代币几乎快要支撑不住了,又试图重新站起来——对瑞波家族来说现在可不太妙……

#BitgetHackerMoves$83MStolenXRP
文章
查看翻译
BITCOIN INCONSISTENCIES ANALYTICAL PROVEN..Was June 30, 2026 the Bitcoin Cycle Bottom? One question has been sitting at the center of my Bitcoin analysis: Did Bitcoin actually find its cycle bottom on June 30, 2026? Rather than relying on the chart alone, I approached the question from two sides: Market structure + on-chain and market data. 1. Starting With Price Action I deliberately kept the technical analysis simple. No complicated indicators. Just price structure. Bitcoin reached a low of approximately $58.53K on June 30. Since then, the market has behaved differently from the downtrend that led into that low. On the daily chart, $BTC moved away from the June low and entered a period of consolidation before beginning to form a sequence of higher highs and higher lows. The weekly chart adds another important piece of context. The June low has remained intact, while Bitcoin has recovered substantially from that level. That is certainly worth paying attention to. But there is an important distinction: A strong recovery from a low does not, by itself, prove that the cycle bottom is in. So I went deeper. 2. Looking Beneath the Chart To test the June low from a data perspective, I built a framework around several metrics and historical comparisons: - MVRV - Bitcoin Realized Price - ETF flows - Historical cycle bottoms - Peak-to-bottom drawdowns - Post-bottom recovery behaviour The objective wasn't to find one magic indicator. Instead, I wanted to see whether multiple independent pieces of evidence were pointing toward the same conclusion. Key numbers from the analysis $58.53K — June 30 low -53.11% — Peak-to-bottom drawdown 1.47 — Current MVRV $53.19K — Realized Price +30.52% — Recovery from the June low at the time of the analysis When these figures are placed alongside historical Bitcoin cycle behaviour, the June 30 low starts to look increasingly significant. 3. What Does the Evidence Actually Tell Us? The analysis suggests that June 30 is a credible candidate for the cycle bottom. But there is an important caveat: A candidate bottom is not the same thing as a confirmed cycle bottom. Bitcoin has historically experienced significant recoveries that were later followed by another major move lower. That's why I don't think one should look at the June low in isolation. The more interesting observation is that both price structure and the underlying data are pointing toward a potential change in market behaviour around that period. Price is showing a different structure. The on-chain and market data provide additional evidence worth investigating. But the higher-timeframe cycle still needs to prove itself. 4. Why Combine Technical Analysis With Data Analytics? This is actually the bigger lesson behind the research. The chart tells us what price is doing. But data can help us investigate what may be happening underneath the price. Instead of asking: «"Does the chart look bullish?"» The better analytical question becomes: "Do multiple independent datasets support the same market hypothesis?" That shift changes the way I approach crypto research. Rather than relying on a single indicator or prediction, I want to combine: Price → On-chain data → Historical behaviour → Market flows → Statistical context Then let the evidence tell the story. So, was June 30, 2026 the Bitcoin cycle bottom? It is a credible candidate — but the data does not make it a confirmed fact yet. For me, that's where the research becomes interesting. The goal isn't to predict the market with certainty. It's to identify important market events, collect the relevant data, test the hypothesis, and continue monitoring whether the evidence holds. PS: I've put together the full research, dashboard, and methodology for anyone interested in going through the analysis from start to finish.

BITCOIN INCONSISTENCIES ANALYTICAL PROVEN..

Was June 30, 2026 the Bitcoin Cycle Bottom?
One question has been sitting at the center of my Bitcoin analysis:
Did Bitcoin actually find its cycle bottom on June 30, 2026?
Rather than relying on the chart alone, I approached the question from two sides:
Market structure + on-chain and market data.
1. Starting With Price Action
I deliberately kept the technical analysis simple.
No complicated indicators.
Just price structure.
Bitcoin reached a low of approximately $58.53K on June 30.
Since then, the market has behaved differently from the downtrend that led into that low.
On the daily chart, $BTC moved away from the June low and entered a period of consolidation before beginning to form a sequence of higher highs and higher lows.
The weekly chart adds another important piece of context.
The June low has remained intact, while Bitcoin has recovered substantially from that level.
That is certainly worth paying attention to.
But there is an important distinction:
A strong recovery from a low does not, by itself, prove that the cycle bottom is in.
So I went deeper.
2. Looking Beneath the Chart
To test the June low from a data perspective, I built a framework around several metrics and historical comparisons:
- MVRV
- Bitcoin Realized Price
- ETF flows
- Historical cycle bottoms
- Peak-to-bottom drawdowns
- Post-bottom recovery behaviour
The objective wasn't to find one magic indicator.
Instead, I wanted to see whether multiple independent pieces of evidence were pointing toward the same conclusion.
Key numbers from the analysis
$58.53K — June 30 low
-53.11% — Peak-to-bottom drawdown
1.47 — Current MVRV
$53.19K — Realized Price
+30.52% — Recovery from the June low at the time of the analysis
When these figures are placed alongside historical Bitcoin cycle behaviour, the June 30 low starts to look increasingly significant.
3. What Does the Evidence Actually Tell Us?
The analysis suggests that June 30 is a credible candidate for the cycle bottom.
But there is an important caveat:
A candidate bottom is not the same thing as a confirmed cycle bottom.
Bitcoin has historically experienced significant recoveries that were later followed by another major move lower.
That's why I don't think one should look at the June low in isolation.
The more interesting observation is that both price structure and the underlying data are pointing toward a potential change in market behaviour around that period.
Price is showing a different structure.
The on-chain and market data provide additional evidence worth investigating.
But the higher-timeframe cycle still needs to prove itself.
4. Why Combine Technical Analysis With Data Analytics?
This is actually the bigger lesson behind the research.
The chart tells us what price is doing.
But data can help us investigate what may be happening underneath the price.
Instead of asking:
«"Does the chart look bullish?"»
The better analytical question becomes:
"Do multiple independent datasets support the same market hypothesis?"
That shift changes the way I approach crypto research.
Rather than relying on a single indicator or prediction, I want to combine:
Price → On-chain data → Historical behaviour → Market flows → Statistical context
Then let the evidence tell the story.
So, was June 30, 2026 the Bitcoin cycle bottom?
It is a credible candidate — but the data does not make it a confirmed fact yet.
For me, that's where the research becomes interesting.
The goal isn't to predict the market with certainty.
It's to identify important market events, collect the relevant data, test the hypothesis, and continue monitoring whether the evidence holds.
PS: I've put together the full research, dashboard, and methodology for anyone interested in going through the analysis from start to finish.
·
--
看涨
$ARB $ZAMA $SUI 替代代币正在醒来,但部分代币的恢复率仍无法与其动量匹配。
$ARB
$ZAMA
$SUI
替代代币正在醒来,但部分代币的恢复率仍无法与其动量匹配。
随时随地为我带来黑暗模式,这对我来说真的很重要,因为光明模式造成的损害需要更多的关注。

Odunerd
·
--
看涨
作为一名开发人员,在学习和编码时,您喜欢在屏幕上显示什么屏幕。

▪︎亮屏
▪︎暗屏

让我们谈谈。
#StockMarketCrash 战争的影响肯定会在我们现在所见的后果中展现出来,现在看到的只是个诱饵,目的是引诱人们进场。
·
--
看涨
比特币达到73K美元并不是让人感到满足的基础,现在市场飙升的原因是库存中$BTC的数量,以及战争让矿工分心。
他们把所有在这个位置上的人都打残了
他们把所有在这个位置上的人都打残了
Tyler Oliveira
·
--
我几小时前账户里有120万 💔😭

我在$POWER 中损失了近80万,我该如何弥补这些损失??? 😰

我正在购买$RIVER 📈✅

·
--
看涨
对于 $KAITO 这里同样看涨
对于 $KAITO 这里同样看涨

CoinQuest
·
--
看涨
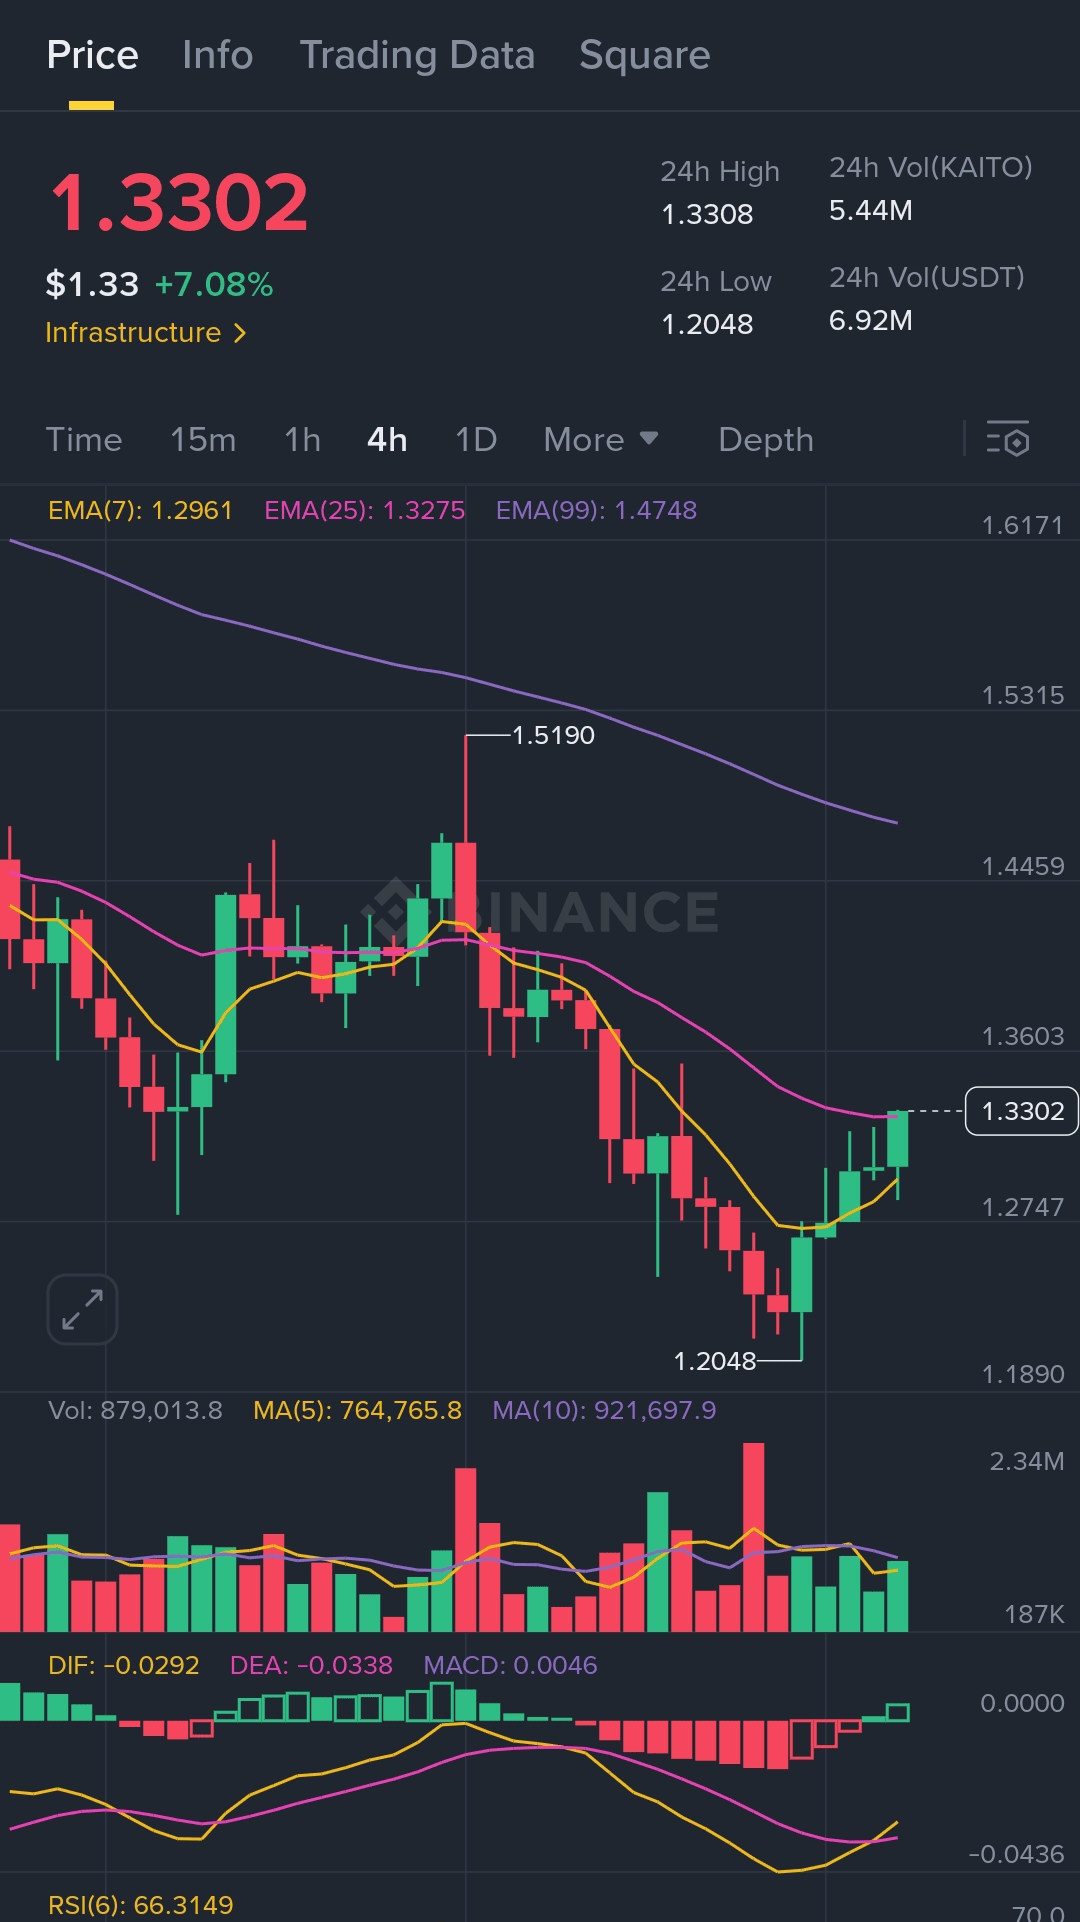
$KAITO 突破结构动态 ✅

KAITO已用成交量确认翻转阻力,并形成干净的更高低点,牛市重新掌控局面。

🎯 入场:$1.3300
目标:$1.3538 | $1.3850 | $1.4200(可选用于分批建仓)
🛡️ 止损:$1.2975

动能支持继续上涨。突破交易者应关注$1.33以上的强势,干净的布局可用于向上延伸。
·
--
看涨
➠唯一重要的是时间,但在长远来看,请优先考虑你的安全,其他一切只是笑话。 📢📢
➠唯一重要的是时间,但在长远来看,请优先考虑你的安全,其他一切只是笑话。
📢📢
此刻! 你的贪婪程度又是多少? {spot}(BTCUSDT)
此刻!
你的贪婪程度又是多少?
·
--
看涨
不要放过任何机会。 我的建议是不要停止点击。
不要放过任何机会。

我的建议是不要停止点击。
·
--
看涨
只是真正的问题,需要真正的回答。 我们快到 Alts 季节了吗?
只是真正的问题,需要真正的回答。

我们快到 Alts 季节了吗?
·
--
看涨
这里的主要关键是要坚定信念,然后花点时间核实一些数据和统计数据,以巩固你的立场。 #Dogs 具有非常强大的叙事后端,不要惊慌失措,而是持有或谨慎交易。 听 Telegram 首席执行官 pavel durov 的话,你会明白 #Dogs 的叙事来自哪里,你会知道这不仅仅是普通的模因。 我专注于 X 我们可以在这里建立联系。 喜欢并分享你的想法。 #bnb 💛
这里的主要关键是要坚定信念,然后花点时间核实一些数据和统计数据,以巩固你的立场。

#Dogs 具有非常强大的叙事后端,不要惊慌失措,而是持有或谨慎交易。
听 Telegram 首席执行官 pavel durov 的话,你会明白 #Dogs 的叙事来自哪里,你会知道这不仅仅是普通的模因。

我专注于 X
我们可以在这里建立联系。
喜欢并分享你的想法。

#bnb 💛
·
--
看跌
由于 Telegram 首席执行官被捕,开放网络 (TON) 经历突然深渊。 #PavelDurov 现在是时候对 Ton 区块链上著名的 Memes 采取行动,以模仿并确保这个机会作为购买投票。 #Fish #Notcoin #utyab #Raff Tpet Durev Tcandy Tmonk。 您可以在 geckoterminal.com 上查看许多内容,或使用这些 dex 购买上市代币。 Ston.fi DeDust.io
由于 Telegram 首席执行官被捕,开放网络 (TON) 经历突然深渊。
#PavelDurov
现在是时候对 Ton 区块链上著名的 Memes 采取行动,以模仿并确保这个机会作为购买投票。
#Fish
#Notcoin
#utyab
#Raff
Tpet
Durev
Tcandy
Tmonk。
您可以在 geckoterminal.com 上查看许多内容,或使用这些 dex 购买上市代币。
Ston.fi
DeDust.io
·
--
看涨
教育的这一部分总是温暖着我从币安到全世界的心。 #BNB 💛
教育的这一部分总是温暖着我从币安到全世界的心。
#BNB 💛
Binance Square Official
·
--
如何在 Square 上写一篇长篇文章
·
--
看涨
多关注市场🦴
多关注市场🦴
·
--
看涨
我对当今 DEFI 世界的想法是,让我们拥抱更多的技术和创新,这样加密领域就不会完全缺乏创意。 要有效率 要有联系 要有开放的心态
我对当今 DEFI 世界的想法是,让我们拥抱更多的技术和创新,这样加密领域就不会完全缺乏创意。

要有效率
要有联系
要有开放的心态
#MarketSentimentToday ​​我想说的是,市场目前处于十字星状态,人们在做决定时需要极其小心。
·
--
看涨
作为一名开发人员,在学习和编码时,您喜欢在屏幕上显示什么屏幕。 ▪︎亮屏 ▪︎暗屏 让我们谈谈。
作为一名开发人员,在学习和编码时,您喜欢在屏幕上显示什么屏幕。

▪︎亮屏
▪︎暗屏

让我们谈谈。
登录解锁更多内容
加入币安广场,与全球加密货币用户互动
⚡️ 获取关于加密货币的最新实用信息。
💬 受到全球最大加密货币交易平台的信赖。
👍 发现来自认证创作者的真知灼见。
邮箱/手机号码
网站地图
Cookie偏好设置
平台条款和条件