
CryptoT 1
47 个内容

CryptoT 1
举报
屏蔽用户
Technical Analysis Specialists
0 关注
0 粉丝
0 点赞
帖子
·
--
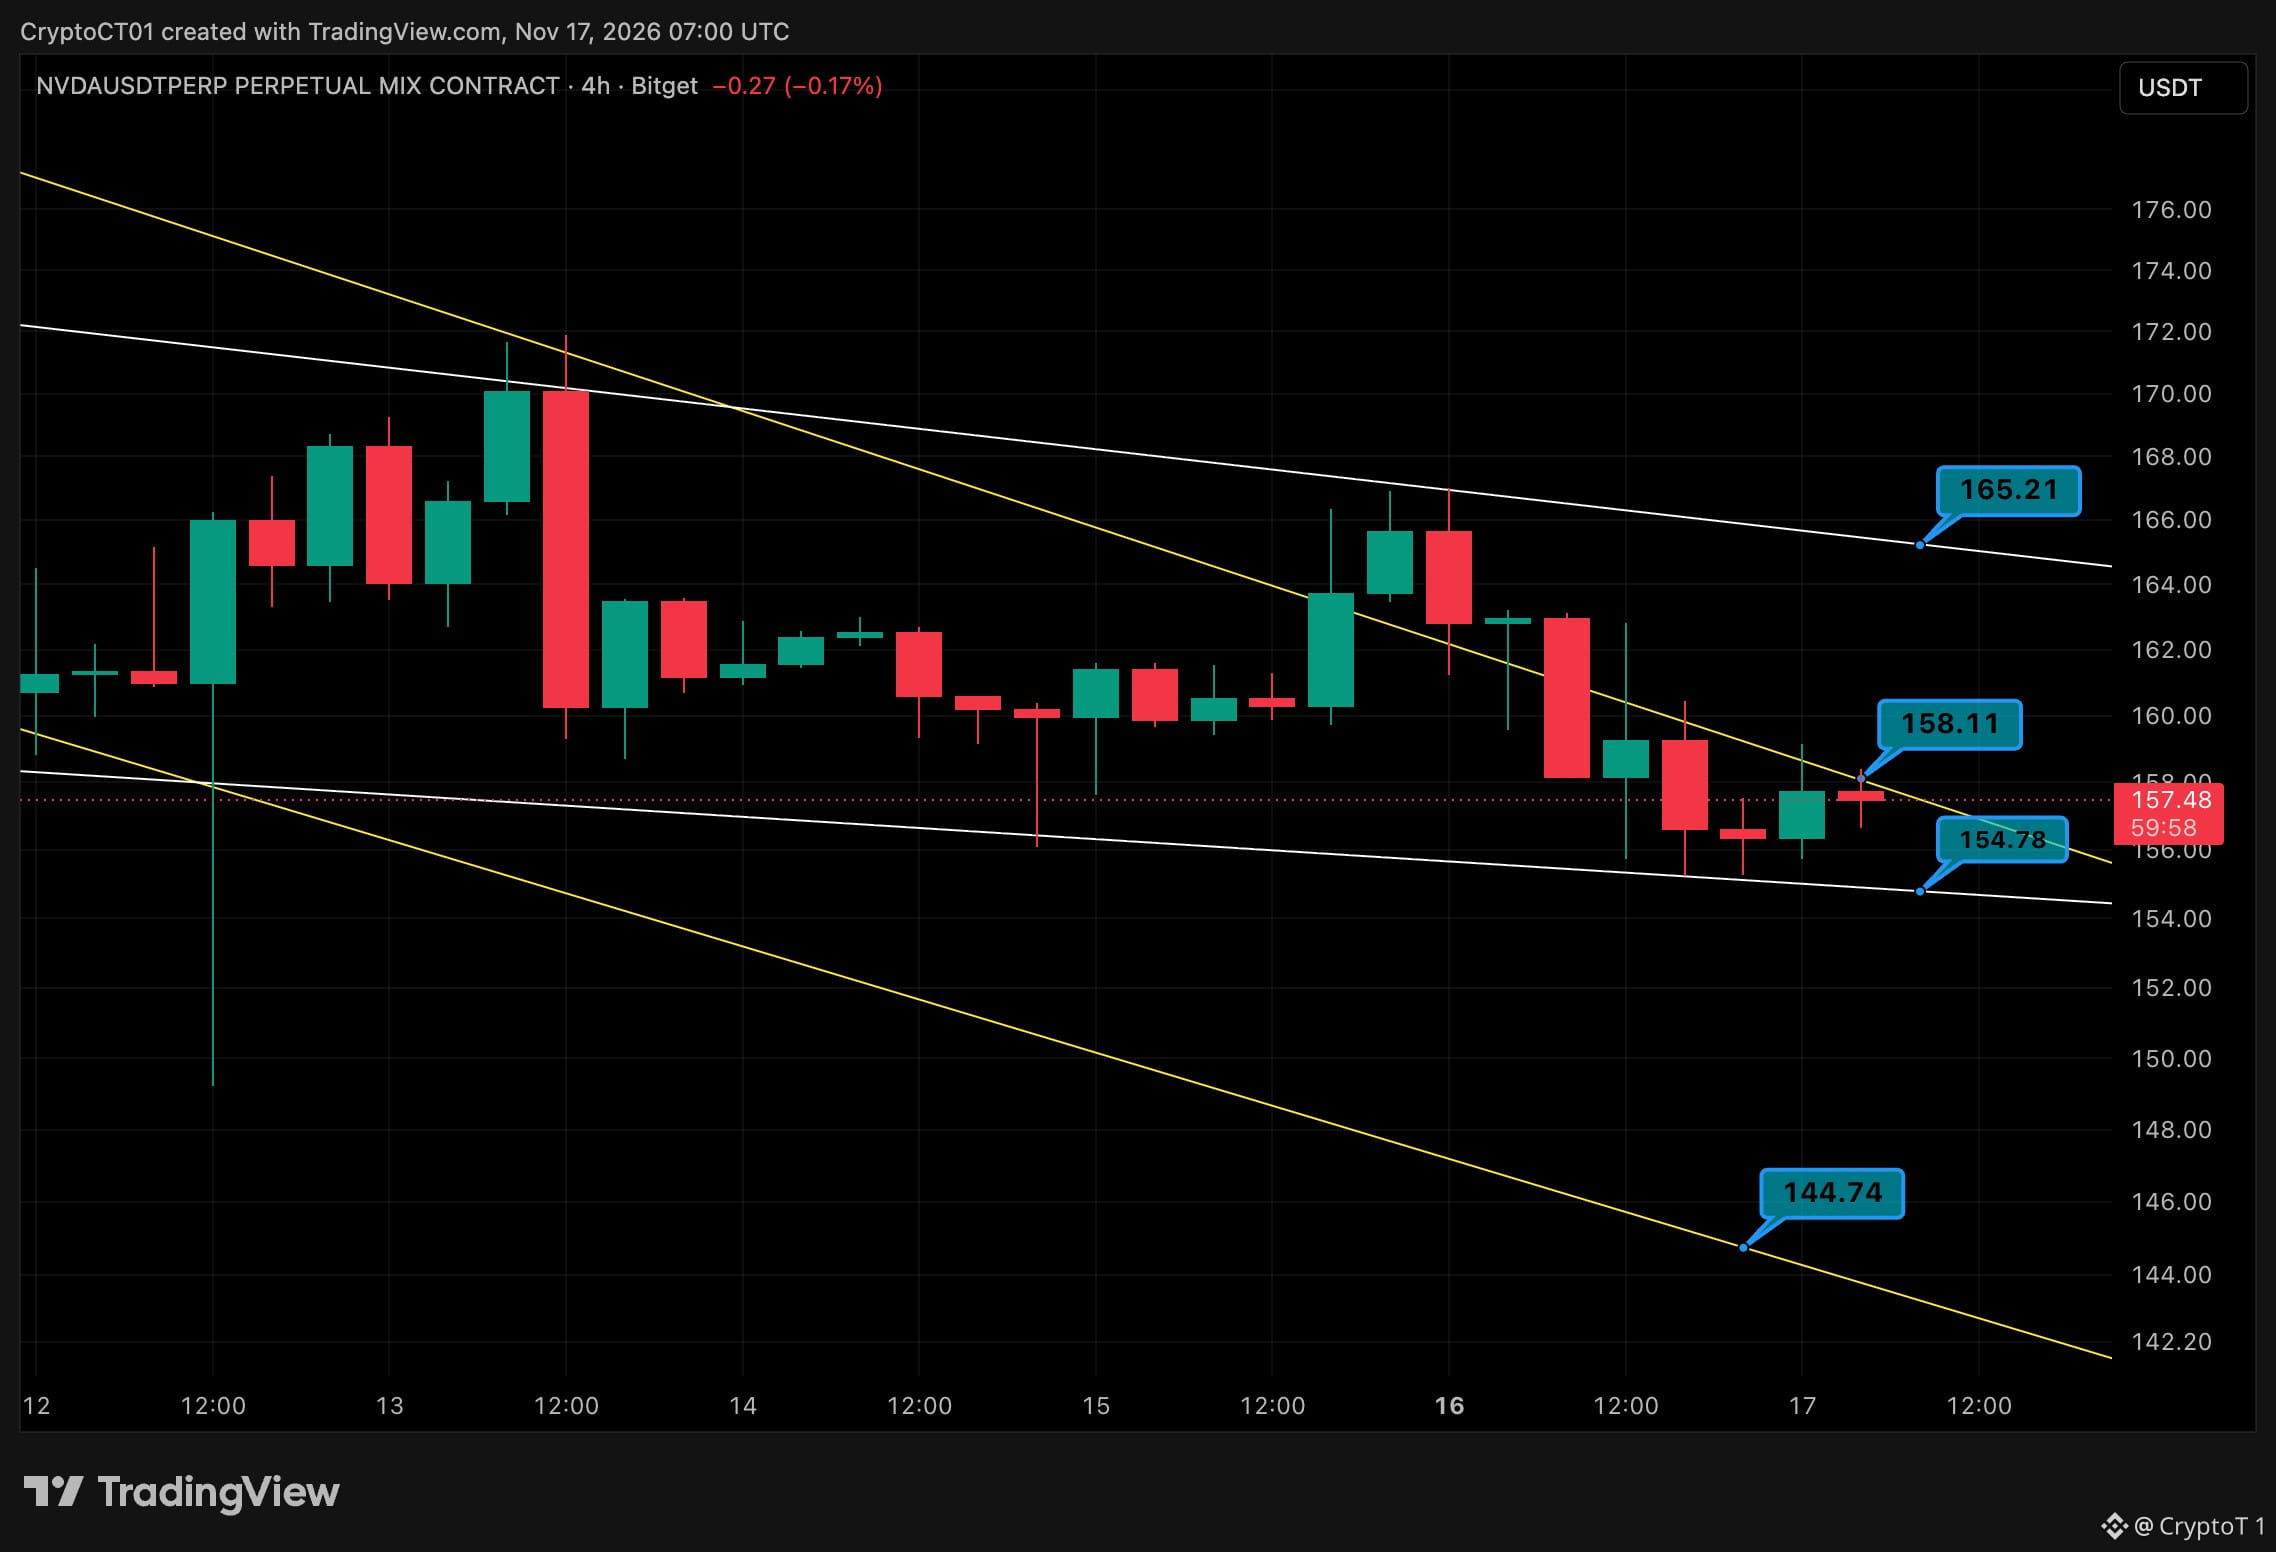
$NVDA 今晚公布财报:夹在两条线之间 🧨 Nvidia 将在美股收盘后公布财报,英国时间约晚上 9:20。4 小时图正好在这个时点前收敛。 🔴 158.11(下降趋势线,正在测试) 🔴 165.21(通道顶部) 🟢 154.78(通道底部) 🟢 144.74(下方趋势线) 背景:自 13 日以来,NVDA 一直在下降通道内形成更低的高点。股价约在 157.5,卡在上方趋势线与下方通道底部之间。 我的看法:4 小时线收在 158 之上,就有机会上探 165;若财报表现强劲,单根 K 线就可能办到。在那之前,趋势仍然向下。我不猜财报结果,只等市场反应。 风险:财报公布后的跳空可能无视技术位。若跌破 154.78,下方到 144.74 之间几乎没有支撑。控制部位,或先观望。 财报优于预期、一路冲到 165,还是利多出尽、跌到 145?👇 #NVDA #辉达
$NVDA 今晚公布财报:夹在两条线之间 🧨 Nvidia 将在美股收盘后公布财报,英国时间约晚上 9:20。4 小时图正好在这个时点前收敛。 🔴 158.11(下降趋势线,正在测试) 🔴 165.21(通道顶部) 🟢 154.78(通道底部) 🟢 144.74(下方趋势线) 背景:自 13 日以来,NVDA 一直在下降通道内形成更低的高点。股价约在 157.5,卡在上方趋势线与下方通道底部之间。 我的看法:4 小时线收在 158 之上,就有机会上探 165;若财报表现强劲,单根 K 线就可能办到。在那之前,趋势仍然向下。我不猜财报结果,只等市场反应。 风险:财报公布后的跳空可能无视技术位。若跌破 154.78,下方到 144.74 之间几乎没有支撑。控制部位,或先观望。 财报优于预期、一路冲到 165,还是利多出尽、跌到 145?👇 #NVDA #辉达
·
--
查看翻译
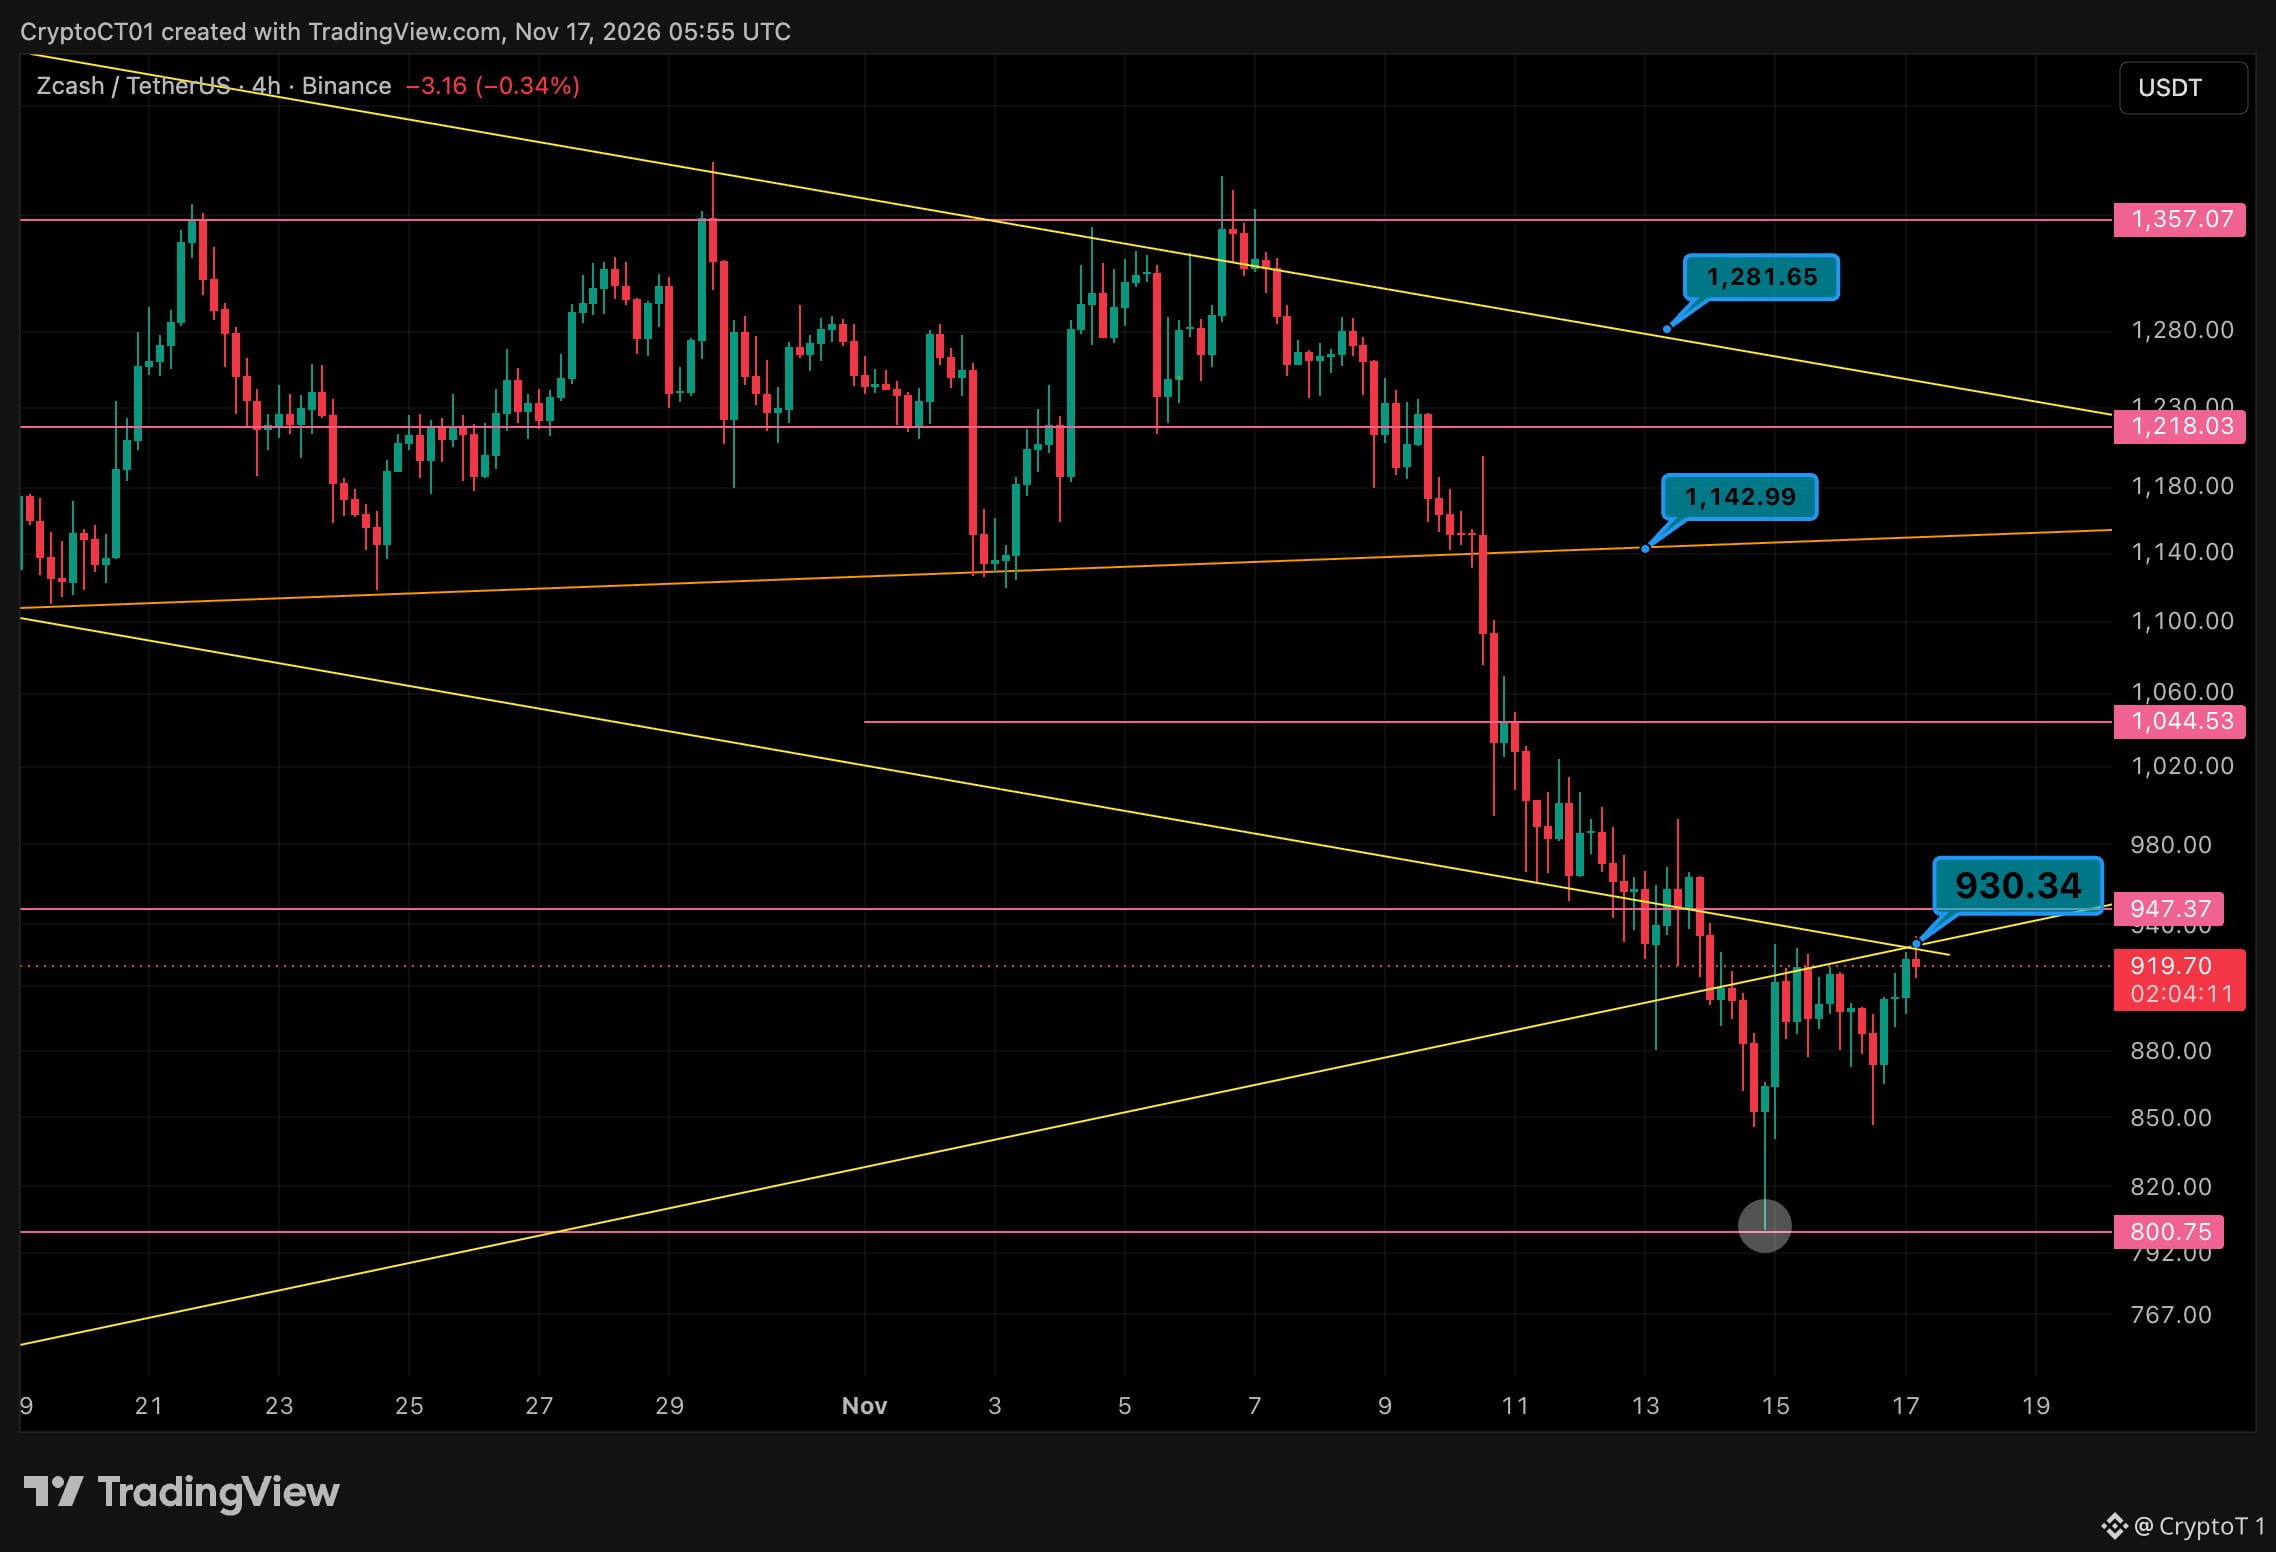
$ZEC Bounced Off 800 And Is Back At The Trendline 🎯 Yesterday I said 800 was the last real buyer. It held. Price printed a higher low and is now pressing into the trendline at 930. 🔴 930 (trendline, testing now) 🔴 947 (the level that broke last week) 🟢 800 (the wick low) Context: ZEC is still making lower highs since early November, but buyers stepped in at 800 and again higher up. Price is back around 920. My read: a clean 4h close above 947 flips this into a proper relief move toward 1,044. Until then it's a bounce into resistance, so I'm not chasing. Let price come to you. The risk: another rejection at the trendline and 800 gets retested. Lose it and there's no clear support below. Breakout above 947 or another trip to 800? 👇 #ZEC #Zcash
$ZEC Bounced Off 800 And Is Back At The Trendline 🎯 Yesterday I said 800 was the last real buyer. It held. Price printed a higher low and is now pressing into the trendline at 930. 🔴 930 (trendline, testing now) 🔴 947 (the level that broke last week) 🟢 800 (the wick low) Context: ZEC is still making lower highs since early November, but buyers stepped in at 800 and again higher up. Price is back around 920. My read: a clean 4h close above 947 flips this into a proper relief move toward 1,044. Until then it's a bounce into resistance, so I'm not chasing. Let price come to you. The risk: another rejection at the trendline and 800 gets retested. Lose it and there's no clear support below. Breakout above 947 or another trip to 800? 👇 #ZEC #Zcash
·
--
查看翻译
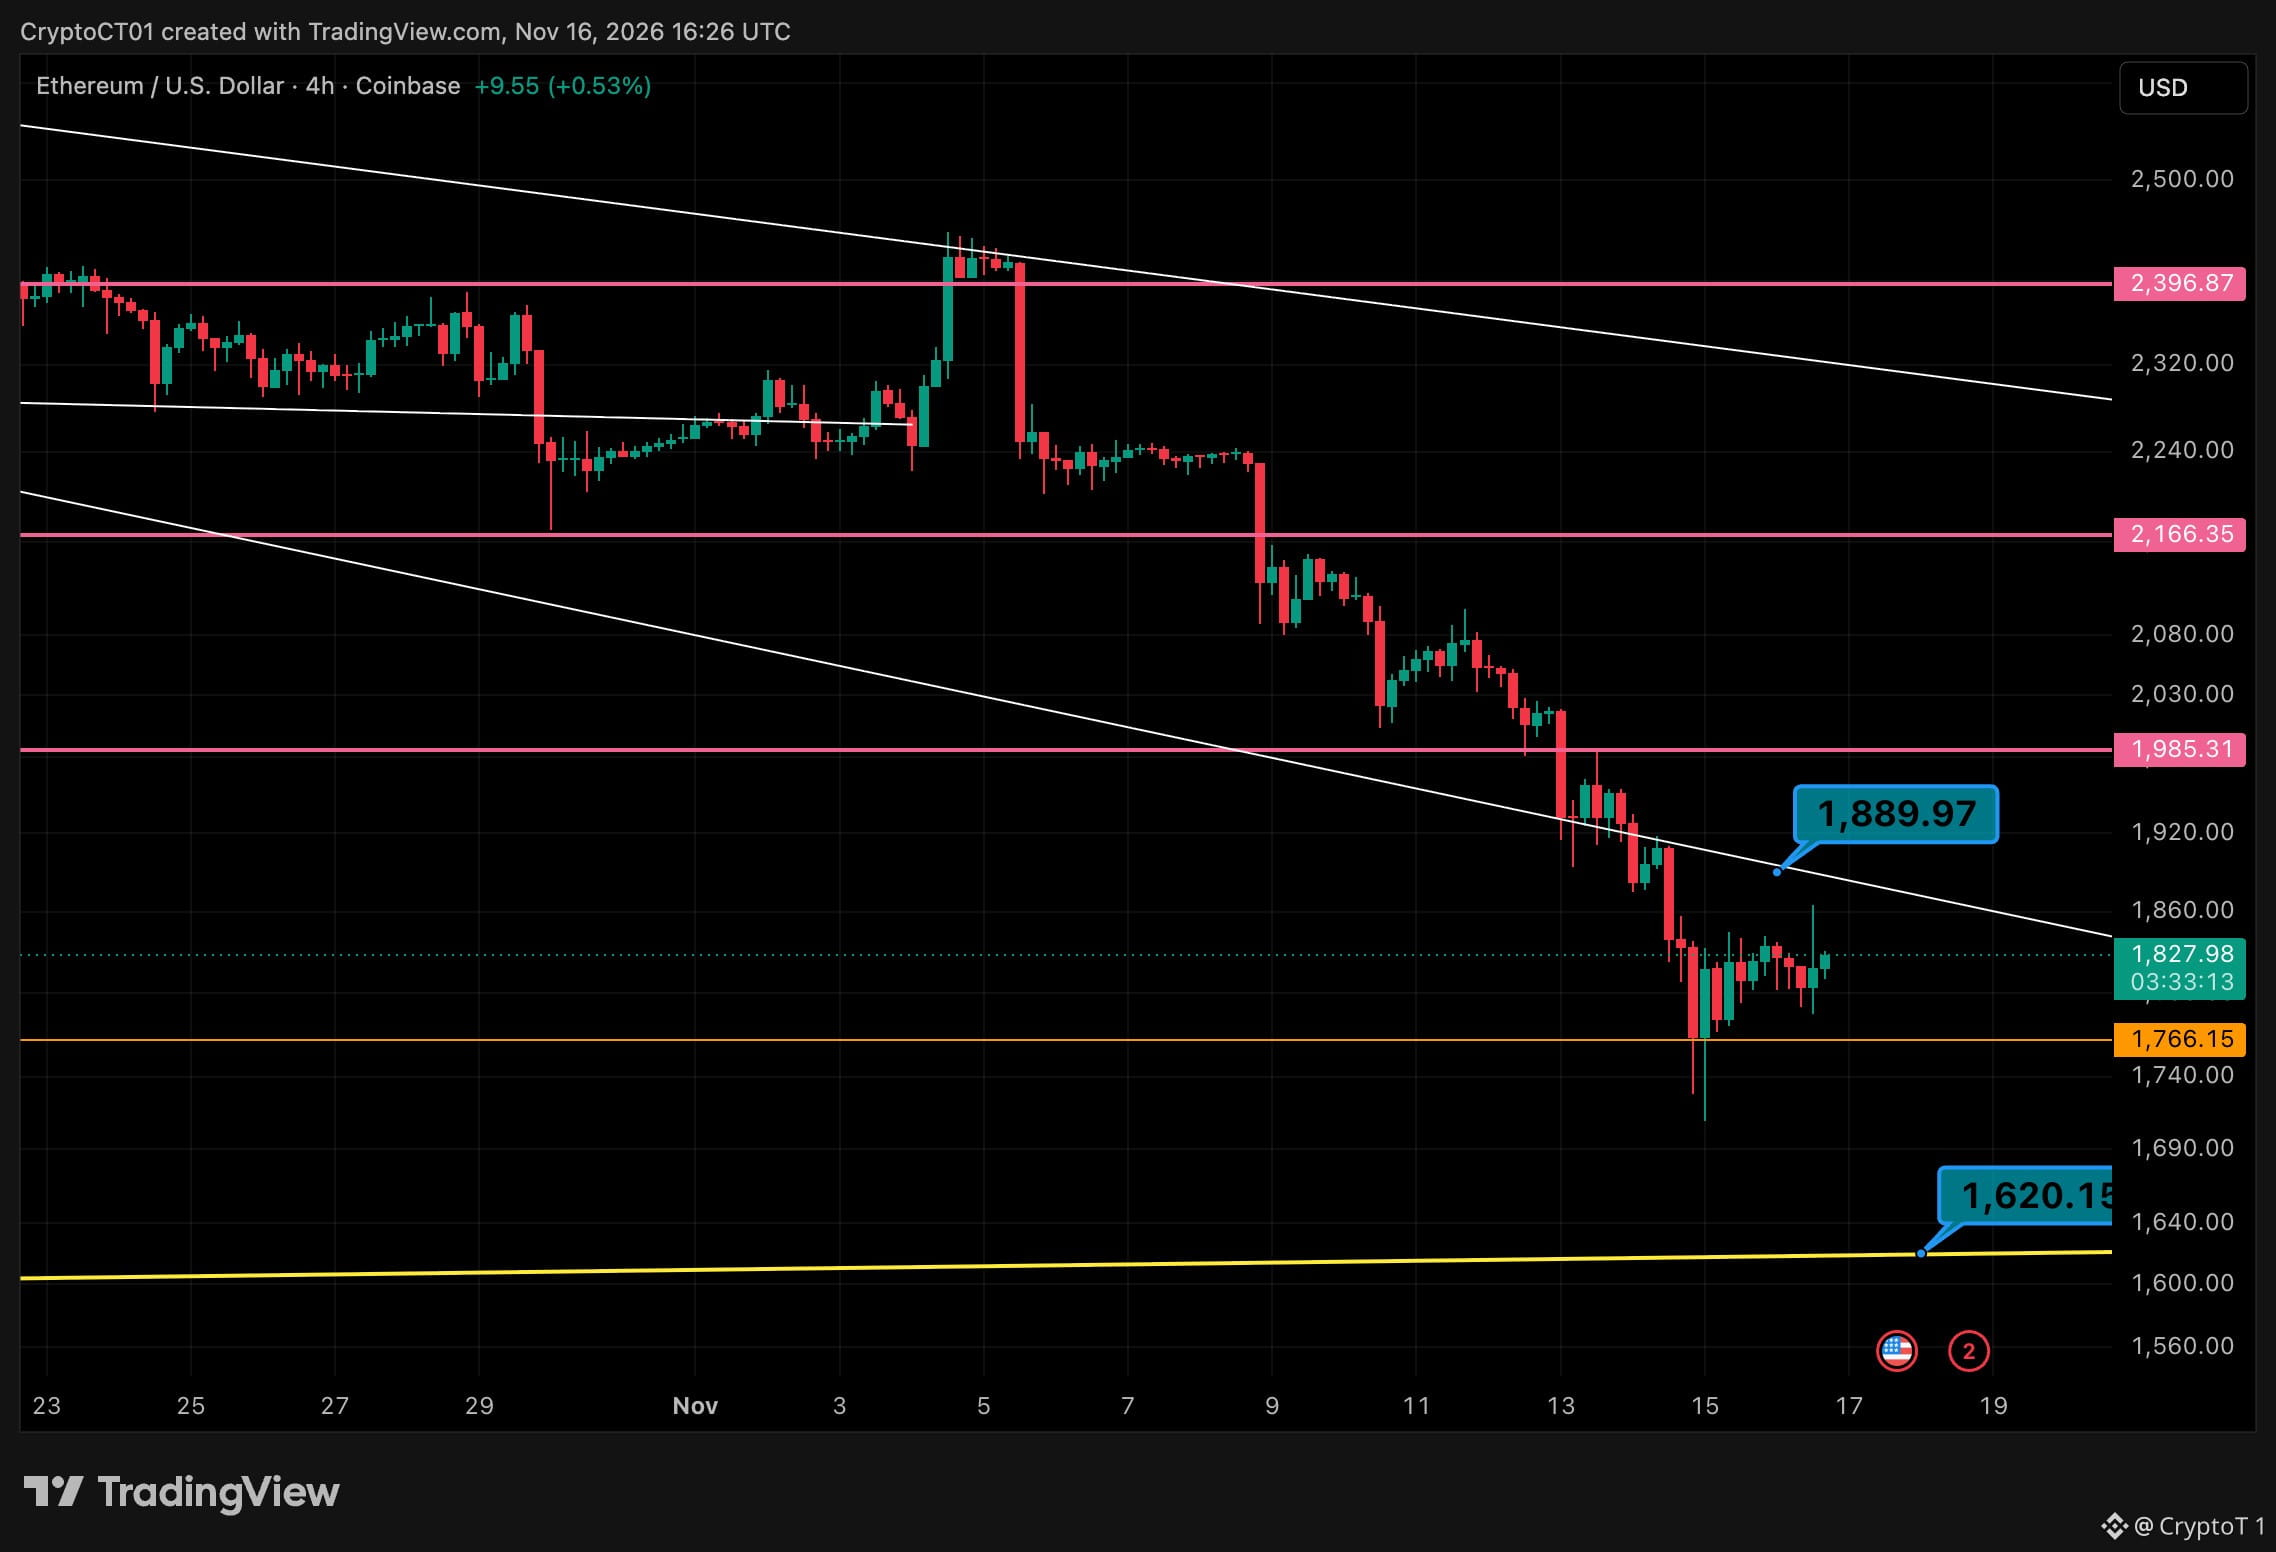
$ETH 4H: Squeezed Into The Trendline And Rejected 🧭 🔴 1,889.97 (falling trendline) 🔴 1,985.31 🟢 1,766.15 🟢 1,620.15 (long-term rising line) Context: ETH has been making lower highs since early Nov. Today's US open squeeze tapped near the trendline and faded straight back to 1,828. My read: until it closes a 4H candle above the trendline, every bounce is a lower high. 1,766 is the floor bulls have to defend. The risk: lose 1,766 and there's not much support until the 1,620 line. Trendline break or 1,620 retest first? 👇 #ETH #Crypto
$ETH 4H: Squeezed Into The Trendline And Rejected 🧭 🔴 1,889.97 (falling trendline) 🔴 1,985.31 🟢 1,766.15 🟢 1,620.15 (long-term rising line) Context: ETH has been making lower highs since early Nov. Today's US open squeeze tapped near the trendline and faded straight back to 1,828. My read: until it closes a 4H candle above the trendline, every bounce is a lower high. 1,766 is the floor bulls have to defend. The risk: lose 1,766 and there's not much support until the 1,620 line. Trendline break or 1,620 retest first? 👇 #ETH #Crypto
7
·
--
查看翻译
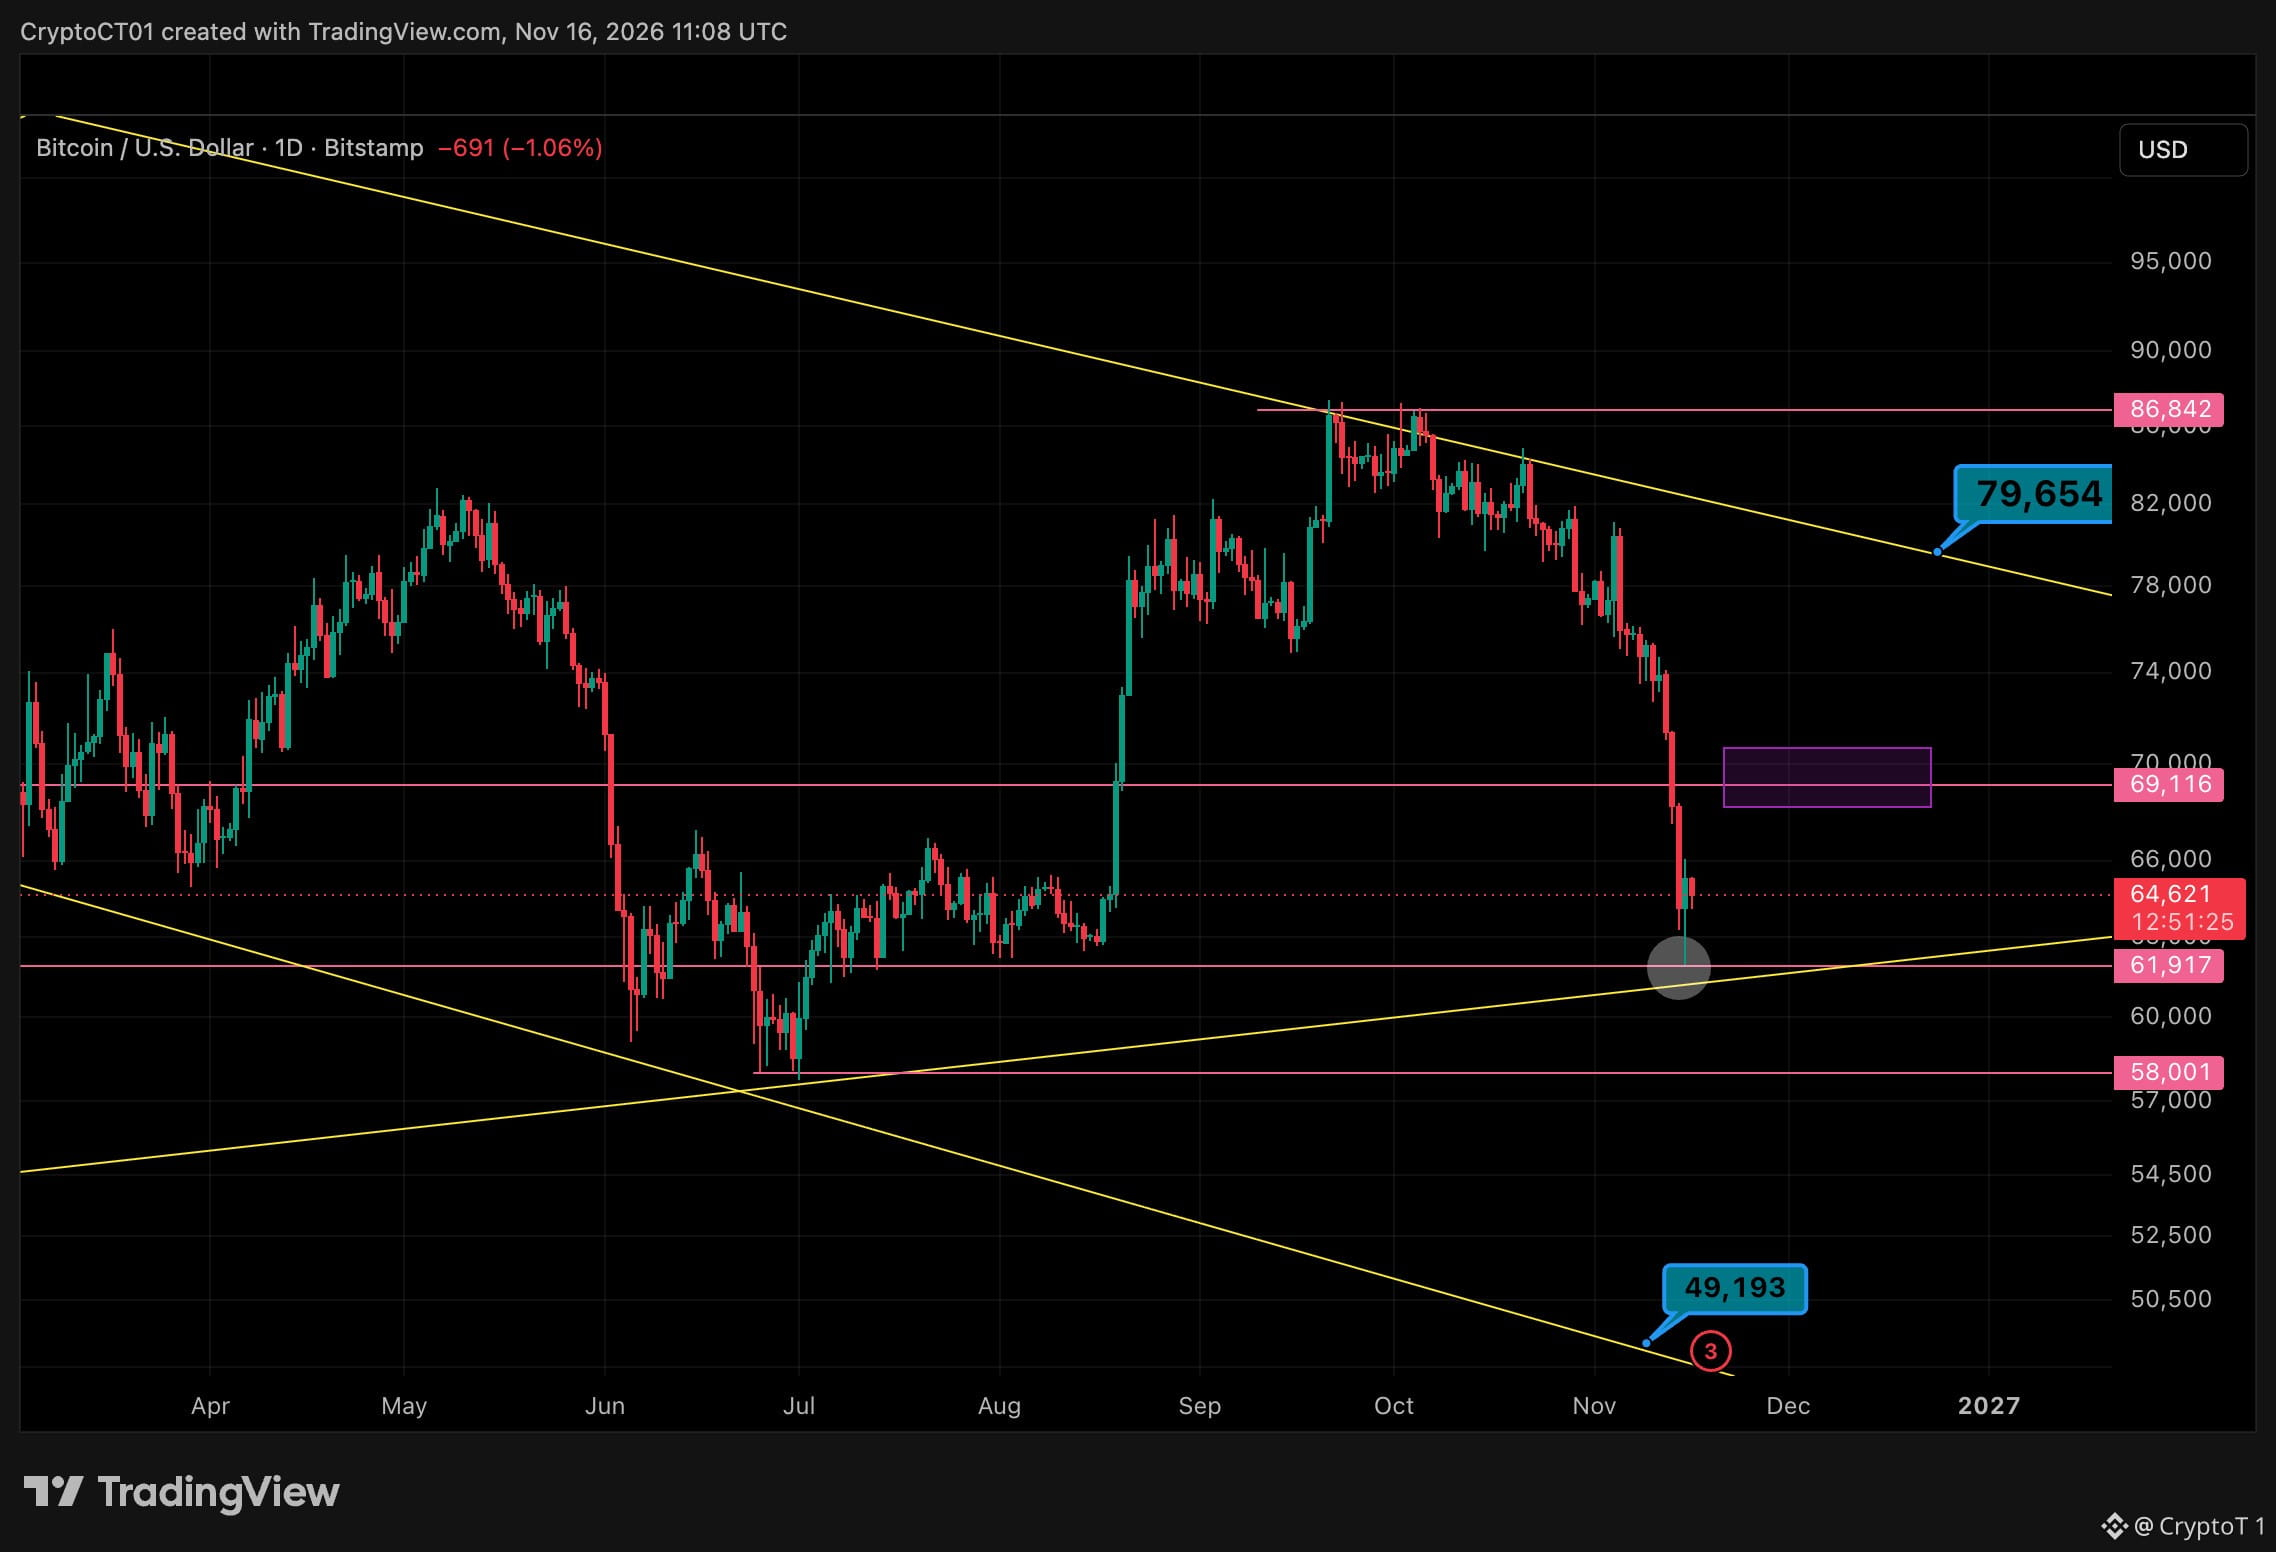
$BTC Higher Timeframe: Sitting On The Last Line Before 58K 🧭 Daily chart, weekly as confirmation. Six red weeks and price just tagged the rising trendline at 62K. 🔴 69,116 (old support, now resistance) 🔴 79,654 (falling trendline from the highs) 🟢 61,917 (rising trendline, the line that has to hold) 🟢 58,001 (summer lows) Context: BTC dropped from 86.8K straight through 69K and wicked into 62K. The weekly is still printing lower highs under the falling trendline. My read: 62K is the line that matters this week. If it holds, a relief bounce into 69K is on the table. That's where I'd expect sellers to step back in. The risk: lose 62K on a daily close and 58K is next. Below that, the channel floor points at 49K. Bounce to 69K or 58K first? 👇 #Bitcoin #BTC
$BTC Higher Timeframe: Sitting On The Last Line Before 58K 🧭 Daily chart, weekly as confirmation. Six red weeks and price just tagged the rising trendline at 62K. 🔴 69,116 (old support, now resistance) 🔴 79,654 (falling trendline from the highs) 🟢 61,917 (rising trendline, the line that has to hold) 🟢 58,001 (summer lows) Context: BTC dropped from 86.8K straight through 69K and wicked into 62K. The weekly is still printing lower highs under the falling trendline. My read: 62K is the line that matters this week. If it holds, a relief bounce into 69K is on the table. That's where I'd expect sellers to step back in. The risk: lose 62K on a daily close and 58K is next. Below that, the channel floor points at 49K. Bounce to 69K or 58K first? 👇 #Bitcoin #BTC
53
·
--
查看翻译
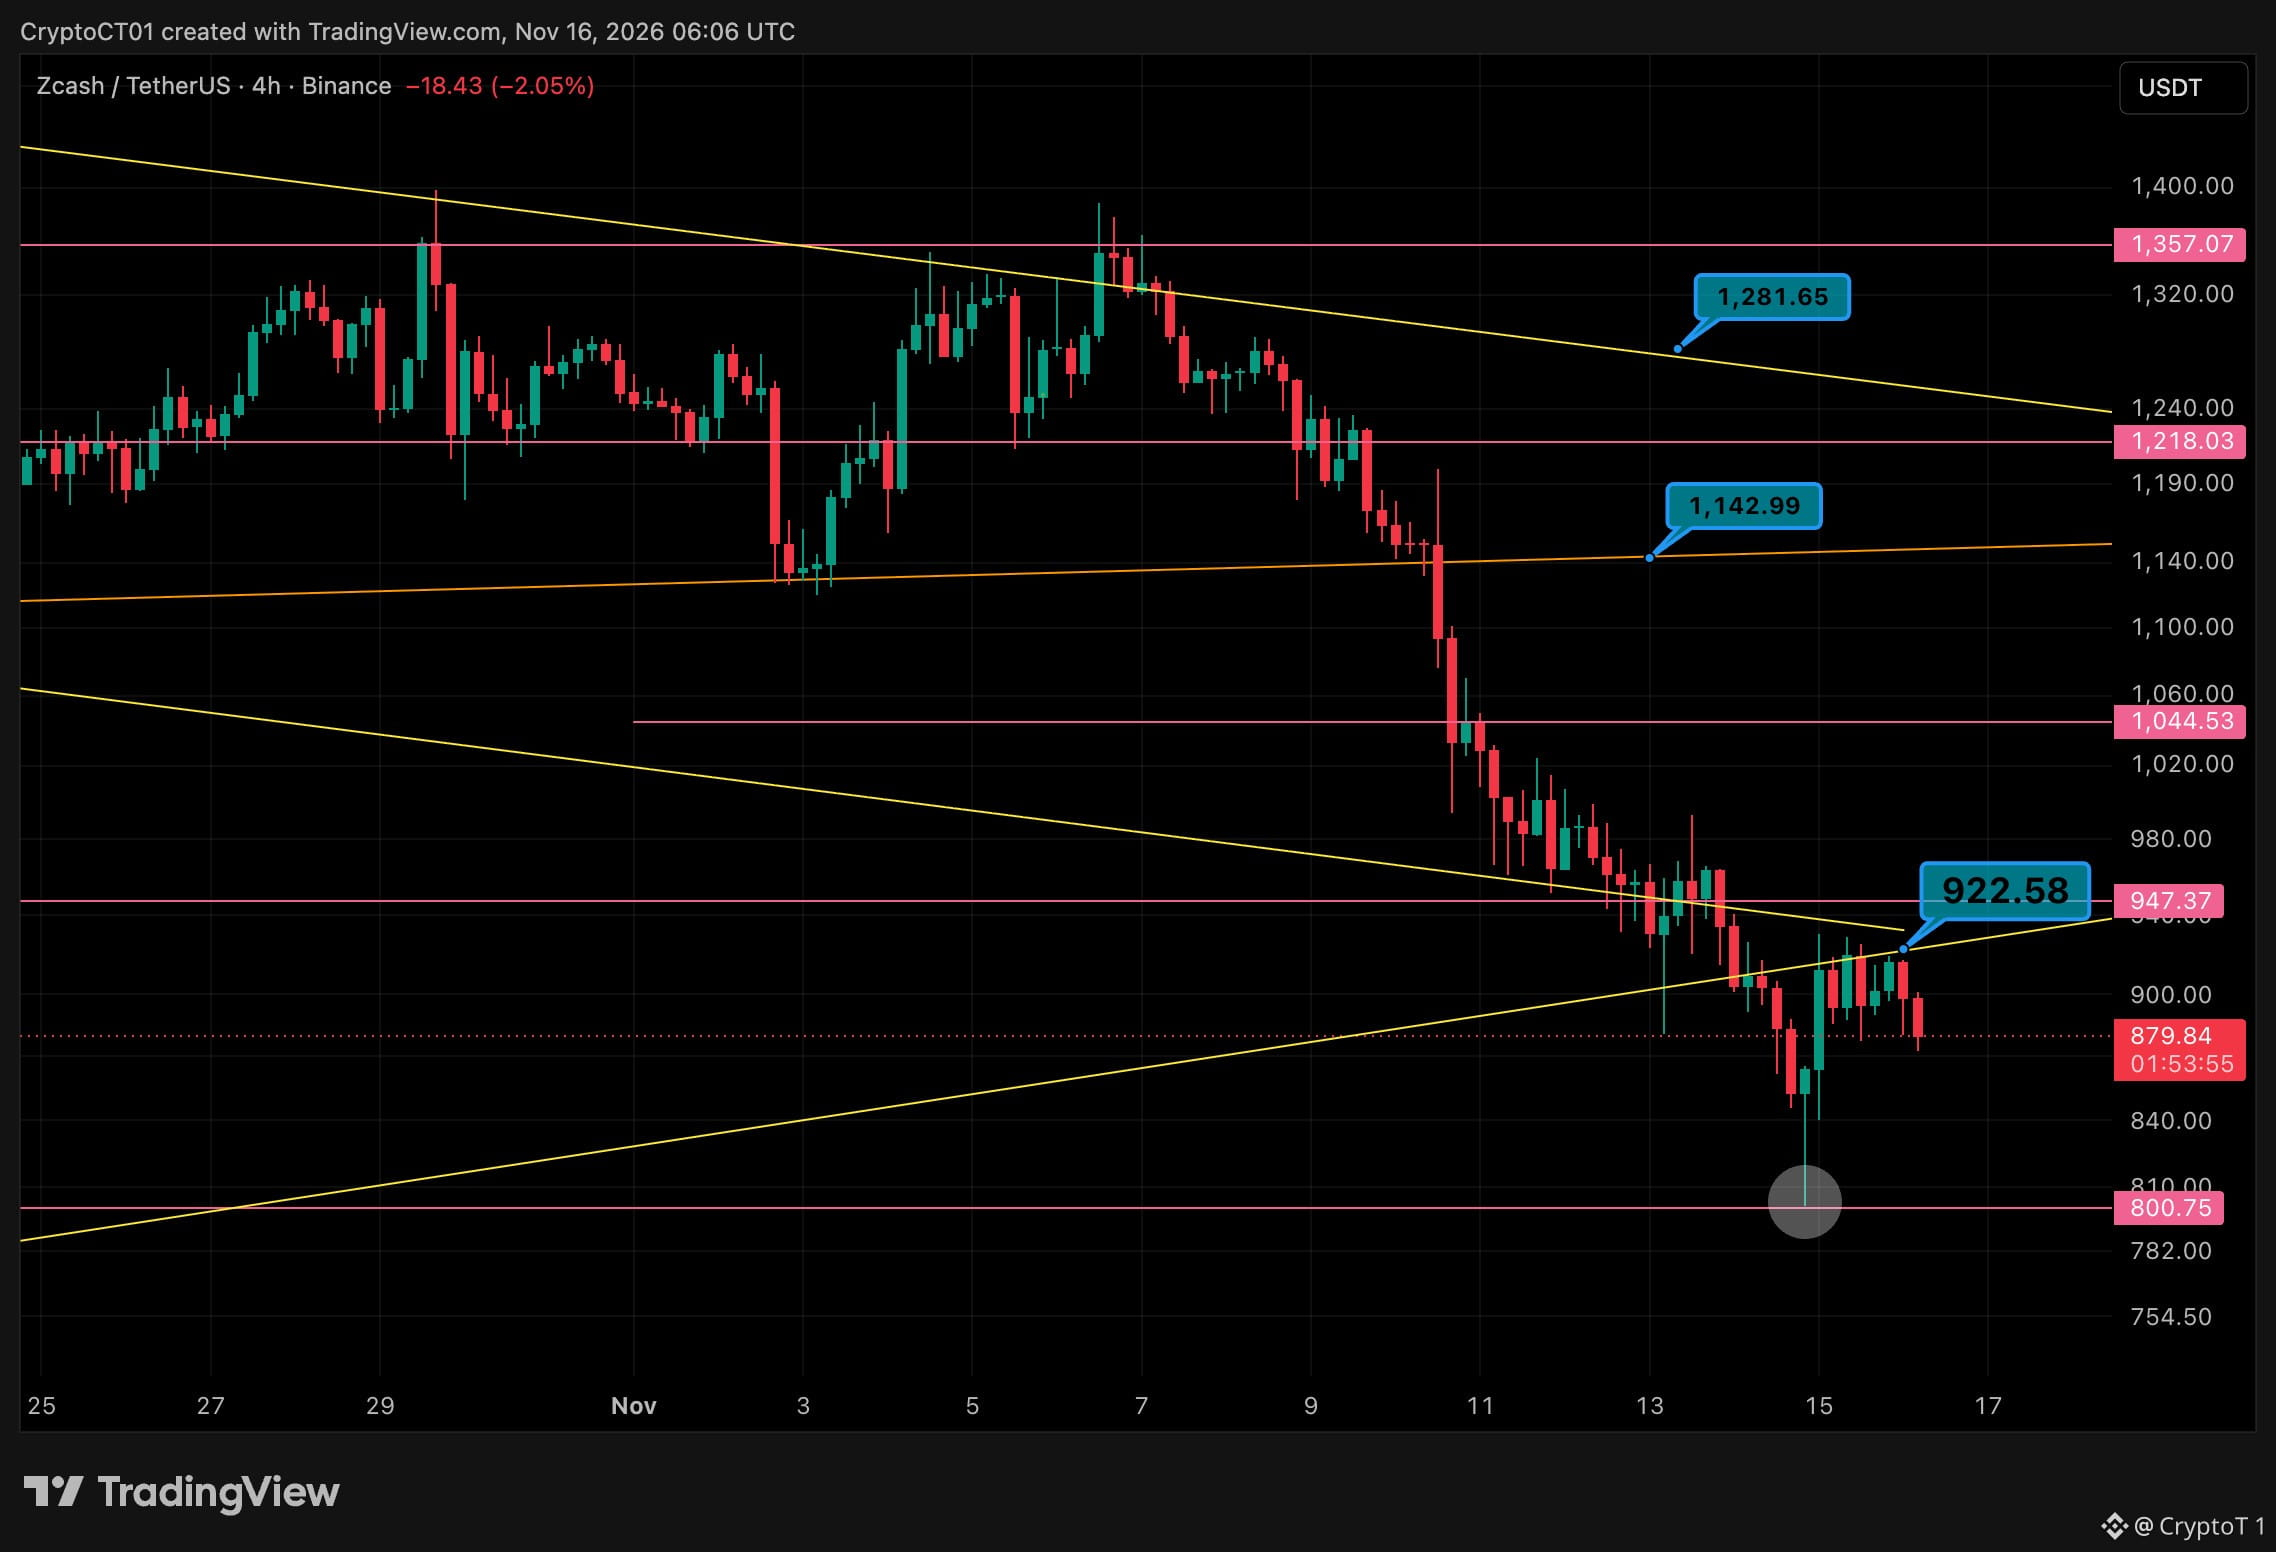
$ZEC Lost The 900 Zone. Retest Got Rejected 📉 Last week it bounced off 900 into 946. That bounce failed: 947 gave way, price wicked to 800 and the retest of the broken trendline got rejected at 922. 🔴 947 🔴 922 (broken trendline, now resistance) 🟢 800 (the wick low) Context: ZEC has been printing lower highs since early November and every bounce is getting sold at the falling trendline. Now trading around 880. My read: under 922 this is still a downtrend. A clean 4h close back above it and 947 is next. Until then I'm not chasing longs, let price come to you. The risk: lose 800 and there's no clear support under it, that wick was the last real buyer. Bounce from here or one more trip to 800? 👇 #ZEC #Zcash
$ZEC Lost The 900 Zone. Retest Got Rejected 📉 Last week it bounced off 900 into 946. That bounce failed: 947 gave way, price wicked to 800 and the retest of the broken trendline got rejected at 922. 🔴 947 🔴 922 (broken trendline, now resistance) 🟢 800 (the wick low) Context: ZEC has been printing lower highs since early November and every bounce is getting sold at the falling trendline. Now trading around 880. My read: under 922 this is still a downtrend. A clean 4h close back above it and 947 is next. Until then I'm not chasing longs, let price come to you. The risk: lose 800 and there's no clear support under it, that wick was the last real buyer. Bounce from here or one more trip to 800? 👇 #ZEC #Zcash
60
·
--
查看翻译
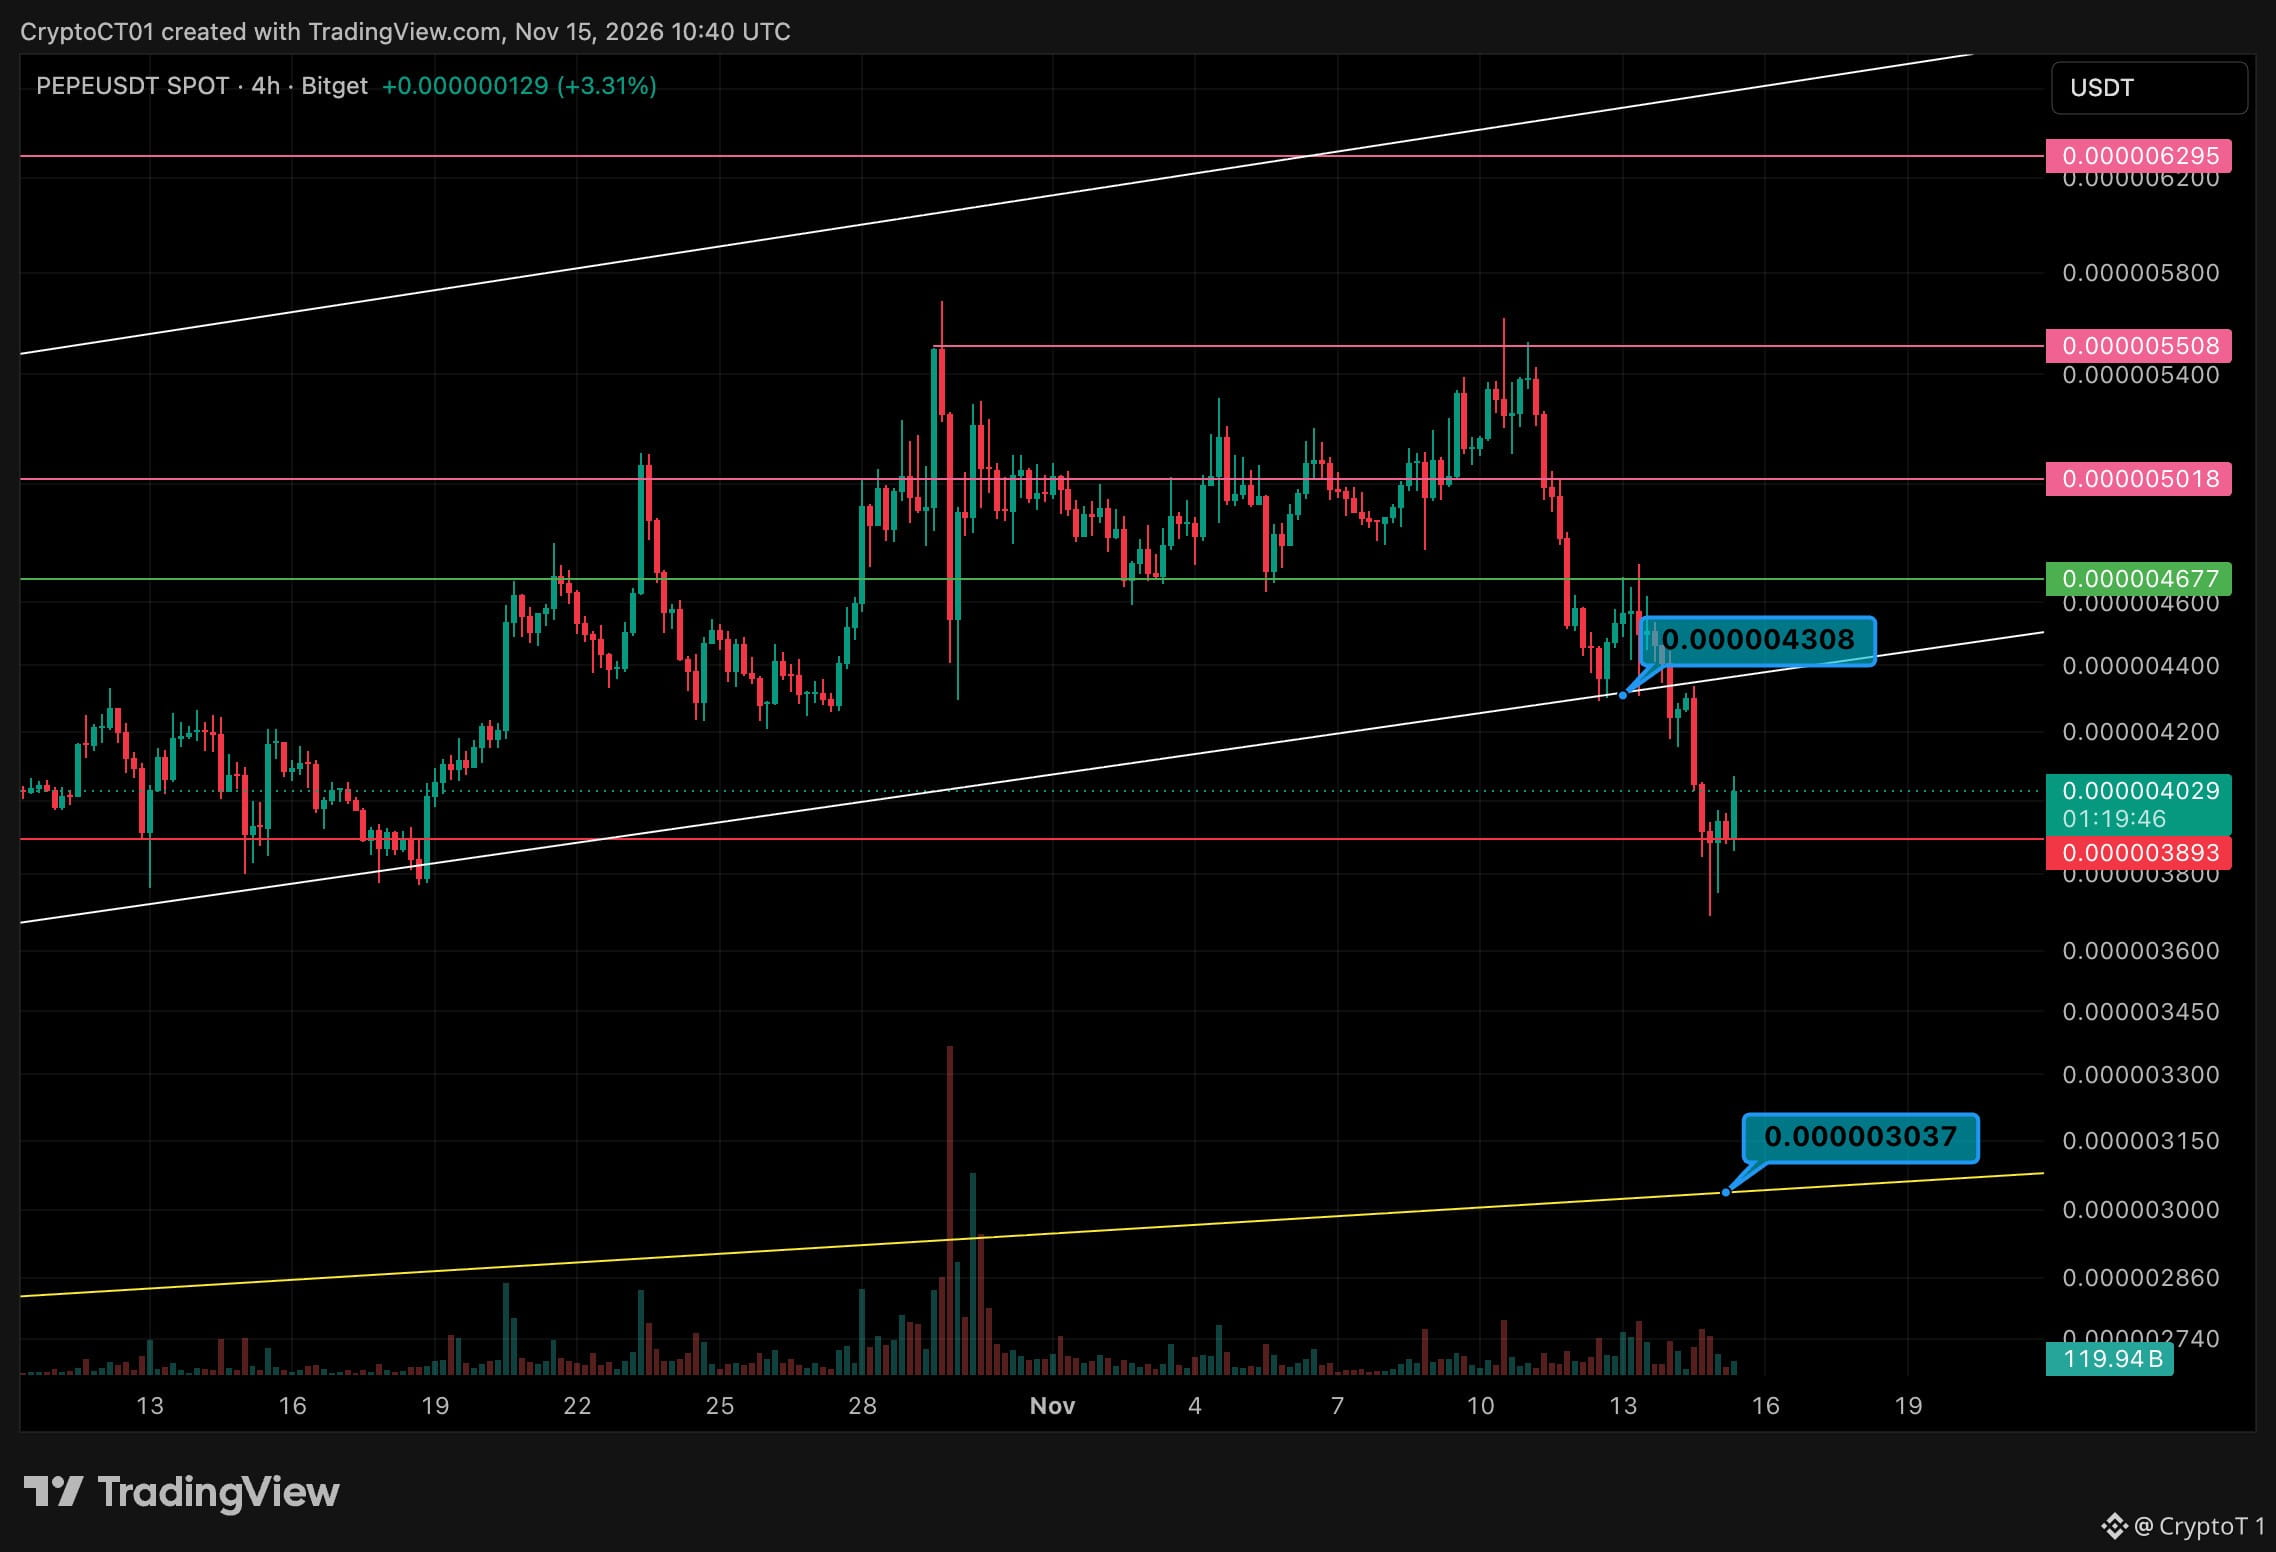
$PEPE Lost The Channel. Now It's Testing The Floor 🐸📉 🔴 0.000004677 🔴 0.000004381 (old channel support, now resistance) 🟢 0.000003893 🟢 0.000003037 (long-term trendline) Context: PEPE ranged for weeks, then broke down hard on the 13th and lost the rising channel it had held since October. It wicked under 0.0000039 and buyers stepped in. My read: 0.0000039 is the line in the sand. If it holds, I'm watching for a retest of the broken channel at 0.0000043. Reclaim that and 0.0000046 opens up. The risk: Lose 0.0000039 on a 4h close and there isn't much until the long-term trendline near 0.0000030. That's about 25% lower. Are you buying this dip or waiting for lower? 👇 #PEPE #Memecoins
$PEPE Lost The Channel. Now It's Testing The Floor 🐸📉 🔴 0.000004677 🔴 0.000004381 (old channel support, now resistance) 🟢 0.000003893 🟢 0.000003037 (long-term trendline) Context: PEPE ranged for weeks, then broke down hard on the 13th and lost the rising channel it had held since October. It wicked under 0.0000039 and buyers stepped in. My read: 0.0000039 is the line in the sand. If it holds, I'm watching for a retest of the broken channel at 0.0000043. Reclaim that and 0.0000046 opens up. The risk: Lose 0.0000039 on a 4h close and there isn't much until the long-term trendline near 0.0000030. That's about 25% lower. Are you buying this dip or waiting for lower? 👇 #PEPE #Memecoins
58
·
--
查看翻译
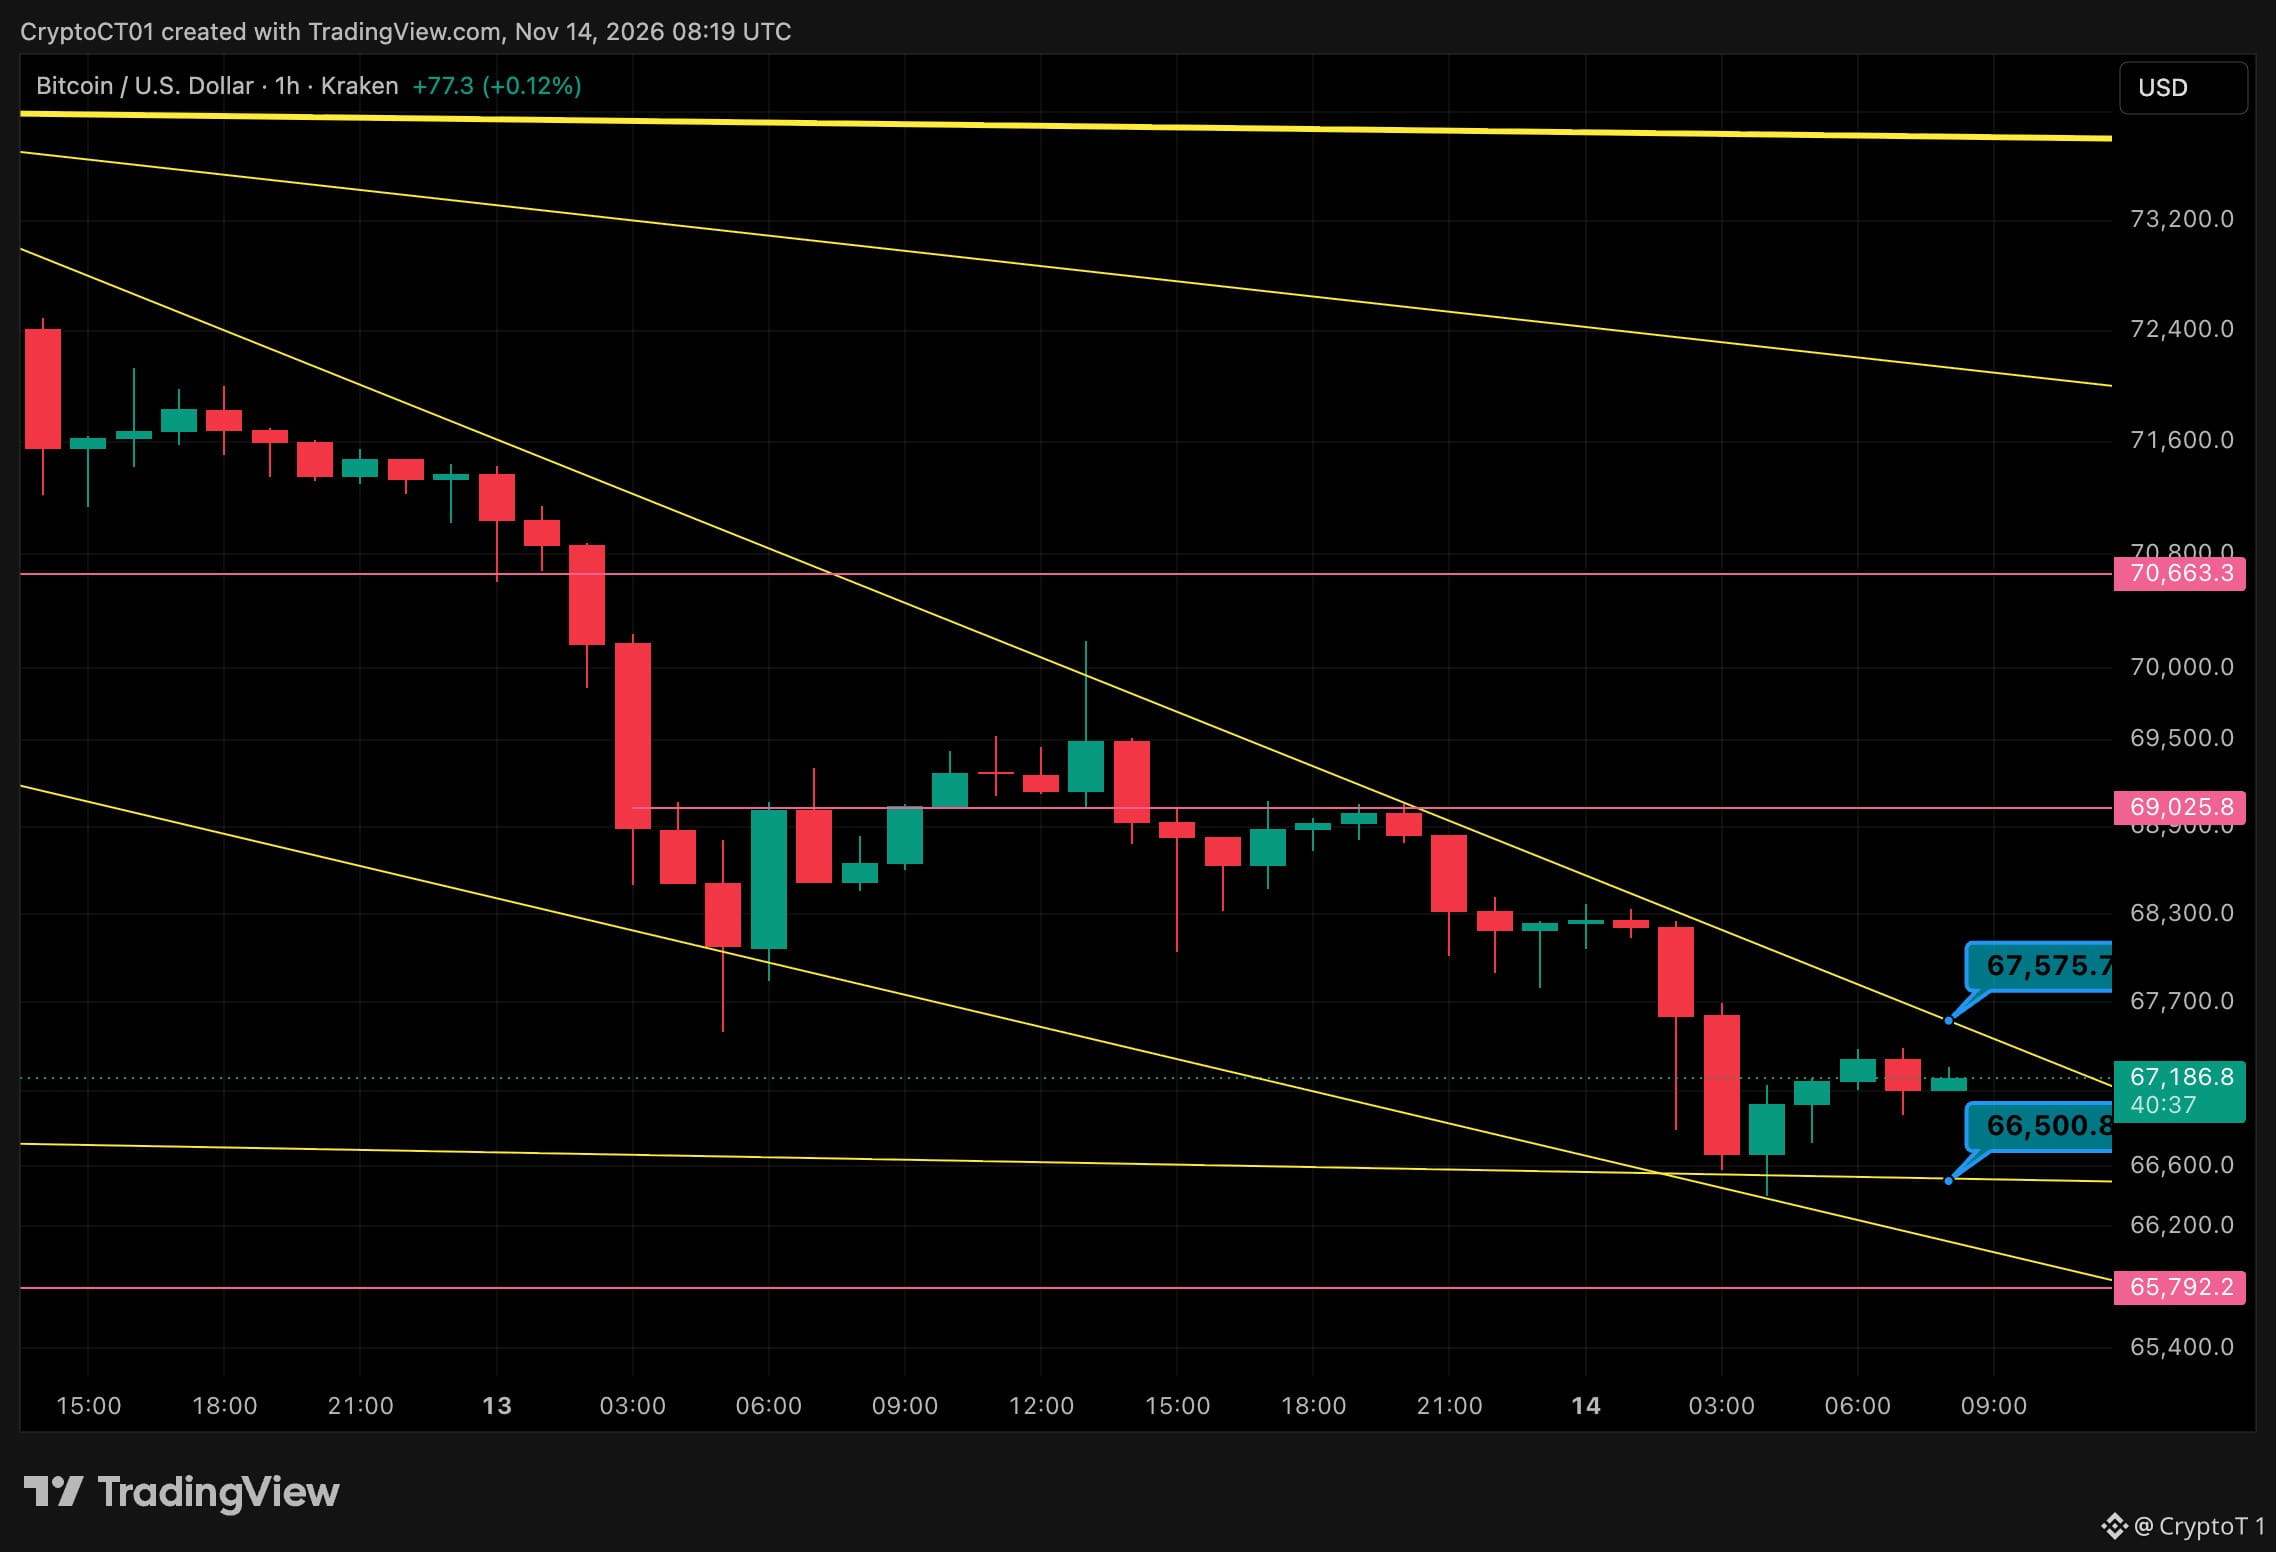
$BTC Stuck Under The Downtrend Line 📉👀 🔴 69,025 🔴 67,575 (downtrend line) ⚪ Now: 67,186 🟢 66,500 🟢 65,792 Context: Bitcoin is officially in a bear market, more than 20% off the September high. On the 1h chart we got an overnight flush into the 66.4K zone, and every bounce since then has been sold at the falling trendline. My read: the 66.5K floor has held so far. If we get a clean 1h close above 67.6K, the trendline breaks and 69K is the next magnet. Until then it's a bounce inside a downtrend, so I'm not chasing it. Let price come to you. The risk: lose 66.5K and 65.8K is next. Weekend liquidity is thin, so expect wicks both ways. Break up or one more flush first? 👇 #Bitcoin #BTC
$BTC Stuck Under The Downtrend Line 📉👀 🔴 69,025 🔴 67,575 (downtrend line) ⚪ Now: 67,186 🟢 66,500 🟢 65,792 Context: Bitcoin is officially in a bear market, more than 20% off the September high. On the 1h chart we got an overnight flush into the 66.4K zone, and every bounce since then has been sold at the falling trendline. My read: the 66.5K floor has held so far. If we get a clean 1h close above 67.6K, the trendline breaks and 69K is the next magnet. Until then it's a bounce inside a downtrend, so I'm not chasing it. Let price come to you. The risk: lose 66.5K and 65.8K is next. Weekend liquidity is thin, so expect wicks both ways. Break up or one more flush first? 👇 #Bitcoin #BTC
68
·
--
查看翻译
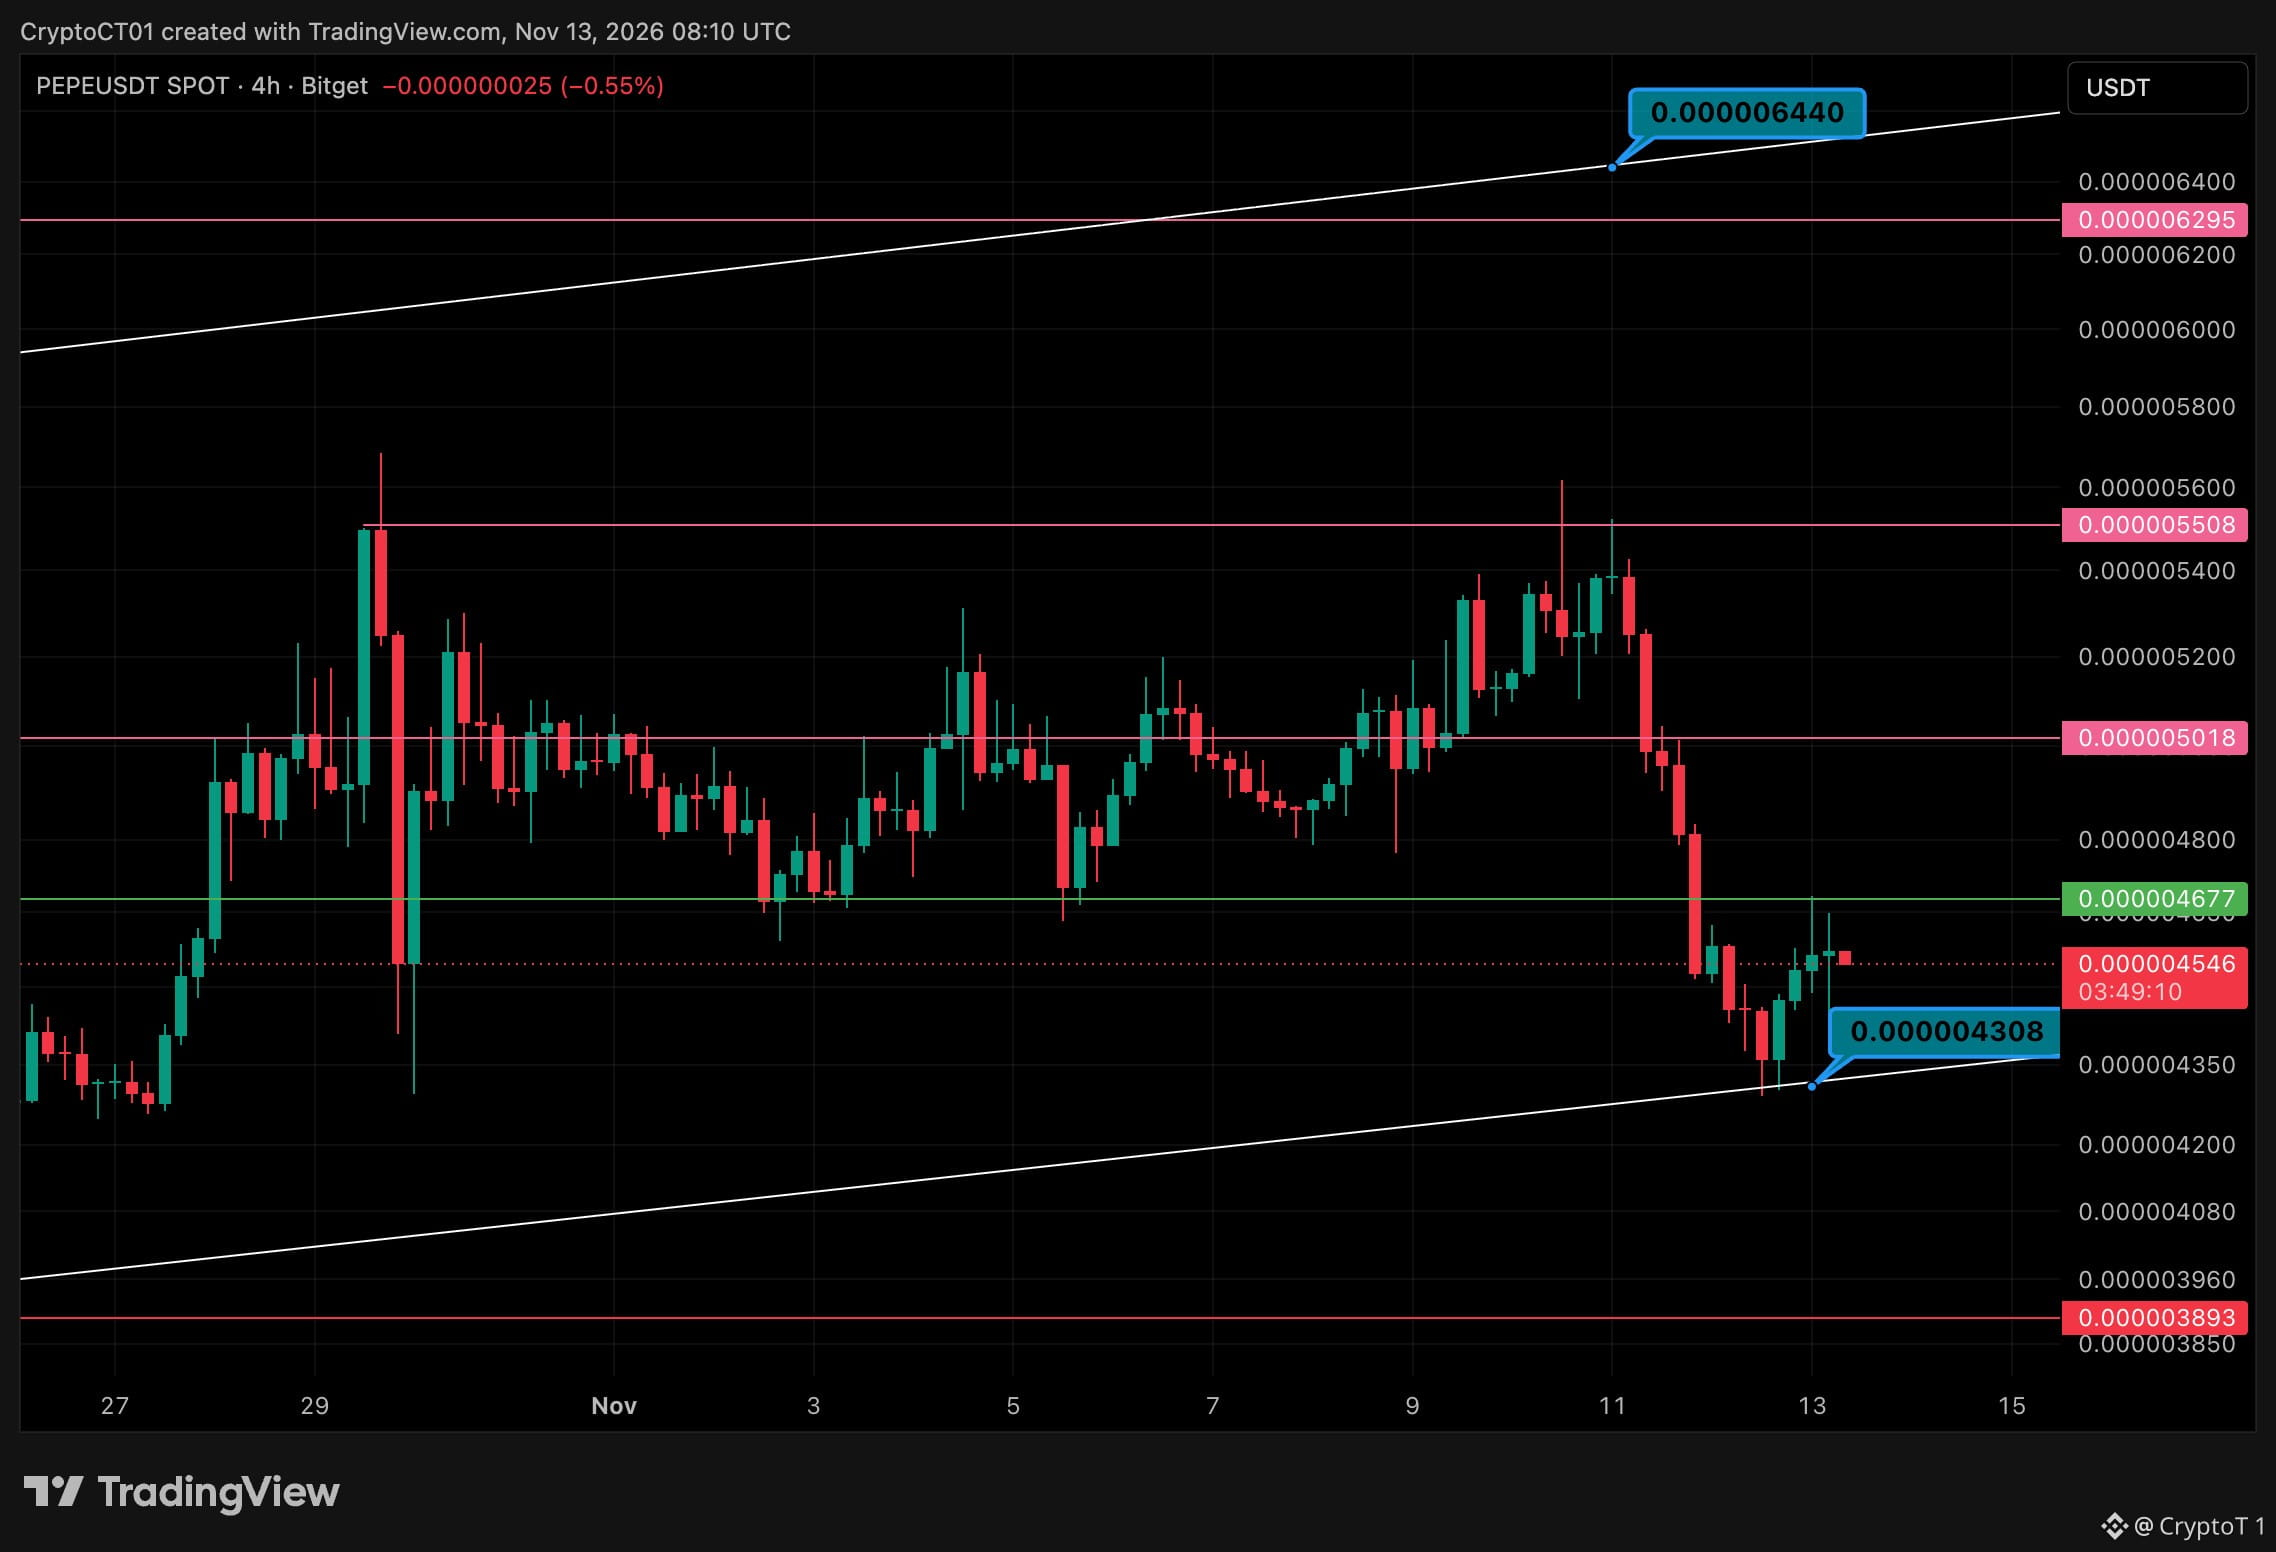
$PEPE Bounced Off The Channel Floor 🐸 🔴 0.000005018 (old range floor) 🔴 0.000004677 (first lid, testing now) 🟢 0.000004308 (rising channel support) 🟢 0.000003893 (last line) Context: PEPE lost its range on 11 Nov, flushed straight into the rising channel support and bounced. It's at 0.000004546 now, sitting right under 0.000004677. My read: A 4h close above 0.000004677 opens a move back to 0.000005018. Lose 0.000004308 and the channel breaks, putting 0.000003893 in play. The risk: BTC is under 70K. If BTC slides again, PEPE gets dragged with it and memes bleed first. Channel bounce or dead cat? 👇 #PEPE #Memecoins
$PEPE Bounced Off The Channel Floor 🐸 🔴 0.000005018 (old range floor) 🔴 0.000004677 (first lid, testing now) 🟢 0.000004308 (rising channel support) 🟢 0.000003893 (last line) Context: PEPE lost its range on 11 Nov, flushed straight into the rising channel support and bounced. It's at 0.000004546 now, sitting right under 0.000004677. My read: A 4h close above 0.000004677 opens a move back to 0.000005018. Lose 0.000004308 and the channel breaks, putting 0.000003893 in play. The risk: BTC is under 70K. If BTC slides again, PEPE gets dragged with it and memes bleed first. Channel bounce or dead cat? 👇 #PEPE #Memecoins
80
·
--
查看翻译
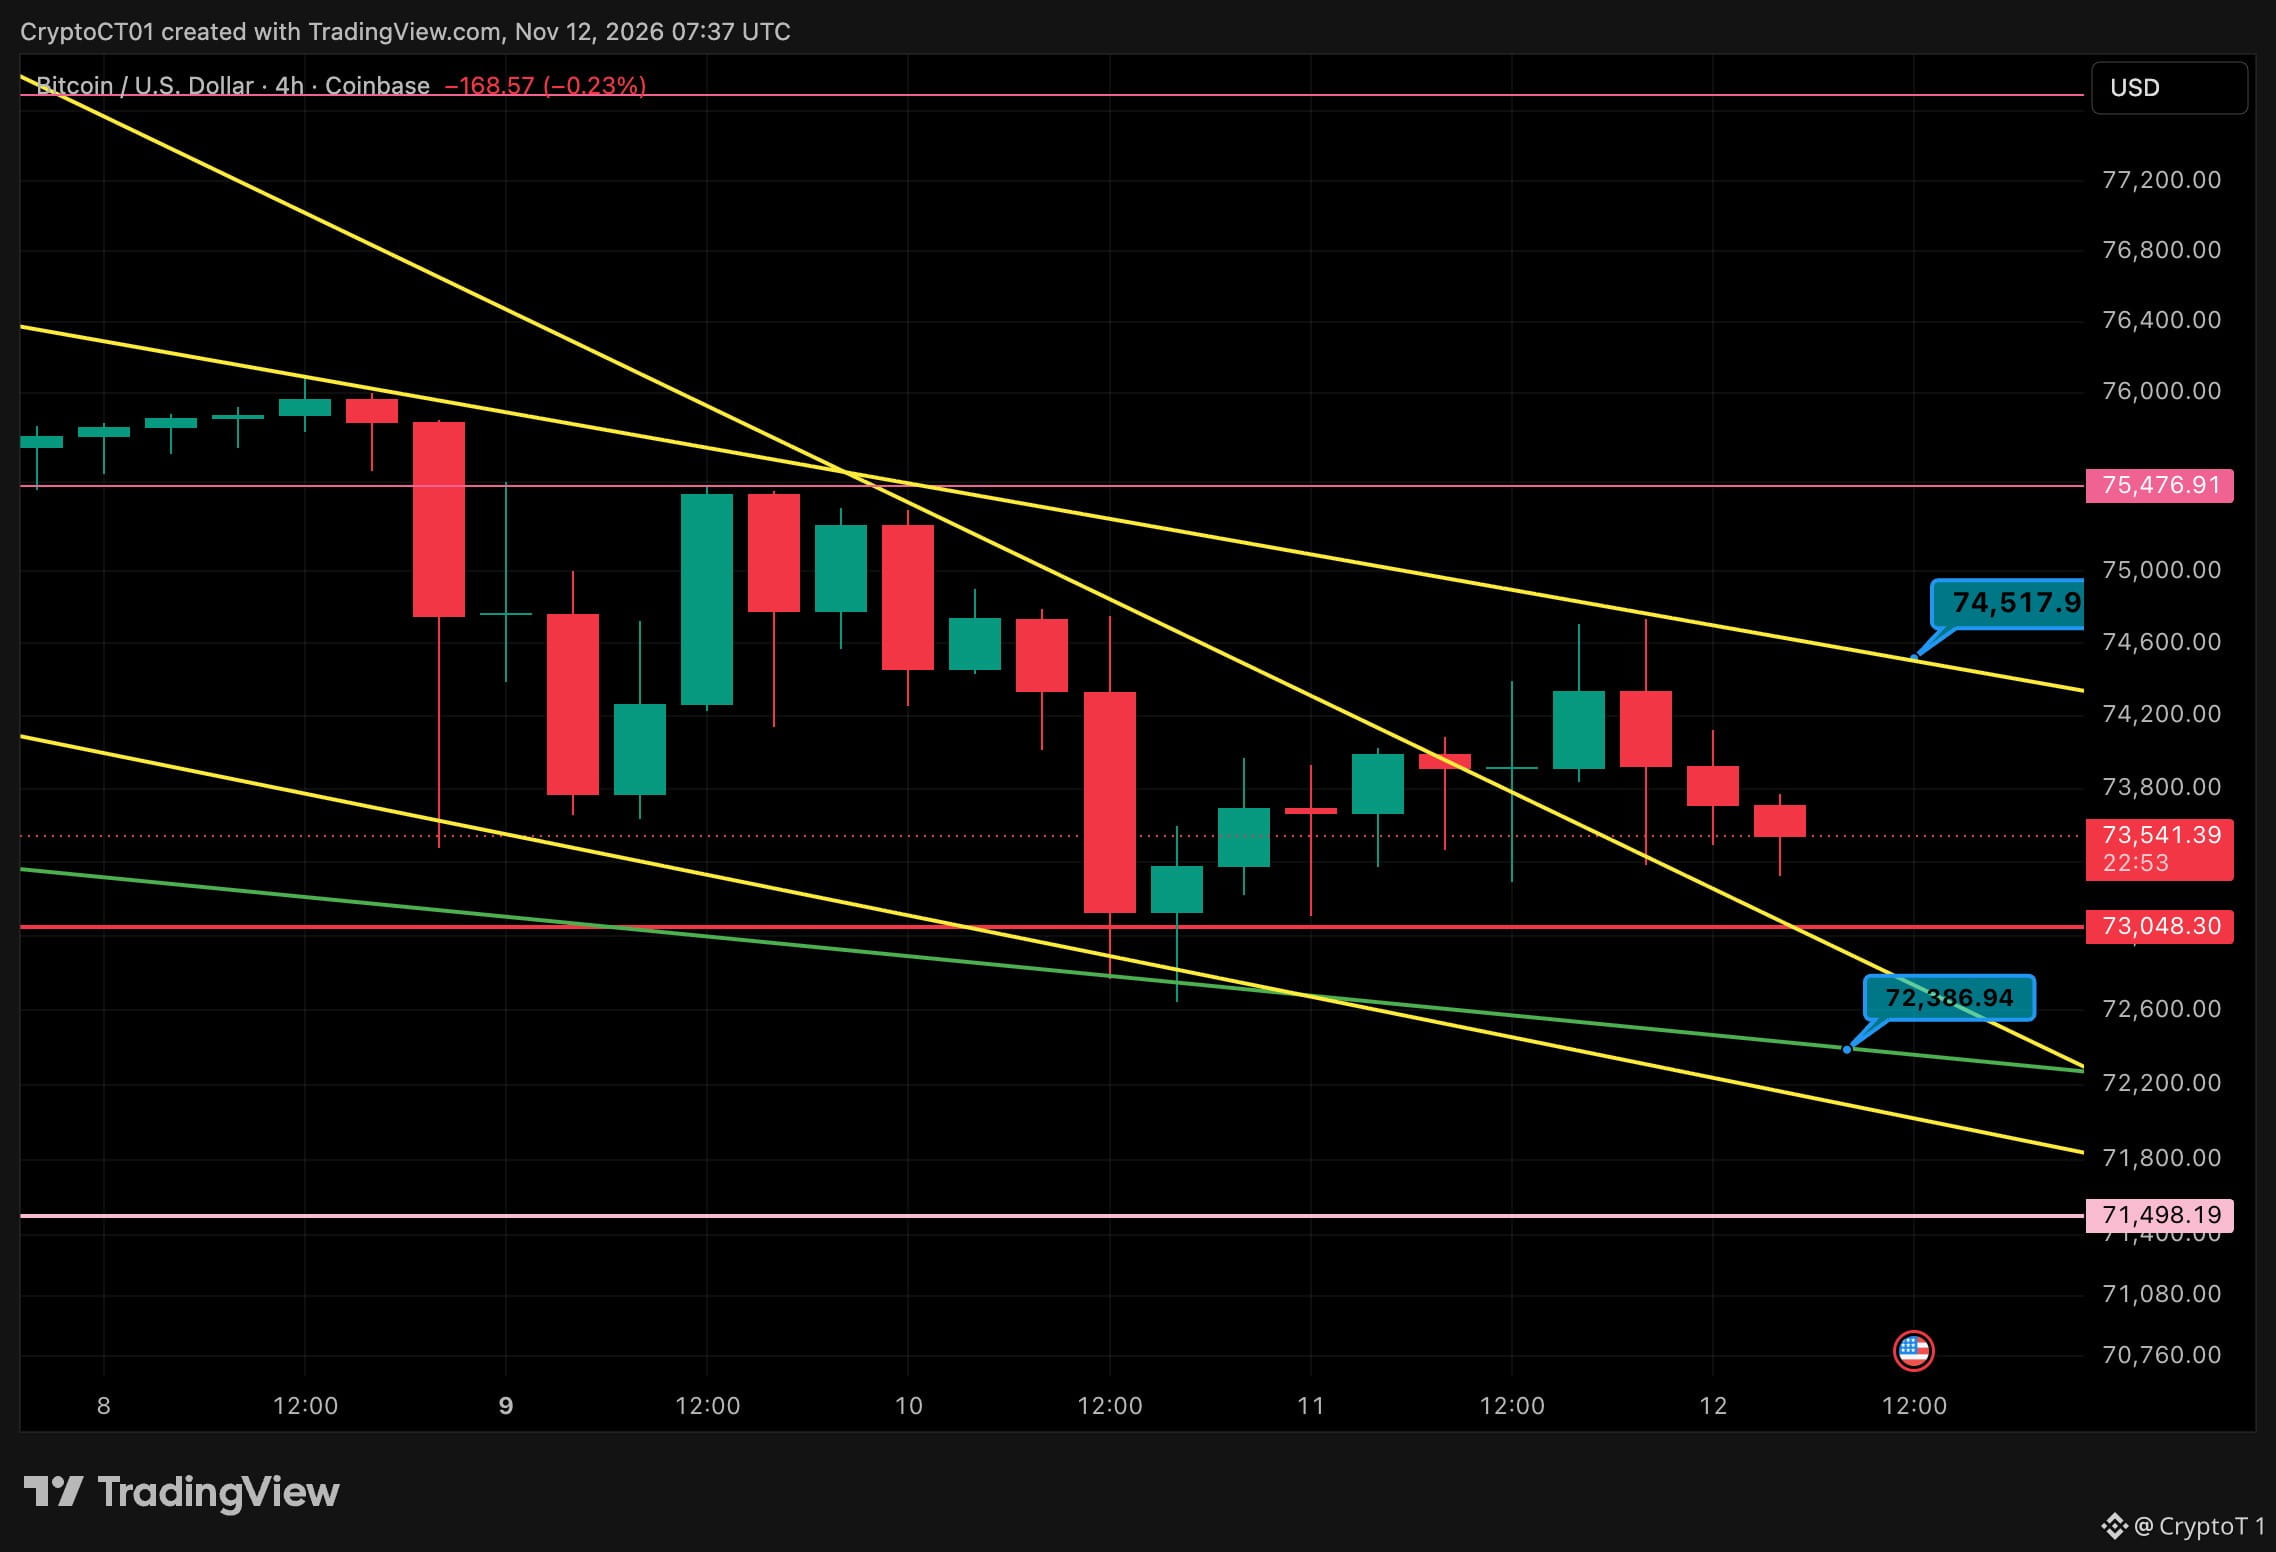
$BTC Stuck Between The Lines 📐 4h chart. Price is at 73.5K, squeezed between the top of the wedge and the steep trendline it broke above yesterday. 🔴 Resistance: 74,517 (wedge top), then 75,477 🟢 Support: 73,048, then 72,387, then 71,498 Context: Five straight days of ETF outflows, MSCI dropping $MSTR , and $BTC has barely moved. It's still holding just above the 200-day average around 73.2K. My read: No chase from here. 74.5K has rejected it twice, so I want a 4h close above it before I lean bullish. That opens 75.5K. Lose 73K and the green trendline at 72.4K is the next real test. Below that I'm watching 71.5K. The risk: This is a squeeze. When it breaks, it moves fast. Let price pick a side first. Break above 74.5K or a flush to 72.4K first? 👇 #BTC #Bitcoin
$BTC Stuck Between The Lines 📐 4h chart. Price is at 73.5K, squeezed between the top of the wedge and the steep trendline it broke above yesterday. 🔴 Resistance: 74,517 (wedge top), then 75,477 🟢 Support: 73,048, then 72,387, then 71,498 Context: Five straight days of ETF outflows, MSCI dropping $MSTR , and $BTC has barely moved. It's still holding just above the 200-day average around 73.2K. My read: No chase from here. 74.5K has rejected it twice, so I want a 4h close above it before I lean bullish. That opens 75.5K. Lose 73K and the green trendline at 72.4K is the next real test. Below that I'm watching 71.5K. The risk: This is a squeeze. When it breaks, it moves fast. Let price pick a side first. Break above 74.5K or a flush to 72.4K first? 👇 #BTC #Bitcoin
63
·
--
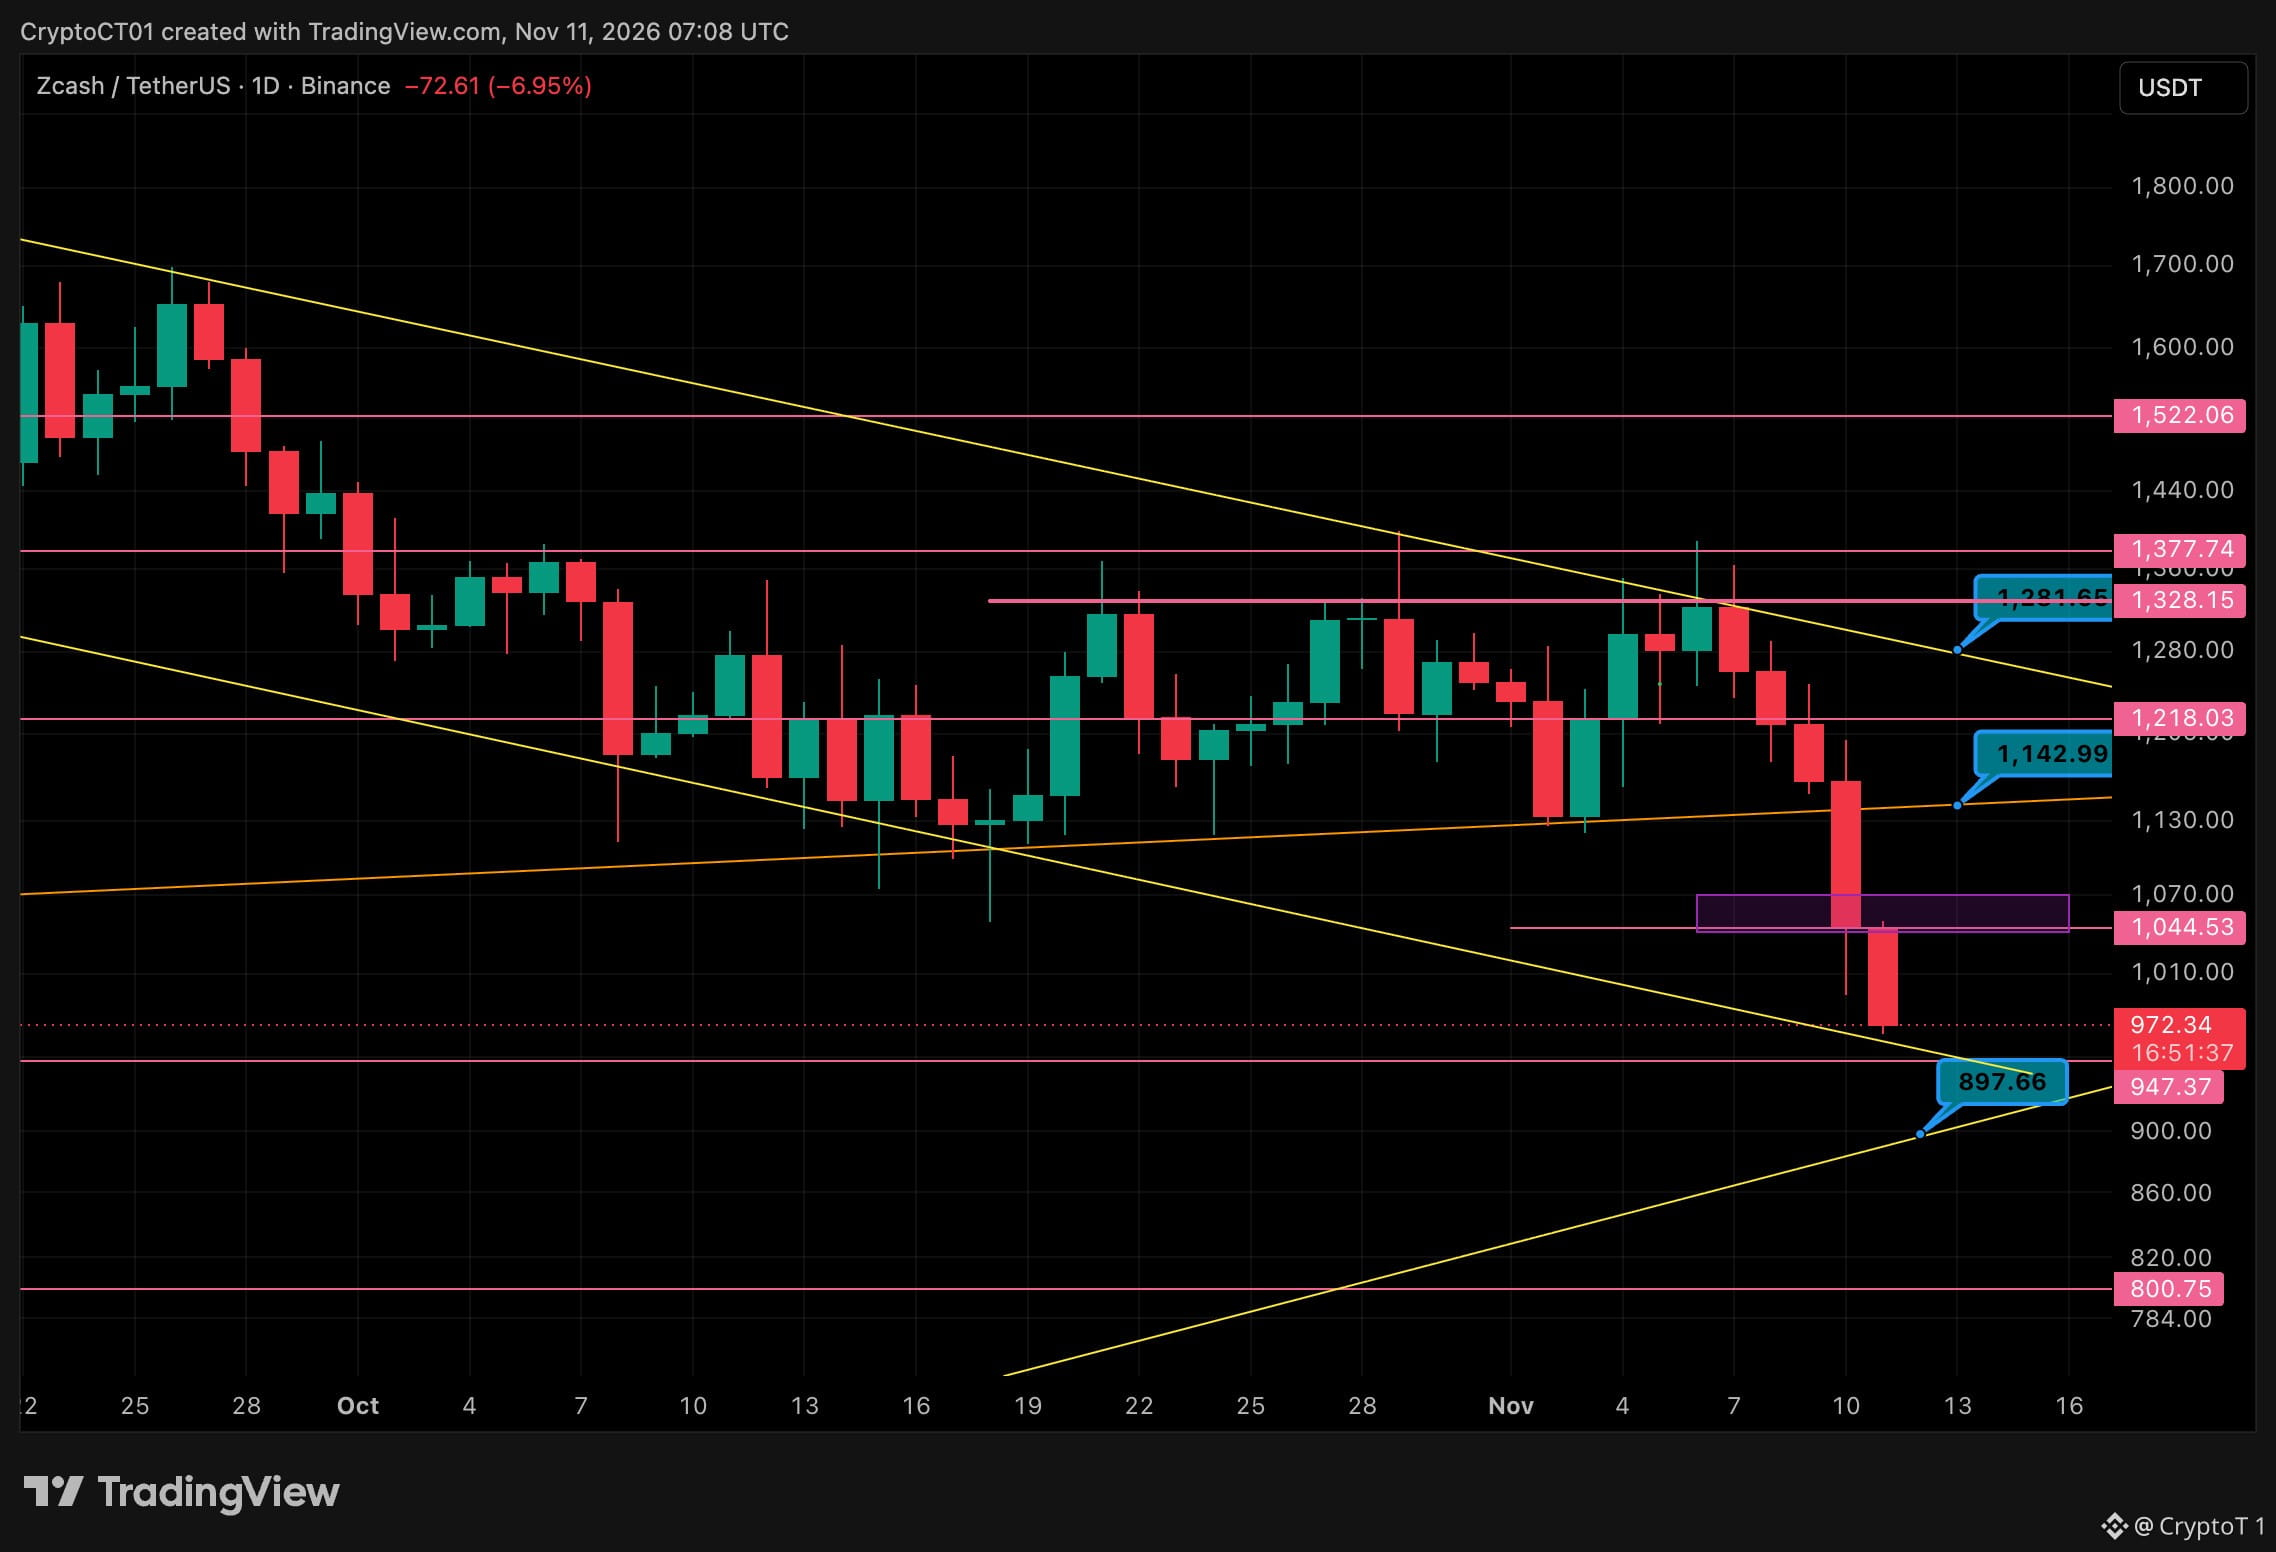
$ZEC 跌破趋势线,现已低于 1,000 📉 昨天,1,143 是关键支撑线。日线K棒直接跌穿这条线和 1,044 - 1,070 的需求区,目前在 972 附近交易。 🔴 1,143(已跌破的趋势线) 🔴 1,044(原需求区,现为阻力位) 🟢 947 支撑位 🟢 约 900,下降趋势线与上升趋势线的交会处 🟢 若失守,下一个看 800 我的看法:现在不接飞刀。我想先看到 947 或 900 的共振支撑守住并出现反应,才会考虑做多。若日线收复 1,044,走势就会反转。 风险:若失守 900,下方直到 800 之前几乎没有支撑。 你觉得 $ZEC 会在哪里找到底部?👇 NFA #ZEC #Zcash #加密货币
$ZEC 跌破趋势线,现已低于 1,000 📉 昨天,1,143 是关键支撑线。日线K棒直接跌穿这条线和 1,044 - 1,070 的需求区,目前在 972 附近交易。 🔴 1,143(已跌破的趋势线) 🔴 1,044(原需求区,现为阻力位) 🟢 947 支撑位 🟢 约 900,下降趋势线与上升趋势线的交会处 🟢 若失守,下一个看 800 我的看法:现在不接飞刀。我想先看到 947 或 900 的共振支撑守住并出现反应,才会考虑做多。若日线收复 1,044,走势就会反转。 风险:若失守 900,下方直到 800 之前几乎没有支撑。 你觉得 $ZEC 会在哪里找到底部?👇 NFA #ZEC #Zcash #加密货币
43
·
--
查看翻译
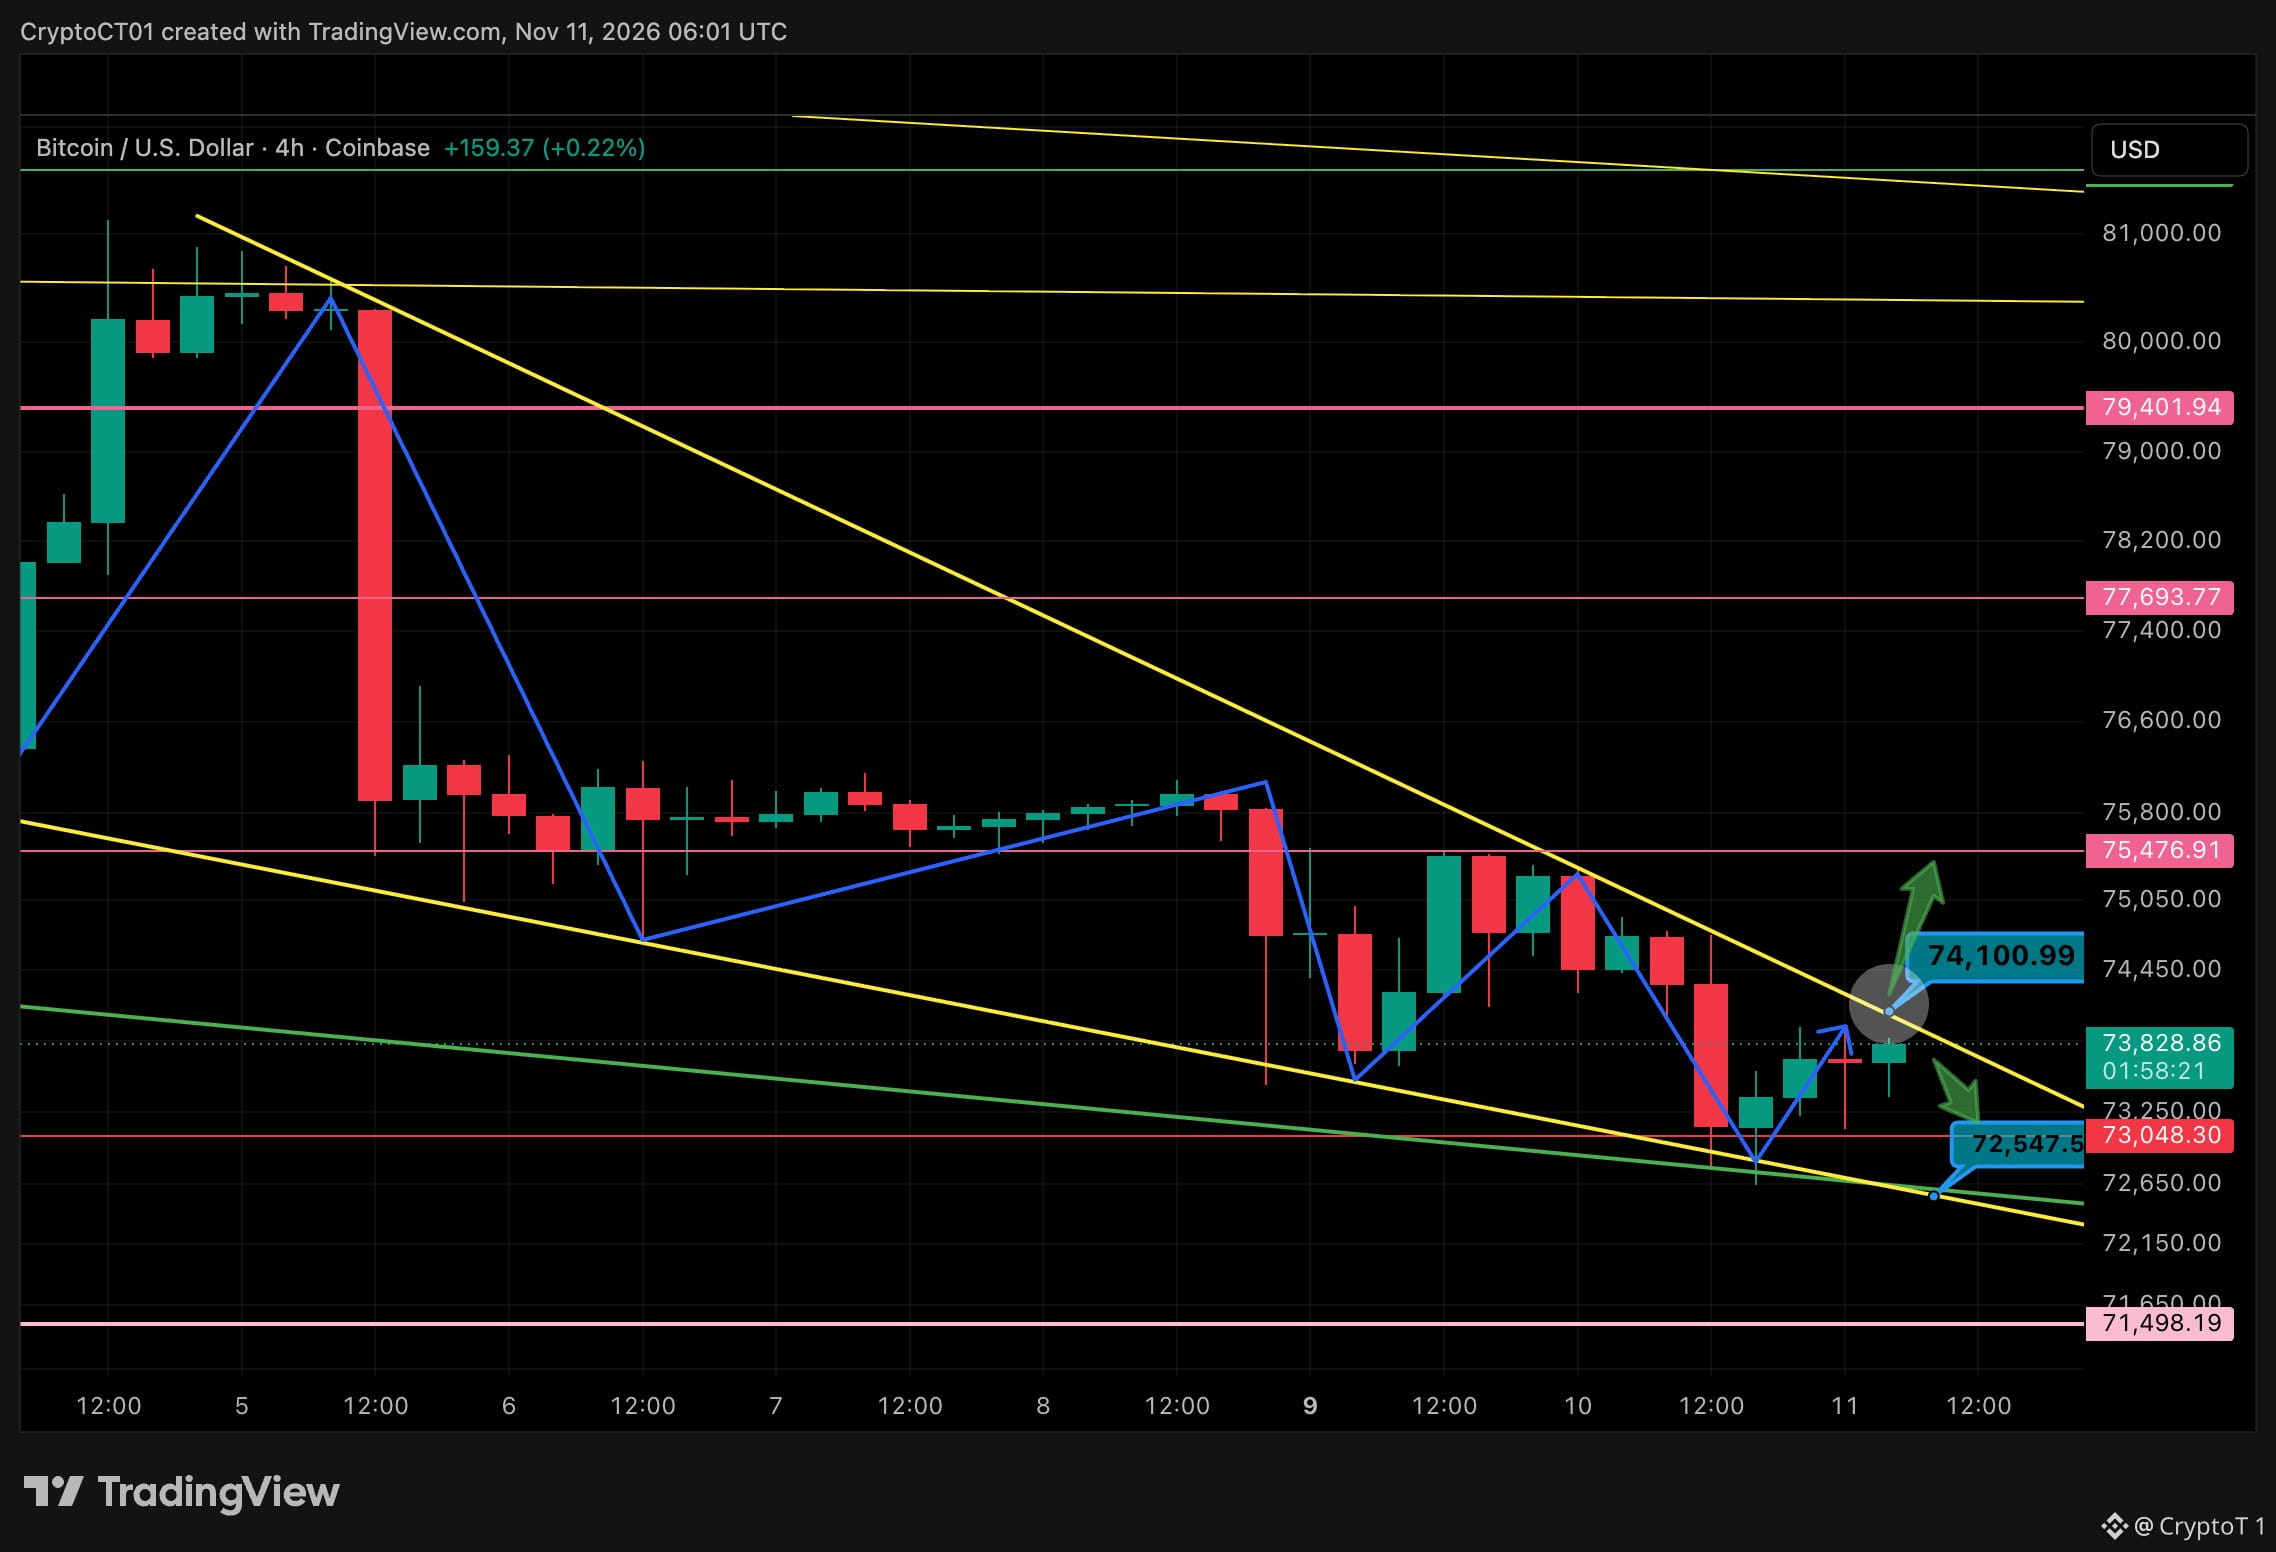
$BTC Pressing The Top Of The Wedge 📐 4h chart. Price has been squeezing inside a falling wedge since the 80K rejection, and it's now sitting right under the upper trendline around 74.1K. 🟢 Break and hold above 74.1K opens 75.5K, then 77.7K 🔴 Support at 73K, then the wedge floor near 72.5K 🔴 Lose that and 71.5K is next My read: CPI wicked us to 72.7K and buyers stepped in at the wedge base. A clean 4h close above the trendline is the trigger I'm watching. No chasing before it. The risk: another rejection here sends it straight back to the bottom of the range. Breakout or one more flush first? 👇 NFA #Bitcoin #BTC #Crypto
$BTC Pressing The Top Of The Wedge 📐 4h chart. Price has been squeezing inside a falling wedge since the 80K rejection, and it's now sitting right under the upper trendline around 74.1K. 🟢 Break and hold above 74.1K opens 75.5K, then 77.7K 🔴 Support at 73K, then the wedge floor near 72.5K 🔴 Lose that and 71.5K is next My read: CPI wicked us to 72.7K and buyers stepped in at the wedge base. A clean 4h close above the trendline is the trigger I'm watching. No chasing before it. The risk: another rejection here sends it straight back to the bottom of the range. Breakout or one more flush first? 👇 NFA #Bitcoin #BTC #Crypto
57
·
--
查看翻译
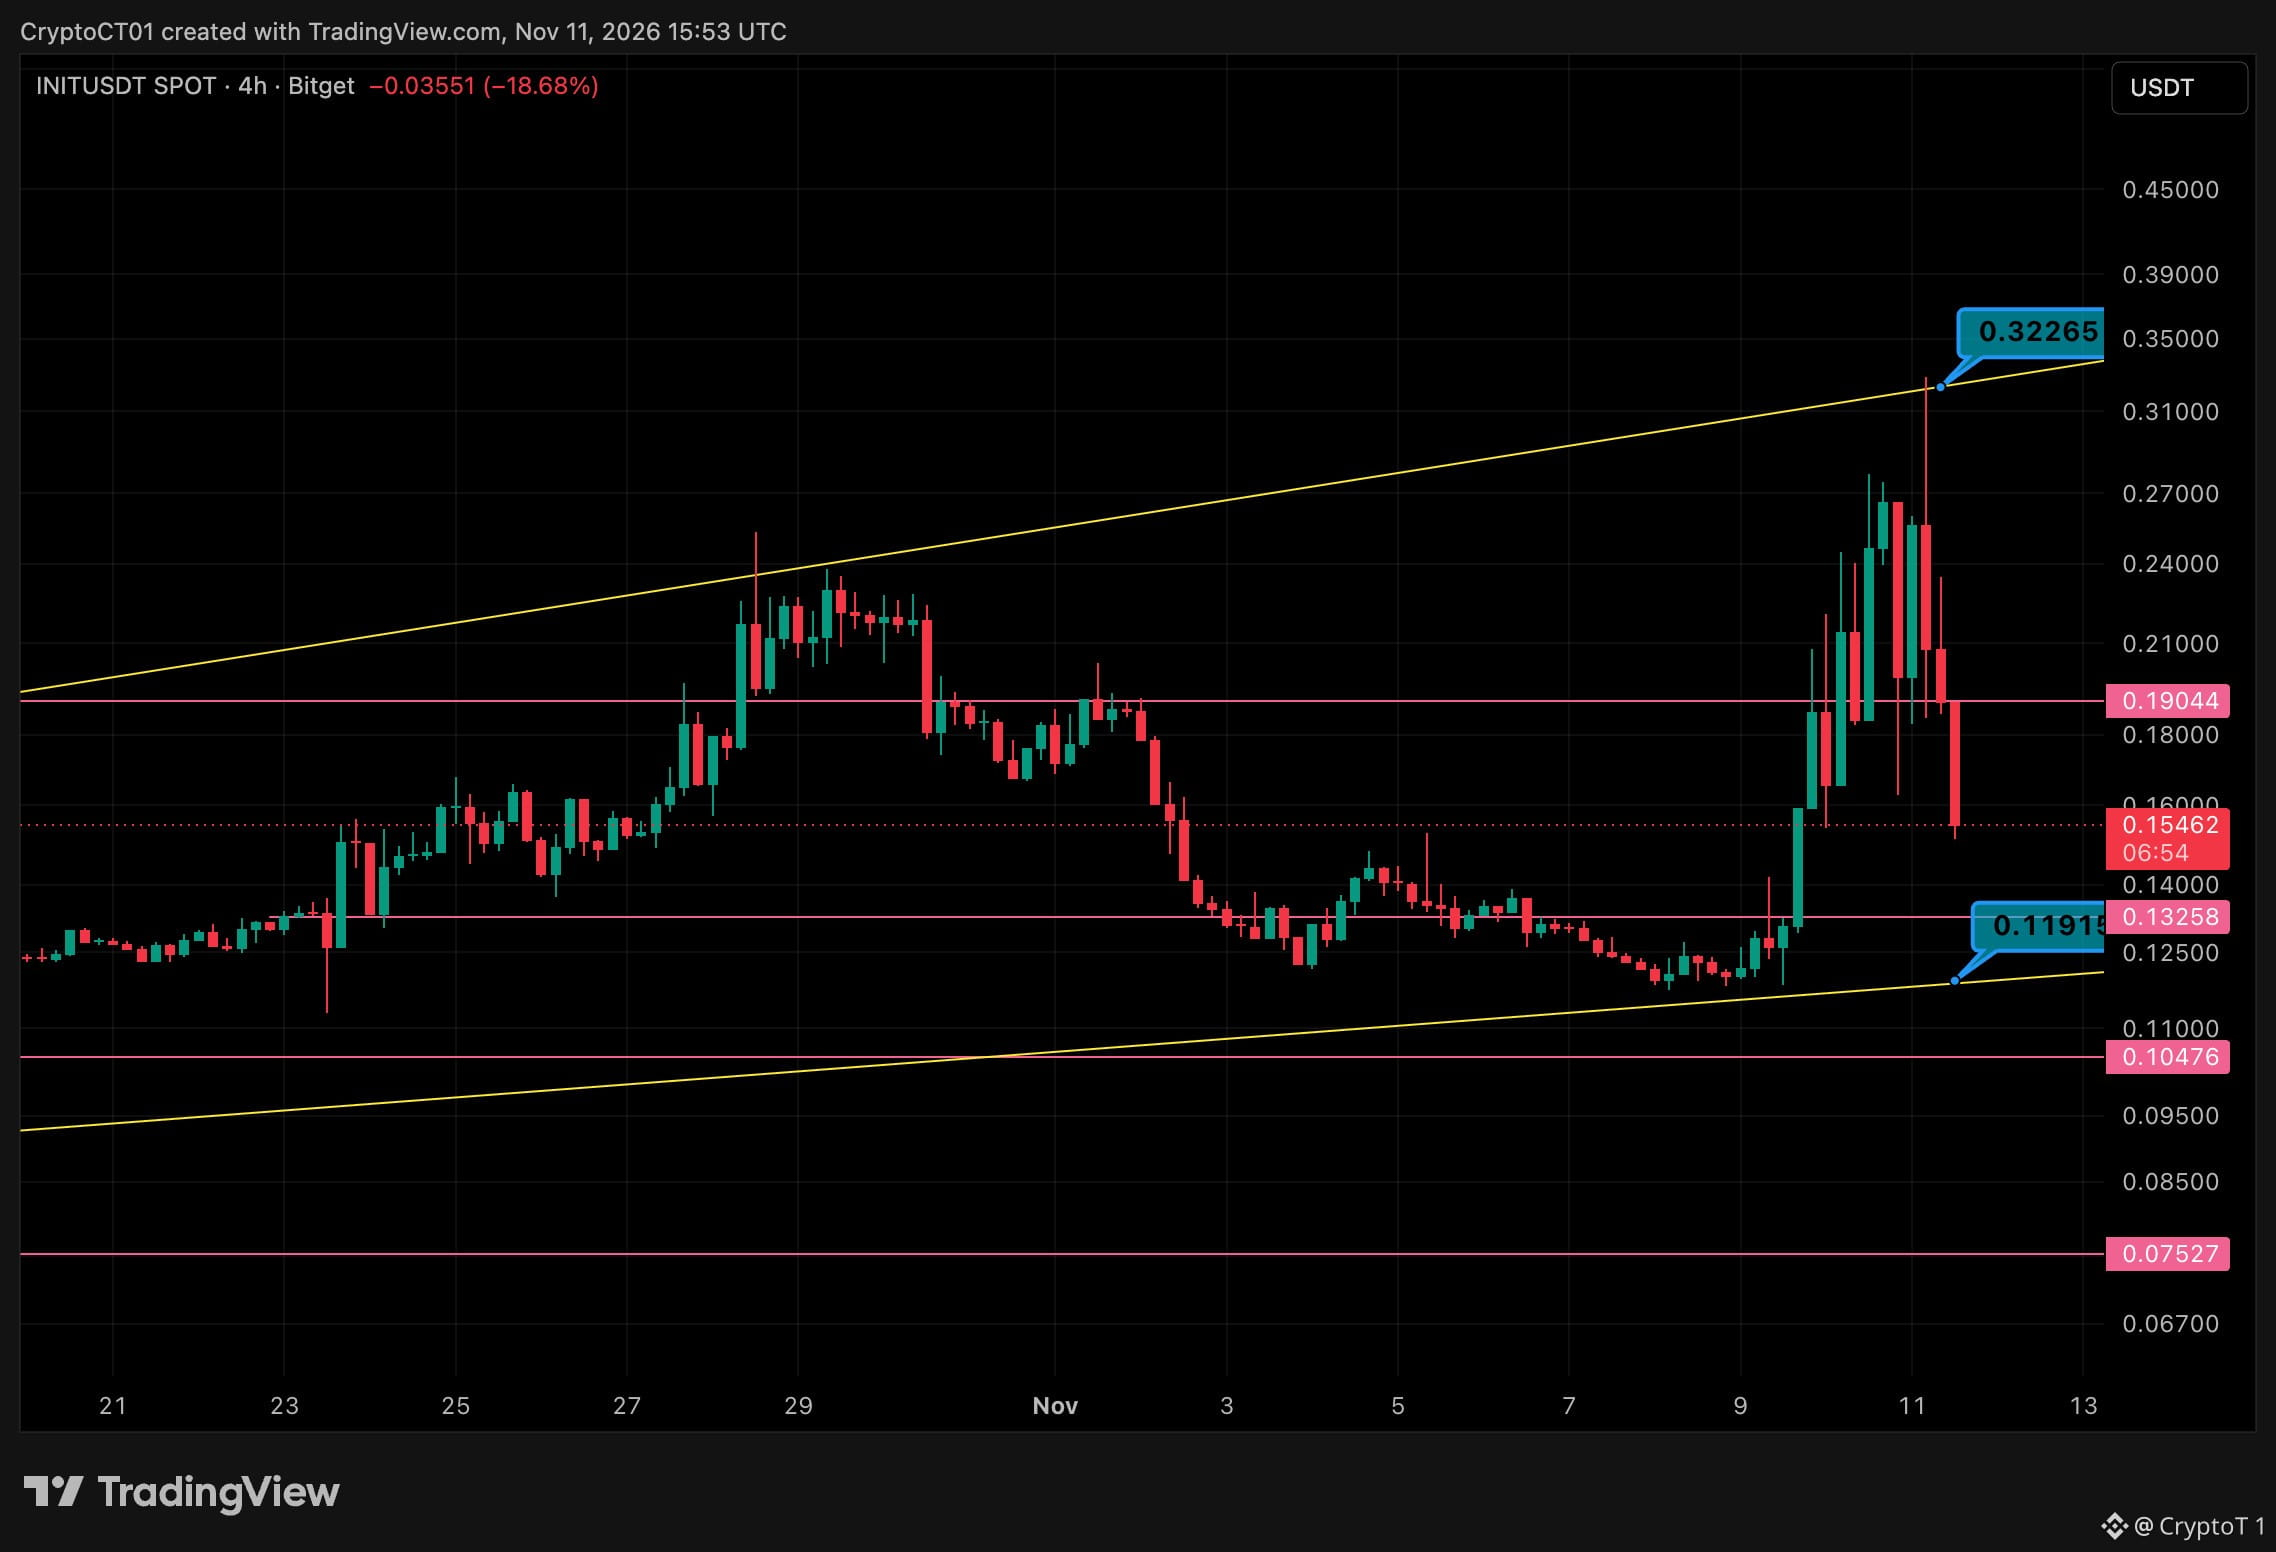
$INIT Rejected At The Top Of The Channel 📉 4h chart. The squeeze wicked straight into the channel top at 0.322 and got slapped back down. Now 0.154, down about 52% from the high. 🔴 Resistance: 0.190, then 0.24 🟢 Support: 0.1326, then 0.119 (channel bottom) Context: Initia halted its L1 on 10 Nov after unauthorized transfers from rollup escrow accounts, about $3.27M in total, and said no INIT was withdrawn. $INIT still squeezed hard into the news, and that whole move is now unwinding. My read: Losing 0.190 flipped it back to resistance. Price is falling back into the old range, and 0.1326 is the first real floor, the base it broke out from. If that cracks, the channel bottom around 0.119 is the bigger level. Below that I've got 0.105, then 0.075. The risk: News-driven unwinds wick both ways. A 4h reclaim of 0.190 flips this back bullish. Is 0.13 the bounce, or does it test the channel bottom first? 👇 #INIT
$INIT Rejected At The Top Of The Channel 📉 4h chart. The squeeze wicked straight into the channel top at 0.322 and got slapped back down. Now 0.154, down about 52% from the high. 🔴 Resistance: 0.190, then 0.24 🟢 Support: 0.1326, then 0.119 (channel bottom) Context: Initia halted its L1 on 10 Nov after unauthorized transfers from rollup escrow accounts, about $3.27M in total, and said no INIT was withdrawn. $INIT still squeezed hard into the news, and that whole move is now unwinding. My read: Losing 0.190 flipped it back to resistance. Price is falling back into the old range, and 0.1326 is the first real floor, the base it broke out from. If that cracks, the channel bottom around 0.119 is the bigger level. Below that I've got 0.105, then 0.075. The risk: News-driven unwinds wick both ways. A 4h reclaim of 0.190 flips this back bullish. Is 0.13 the bounce, or does it test the channel bottom first? 👇 #INIT
70
·
--
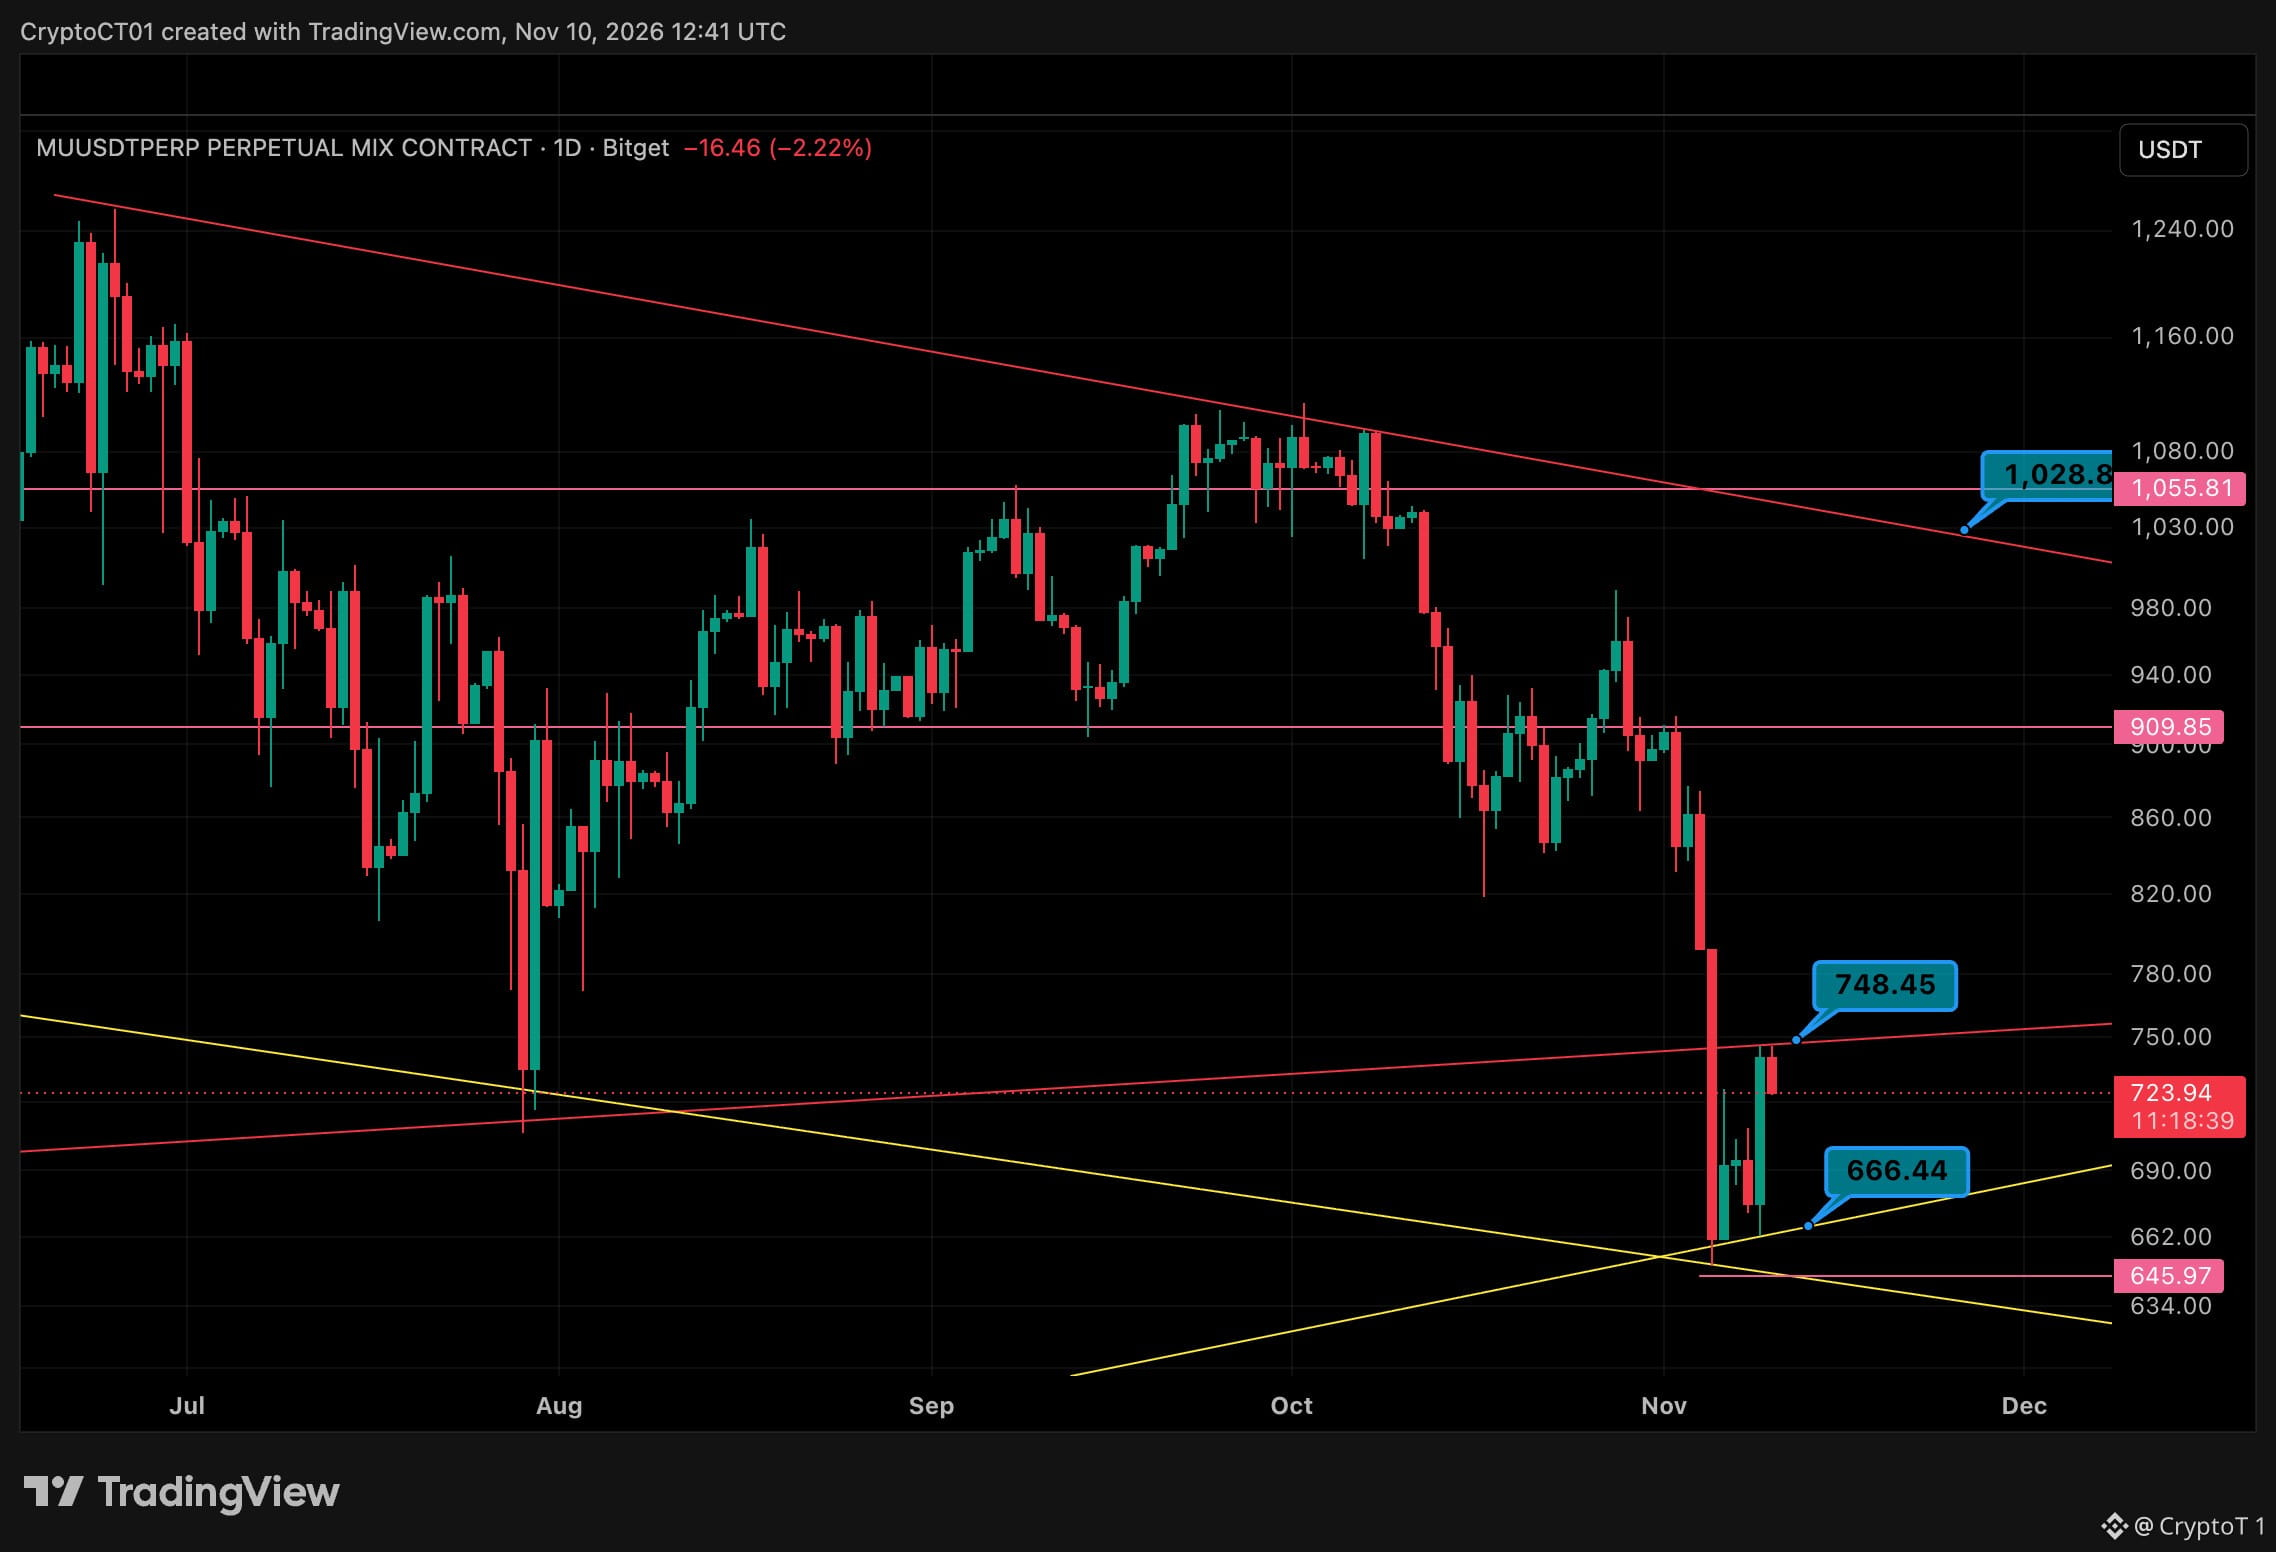
$MU 测试跌破后的回踩 👀 美光从 646 的低点强劲反弹。现在正直冲 11 月初跌破的趋势线。 🔴 1,056 🔴 1,029(下降趋势线) 🔴 910 🔴 748(回踩已跌破的趋势线) 🟢 724(当前) 🟢 666(上升支撑位) 🟢 646(11 月低点) 我的看法:若日线收盘重新站上 748,走势就转为收复失地,910 是下一个重要价位。 风险在于:若在 748 遇阻回落,这就会成为教科书式的回踩,届时 666 和 646 将再次进入视野。 非投资建议 #Micron #股票
$MU 测试跌破后的回踩 👀 美光从 646 的低点强劲反弹。现在正直冲 11 月初跌破的趋势线。 🔴 1,056 🔴 1,029(下降趋势线) 🔴 910 🔴 748(回踩已跌破的趋势线) 🟢 724(当前) 🟢 666(上升支撑位) 🟢 646(11 月低点) 我的看法:若日线收盘重新站上 748,走势就转为收复失地,910 是下一个重要价位。 风险在于:若在 748 遇阻回落,这就会成为教科书式的回踩,届时 666 和 646 将再次进入视野。 非投资建议 #Micron #股票
57
·
--
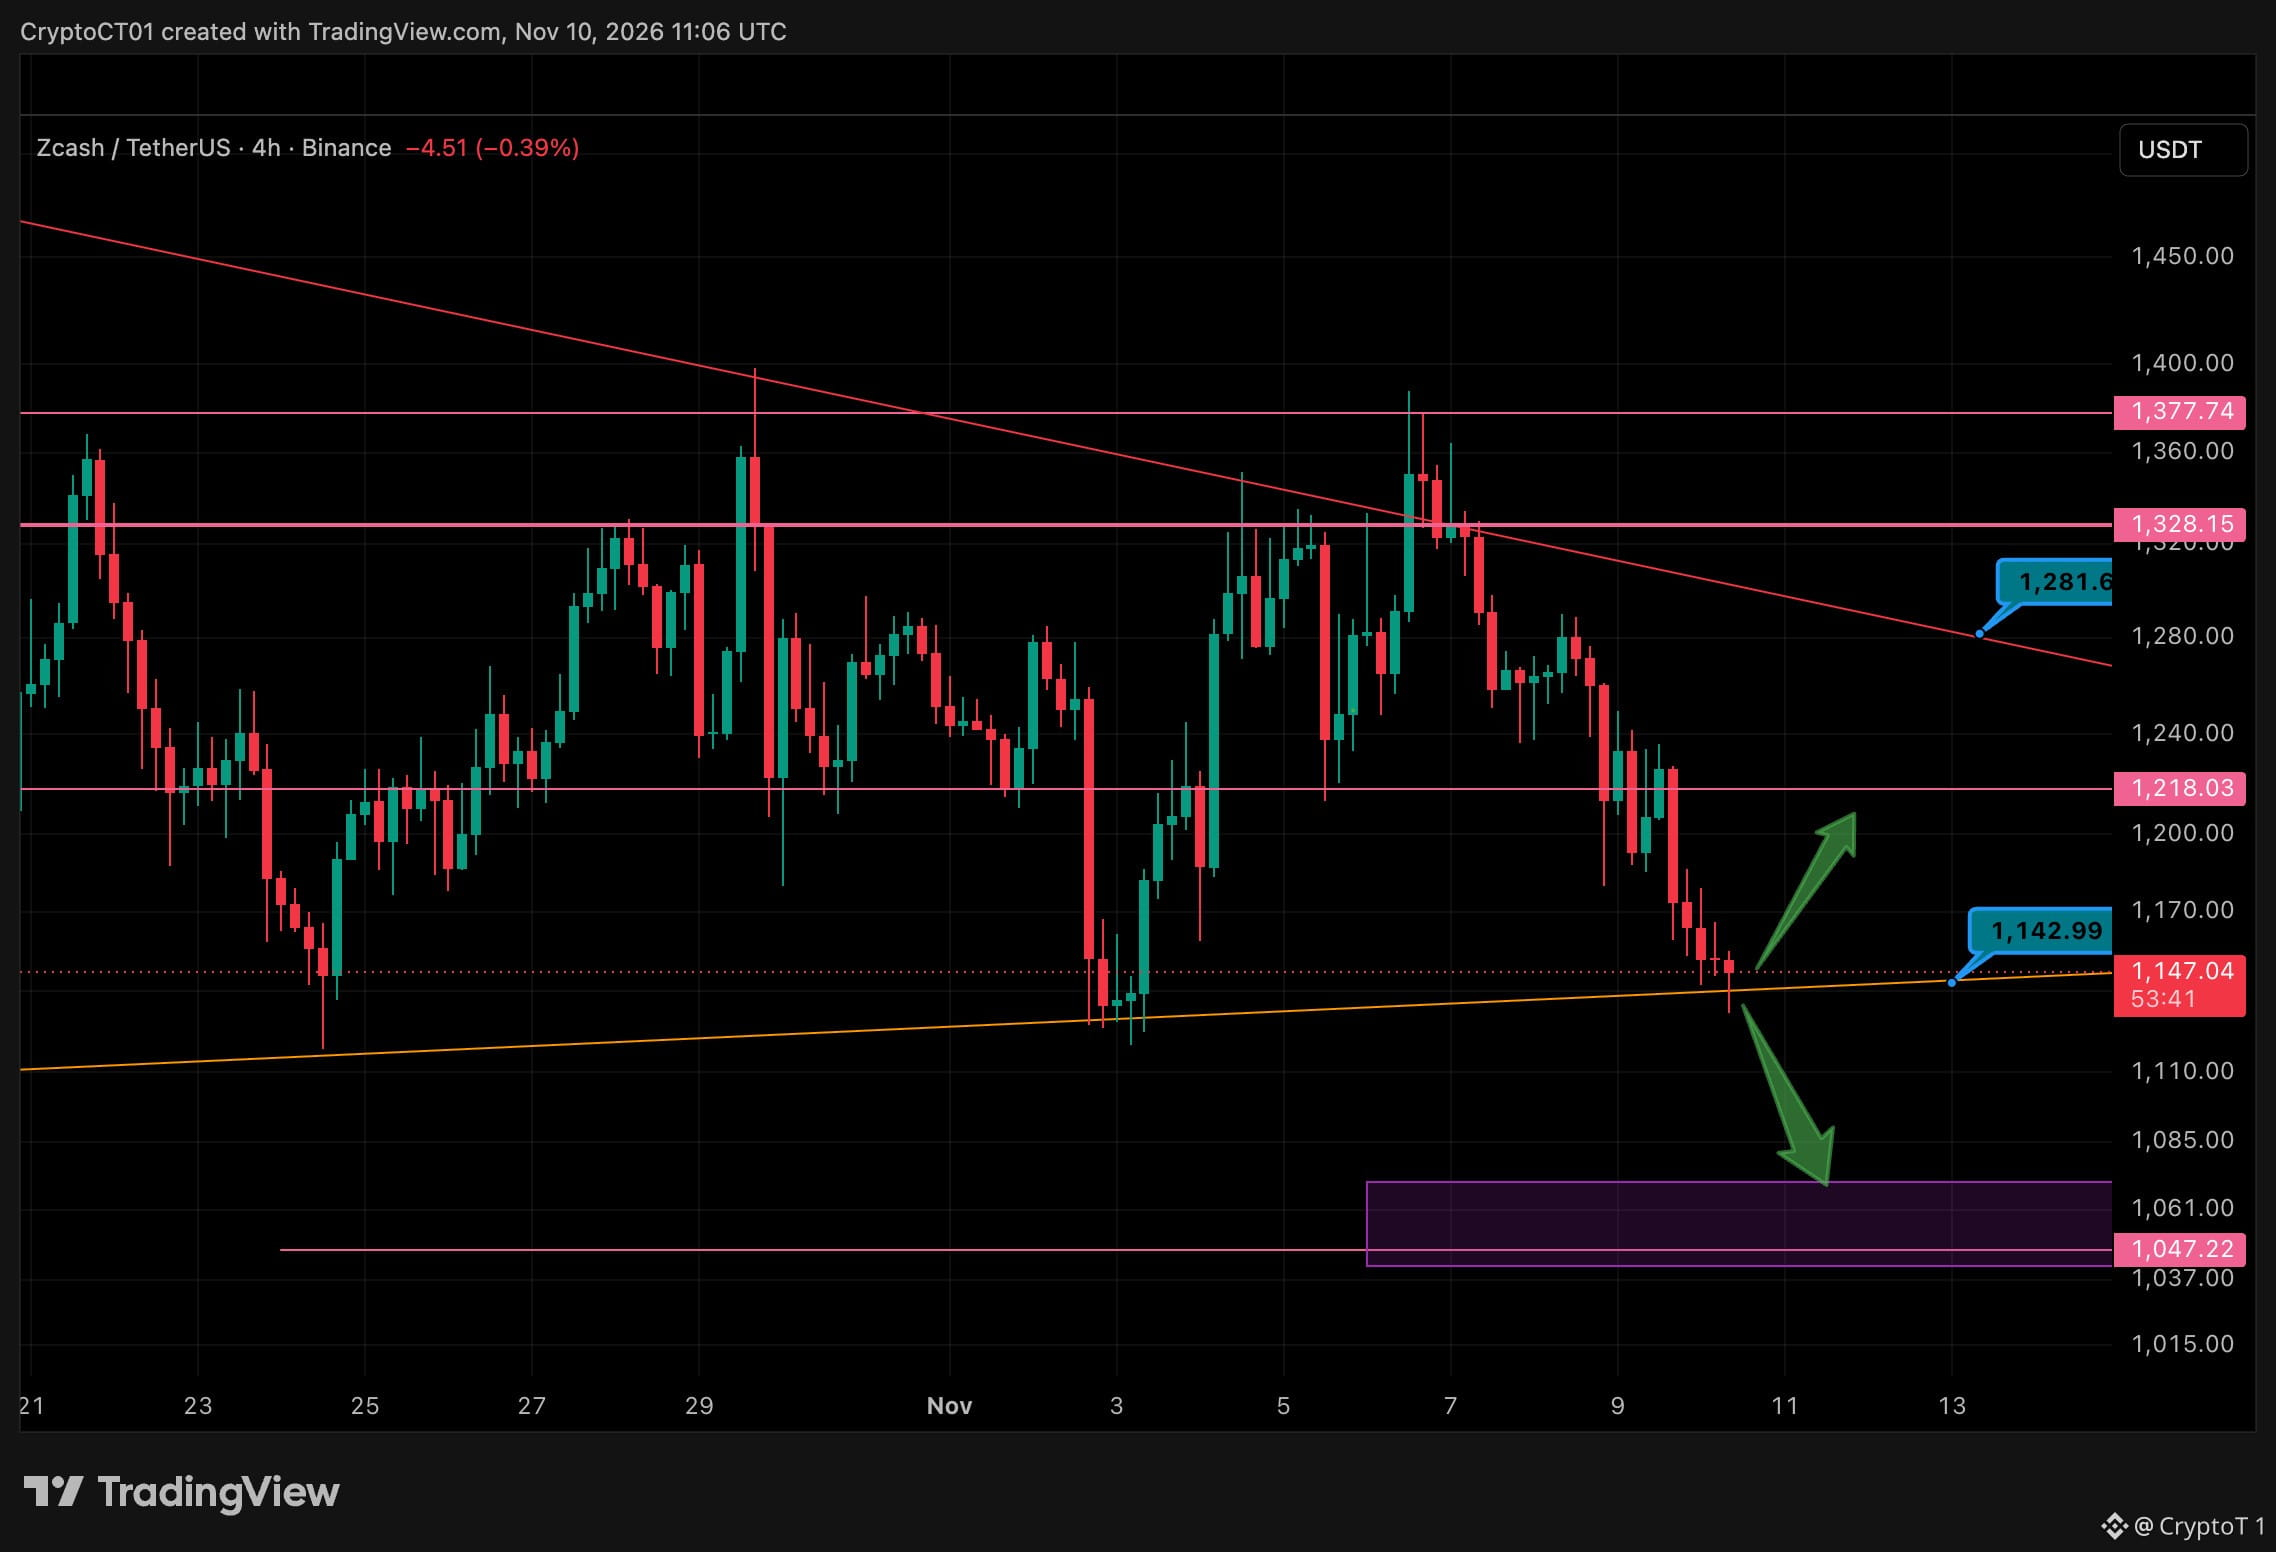
$ZEC 正在趋势线支撑位 👀 Zcash 从 1,377 的高点一路下跌,目前正在测试自 10 月底以来一直守住的上升趋势线。 🔴 1,377 🔴 1,328 🔴 1,281(下降趋势线)🔴 1,218 🟢 1,147(现价)🟢 1,143(上升趋势线)🟢 1,061 - 1,047 需求区 我的判断:如果守住趋势线,价格有望反弹至 1,218。这是首先需要收复的价位。 风险:如果 4 小时收盘价跌破 1,143,就可能进一步下探至 1,061 - 1,047 区间。 反弹还是破位?👇 仅供参考,非投资建议 #ZEC #Crypto
$ZEC 正在趋势线支撑位 👀 Zcash 从 1,377 的高点一路下跌,目前正在测试自 10 月底以来一直守住的上升趋势线。 🔴 1,377 🔴 1,328 🔴 1,281(下降趋势线)🔴 1,218 🟢 1,147(现价)🟢 1,143(上升趋势线)🟢 1,061 - 1,047 需求区 我的判断:如果守住趋势线,价格有望反弹至 1,218。这是首先需要收复的价位。 风险:如果 4 小时收盘价跌破 1,143,就可能进一步下探至 1,061 - 1,047 区间。 反弹还是破位?👇 仅供参考,非投资建议 #ZEC #Crypto
76
·
--
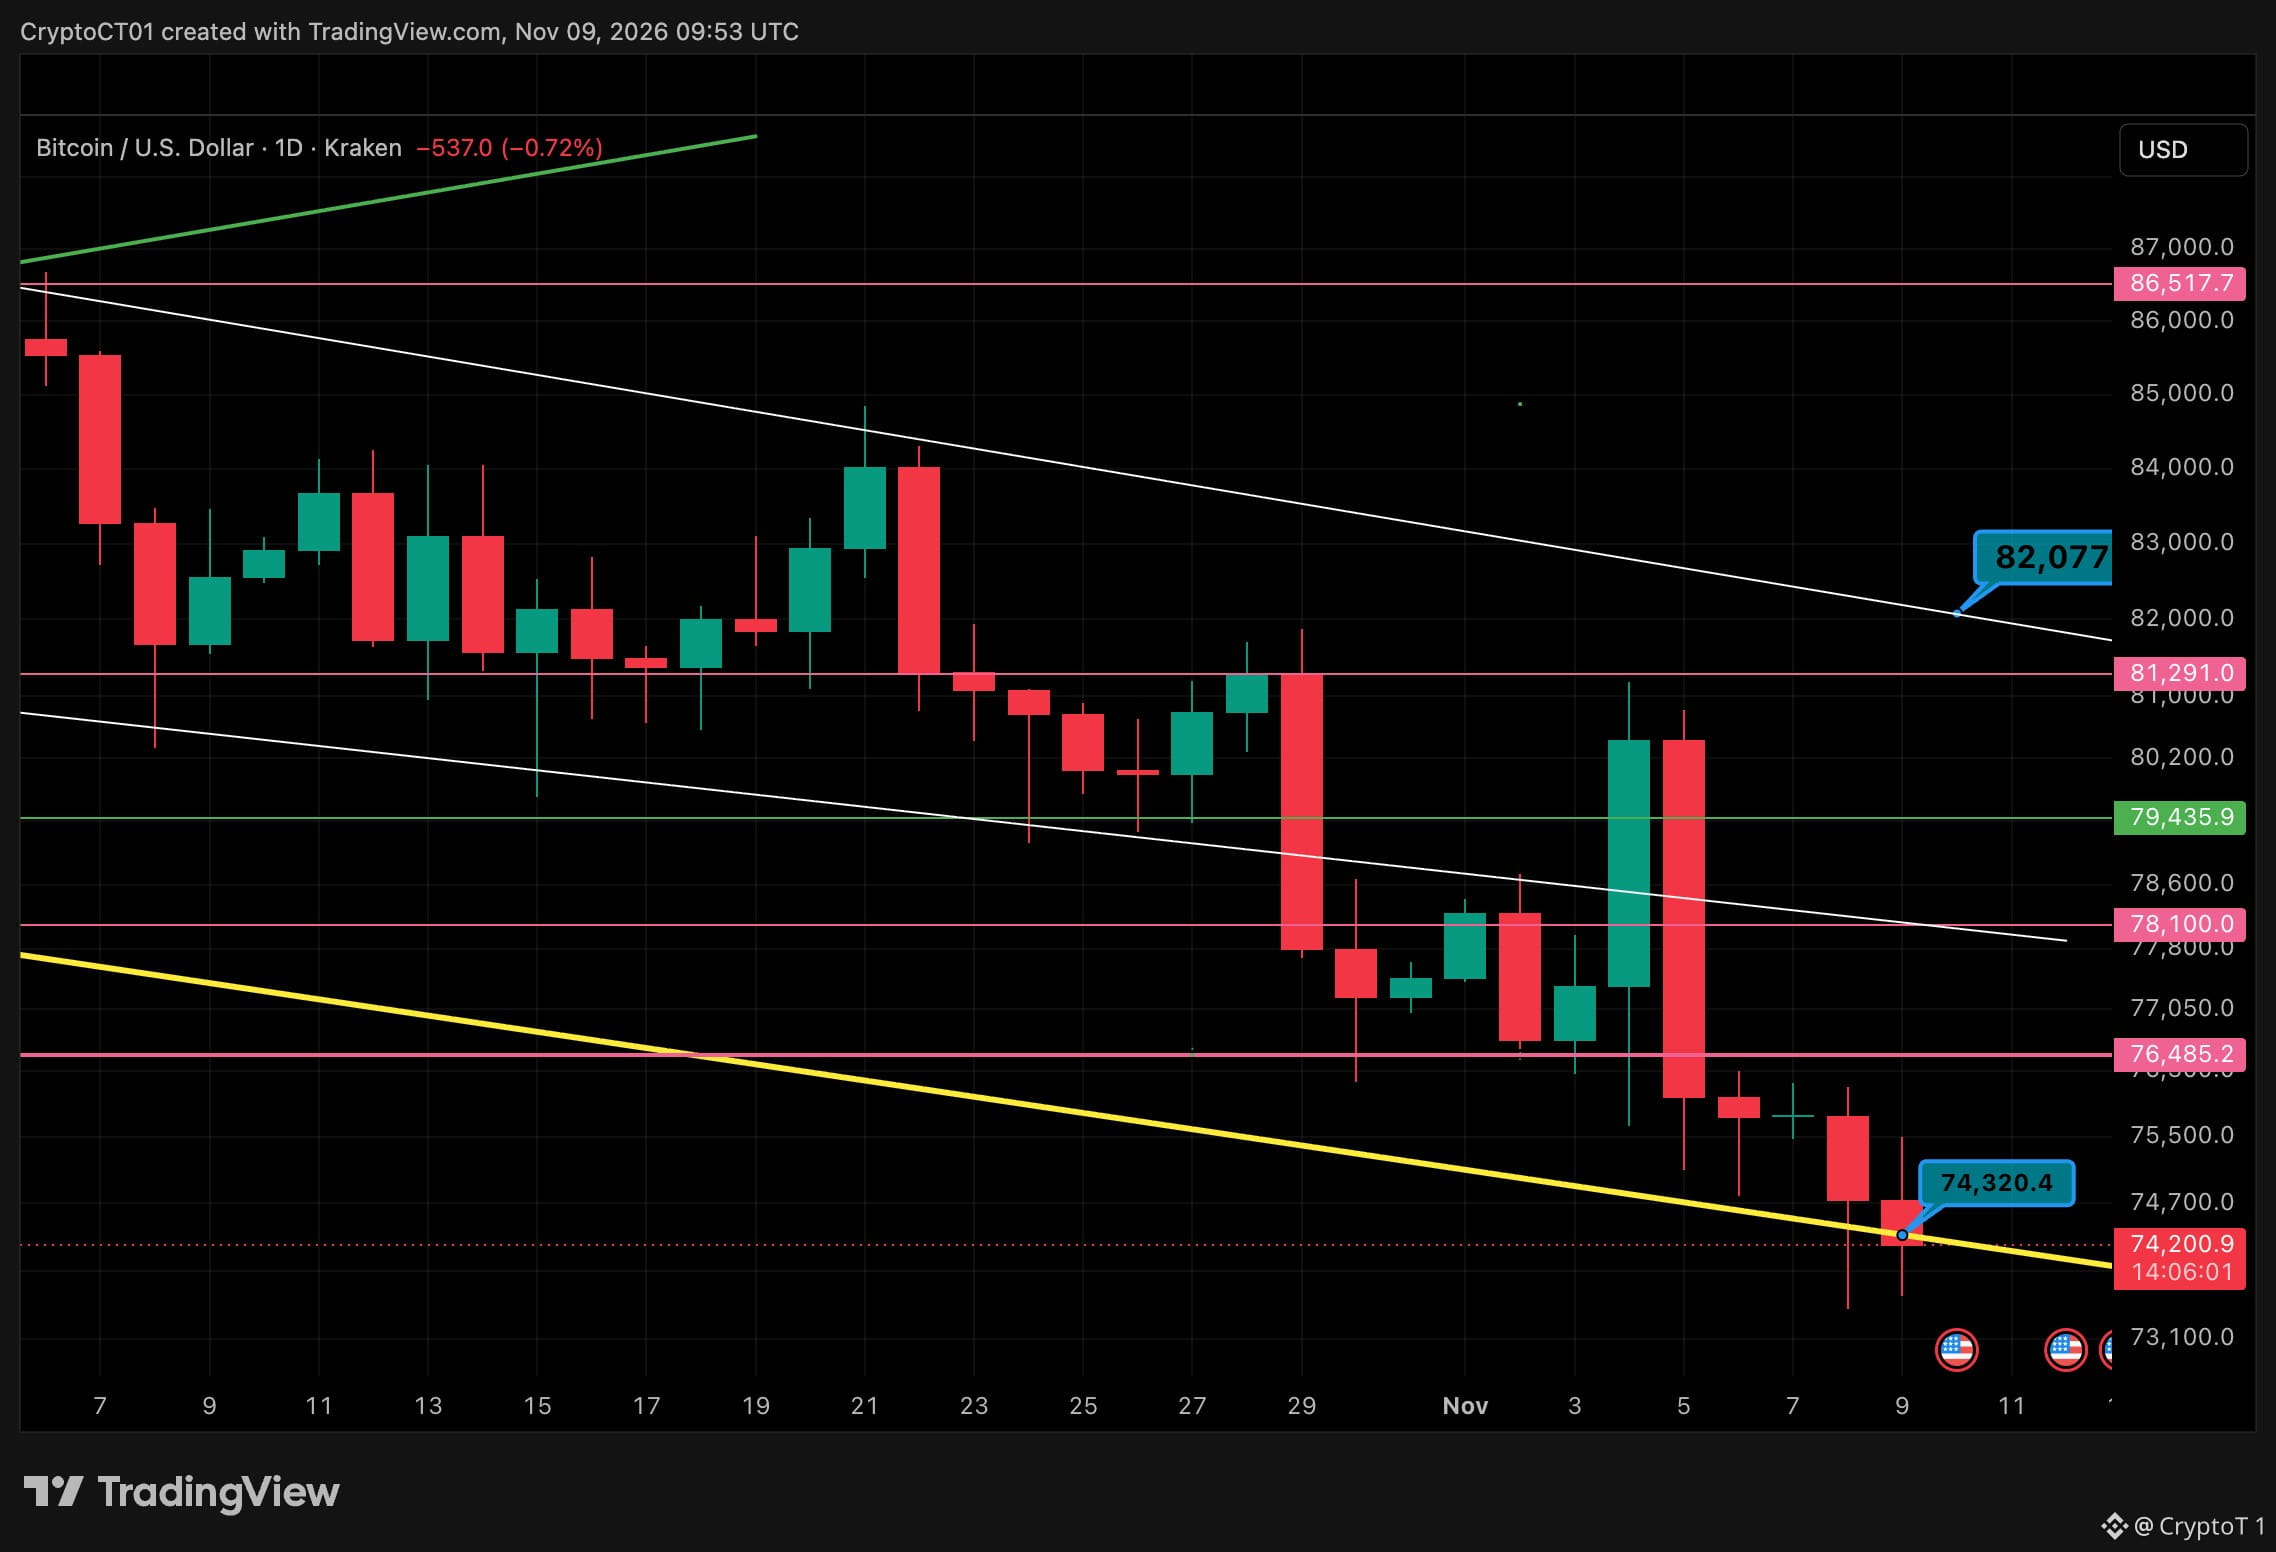
$BTC 在CPI公布前守在趋势线上 📉 日线图。价格在黄色下降支撑线附近(约$74.3K)徘徊,此前周日的10亿美元多头清算曾下探至$73.4K。 🔴 $86.5K 🔴 $82K 通道顶部 🔴 $81.3K 🔴 $79.4K 🔴 $78.1K 🔴 $76.5K 首个收复位 🟢 $74.3K 趋势线 🟢 $73.4K 周末低点 背景:自10月以来高点不断走低,目前仍处于下降通道内。CPI将于明天英国时间13:30公布。 我的看法:在CPI公布前守住趋势线,意味着仍有机会从区间低位反弹。日线收盘重新站上$76.5K,是买方重新掌控局面的第一个信号。 风险:日线收盘跌破$73.4K,就会同时失守趋势线和周末低点,下方空间也将打开。 CPI公布后会反弹还是破位?👇 非投资建议 #比特币 #BTC
$BTC 在CPI公布前守在趋势线上 📉 日线图。价格在黄色下降支撑线附近(约$74.3K)徘徊,此前周日的10亿美元多头清算曾下探至$73.4K。 🔴 $86.5K 🔴 $82K 通道顶部 🔴 $81.3K 🔴 $79.4K 🔴 $78.1K 🔴 $76.5K 首个收复位 🟢 $74.3K 趋势线 🟢 $73.4K 周末低点 背景:自10月以来高点不断走低,目前仍处于下降通道内。CPI将于明天英国时间13:30公布。 我的看法:在CPI公布前守住趋势线,意味着仍有机会从区间低位反弹。日线收盘重新站上$76.5K,是买方重新掌控局面的第一个信号。 风险:日线收盘跌破$73.4K,就会同时失守趋势线和周末低点,下方空间也将打开。 CPI公布后会反弹还是破位?👇 非投资建议 #比特币 #BTC
88
·
--
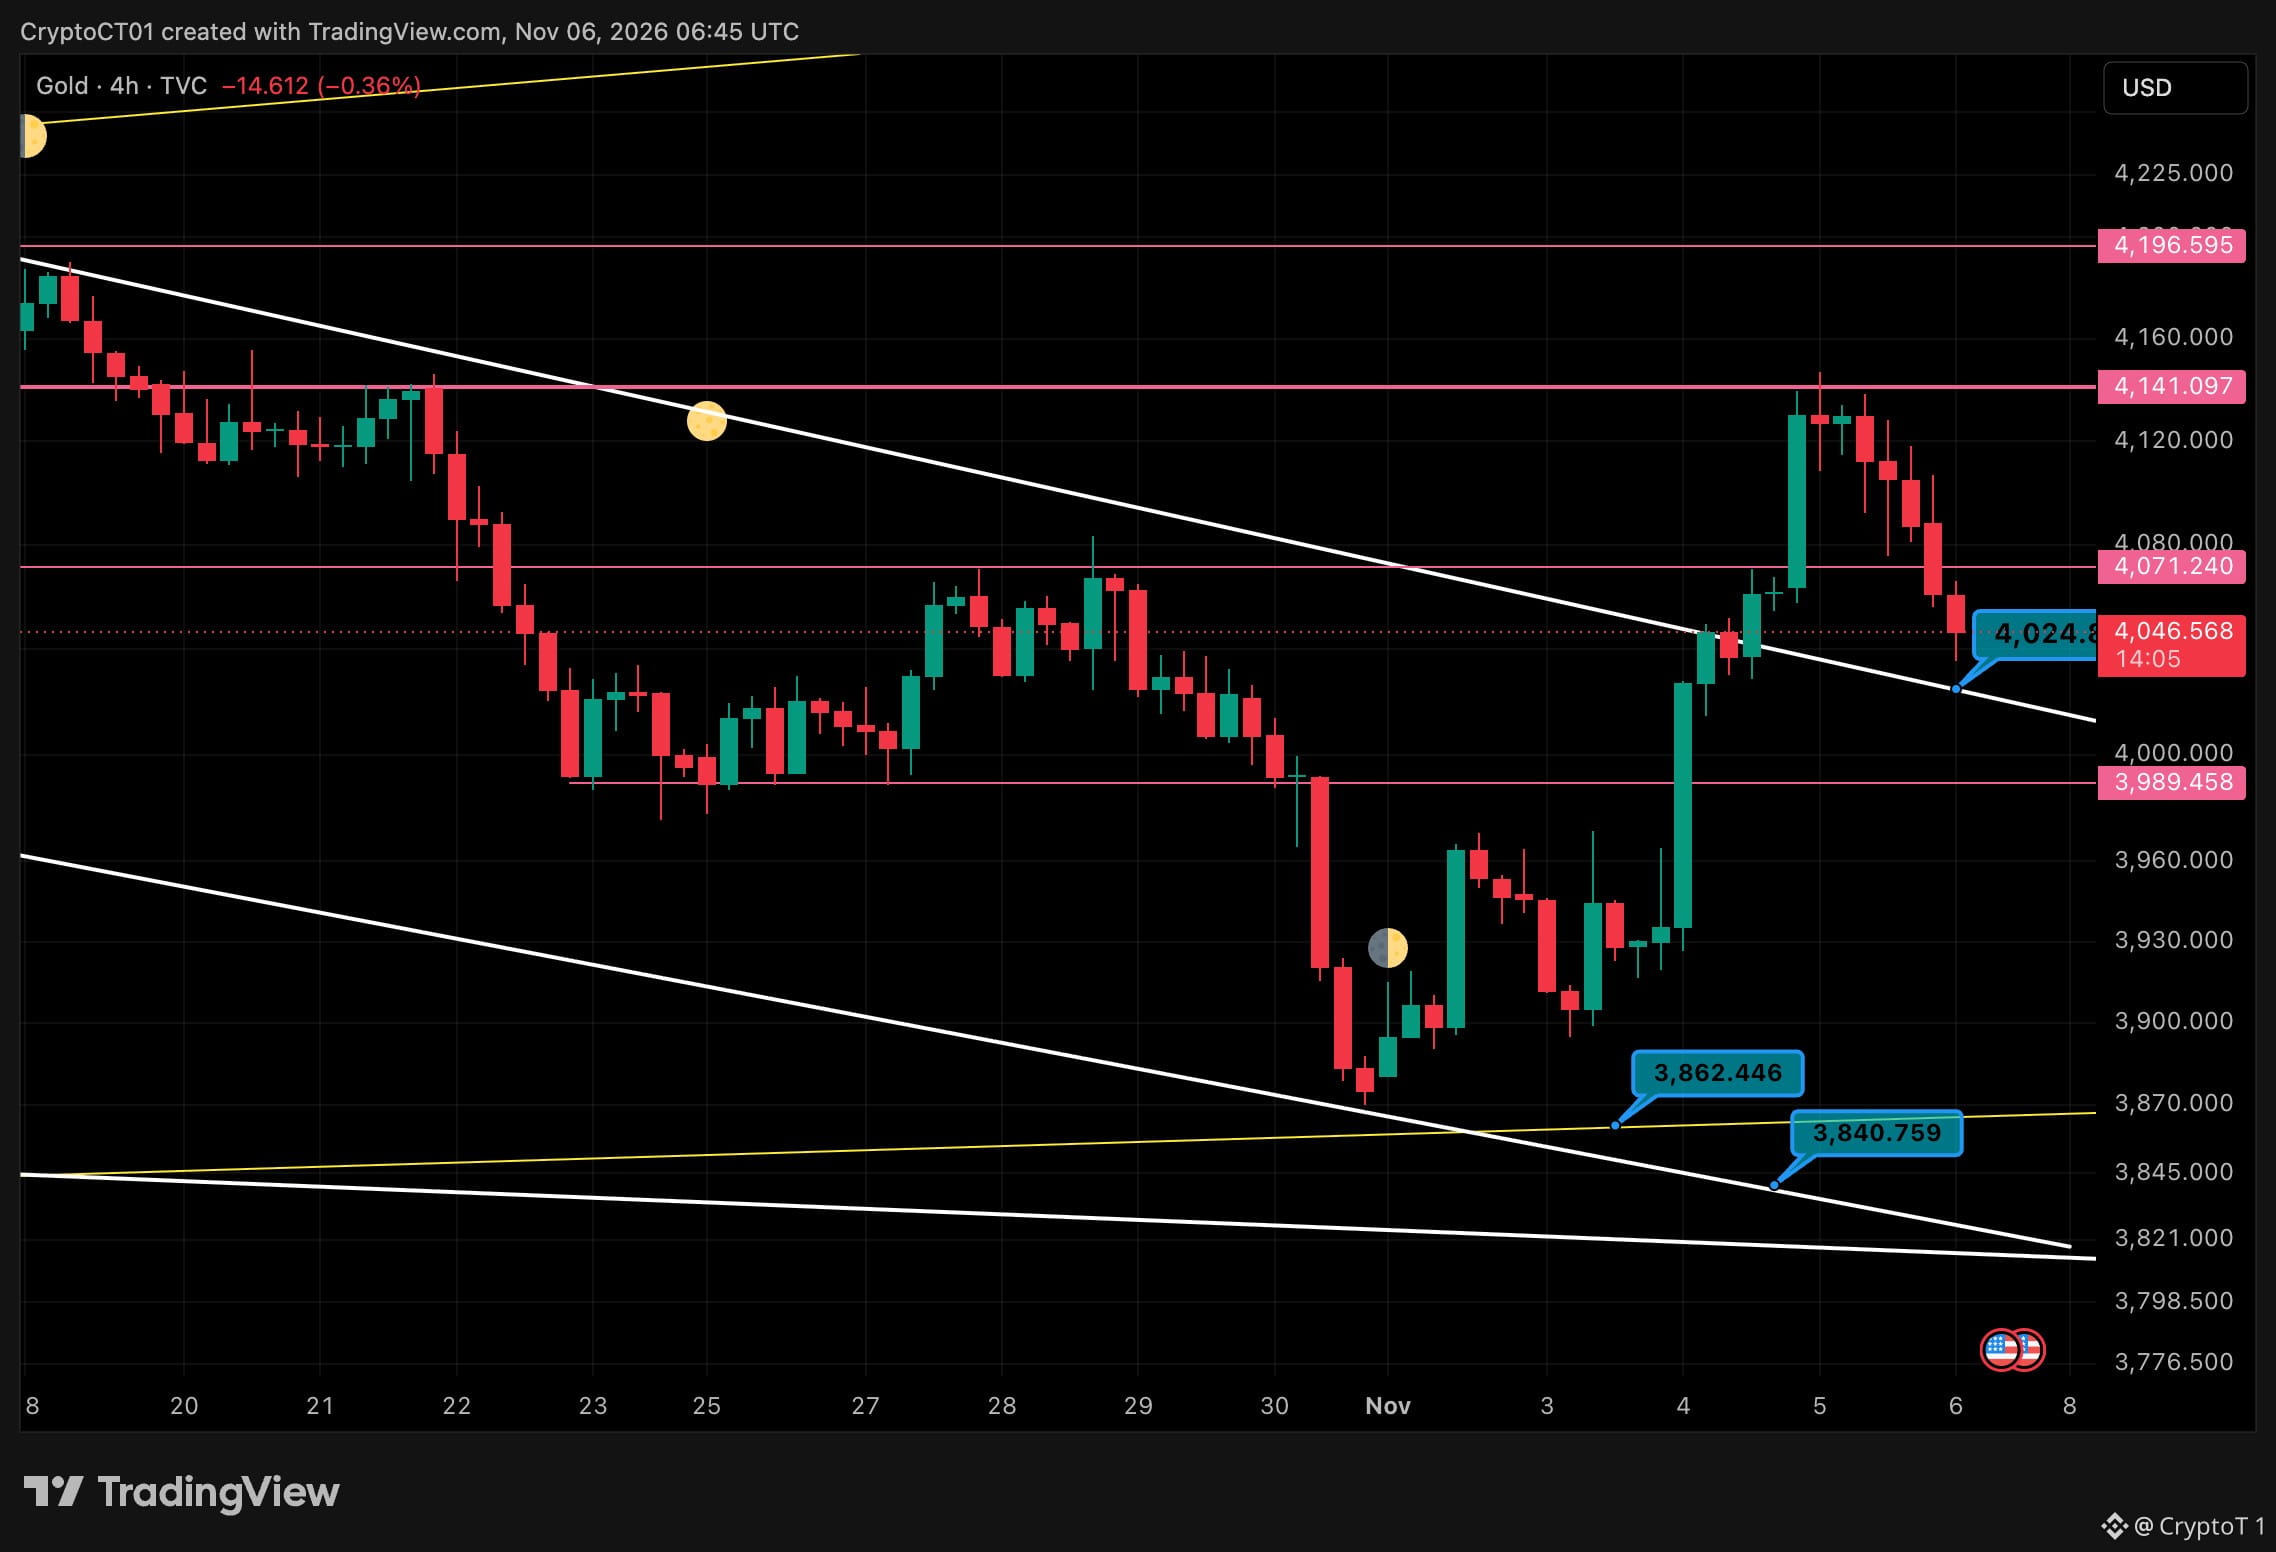
黄金在 4,141 遭遇拒绝,首先关注 4,024 🥇 在 4 小时图上,黄金一路 V 形反弹至 4,141,随后遭到打压。接连出现几根红色 K 线后,目前价格在 4,054 附近。 🔹 阻力位:4,071,其次是 4,141(遭遇拒绝的位置) 🔹 首个支撑位:下降通道上的 4,024 🔹 下一支撑位:3,989——若失守,3,862 / 3,840 将成为关注位 🔹 倾向:突破失败后的回调,暂时还不是趋势反转 今天将公布非农就业数据。通常数据公布时,黄金会出现波动。 守住 4,024,说明这仍是健康的回调。若跌破 3,989,突破 4,141 就会变成假突破。 你觉得数据公布后,黄金会稳定在什么位置? 👇 以上不构成投资建议。 #XAUUSD #黄金 #交易 $XAUt
黄金在 4,141 遭遇拒绝,首先关注 4,024 🥇 在 4 小时图上,黄金一路 V 形反弹至 4,141,随后遭到打压。接连出现几根红色 K 线后,目前价格在 4,054 附近。 🔹 阻力位:4,071,其次是 4,141(遭遇拒绝的位置) 🔹 首个支撑位:下降通道上的 4,024 🔹 下一支撑位:3,989——若失守,3,862 / 3,840 将成为关注位 🔹 倾向:突破失败后的回调,暂时还不是趋势反转 今天将公布非农就业数据。通常数据公布时,黄金会出现波动。 守住 4,024,说明这仍是健康的回调。若跌破 3,989,突破 4,141 就会变成假突破。 你觉得数据公布后,黄金会稳定在什么位置? 👇 以上不构成投资建议。 #XAUUSD #黄金 #交易 $XAUt
92
·
--
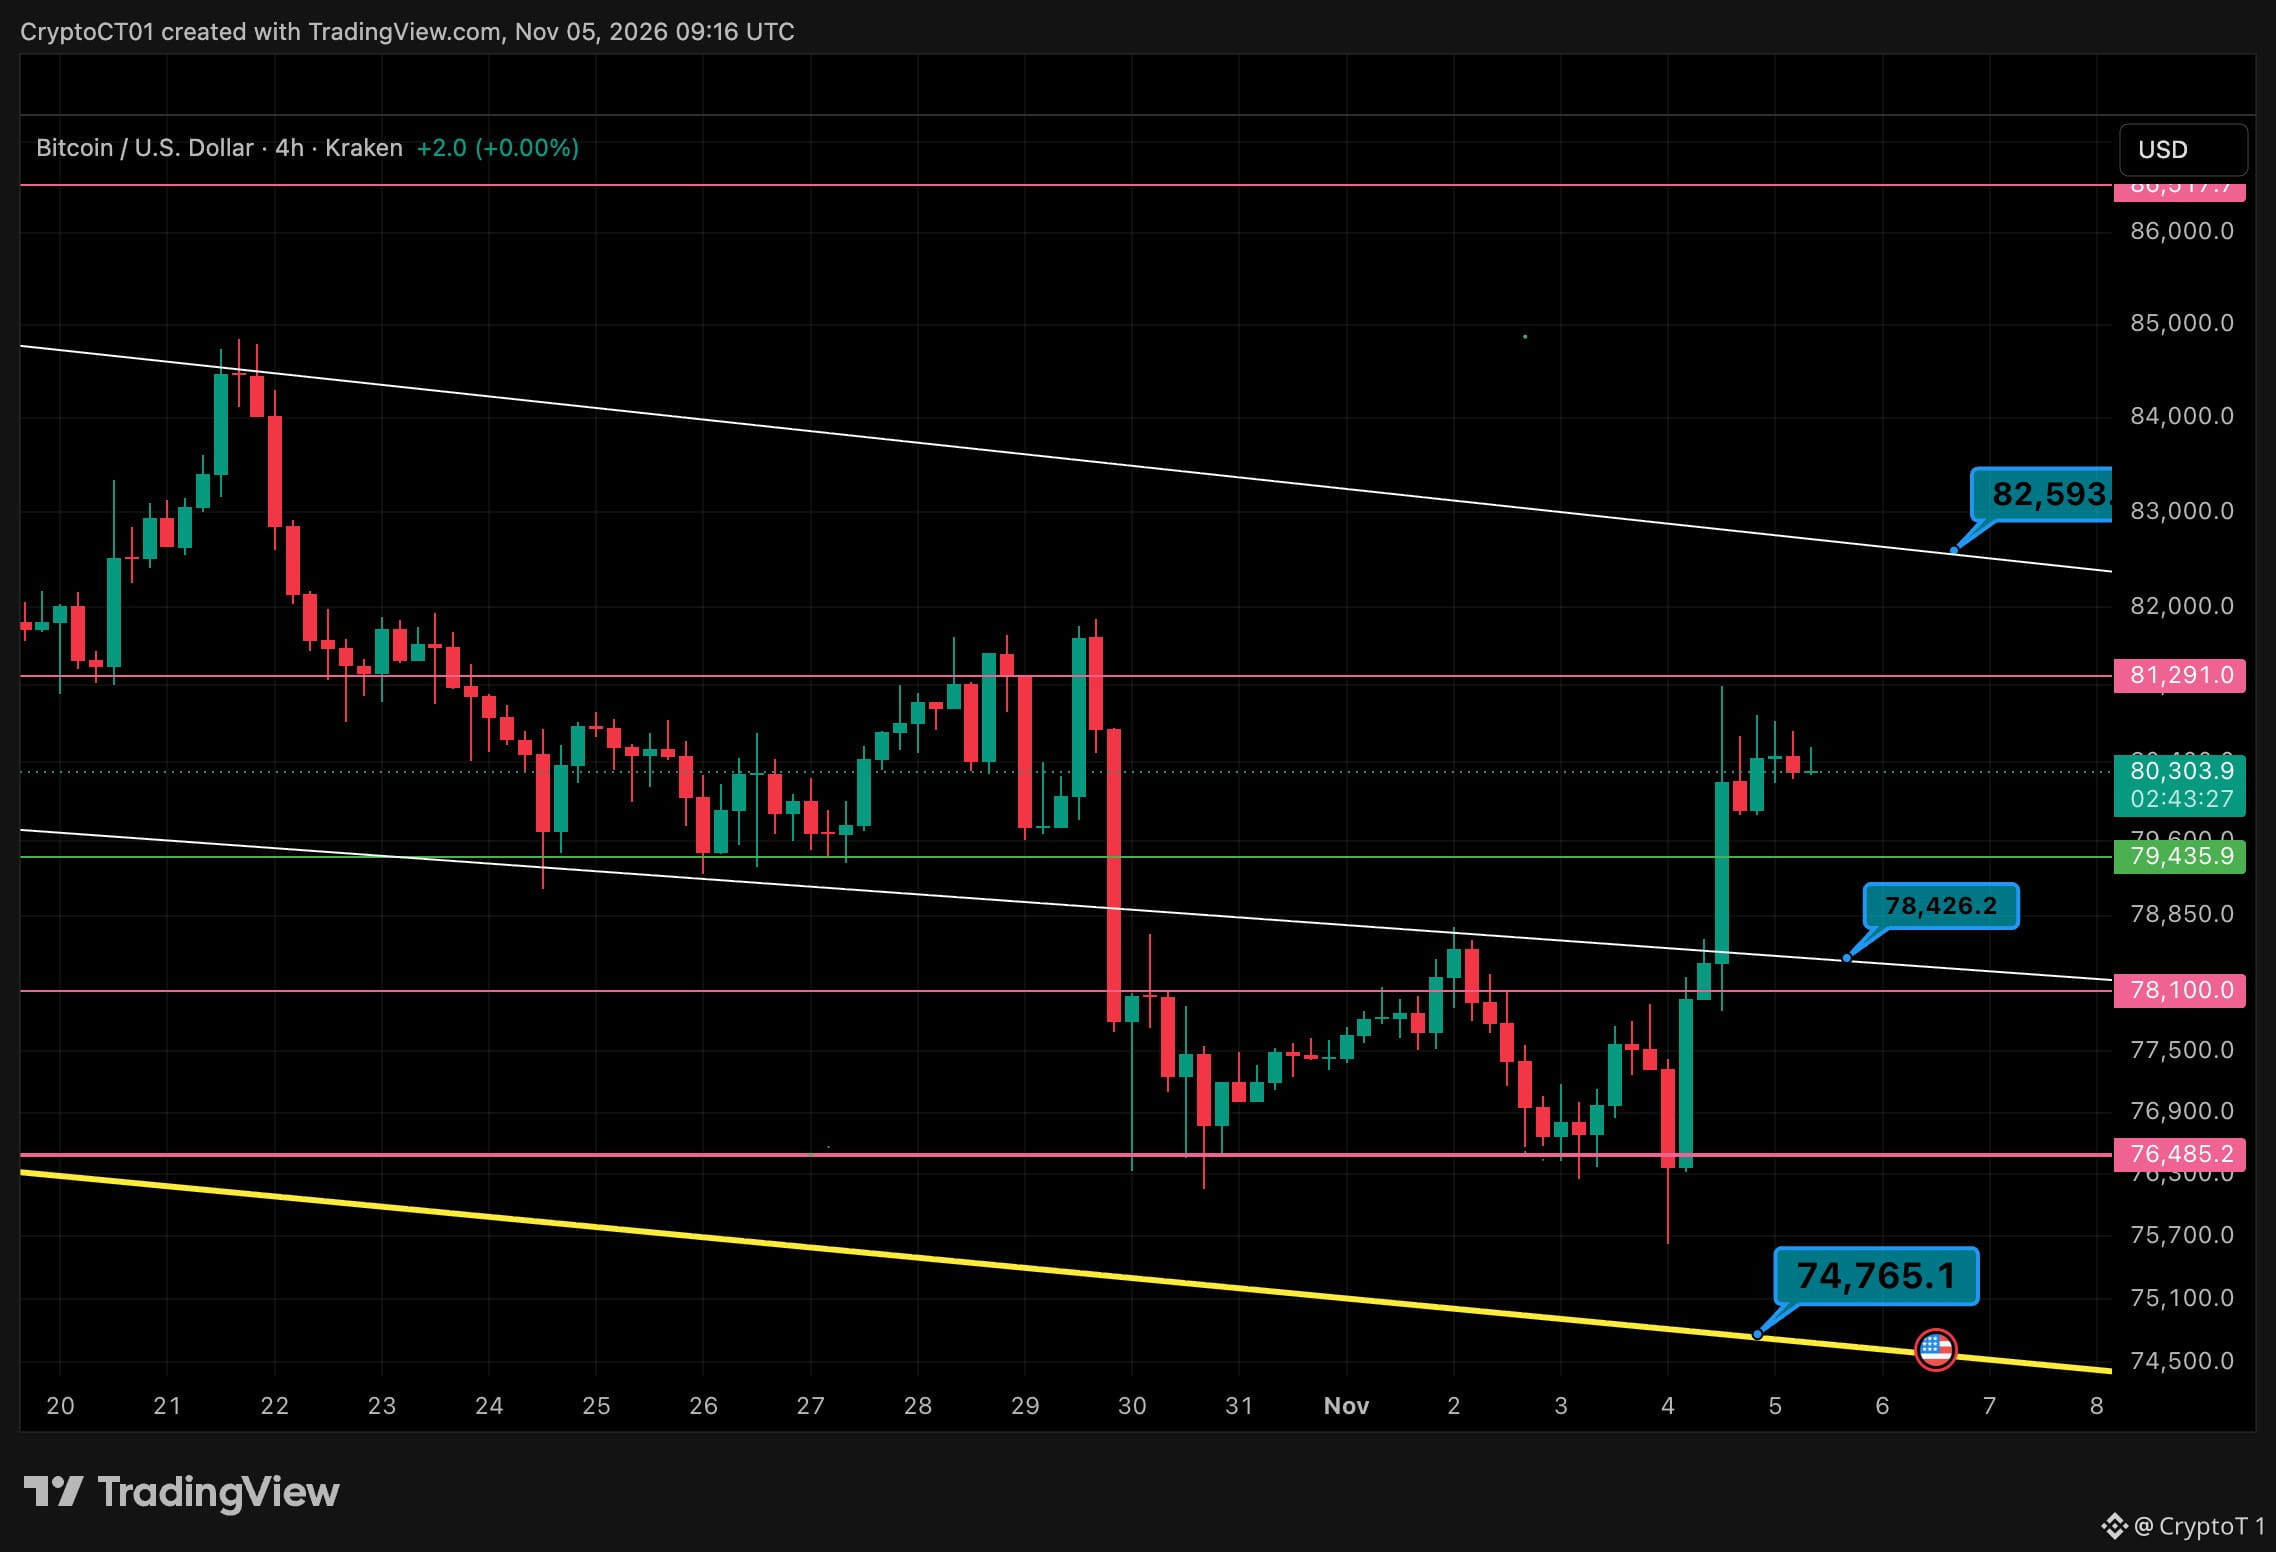
BTC 收复 80K,现在 81.3K 是关键关卡 🚪 $BTC 在 4 小时图上一度下探至约 75.7K,随后一路直冲回通道内。目前徘徊在 80.3K 附近。 🔹 阻力位在 81,291,先前已在此受阻一次 🔹 再往上,通道顶部在 82,593 附近 🔹 支撑位在 79,436,其次是 78,426 附近的旧通道线 🔹 再往下是 78,100,然后是 76,485 🟢 4 小时收盘站上 81,291,将有望上探 82.6K,接著是 86.5K 🔴 跌破 79.4K,可能会回到 78.4K,重新测试突破位 🎯 别追著绿色 K 线跑。等价格回到这些价位 明天公布的非农就业数据可能会决定这次突破的方向。 是突破还是假突破?👇 非投资建议。#Bitcoin #BTC #Crypto #TA
BTC 收复 80K,现在 81.3K 是关键关卡 🚪 $BTC 在 4 小时图上一度下探至约 75.7K,随后一路直冲回通道内。目前徘徊在 80.3K 附近。 🔹 阻力位在 81,291,先前已在此受阻一次 🔹 再往上,通道顶部在 82,593 附近 🔹 支撑位在 79,436,其次是 78,426 附近的旧通道线 🔹 再往下是 78,100,然后是 76,485 🟢 4 小时收盘站上 81,291,将有望上探 82.6K,接著是 86.5K 🔴 跌破 79.4K,可能会回到 78.4K,重新测试突破位 🎯 别追著绿色 K 线跑。等价格回到这些价位 明天公布的非农就业数据可能会决定这次突破的方向。 是突破还是假突破?👇 非投资建议。#Bitcoin #BTC #Crypto #TA
52
·
--
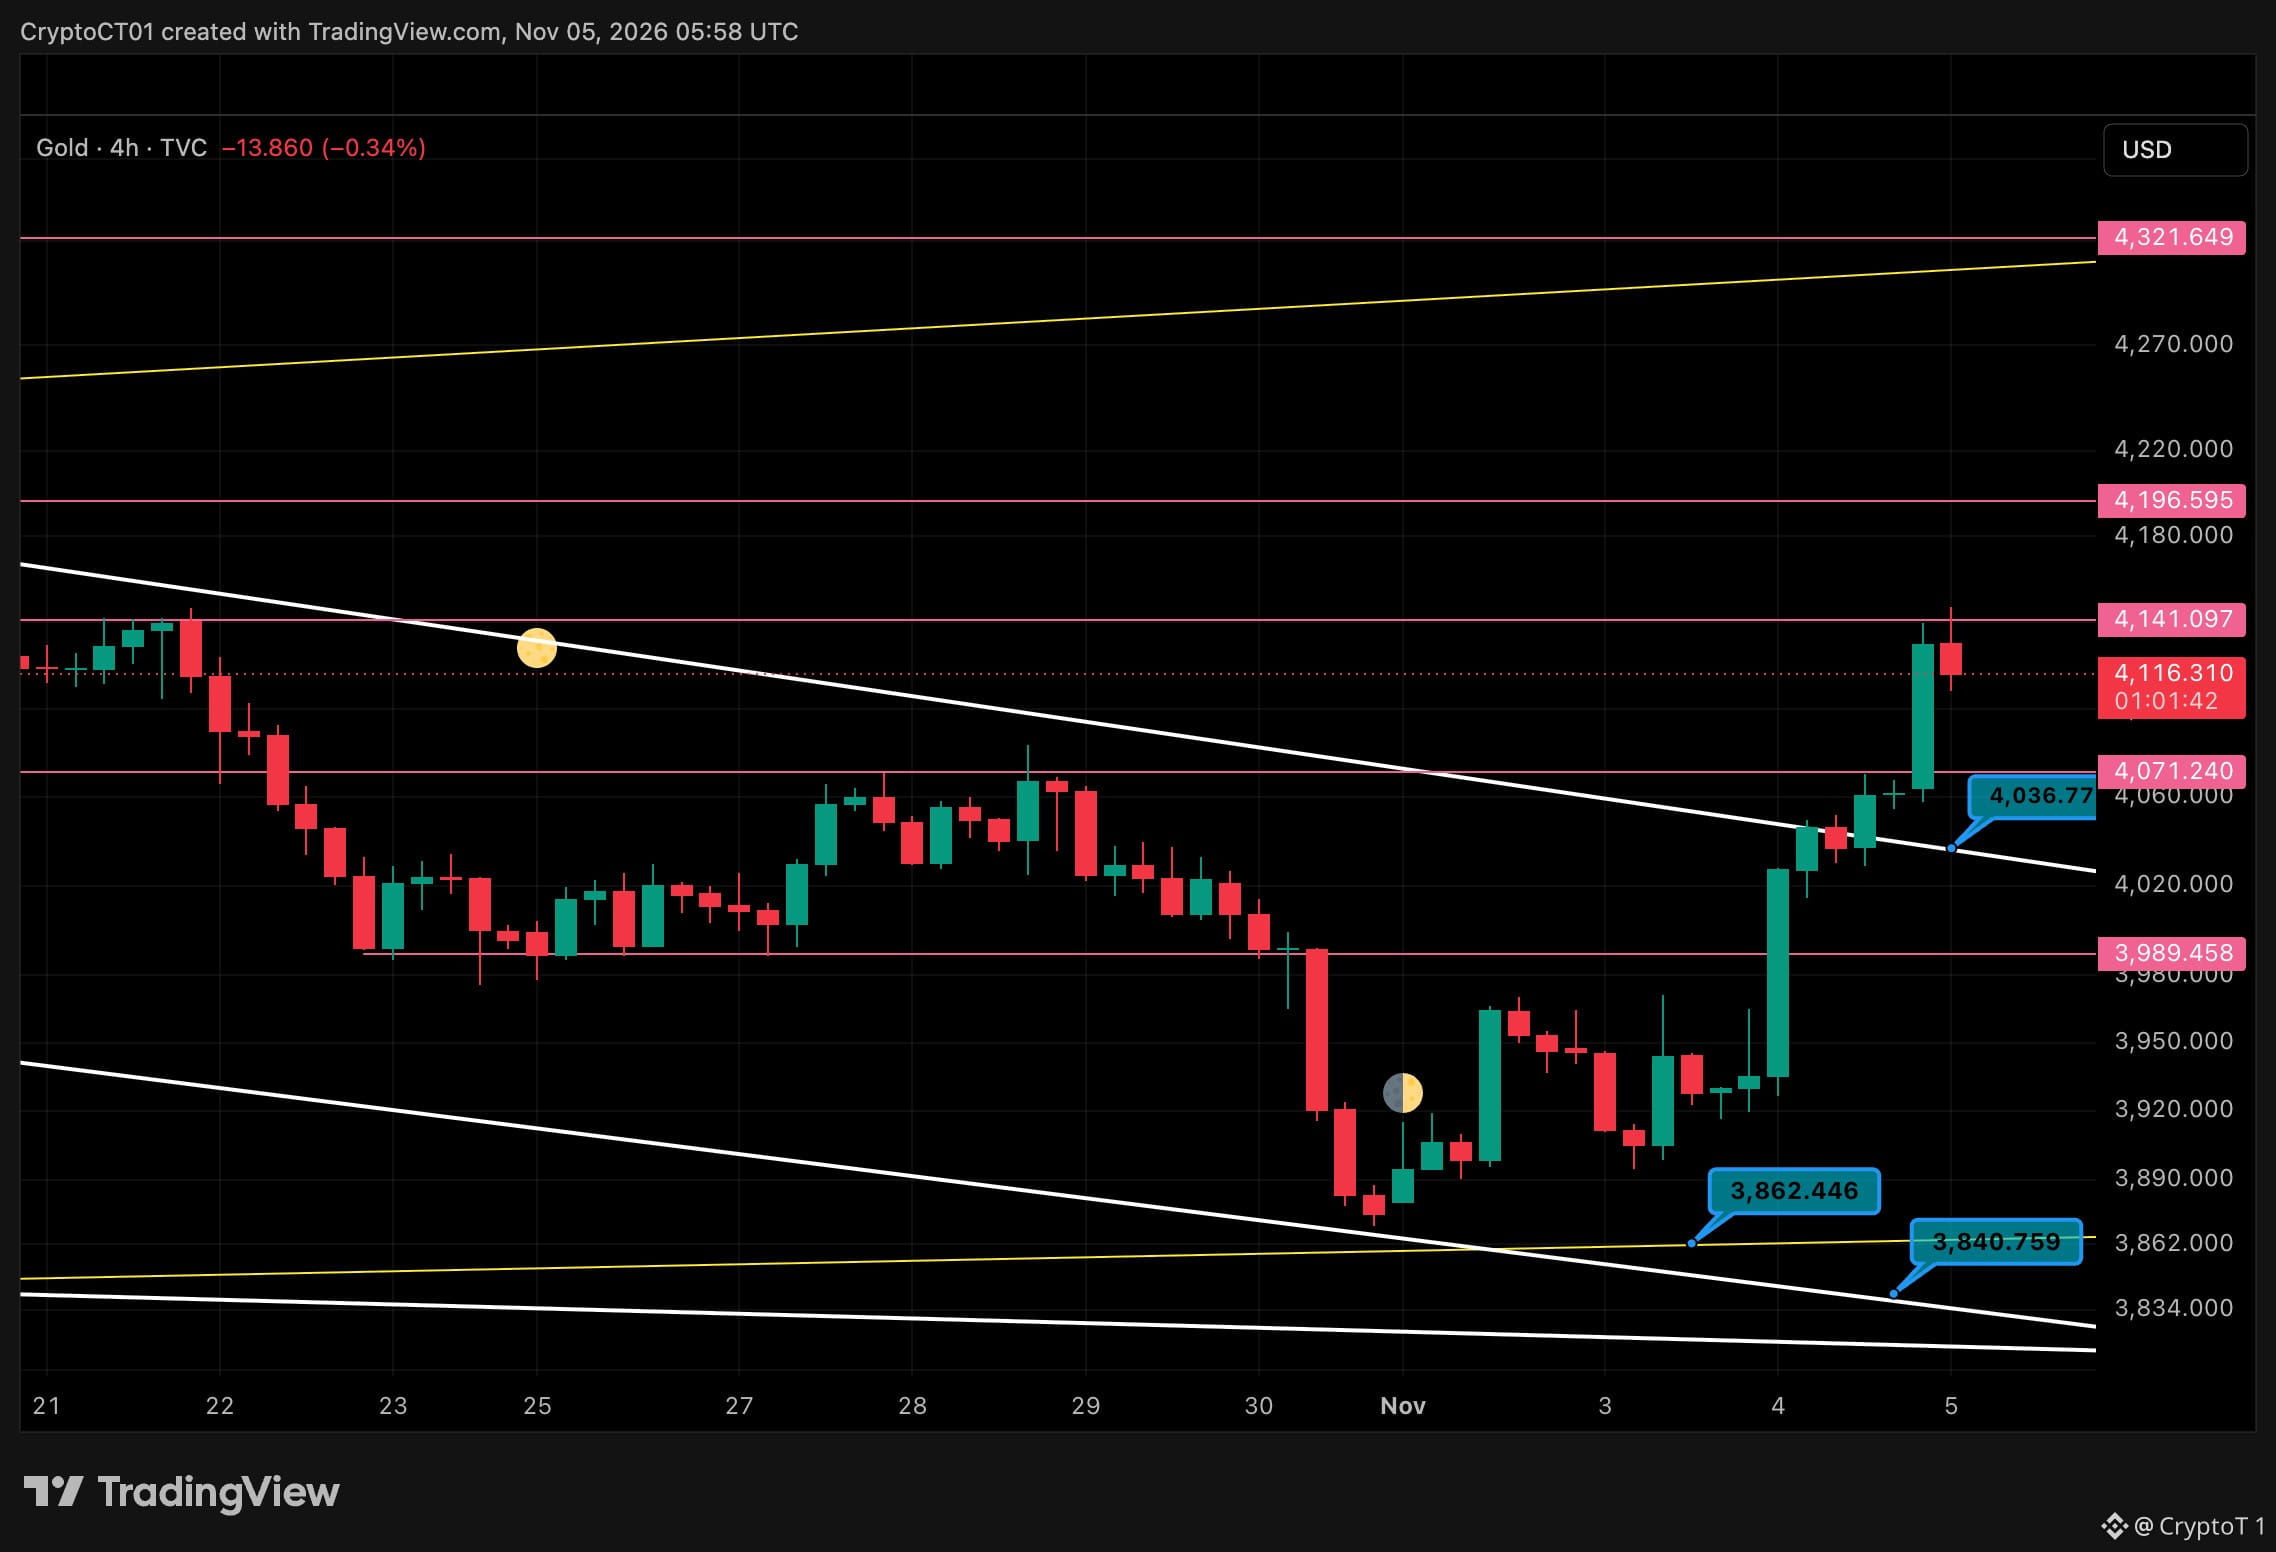
黄金突破下降趋势线,现在必须突破 4,141 🥇 在 4 小时图上,黄金突破了自 10 月底以来一直压制价格的下降趋势线,随后直接遇上阻力。 🔹 首次尝试在 4,141 遭遇拒绝,目前在 4,116 附近交易 🟢 支撑位:4,071,其次是接近 4,036 的已突破趋势线 🎯 收盘价若站上 4,141,将有望上探 4,196,再往上是 4,321 🔴 若回落至 4,036 以下,价格将重返原有通道,并可能下探 3,989 回调时守住趋势线,是较稳妥的做多机会。直接追高买进、冲向 4,141 就不是了。 你会逢低买进,还是等突破?👇 不构成财务建议。#Gold #XAUUSD #Trading $XAUt
黄金突破下降趋势线,现在必须突破 4,141 🥇 在 4 小时图上,黄金突破了自 10 月底以来一直压制价格的下降趋势线,随后直接遇上阻力。 🔹 首次尝试在 4,141 遭遇拒绝,目前在 4,116 附近交易 🟢 支撑位:4,071,其次是接近 4,036 的已突破趋势线 🎯 收盘价若站上 4,141,将有望上探 4,196,再往上是 4,321 🔴 若回落至 4,036 以下,价格将重返原有通道,并可能下探 3,989 回调时守住趋势线,是较稳妥的做多机会。直接追高买进、冲向 4,141 就不是了。 你会逢低买进,还是等突破?👇 不构成财务建议。#Gold #XAUUSD #Trading $XAUt
63
·
--
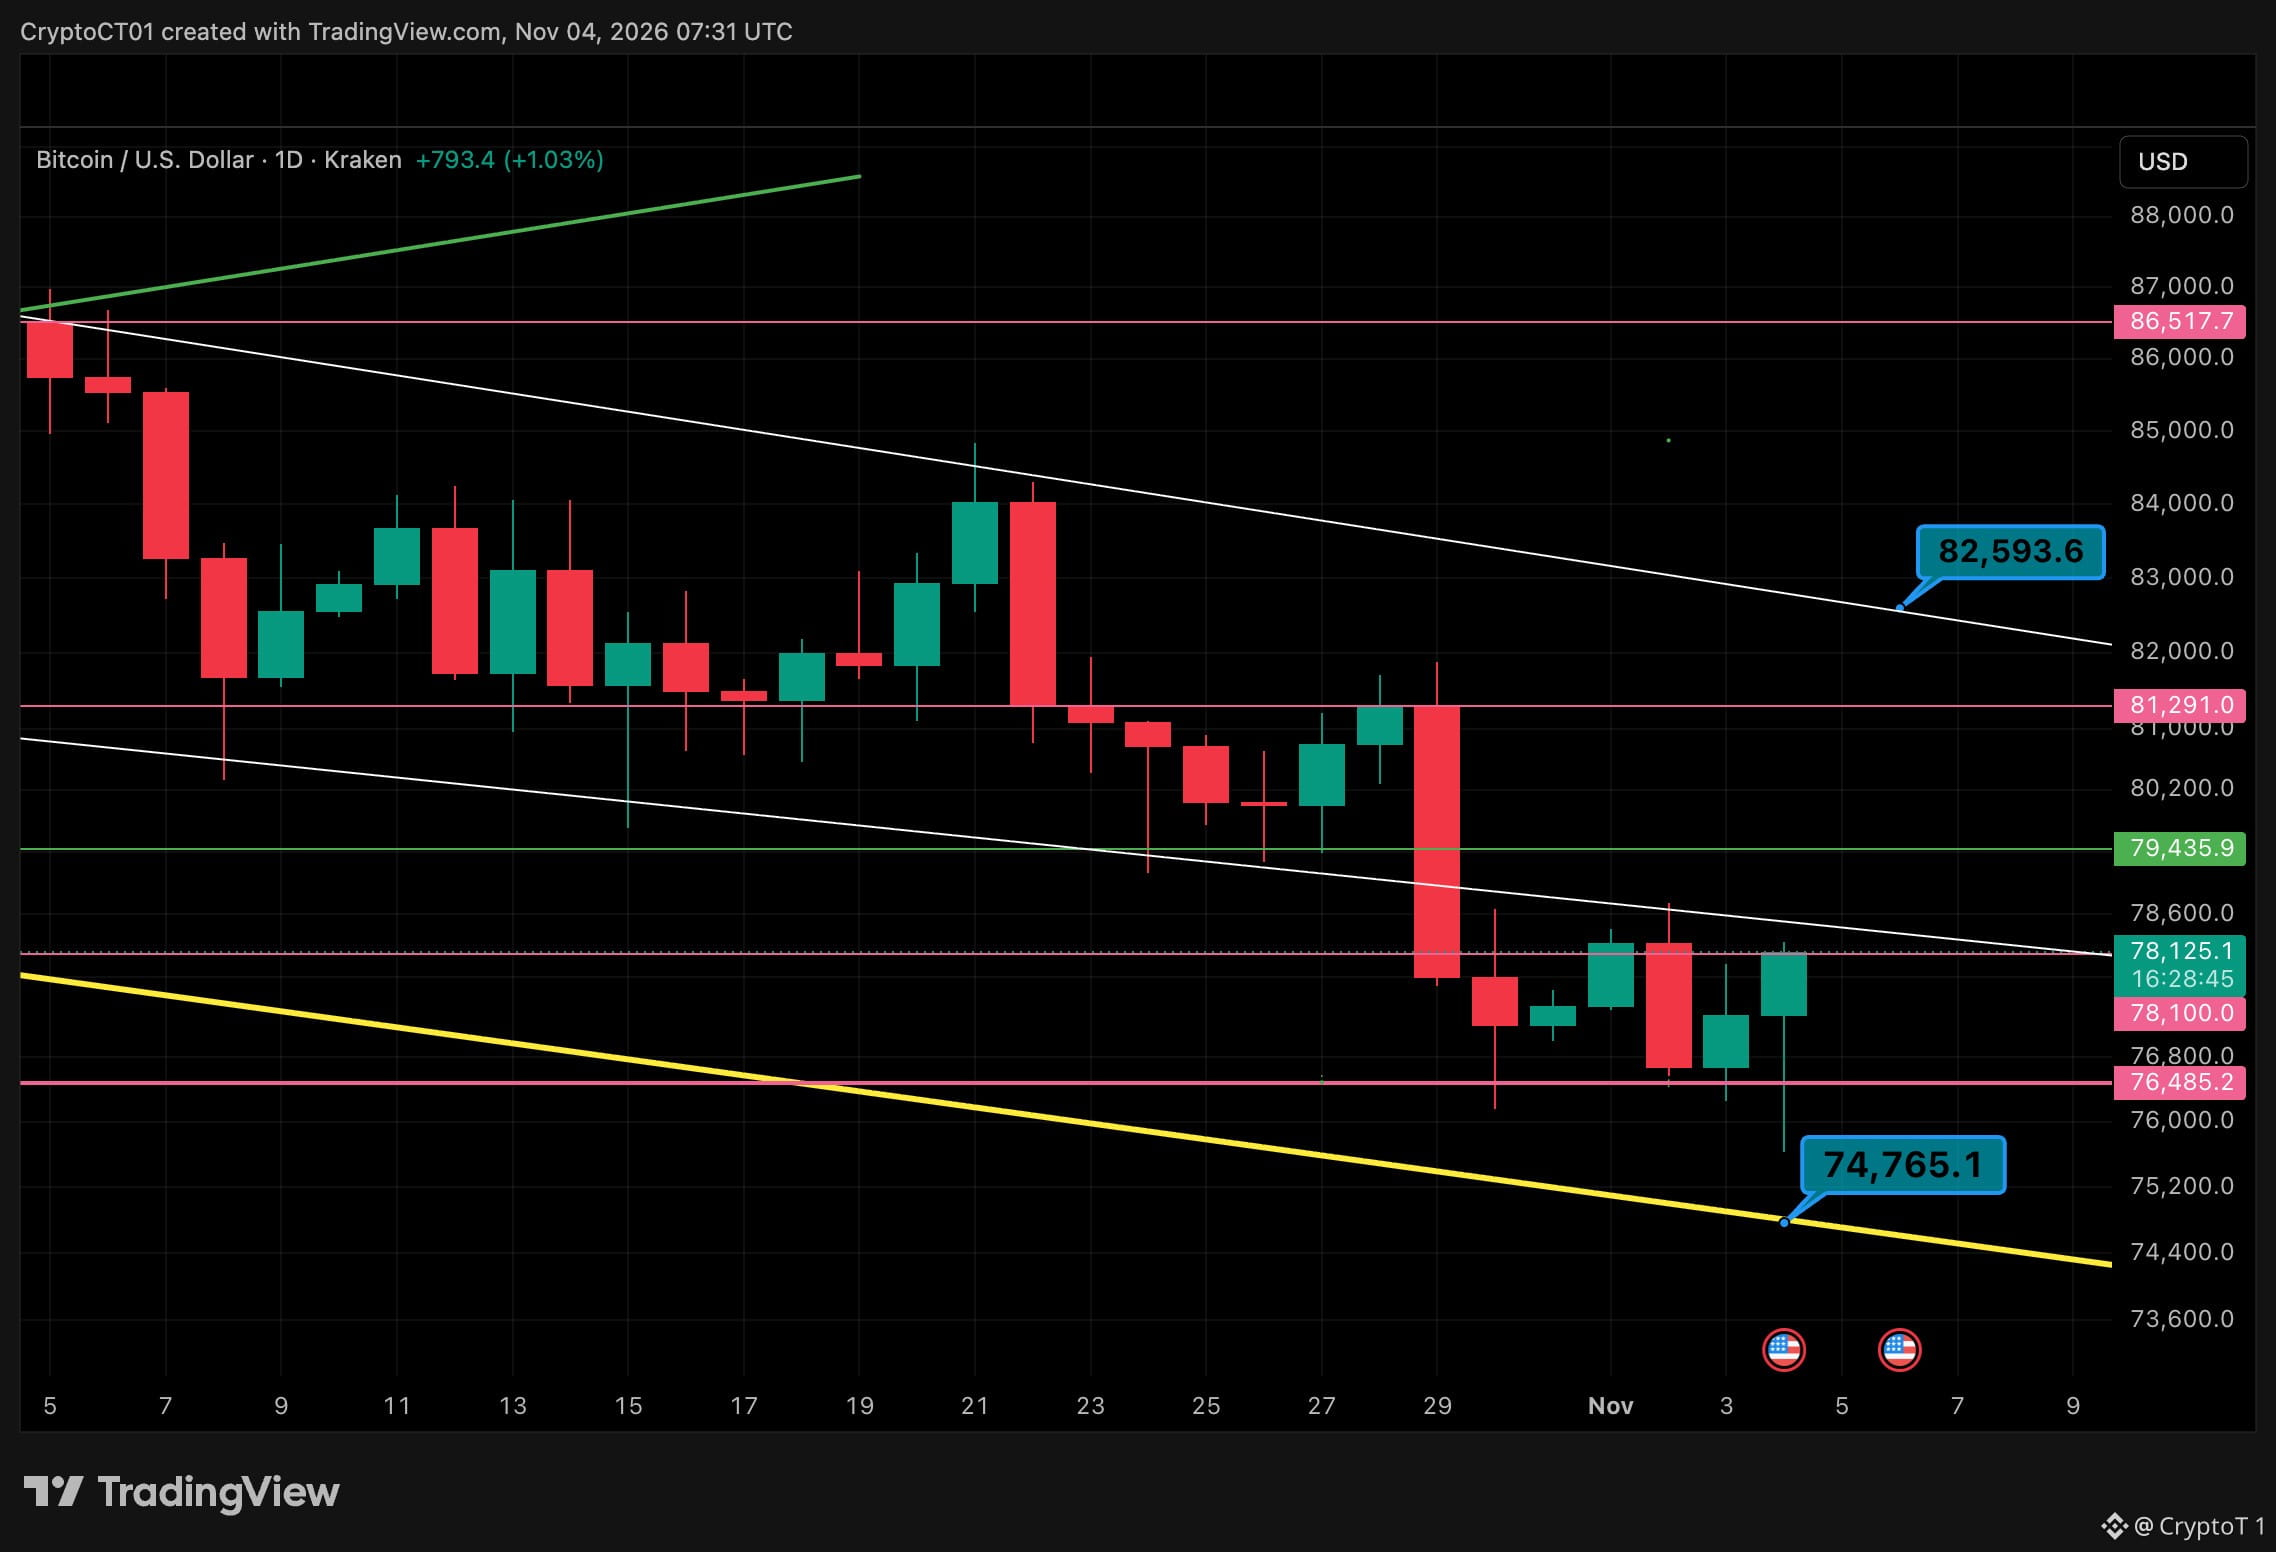
$BTC 日线:测试天花板 🟢 昨天一度下探至约 75.7K,收盘时回到 76.5K 上方。今天价格正逼近 78.1K。 🔹 支撑位:76,485,接著是约 74.8K 的下方趋势线 🟢 测试位:78,100,自 10 月 29 日下跌以来,价格一直无法突破这个价位 🟢 若突破:79,436,接著是 81,291 🎯 大局观:通道顶部约在 82.6K 目前仍处于 10 月初以来的下降通道内,因此在将此视为趋势反转之前,我希望看到日线收盘站上 78.1K。耐心等待,让价格走到这些关键价位。 今天会向上突破,还是遭遇拒绝后回落至 76.5K?👇 以上并非财务建议。#比特币 #BTC #加密货币
$BTC 日线:测试天花板 🟢 昨天一度下探至约 75.7K,收盘时回到 76.5K 上方。今天价格正逼近 78.1K。 🔹 支撑位:76,485,接著是约 74.8K 的下方趋势线 🟢 测试位:78,100,自 10 月 29 日下跌以来,价格一直无法突破这个价位 🟢 若突破:79,436,接著是 81,291 🎯 大局观:通道顶部约在 82.6K 目前仍处于 10 月初以来的下降通道内,因此在将此视为趋势反转之前,我希望看到日线收盘站上 78.1K。耐心等待,让价格走到这些关键价位。 今天会向上突破,还是遭遇拒绝后回落至 76.5K?👇 以上并非财务建议。#比特币 #BTC #加密货币
62
·
--
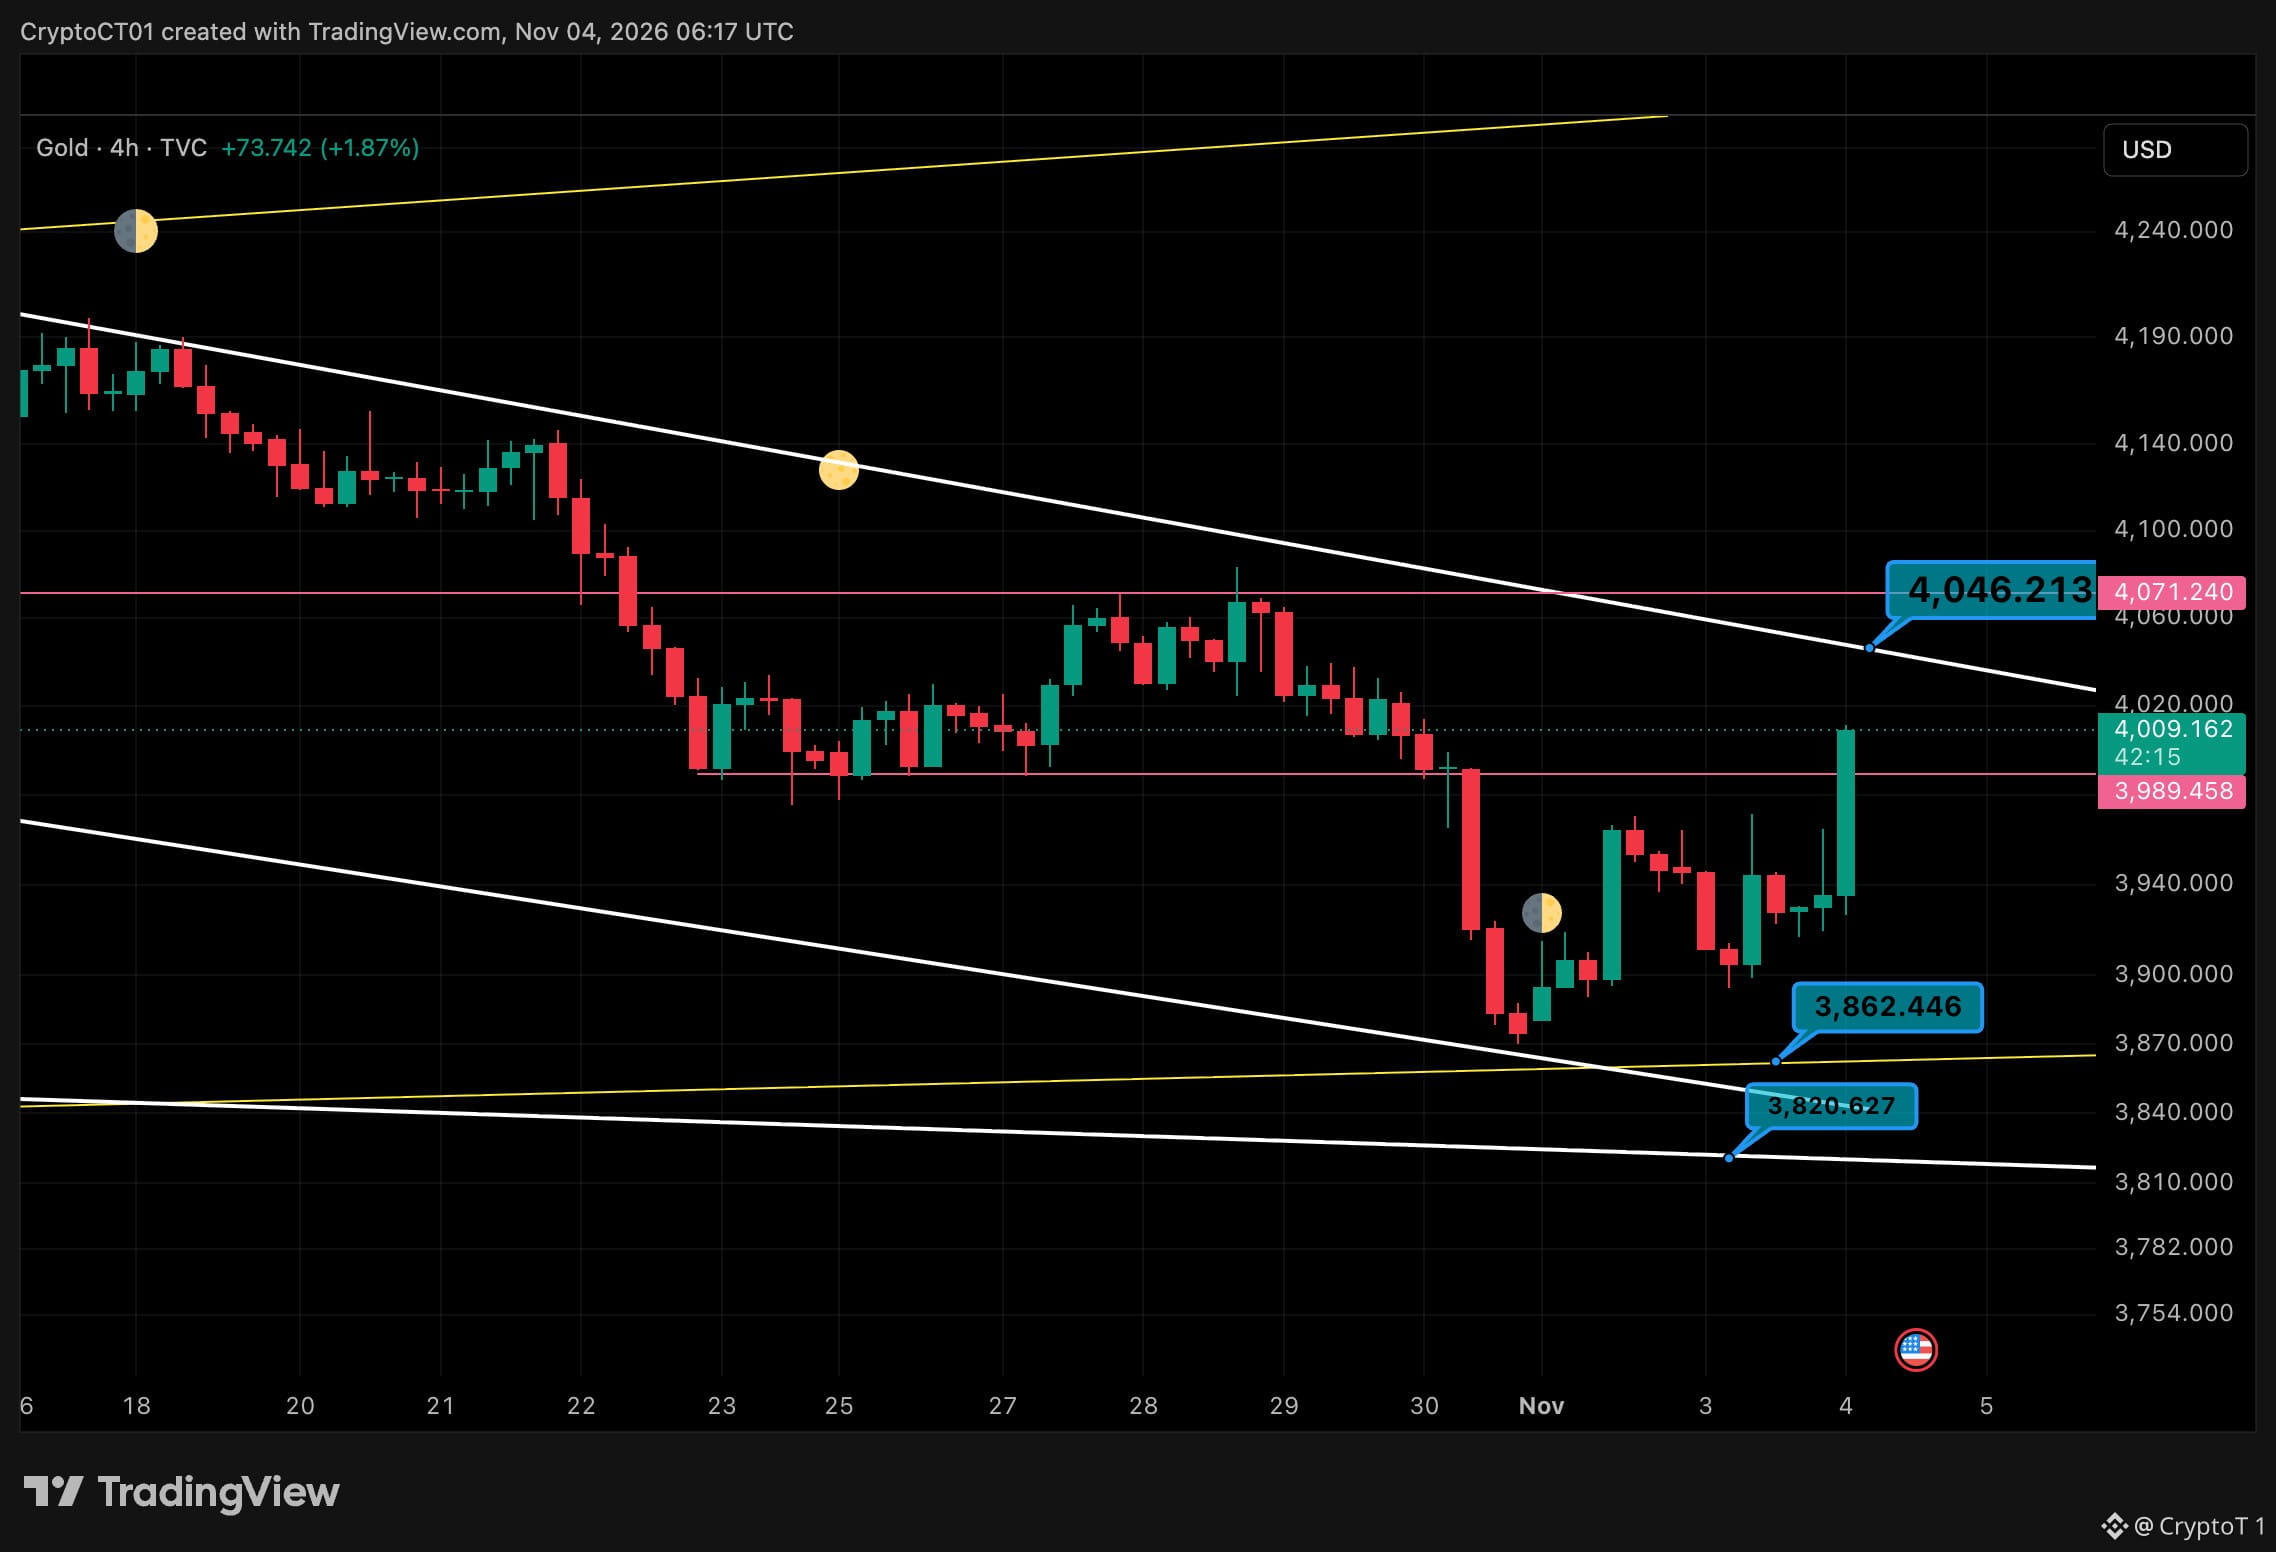
黄金刚收复 4,000 🟡 黄金 4 小时图强势上涨,目前回到 4,015 附近,突破了我一直关注的 3,989 关卡。 🔹 3,989 原本是阻力位,现在需要守住并成为支撑 🟢 下一个目标是 4,046,10 月中旬的下降趋势线位于此处 🟢 再上方是 4,071,这是 10 月下旬的跌破位置 🔴 若跌破 3,989,3,862 / 3,820 的低点将再次成为焦点 我不会追这根 K 线。我宁可等价格回测 3,989 并守稳,或 4 小时图明确收在趋势线上方。 这是突破还是多头陷阱?👇 以上并非投资建议。 #黄金 #XAUUSD #交易 $XAUt
黄金刚收复 4,000 🟡 黄金 4 小时图强势上涨,目前回到 4,015 附近,突破了我一直关注的 3,989 关卡。 🔹 3,989 原本是阻力位,现在需要守住并成为支撑 🟢 下一个目标是 4,046,10 月中旬的下降趋势线位于此处 🟢 再上方是 4,071,这是 10 月下旬的跌破位置 🔴 若跌破 3,989,3,862 / 3,820 的低点将再次成为焦点 我不会追这根 K 线。我宁可等价格回测 3,989 并守稳,或 4 小时图明确收在趋势线上方。 这是突破还是多头陷阱?👇 以上并非投资建议。 #黄金 #XAUUSD #交易 $XAUt
76
登录解锁更多内容
加入币安广场,与全球加密货币用户互动
⚡️ 获取关于加密货币的最新实用信息。
💬 受到全球最大加密货币交易平台的信赖。
👍 发现来自认证创作者的真知灼见。
邮箱/手机号码