

Joao Wedson
87 个内容

Joao Wedson
举报
屏蔽用户
💎Founder & CEO of @Alphractal
🏅Verified Author at CoinMarketCap & CryptoQuant
⚙ MSc in Data Science & AI
🦾Engineer in Robotics & Automation
₿itcoin OG
0 关注
4 粉丝
11 点赞
帖子
·
--
查看翻译
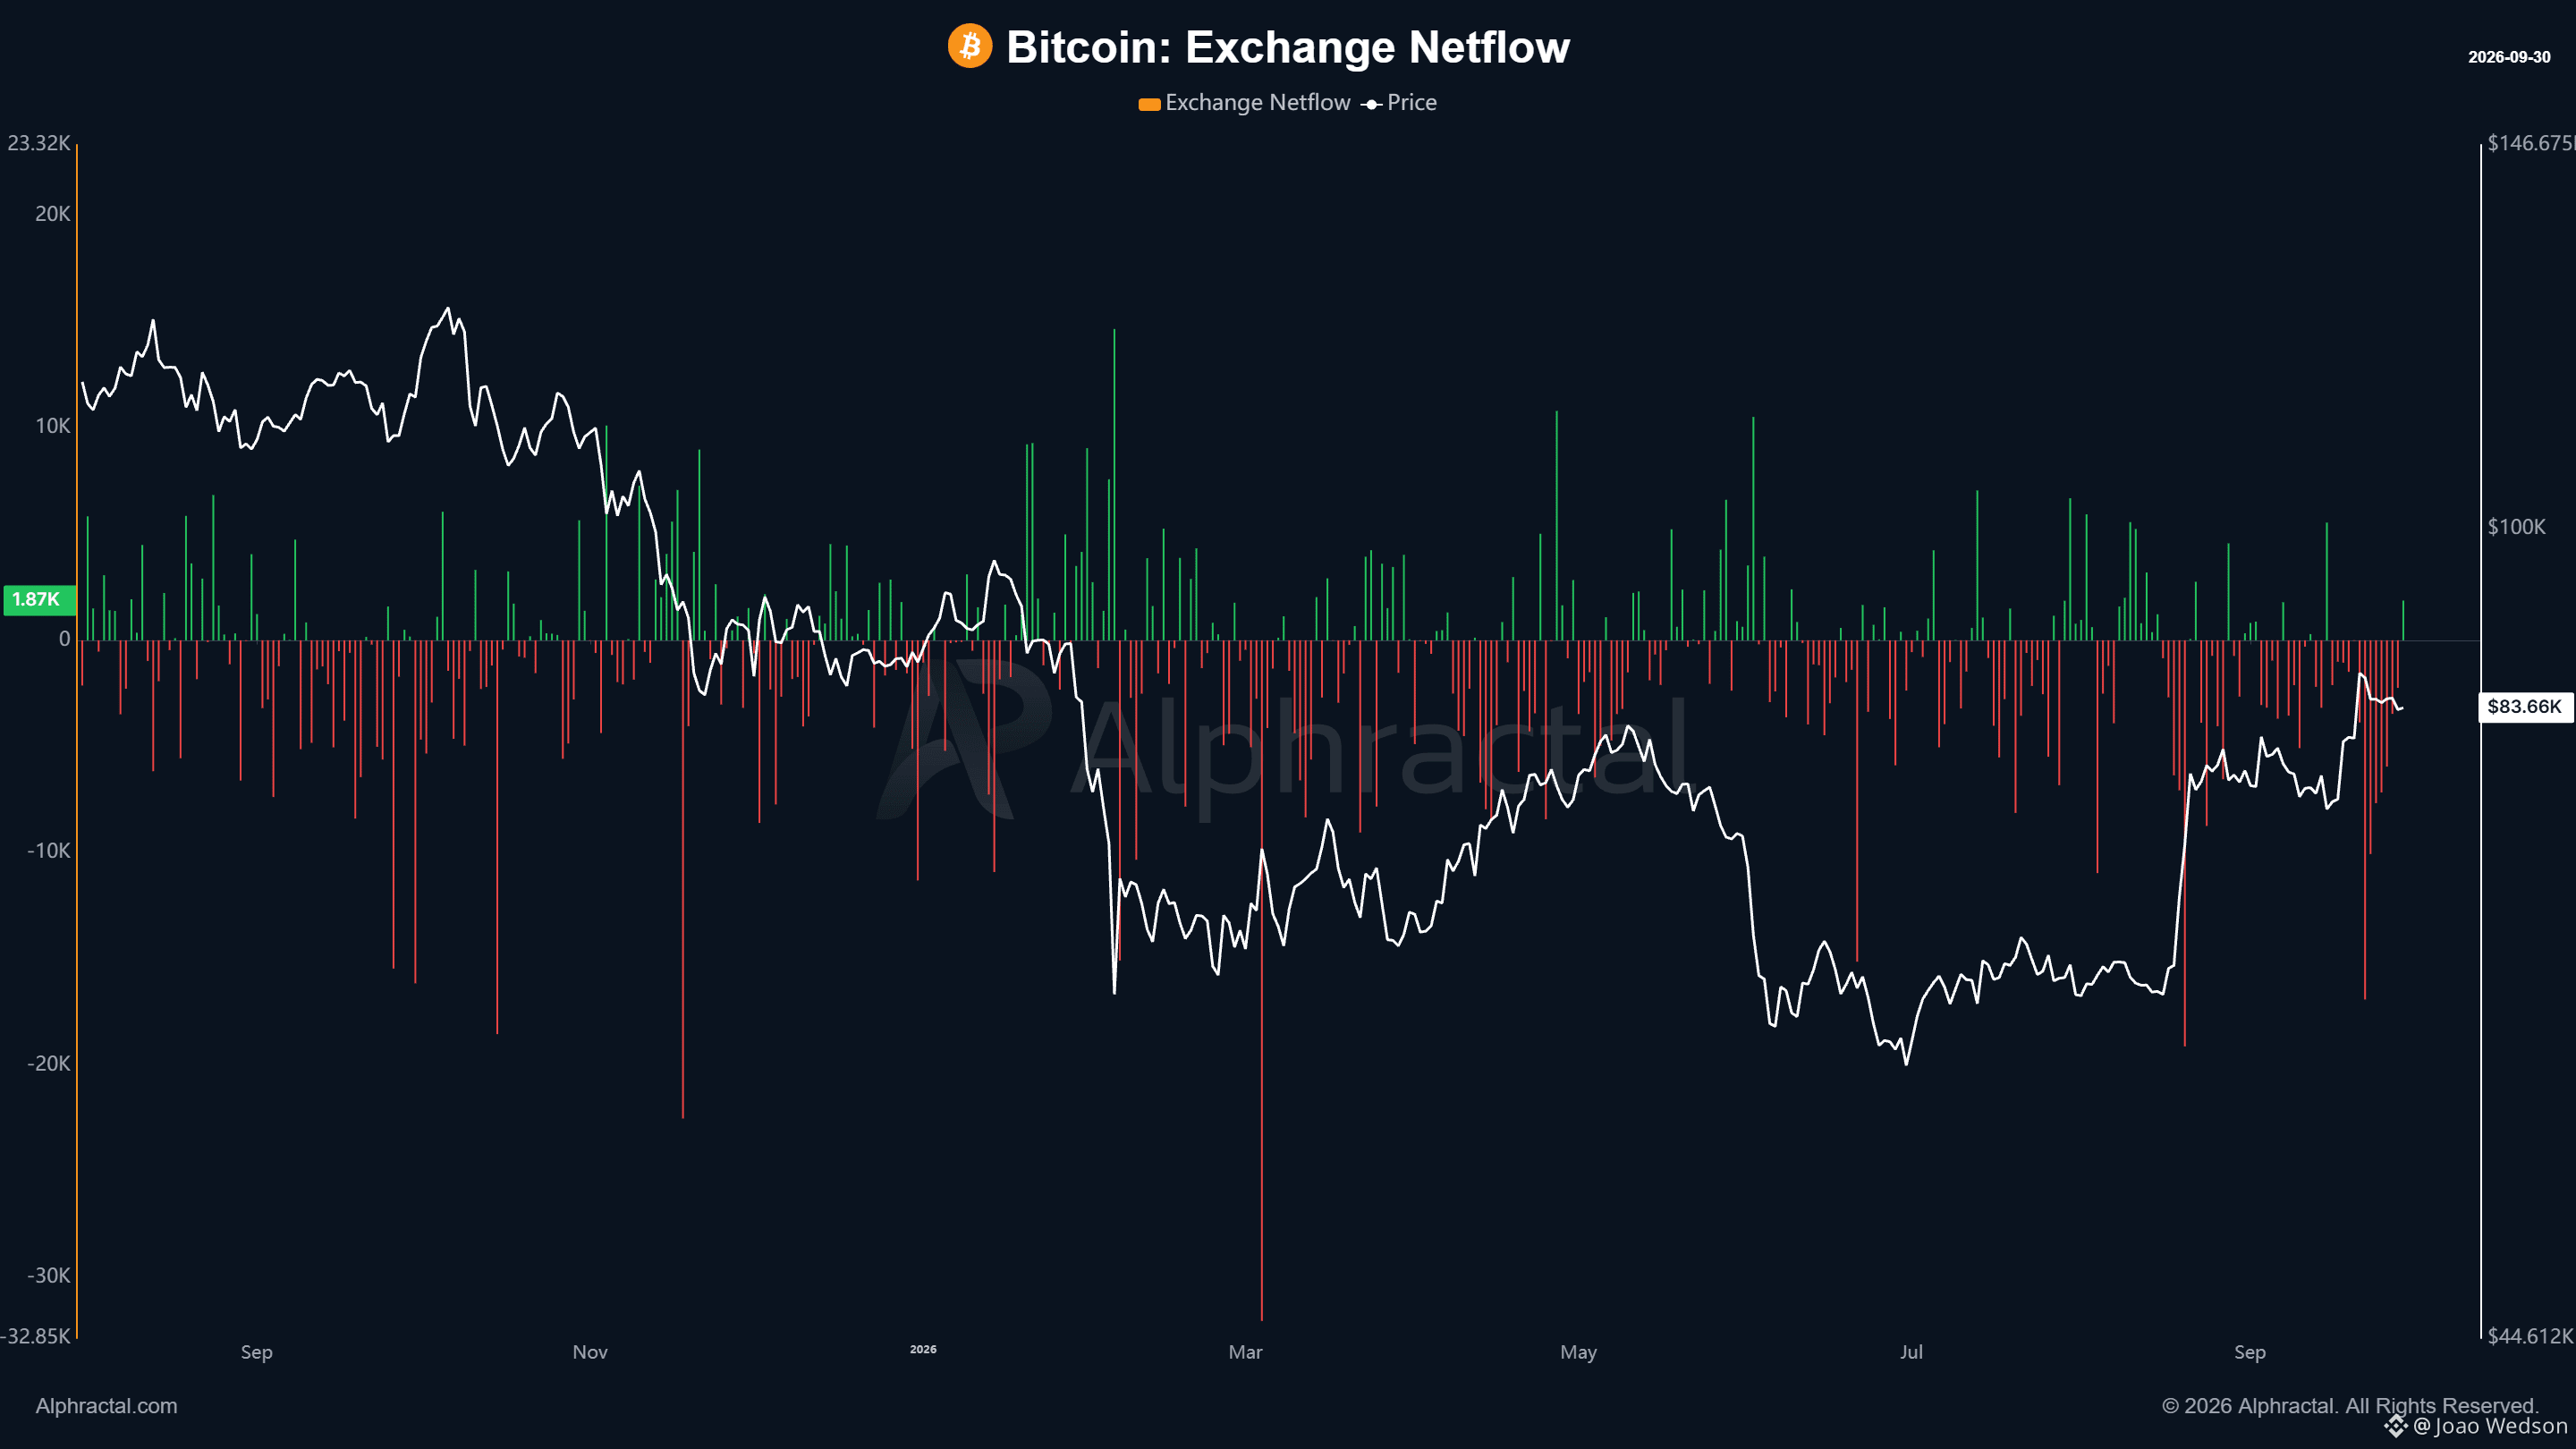
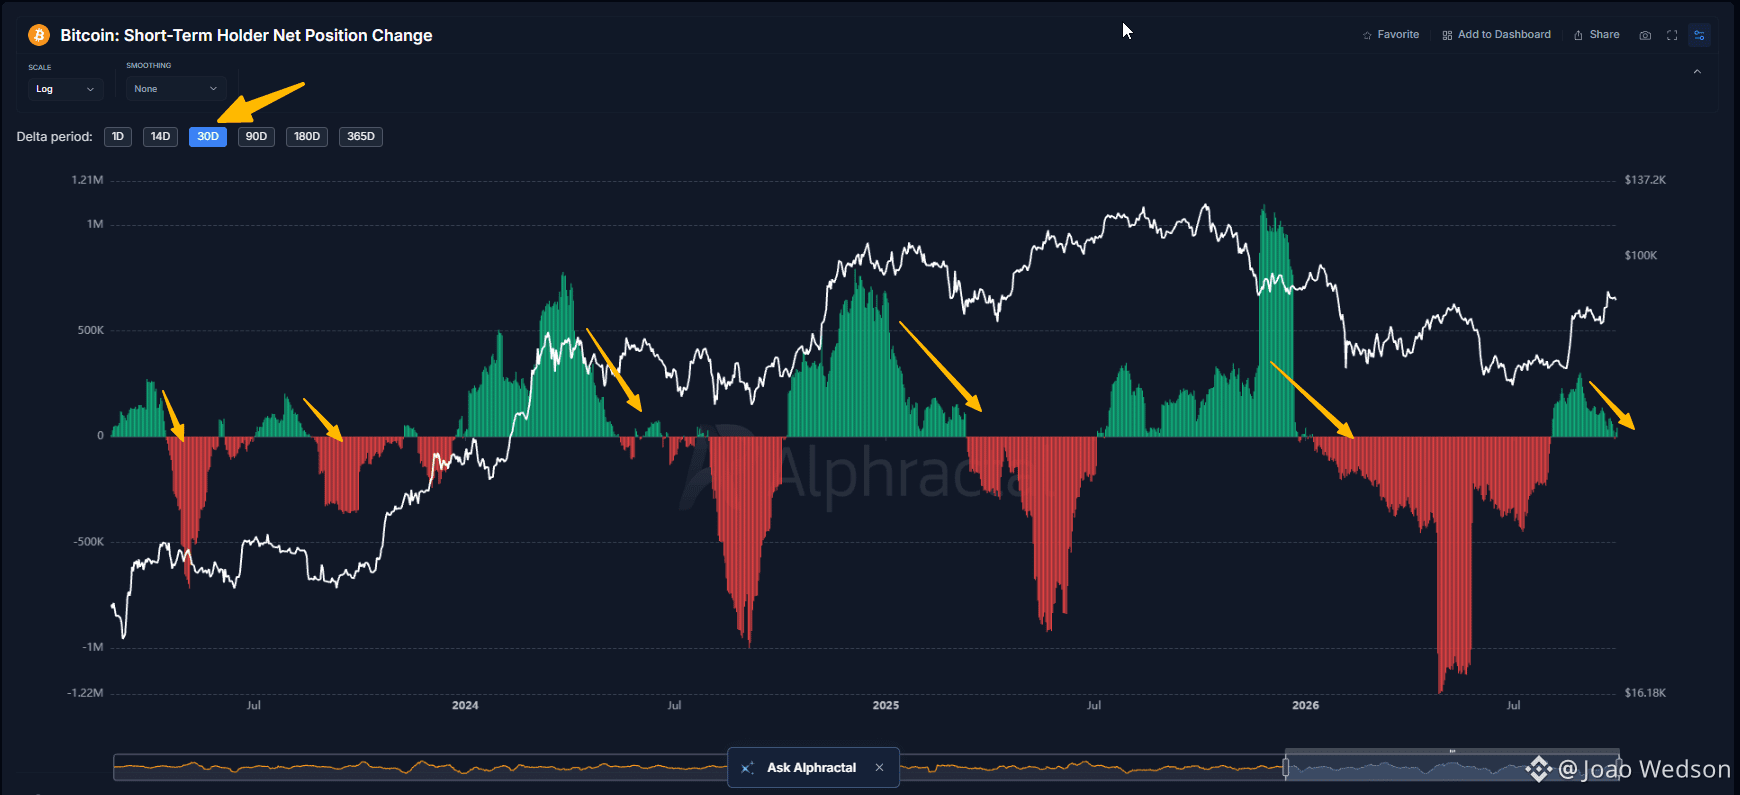
Short Term Holder momentum is weakening again. The 30D Short Term Holder Net Position Change is now very close to negative territory, meaning STHs are no longer accumulating at the same pace they were 30 days ago. This can point to weaker buying pressure or a longer consolidation phase. If the metric turns deeply negative, it can also precede faster downside moves, so Exchange Netflow becomes important here. For now, we are not seeing significant BTC inflows into exchanges, which keeps the signal relatively neutral. Onchain usually starts showing these shifts before the market narrative catches up. Better to follow the data than turn bullish or bearish too early. $BTC
Short Term Holder momentum is weakening again. The 30D Short Term Holder Net Position Change is now very close to negative territory, meaning STHs are no longer accumulating at the same pace they were 30 days ago. This can point to weaker buying pressure or a longer consolidation phase. If the metric turns deeply negative, it can also precede faster downside moves, so Exchange Netflow becomes important here. For now, we are not seeing significant BTC inflows into exchanges, which keeps the signal relatively neutral. Onchain usually starts showing these shifts before the market narrative catches up. Better to follow the data than turn bullish or bearish too early. $BTC
65
·
--
查看翻译
A practical example of using the Alphractal MCP with the ChatGPT scheduler.
This can be configured to run daily, every hour, or at any frequency you need.
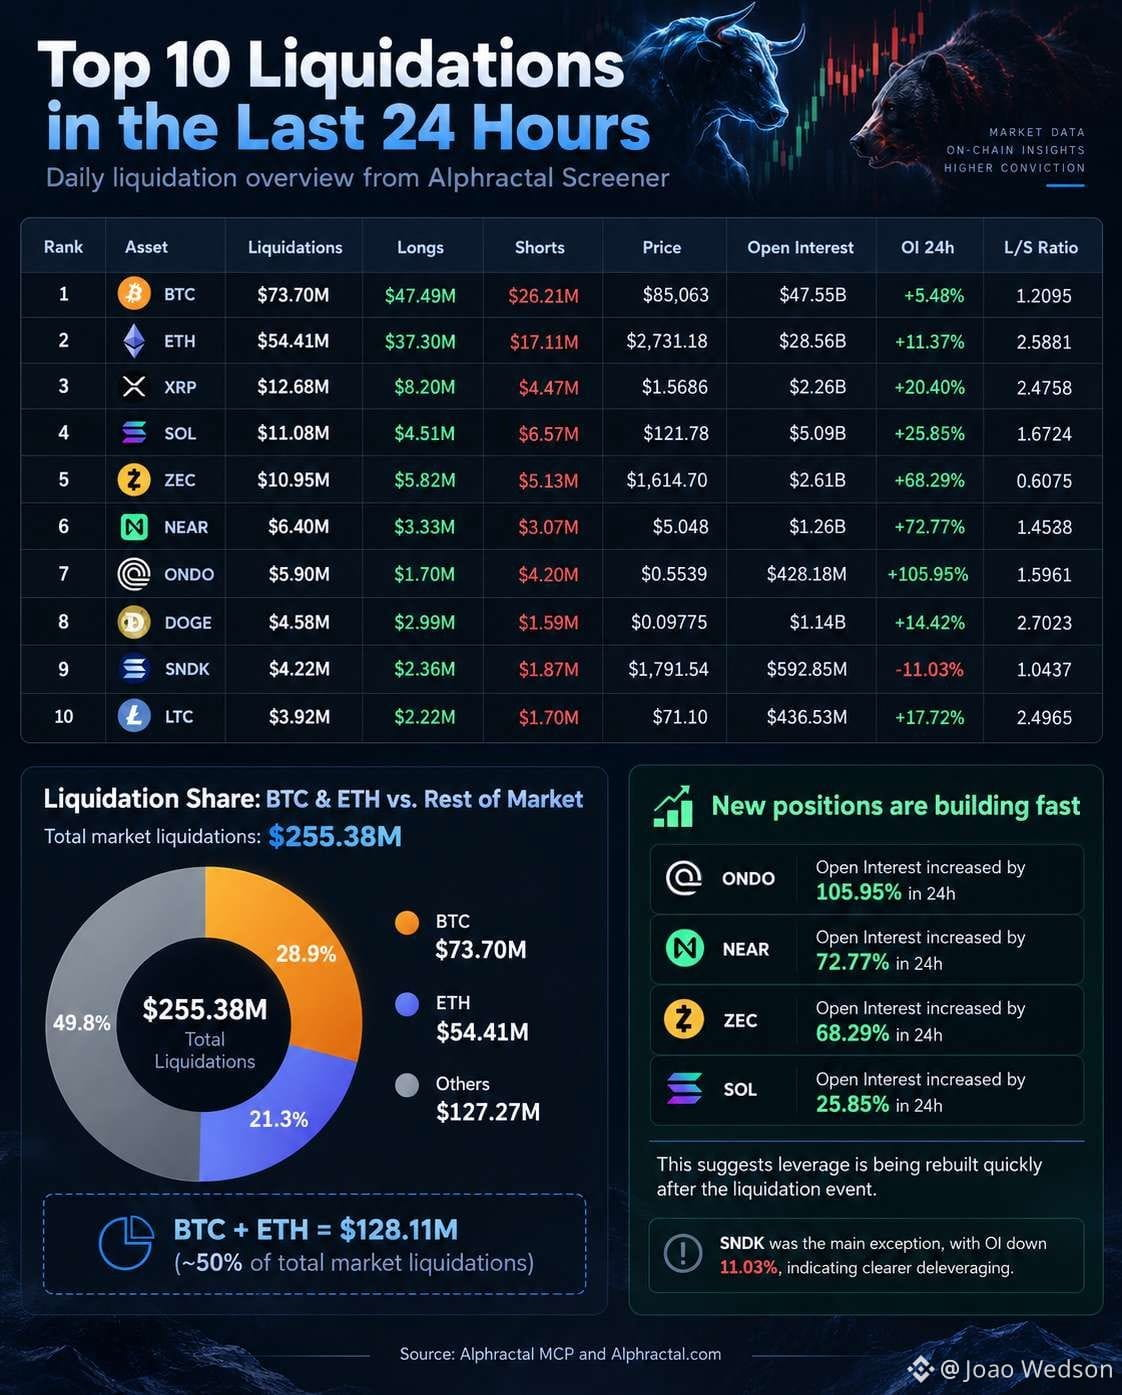
In this example, the system automatically pulled data from the Alphractal Screener, organized the Top 10 liquidations, generated the analysis, and turned everything into an image ready to publish.
Over the last 24 hours, the market recorded $255.38M in liquidations.
$BTC alone accounted for $73.70M, while $ETH accounted for $54.41M, totaling $128.11M, around 50% of all market liquidations.
This shows how BTC and ETH continue to concentrate a significant share of market leverage and liquidation activity.
At the same time, one of the most interesting signals came from the sharp increase in Open Interest across several altcoins:
$ONDO: +105.95%
$NEAR: +72.77%
$ZEC: +68.29%
$SOL: +25.85%
All within the last 24 hours.
Even after significant liquidation events, new positions are being opened aggressively across several assets, suggesting that leverage is being rebuilt very quickly.
And here is the interesting part:
Both the image and this analysis were generated using the Alphractal MCP through the ChatGPT scheduler.
A practical use case for frequent market updates, automated analysis, content generation, and market monitoring using structured Alphractal data.
🔥 Only 4 days left to get 50% OFF all Alphractal plans!
Get access now!
A practical example of using the Alphractal MCP with the ChatGPT scheduler.
This can be configured to run daily, every hour, or at any frequency you need.
In this example, the system automatically pulled data from the Alphractal Screener, organized the Top 10 liquidations, generated the analysis, and turned everything into an image ready to publish.
Over the last 24 hours, the market recorded $255.38M in liquidations.
$BTC alone accounted for $73.70M, while $ETH accounted for $54.41M, totaling $128.11M, around 50% of all market liquidations.
This shows how BTC and ETH continue to concentrate a significant share of market leverage and liquidation activity.
At the same time, one of the most interesting signals came from the sharp increase in Open Interest across several altcoins:
$ONDO: +105.95%
$NEAR: +72.77%
$ZEC: +68.29%
$SOL: +25.85%
All within the last 24 hours.
Even after significant liquidation events, new positions are being opened aggressively across several assets, suggesting that leverage is being rebuilt very quickly.
And here is the interesting part:
Both the image and this analysis were generated using the Alphractal MCP through the ChatGPT scheduler.
A practical use case for frequent market updates, automated analysis, content generation, and market monitoring using structured Alphractal data.
🔥 Only 4 days left to get 50% OFF all Alphractal plans!
Get access now!
This can be configured to run daily, every hour, or at any frequency you need.
In this example, the system automatically pulled data from the Alphractal Screener, organized the Top 10 liquidations, generated the analysis, and turned everything into an image ready to publish.
Over the last 24 hours, the market recorded $255.38M in liquidations.
$BTC alone accounted for $73.70M, while $ETH accounted for $54.41M, totaling $128.11M, around 50% of all market liquidations.
This shows how BTC and ETH continue to concentrate a significant share of market leverage and liquidation activity.
At the same time, one of the most interesting signals came from the sharp increase in Open Interest across several altcoins:
$ONDO: +105.95%
$NEAR: +72.77%
$ZEC: +68.29%
$SOL: +25.85%
All within the last 24 hours.
Even after significant liquidation events, new positions are being opened aggressively across several assets, suggesting that leverage is being rebuilt very quickly.
And here is the interesting part:
Both the image and this analysis were generated using the Alphractal MCP through the ChatGPT scheduler.
A practical use case for frequent market updates, automated analysis, content generation, and market monitoring using structured Alphractal data.
🔥 Only 4 days left to get 50% OFF all Alphractal plans!
Get access now!
58
·
--
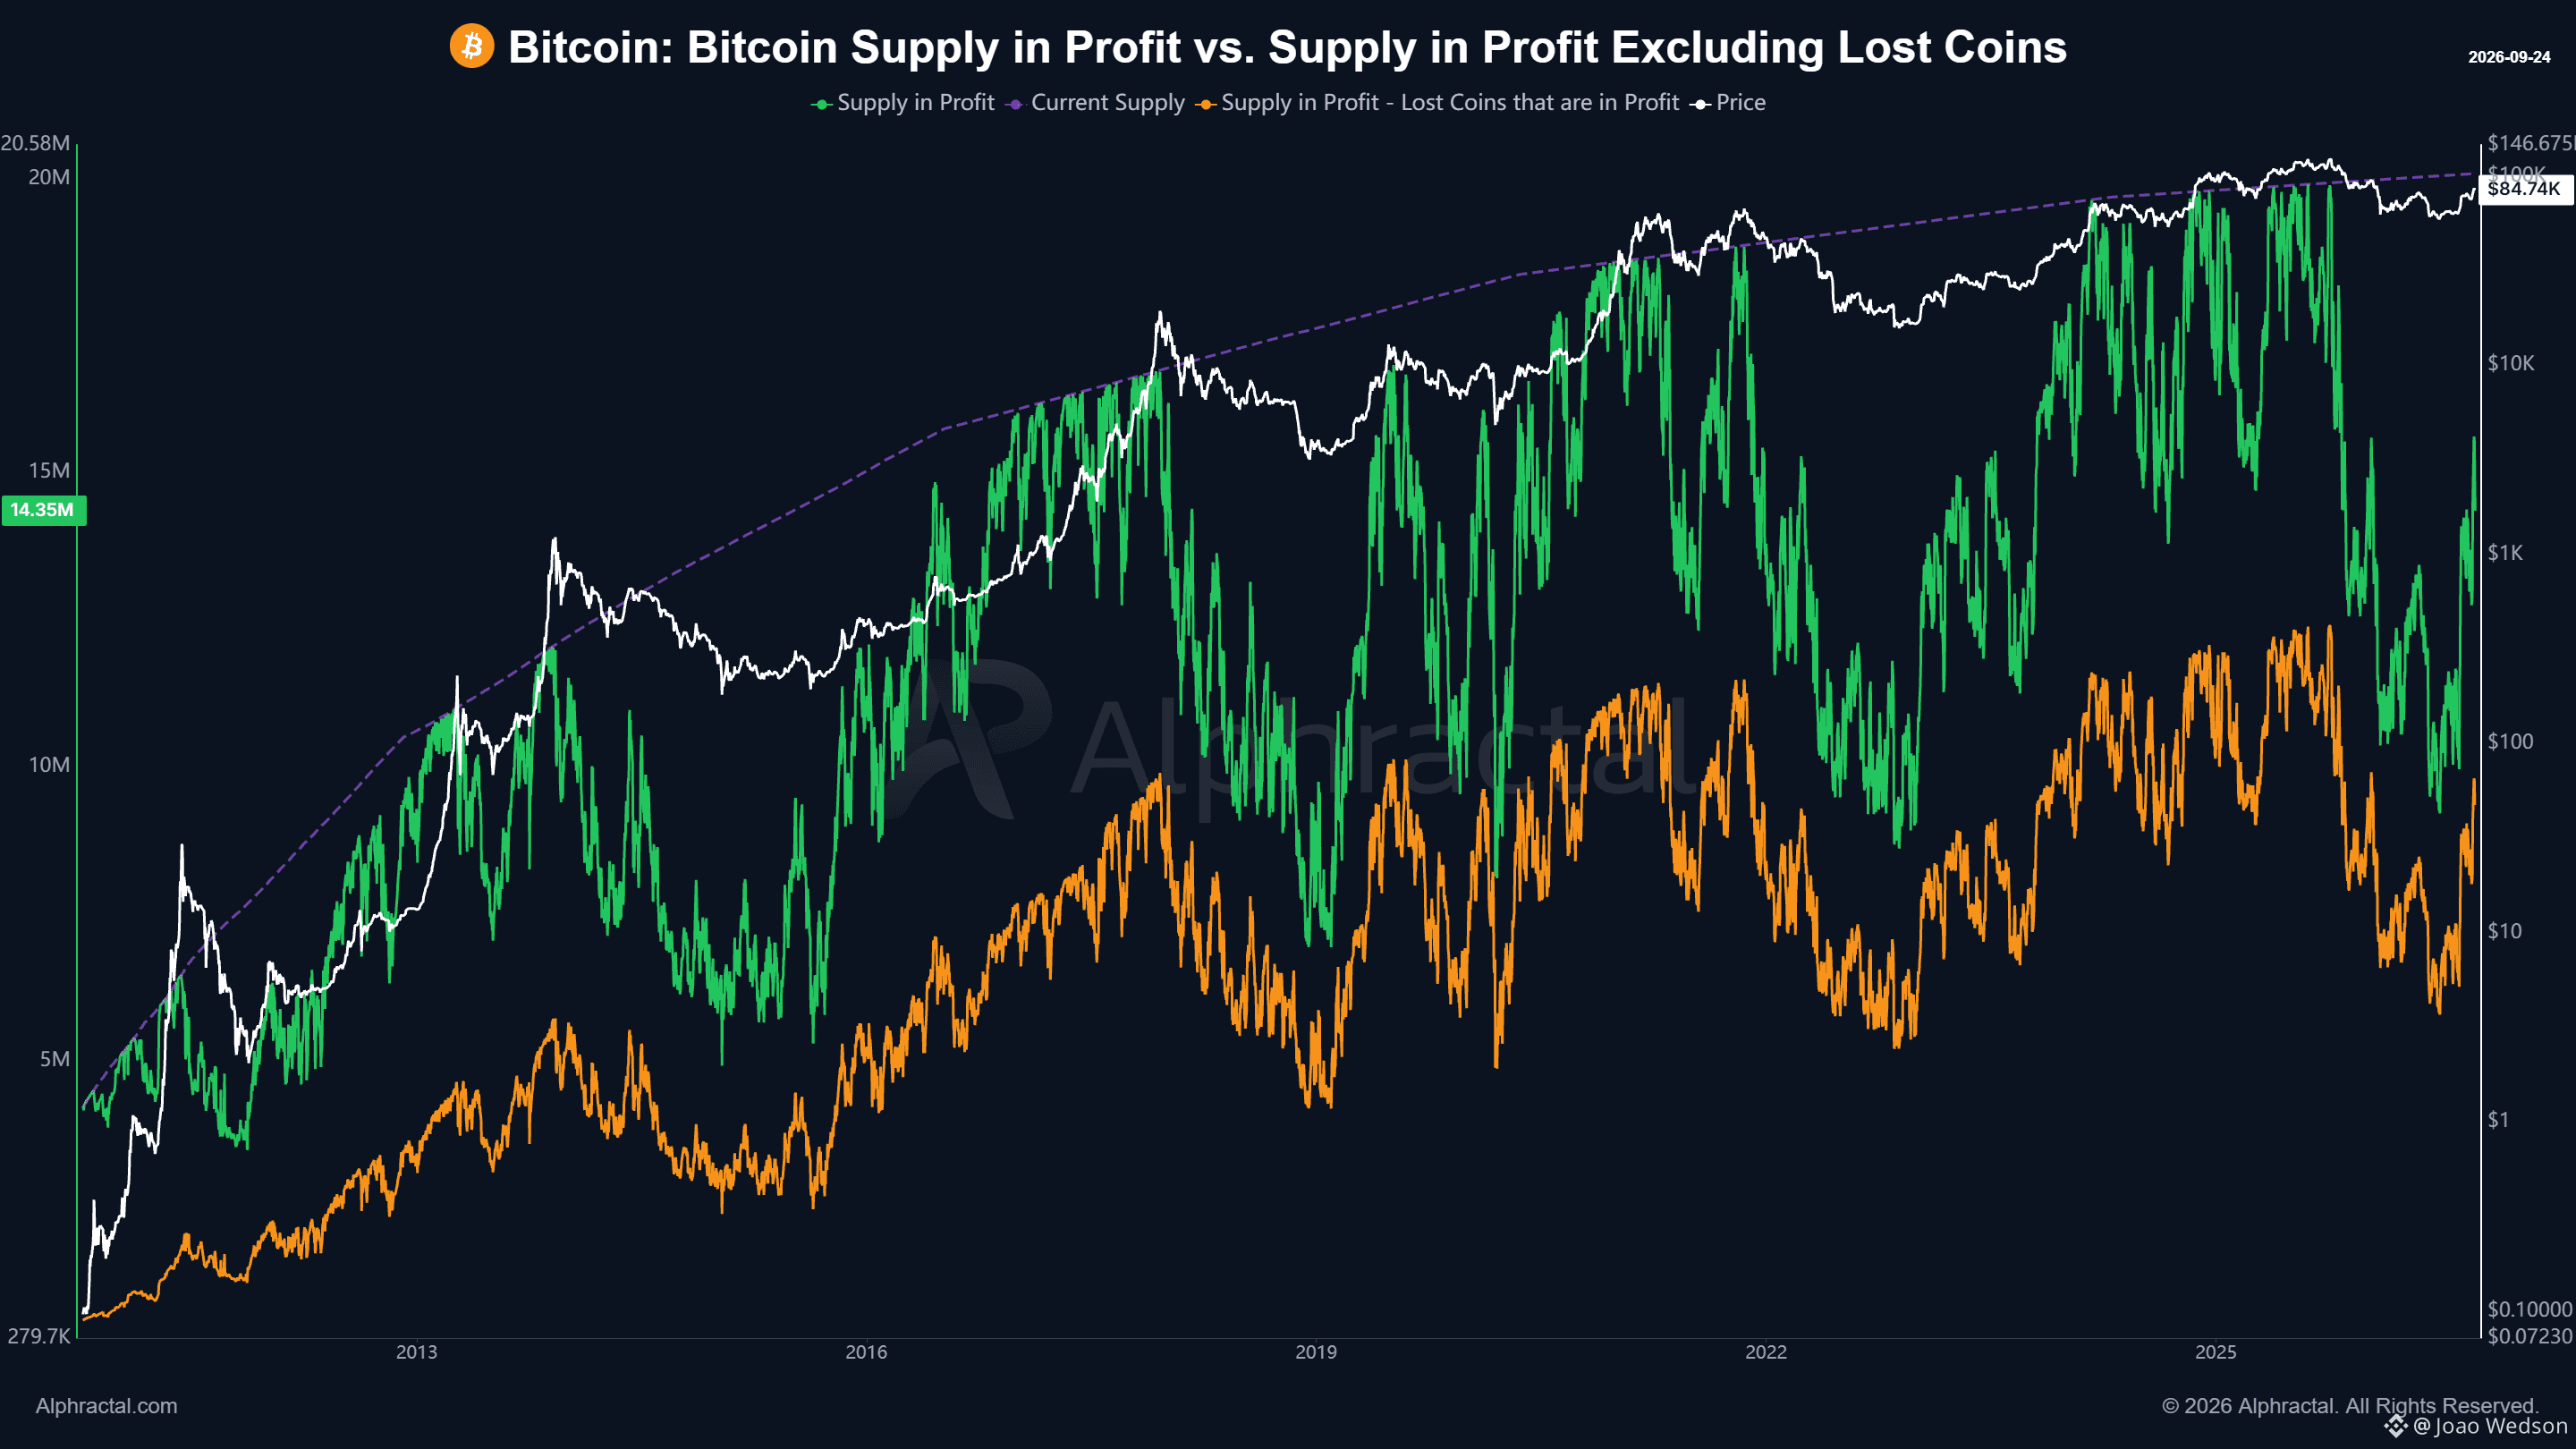
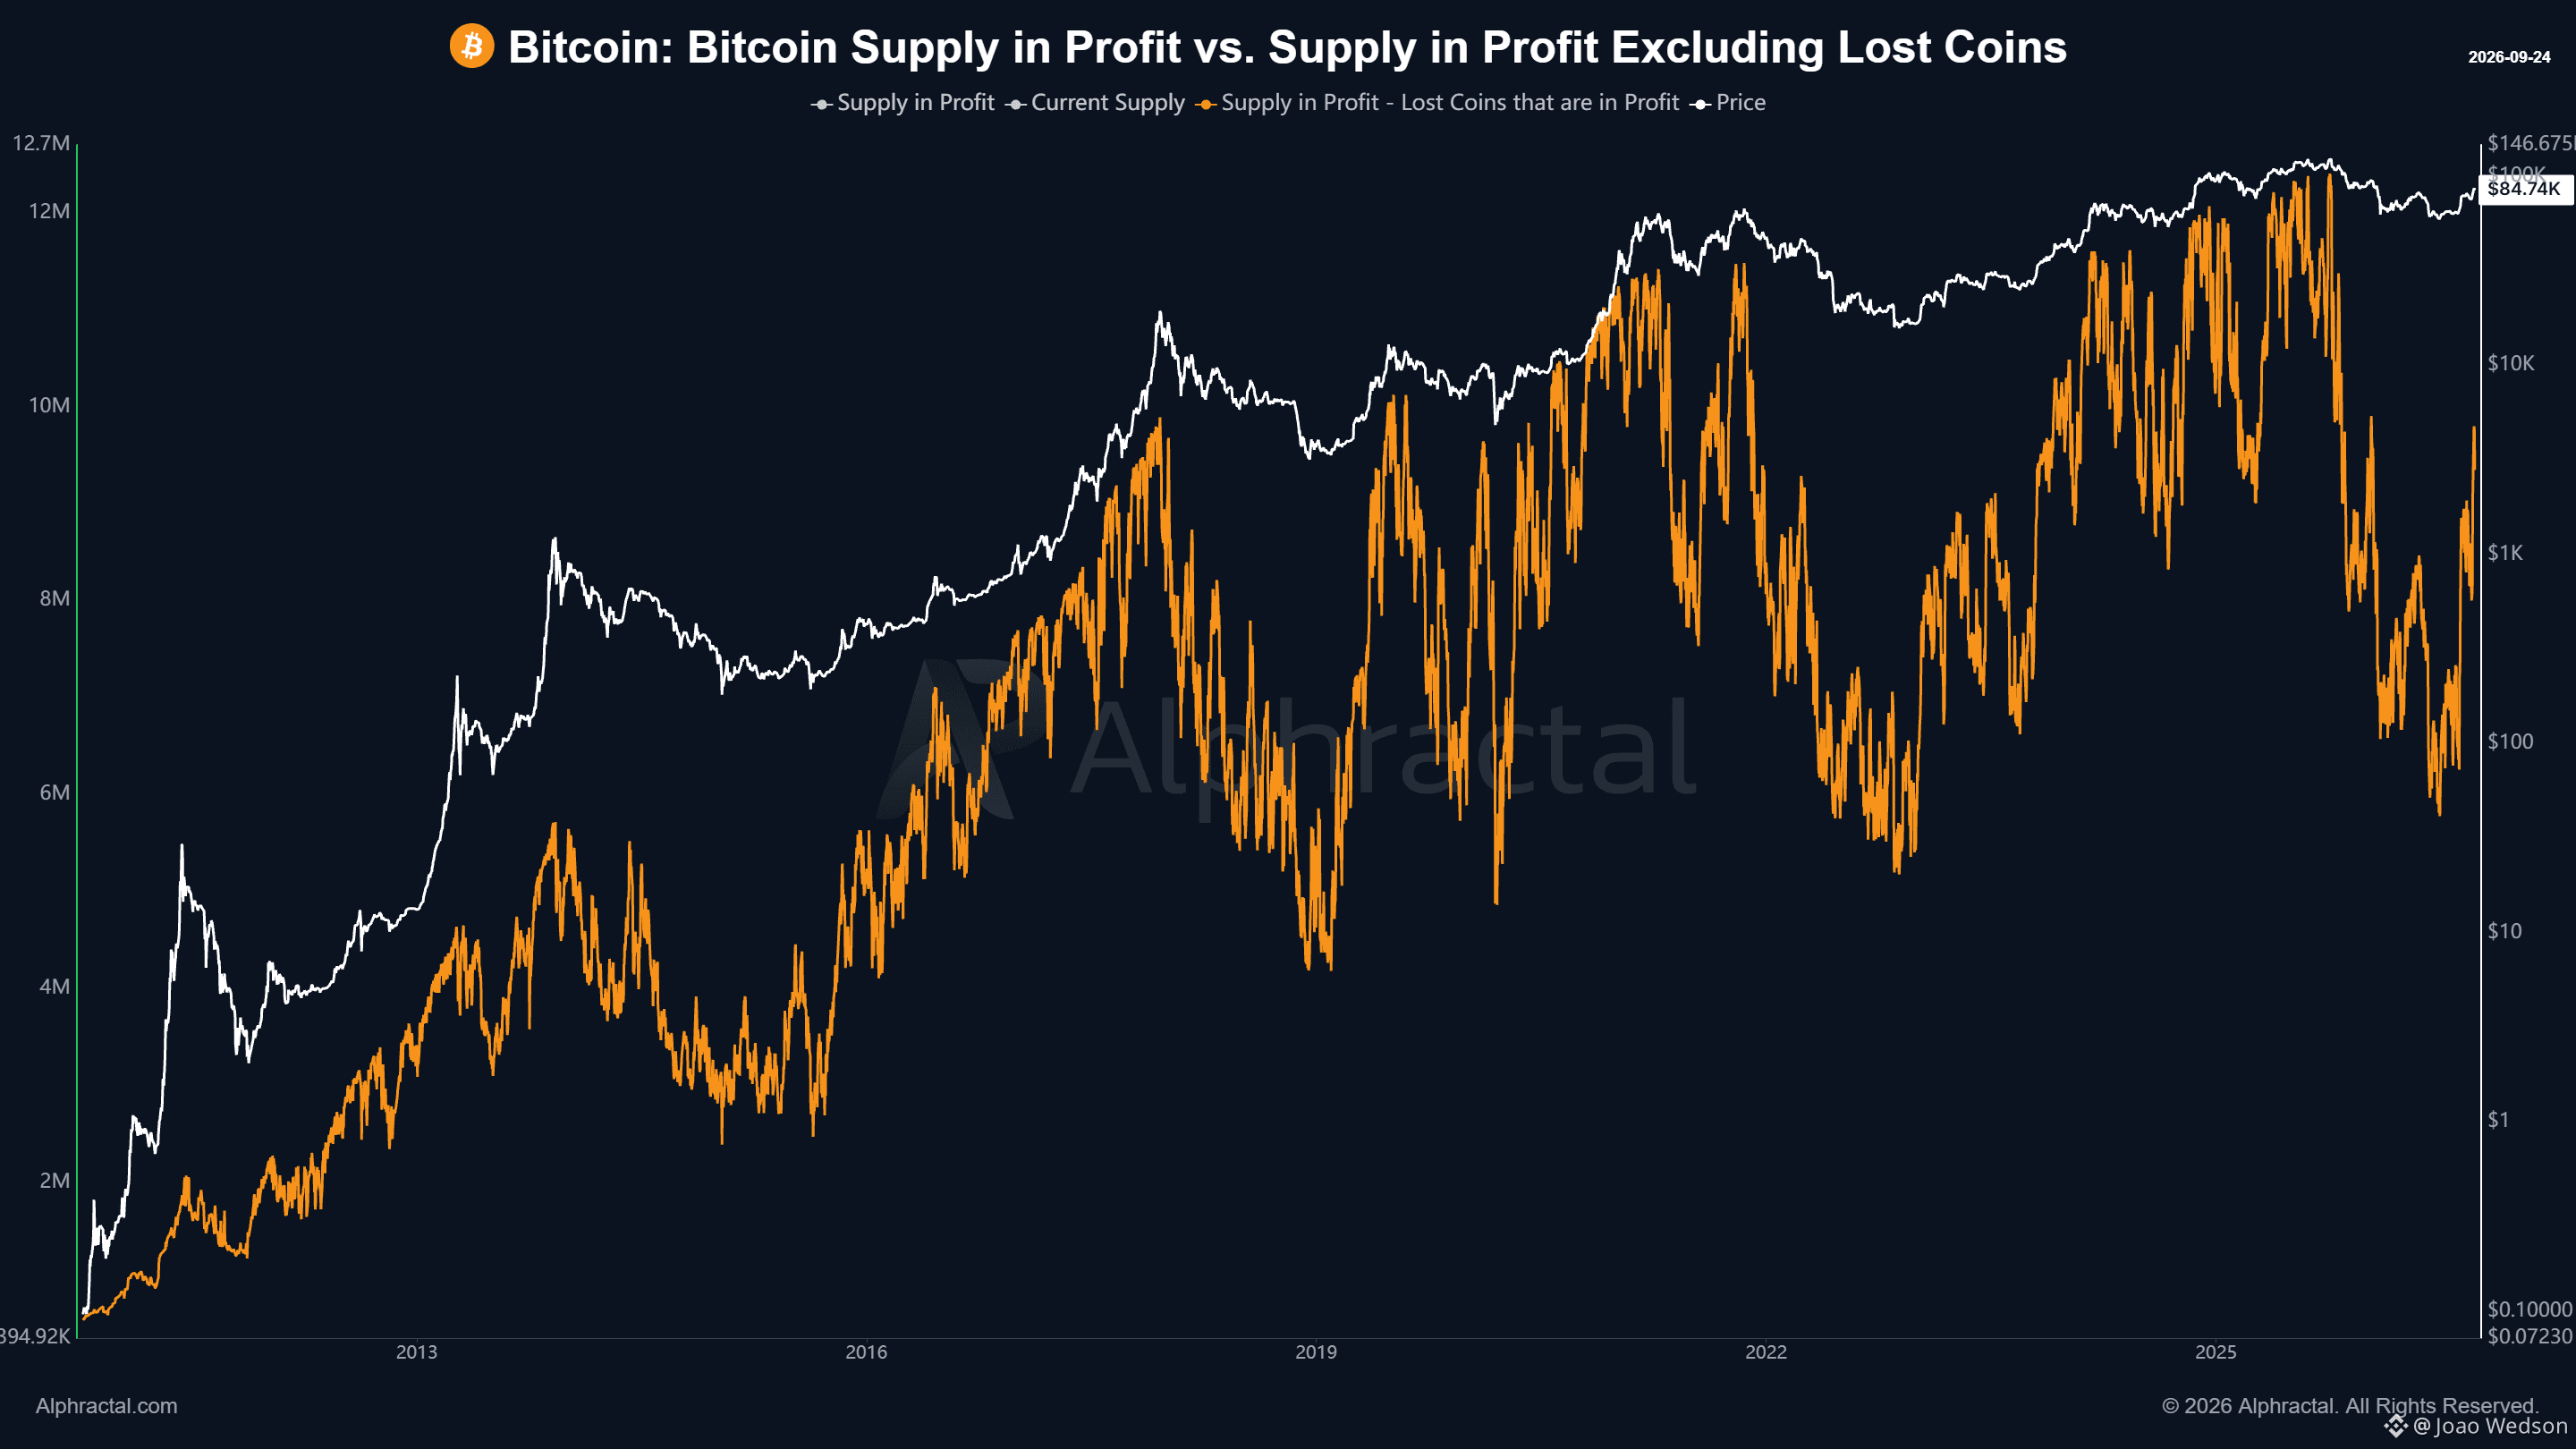
比特币拥有大量旧的、可能已遗失的币。这包括与中本聪(Satoshi Nakamoto)相关的币、早期矿工、失去钱包存取权限的使用者,以及多年来一直处于闲置状态的 $BTC。查看目前的数据: - 目前流通供给:20.1M BTC - 获利中的供给:14.8M BTC,占总供给的 73.6% - 获利中的已遗失币:5.5M BTC,占总供给的 27.4% - 排除已遗失币后的获利供给:9.35M BTC,占总供给的 46.5% 这意味著,目前被计入获利状态的所有 BTC 中,约 37% 可能来自被归类为遗失或在经济上处于非活跃状态的币。当我们将它们移除后,整体图像会大幅改变。以「获利中的传统供给」来看,几乎 74% 的比特币供给处于获利状态。但在排除这些已遗失币之后,真正代表获利中的供给仅约占总供给的 46.5%。这可能让我们对供给中哪些部分才与市场的经济面真正相关,产生非常不同的看法。
比特币拥有大量旧的、可能已遗失的币。这包括与中本聪(Satoshi Nakamoto)相关的币、早期矿工、失去钱包存取权限的使用者,以及多年来一直处于闲置状态的 $BTC。查看目前的数据: - 目前流通供给:20.1M BTC - 获利中的供给:14.8M BTC,占总供给的 73.6% - 获利中的已遗失币:5.5M BTC,占总供给的 27.4% - 排除已遗失币后的获利供给:9.35M BTC,占总供给的 46.5% 这意味著,目前被计入获利状态的所有 BTC 中,约 37% 可能来自被归类为遗失或在经济上处于非活跃状态的币。当我们将它们移除后,整体图像会大幅改变。以「获利中的传统供给」来看,几乎 74% 的比特币供给处于获利状态。但在排除这些已遗失币之后,真正代表获利中的供给仅约占总供给的 46.5%。这可能让我们对供给中哪些部分才与市场的经济面真正相关,产生非常不同的看法。
61
·
--
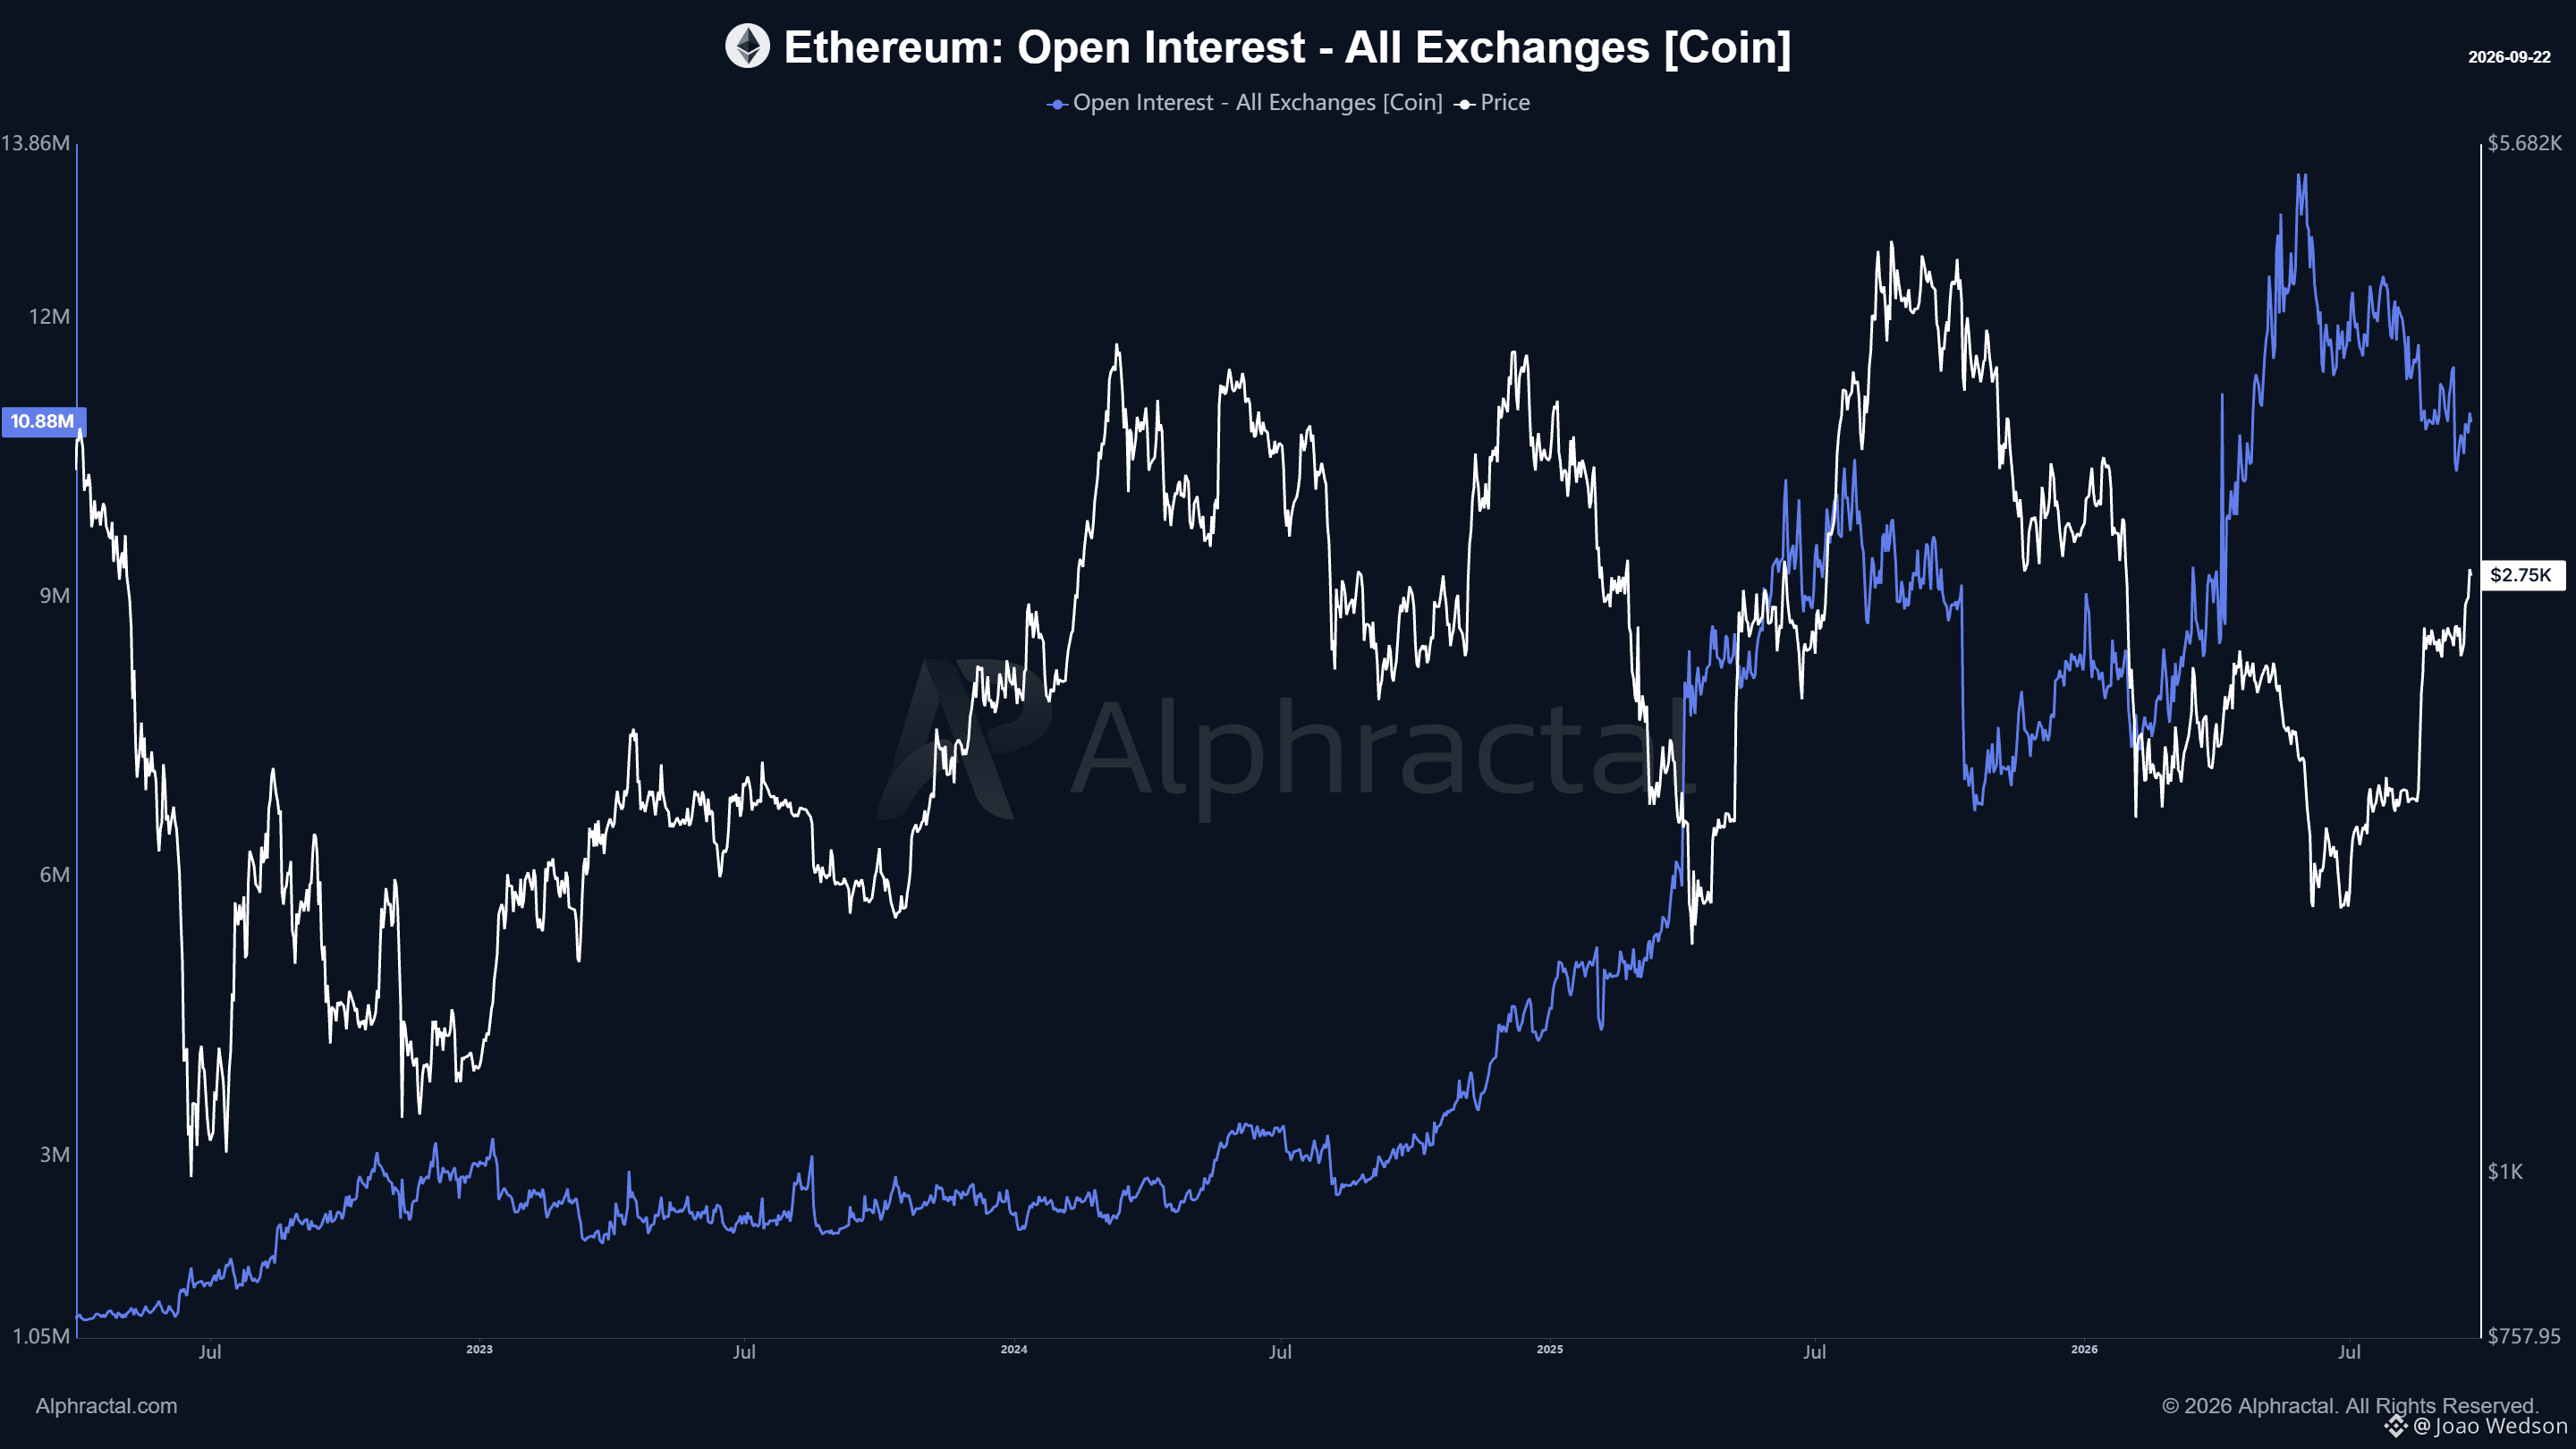
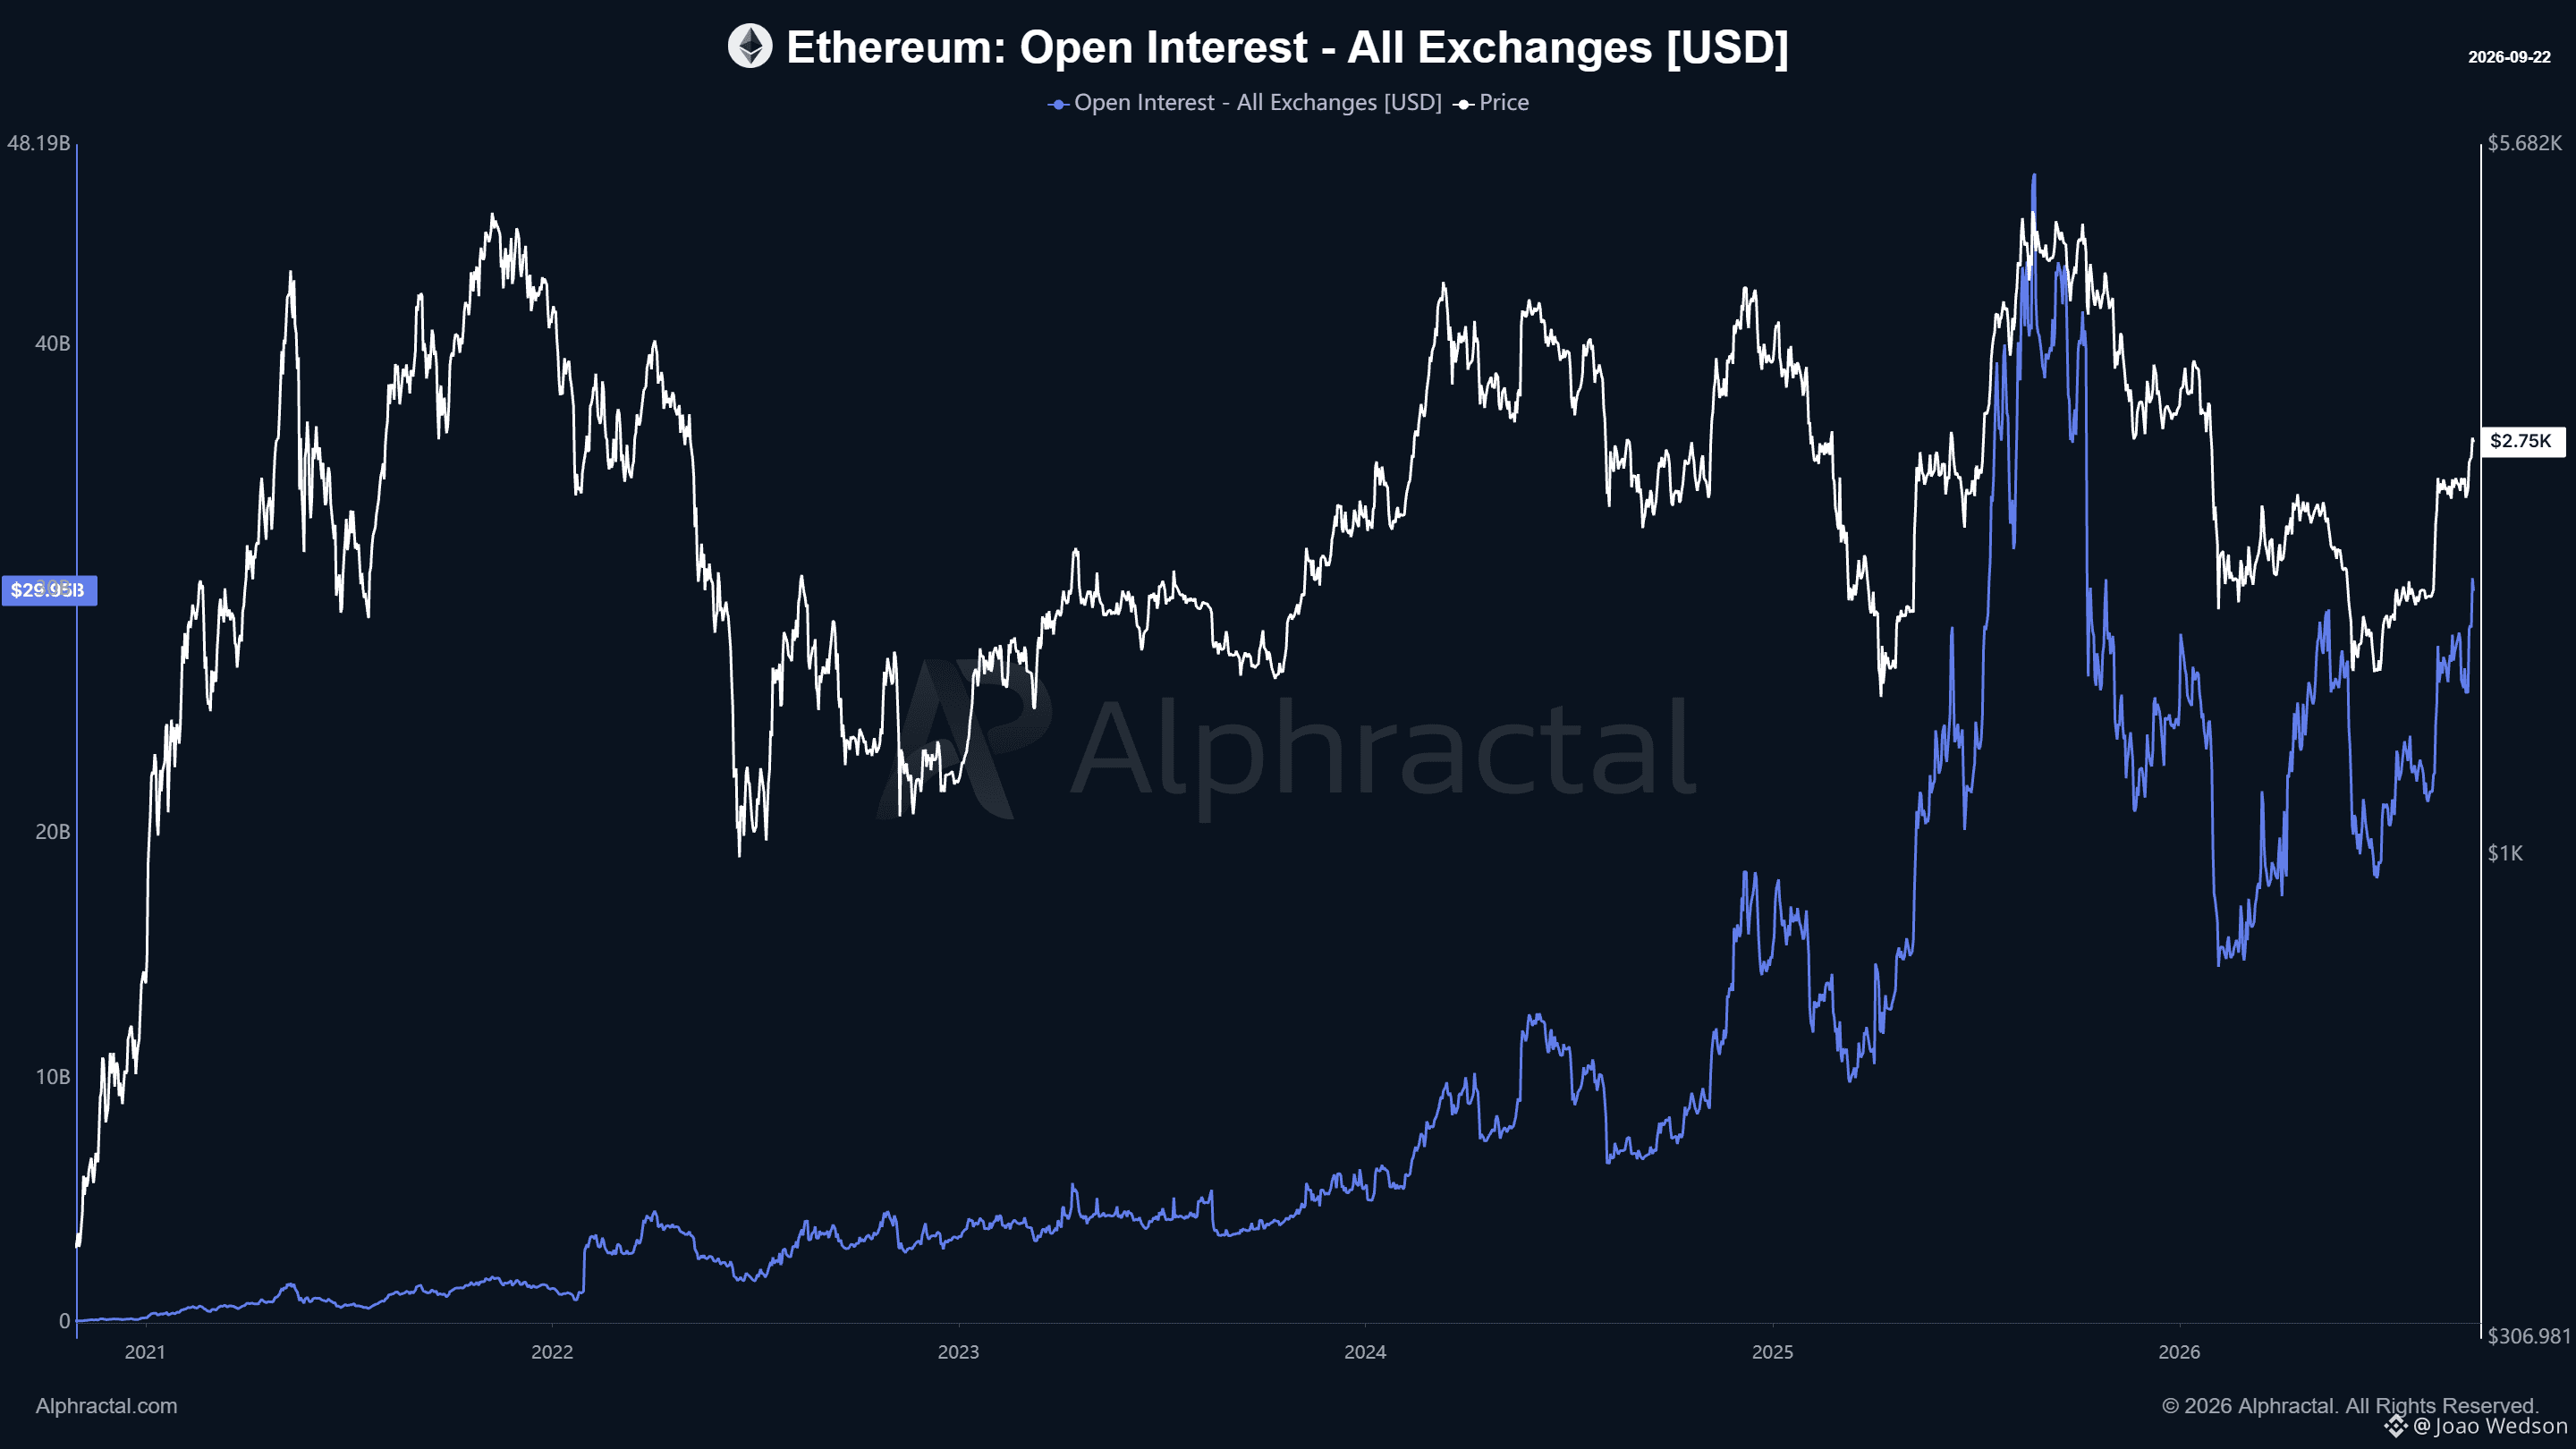
以太坊未平仓量(Open Interest)现已首次自 2025 年 10 月以来达到 300 亿美元,显示衍生品市场曝险明显上升。
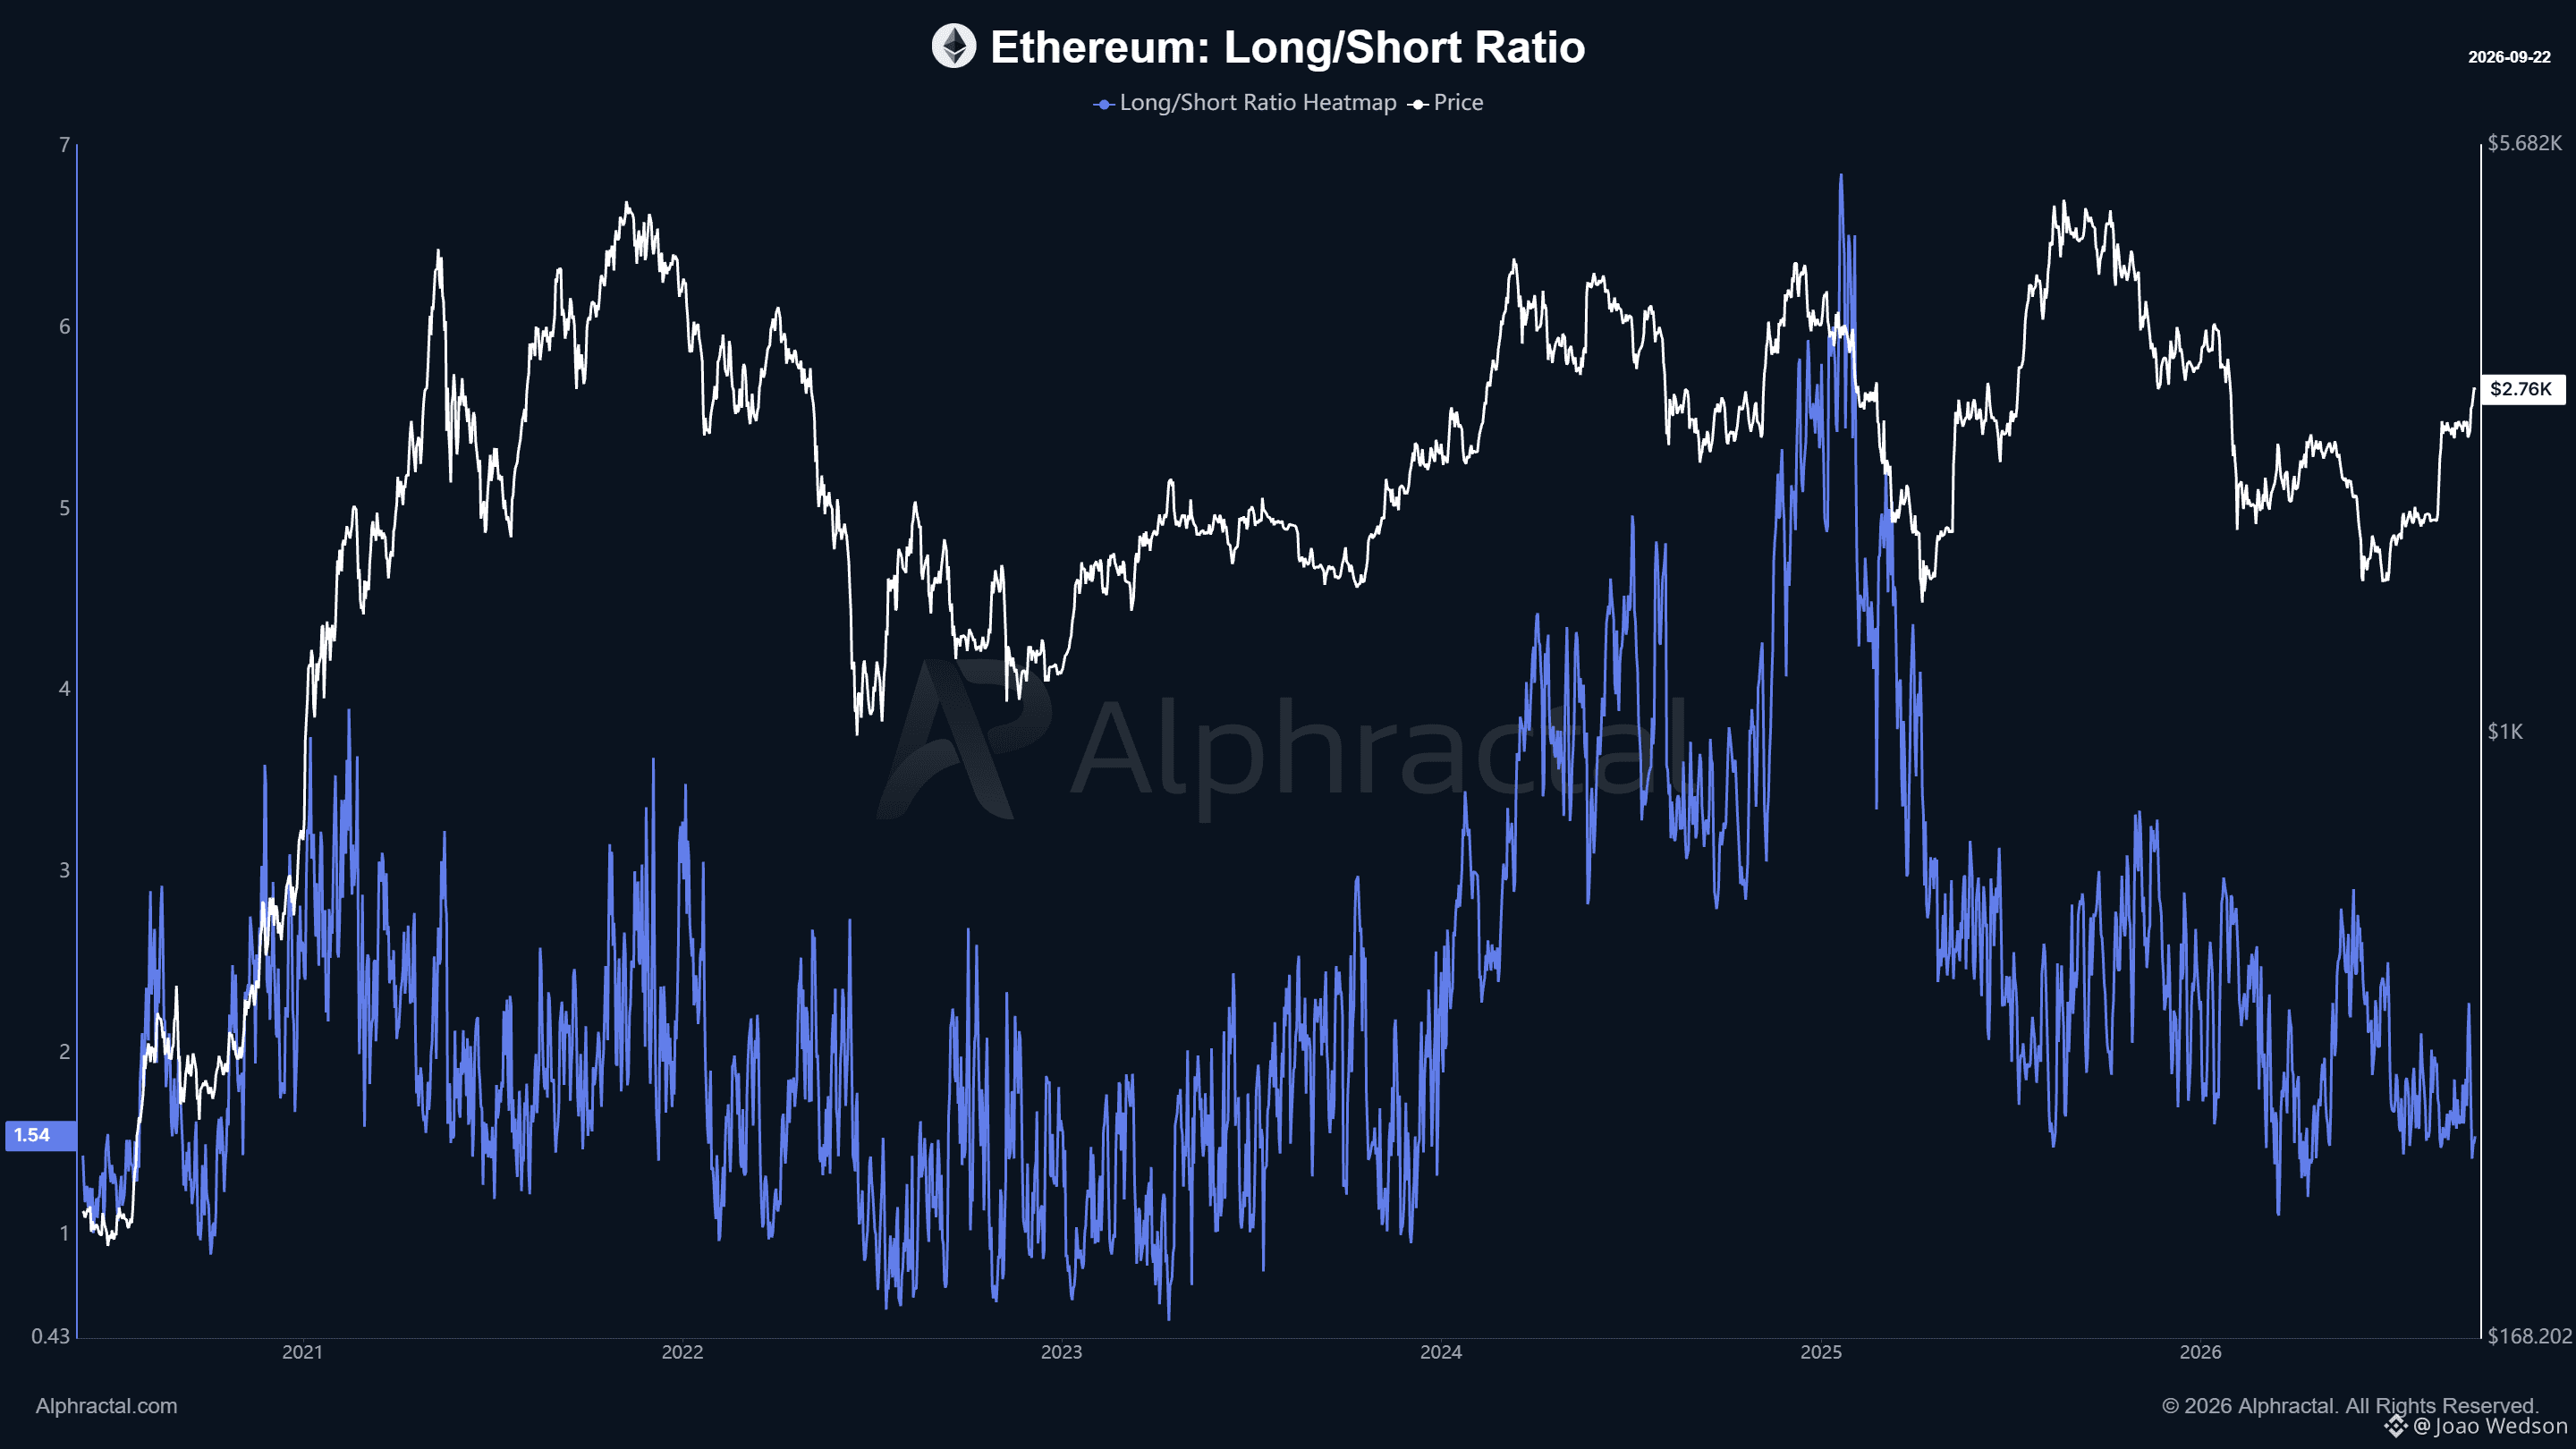
以 ETH 计算,这代表**跨交易所的未平仓部位接近 1200 万 $ETH**。同时,Binance、Bybit、Bitget、HTX 和 Gate 的平均多空比(Long/Short Ratio)目前为 **1.54**,显示明确的多头(Long)仓位占优。
这形成了一个需要密切留意的重要失衡:若 ETH 持续走高,将有更少的部位暴露在清算风险中。但若价格大幅下跌,市场中杠杆多头的集中程度更高,可能会被迫平仓关闭。
杠杆越高,潜在波动性也就越大。
以太坊未平仓量(Open Interest)现已首次自 2025 年 10 月以来达到 300 亿美元,显示衍生品市场曝险明显上升。
以 ETH 计算,这代表**跨交易所的未平仓部位接近 1200 万 $ETH**。同时,Binance、Bybit、Bitget、HTX 和 Gate 的平均多空比(Long/Short Ratio)目前为 **1.54**,显示明确的多头(Long)仓位占优。
这形成了一个需要密切留意的重要失衡:若 ETH 持续走高,将有更少的部位暴露在清算风险中。但若价格大幅下跌,市场中杠杆多头的集中程度更高,可能会被迫平仓关闭。
杠杆越高,潜在波动性也就越大。
以 ETH 计算,这代表**跨交易所的未平仓部位接近 1200 万 $ETH**。同时,Binance、Bybit、Bitget、HTX 和 Gate 的平均多空比(Long/Short Ratio)目前为 **1.54**,显示明确的多头(Long)仓位占优。
这形成了一个需要密切留意的重要失衡:若 ETH 持续走高,将有更少的部位暴露在清算风险中。但若价格大幅下跌,市场中杠杆多头的集中程度更高,可能会被迫平仓关闭。
杠杆越高,潜在波动性也就越大。
47
·
--
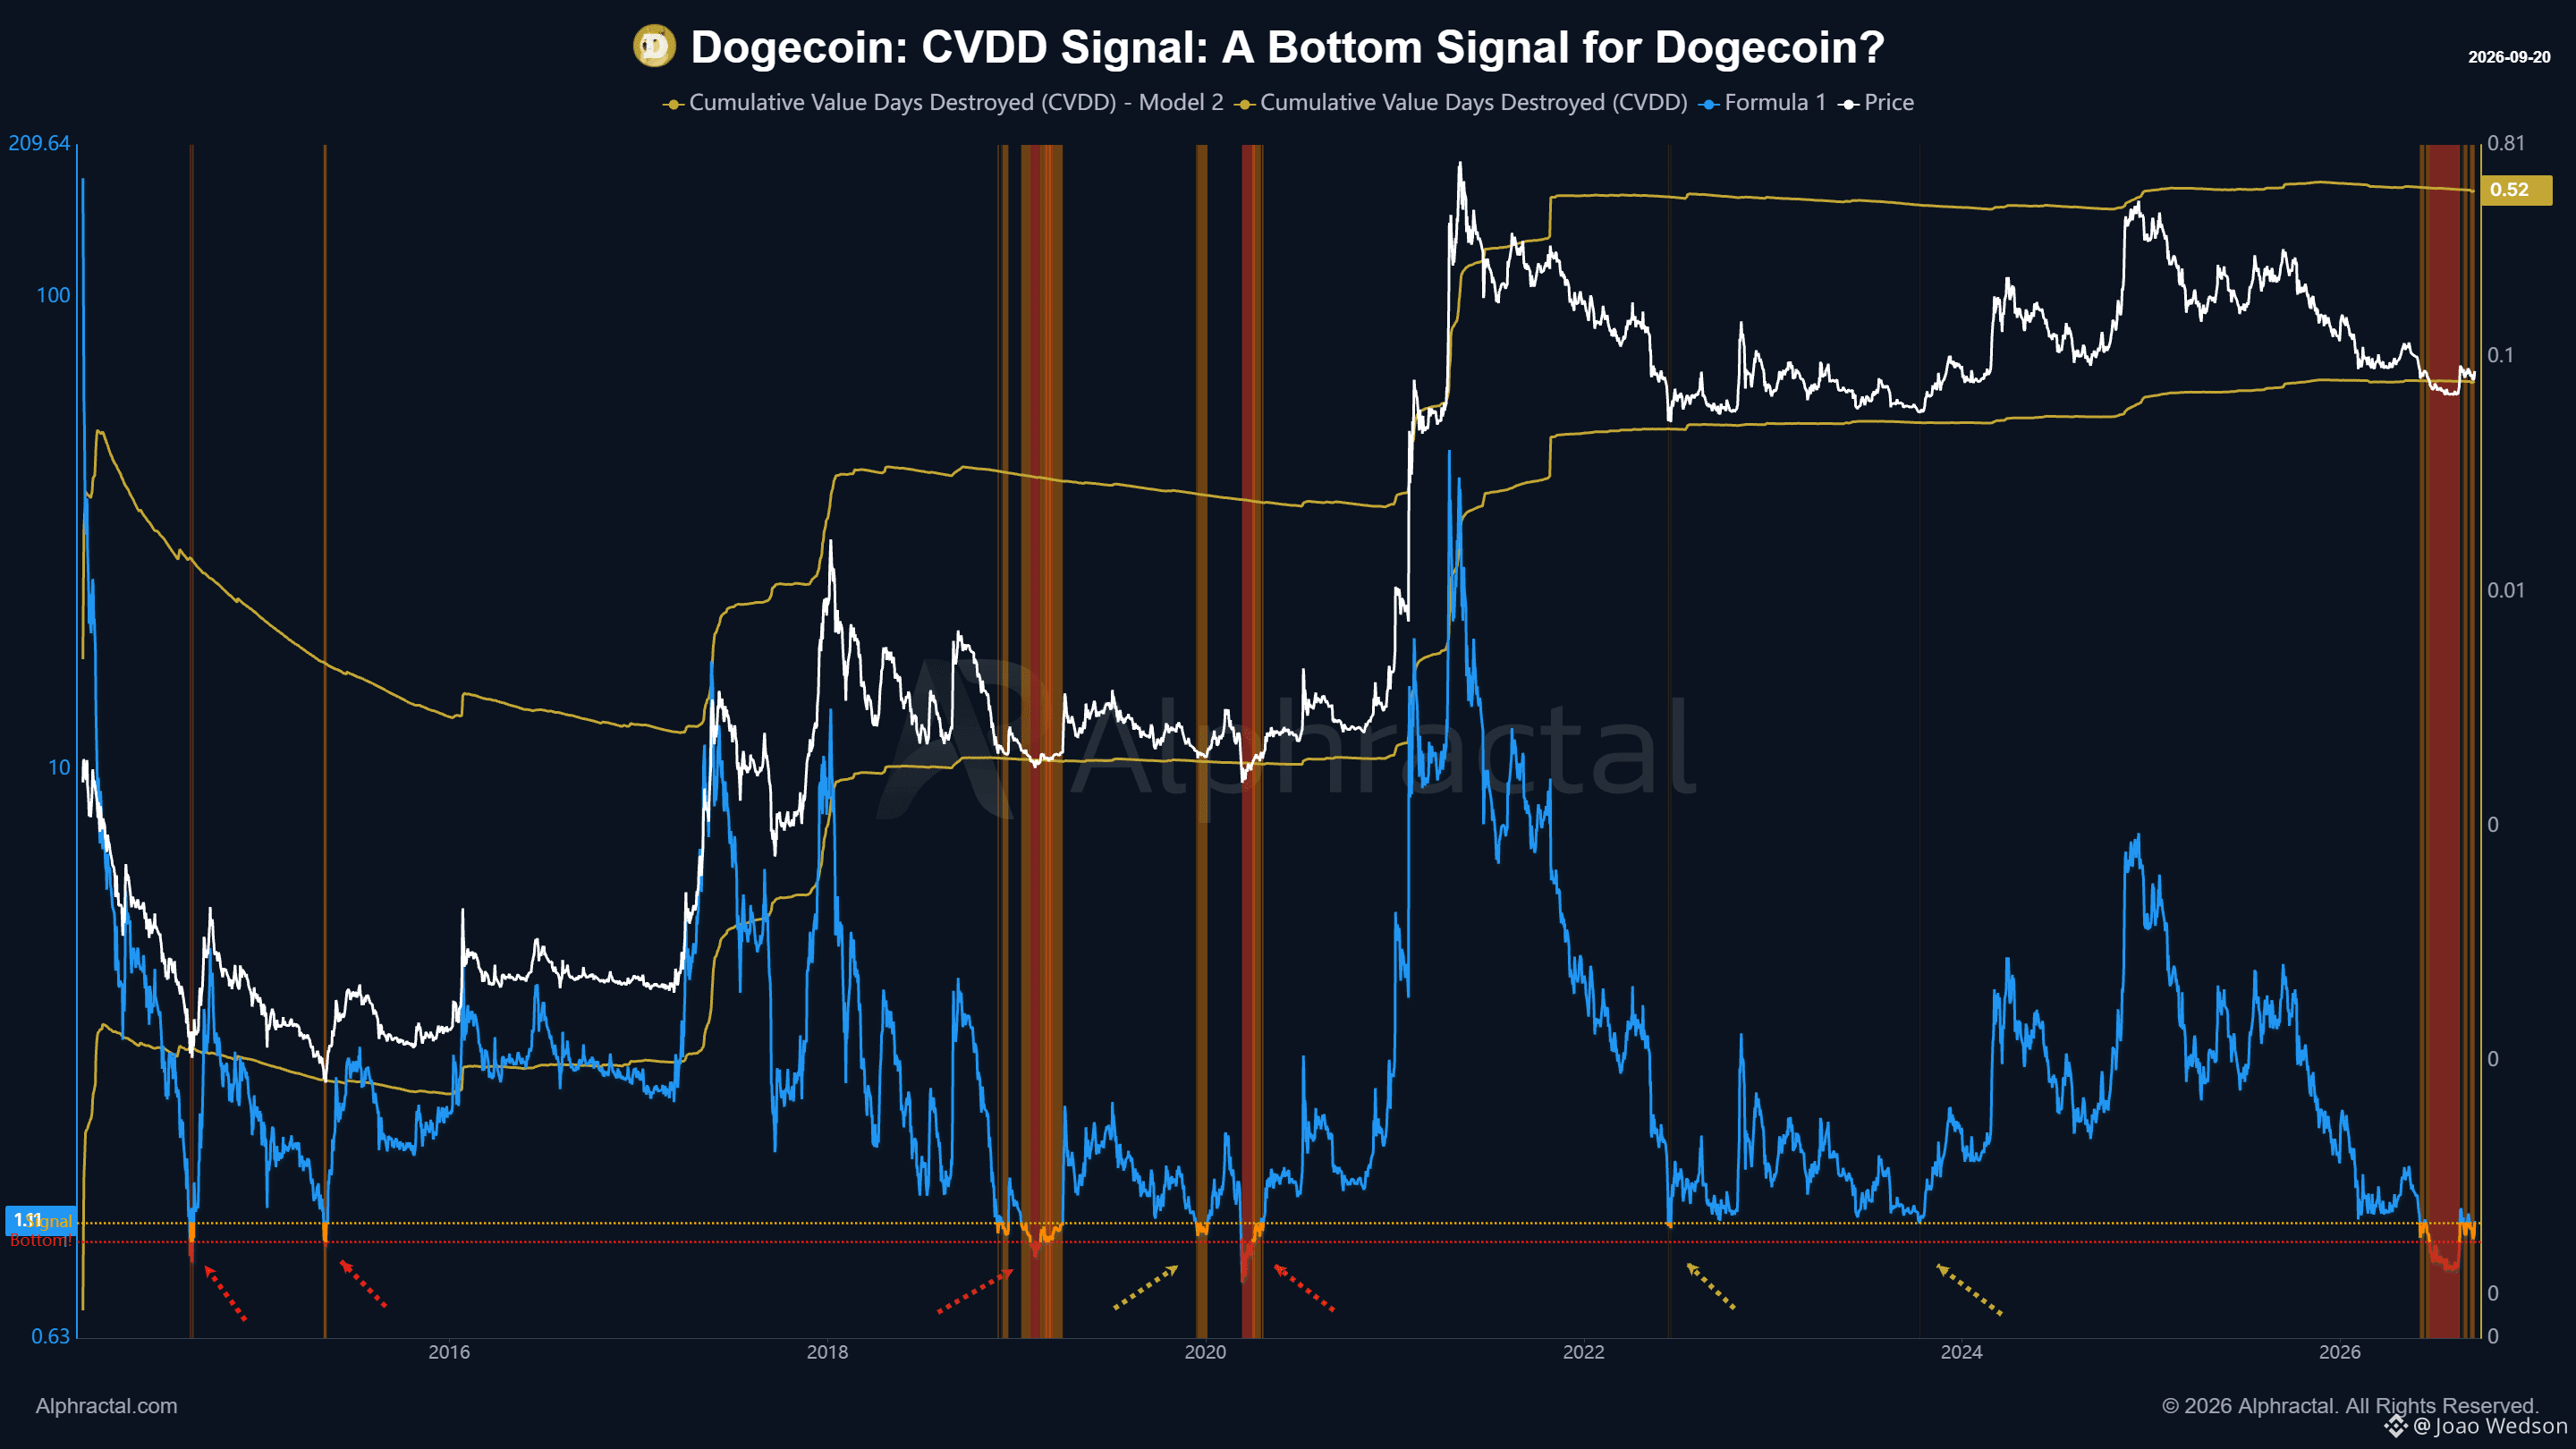
今年六月,我分享了这个狗狗币(Dogecoin)链上讯号,凸显了一个历史上常与重大市场底部相关联的区域。没多久之后,$DOGE 就找到了它的底部。今天,我们有更新后的图表,再次展示了这种分析的价值。也正是在这里,链上资料把加密资产分析提升到另一个层次。在股票、指数以及许多其他市场中,价格之下发生的大多数事情仍是看不见的。在公开区块链上,我们能看到币的流动、持有人行为、损益实现、币龄、资金流向、网路活动,以及许多其他变数。价格呈现的是结果。链上资料则帮助我们理解其背后正在发生什么。而当这些资讯被转化为指标、模型与讯号时,我们就能辨识出某些结构——在传统市场中,因为缺乏同等层级的透明度,这些结构根本不存在。这也是区块链带来的最重要的 Alpha 来源之一。And Alphractal 装载了这类指标。
今年六月,我分享了这个狗狗币(Dogecoin)链上讯号,凸显了一个历史上常与重大市场底部相关联的区域。没多久之后,$DOGE 就找到了它的底部。今天,我们有更新后的图表,再次展示了这种分析的价值。也正是在这里,链上资料把加密资产分析提升到另一个层次。在股票、指数以及许多其他市场中,价格之下发生的大多数事情仍是看不见的。在公开区块链上,我们能看到币的流动、持有人行为、损益实现、币龄、资金流向、网路活动,以及许多其他变数。价格呈现的是结果。链上资料则帮助我们理解其背后正在发生什么。而当这些资讯被转化为指标、模型与讯号时,我们就能辨识出某些结构——在传统市场中,因为缺乏同等层级的透明度,这些结构根本不存在。这也是区块链带来的最重要的 Alpha 来源之一。And Alphractal 装载了这类指标。
66
·
--
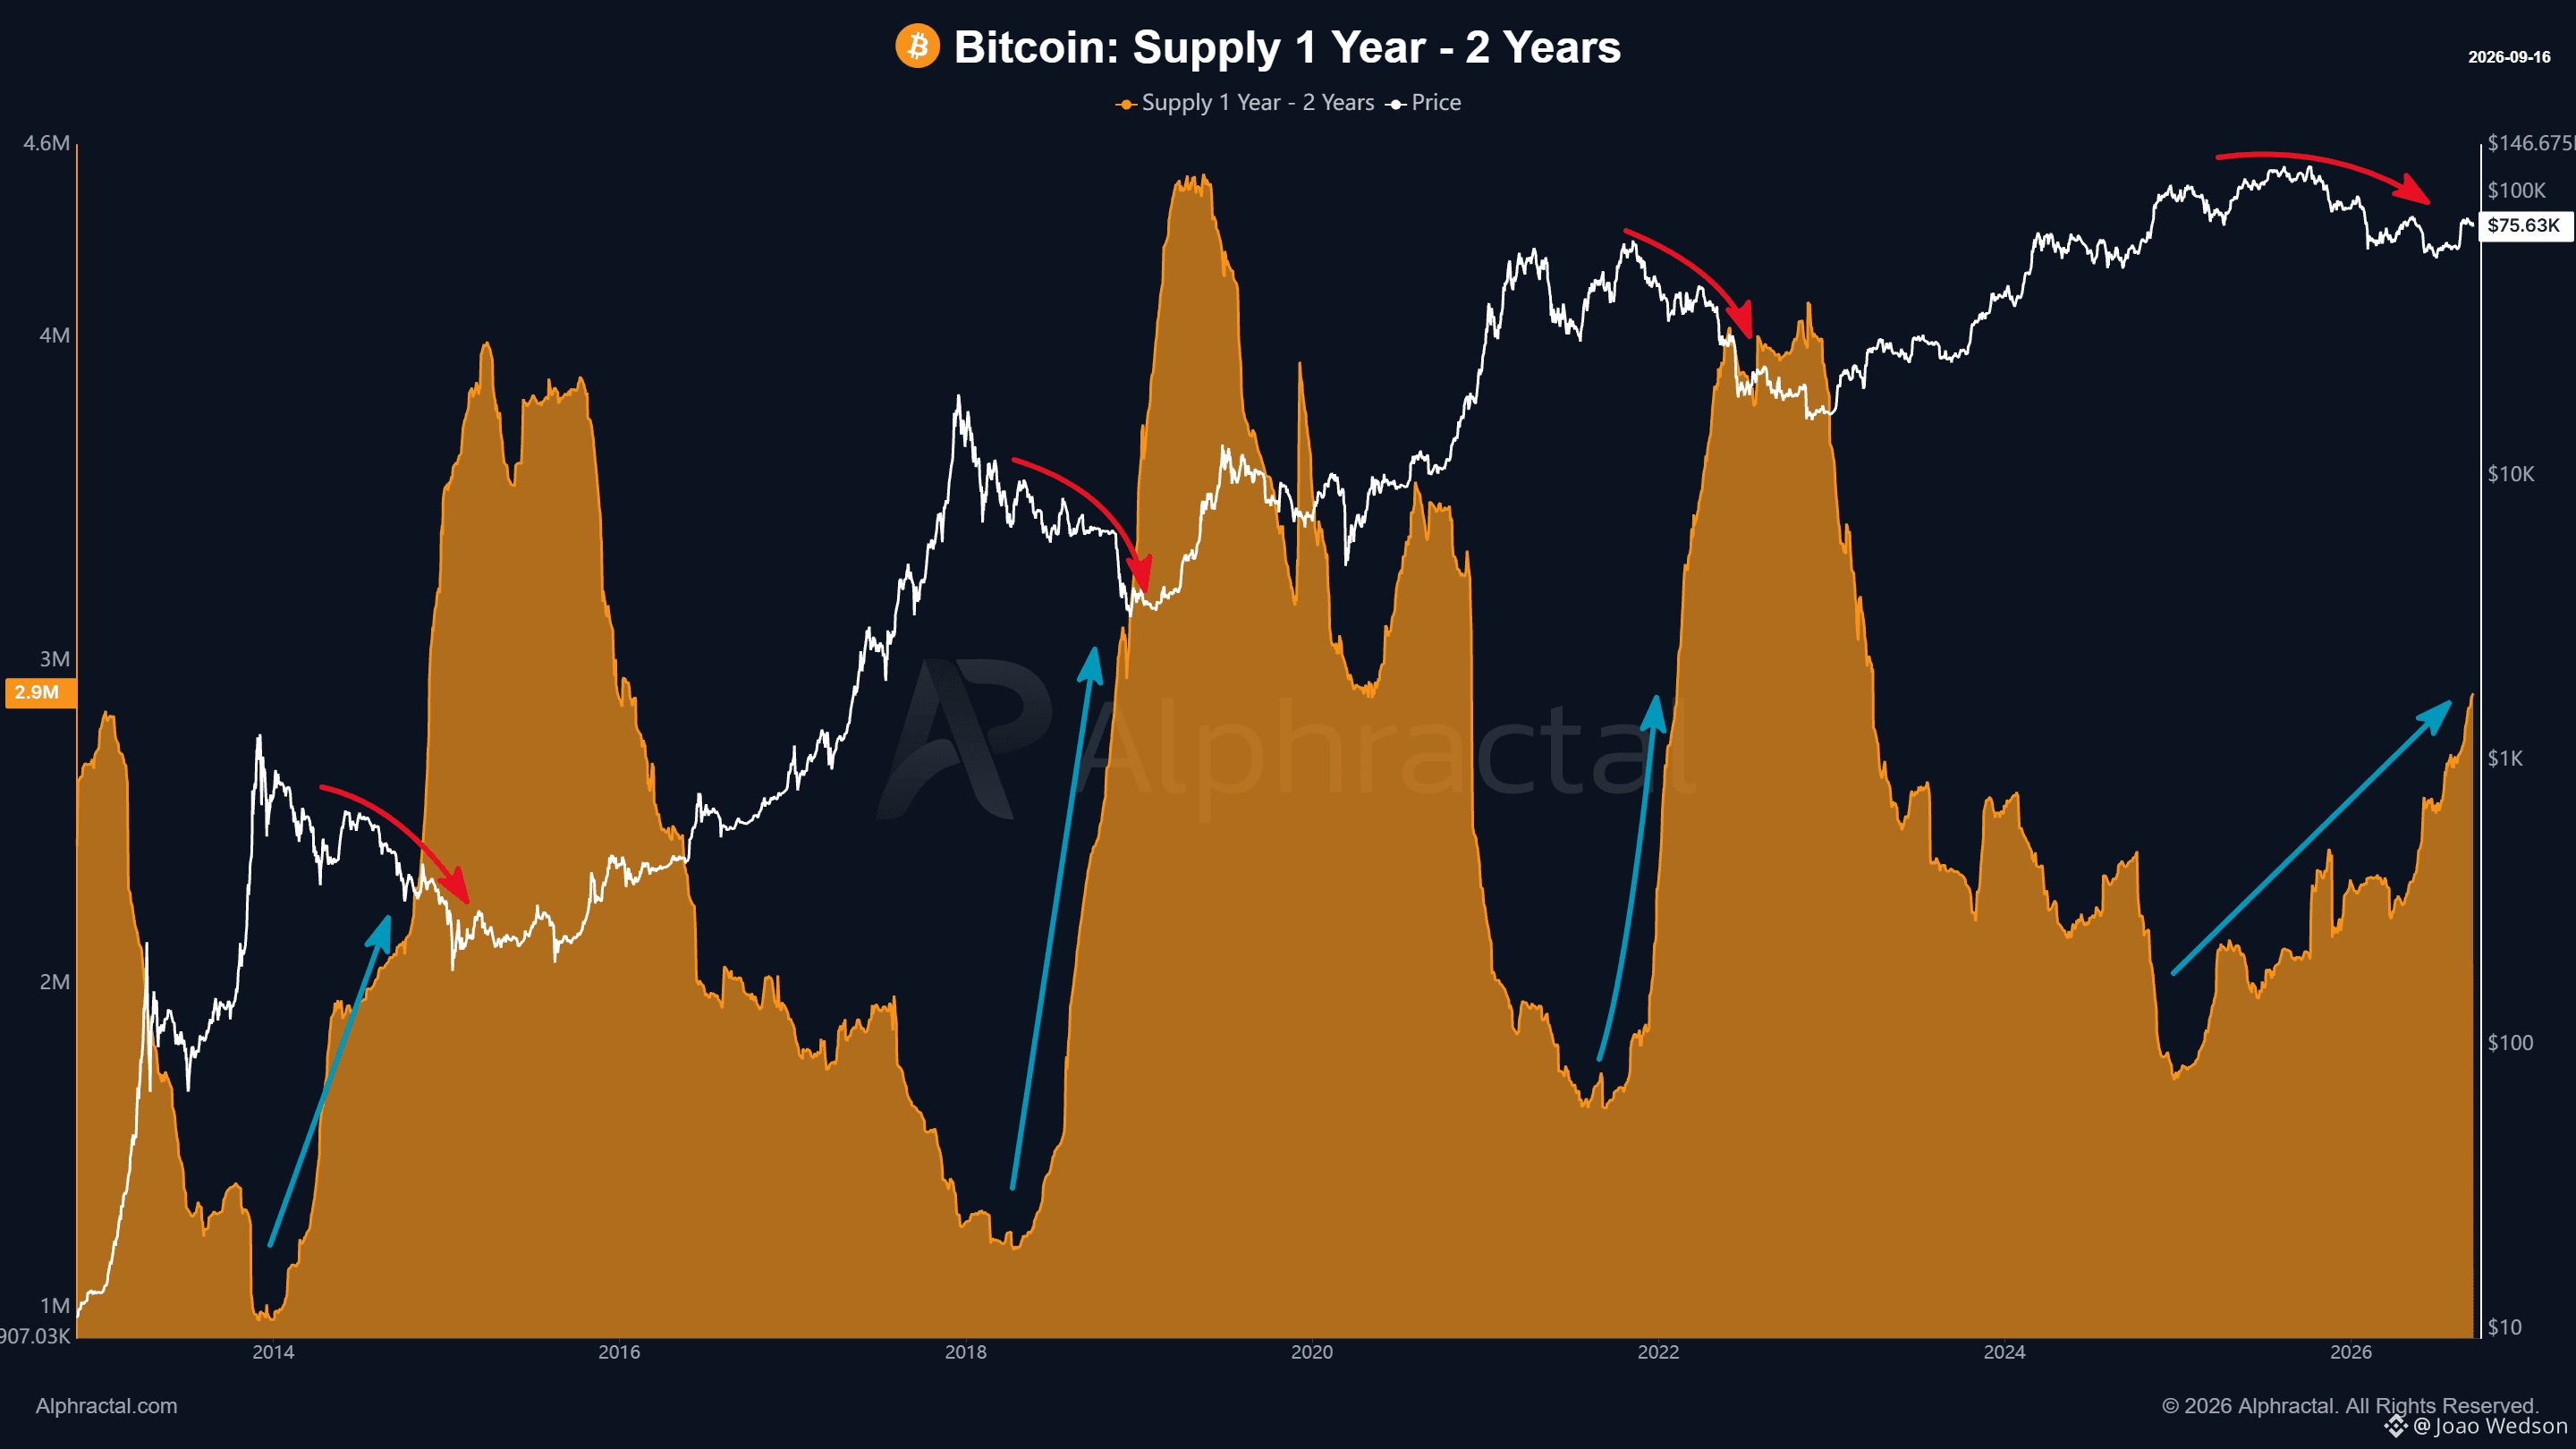
⚠️每当比特币的「1 到 2 年供应量」上升时,价格往往会走低。这是一个在链上分析中经典且引人入胜的模式。历史上,只有当这项指标开始下滑时,比特币才更常恢复更强的上行动能。作为中期持有者——大约持有 BTC 长达 3 年——通常会面临挑战。最强的信心似乎来自持有超过 4 年的人。那才是真正的长期持有者:他们能在多个市场周期中存活而不出售。$BTC
⚠️每当比特币的「1 到 2 年供应量」上升时,价格往往会走低。这是一个在链上分析中经典且引人入胜的模式。历史上,只有当这项指标开始下滑时,比特币才更常恢复更强的上行动能。作为中期持有者——大约持有 BTC 长达 3 年——通常会面临挑战。最强的信心似乎来自持有超过 4 年的人。那才是真正的长期持有者:他们能在多个市场周期中存活而不出售。$BTC
64
·
--
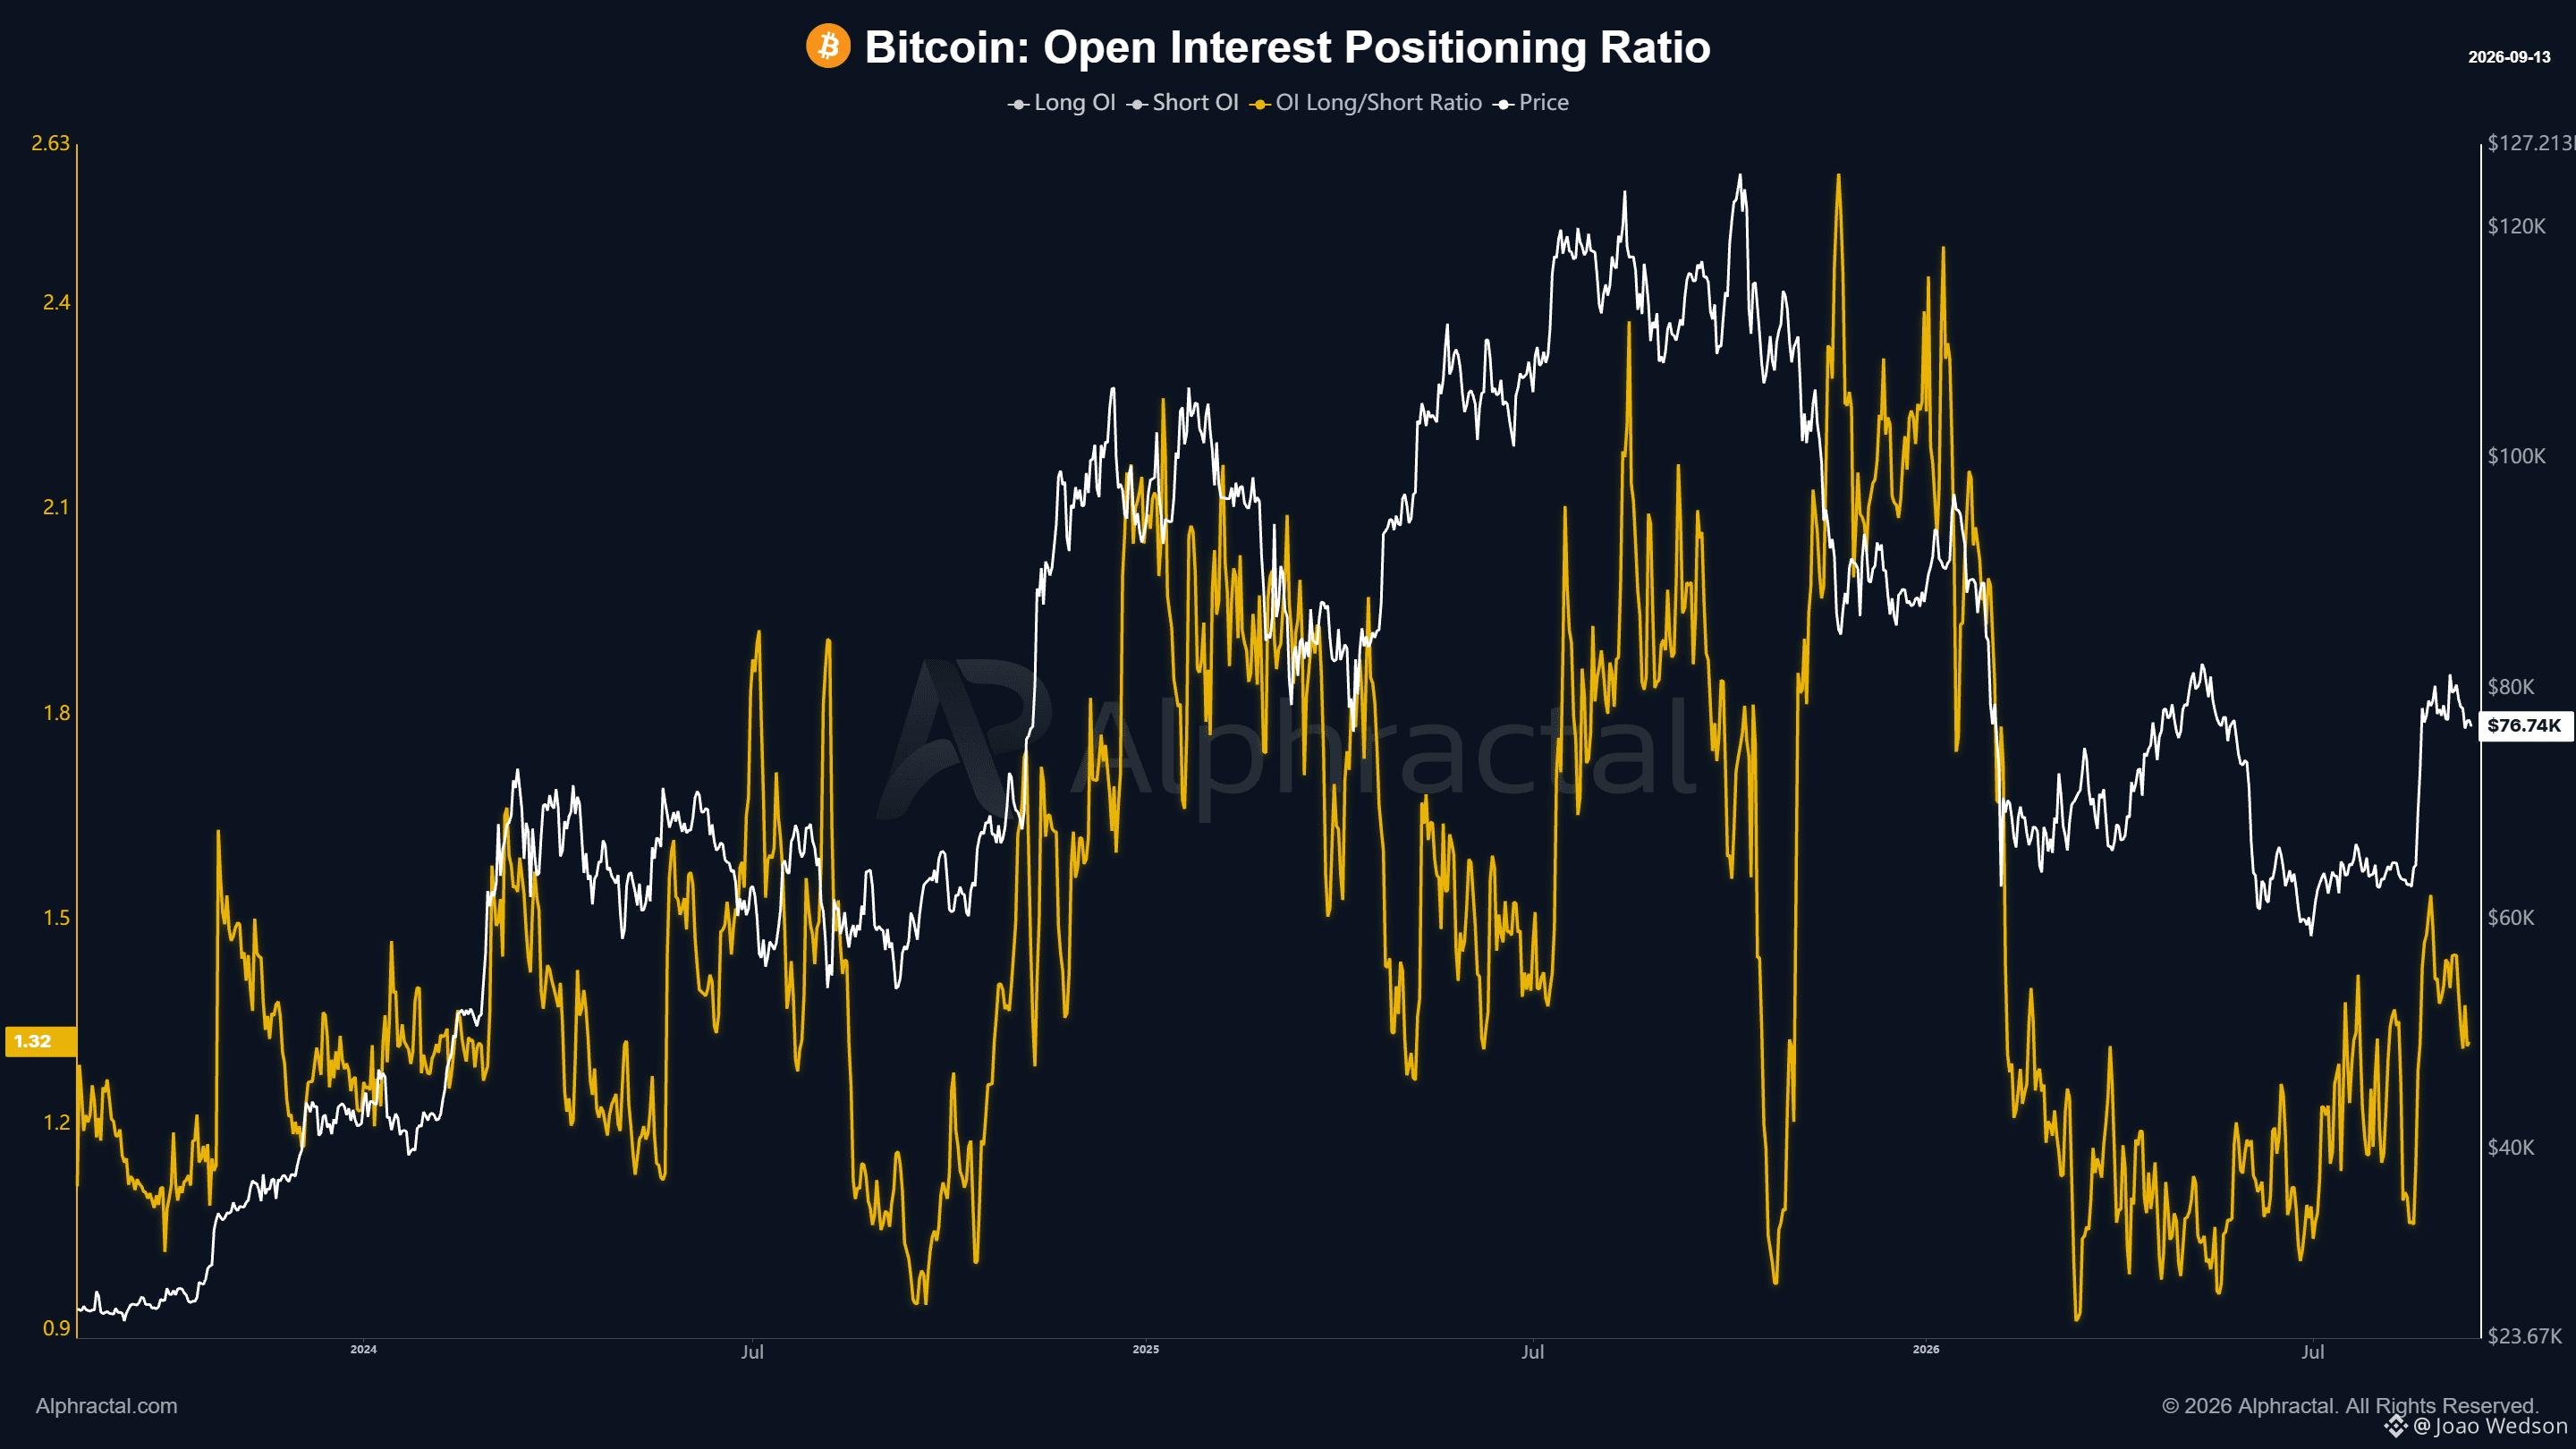
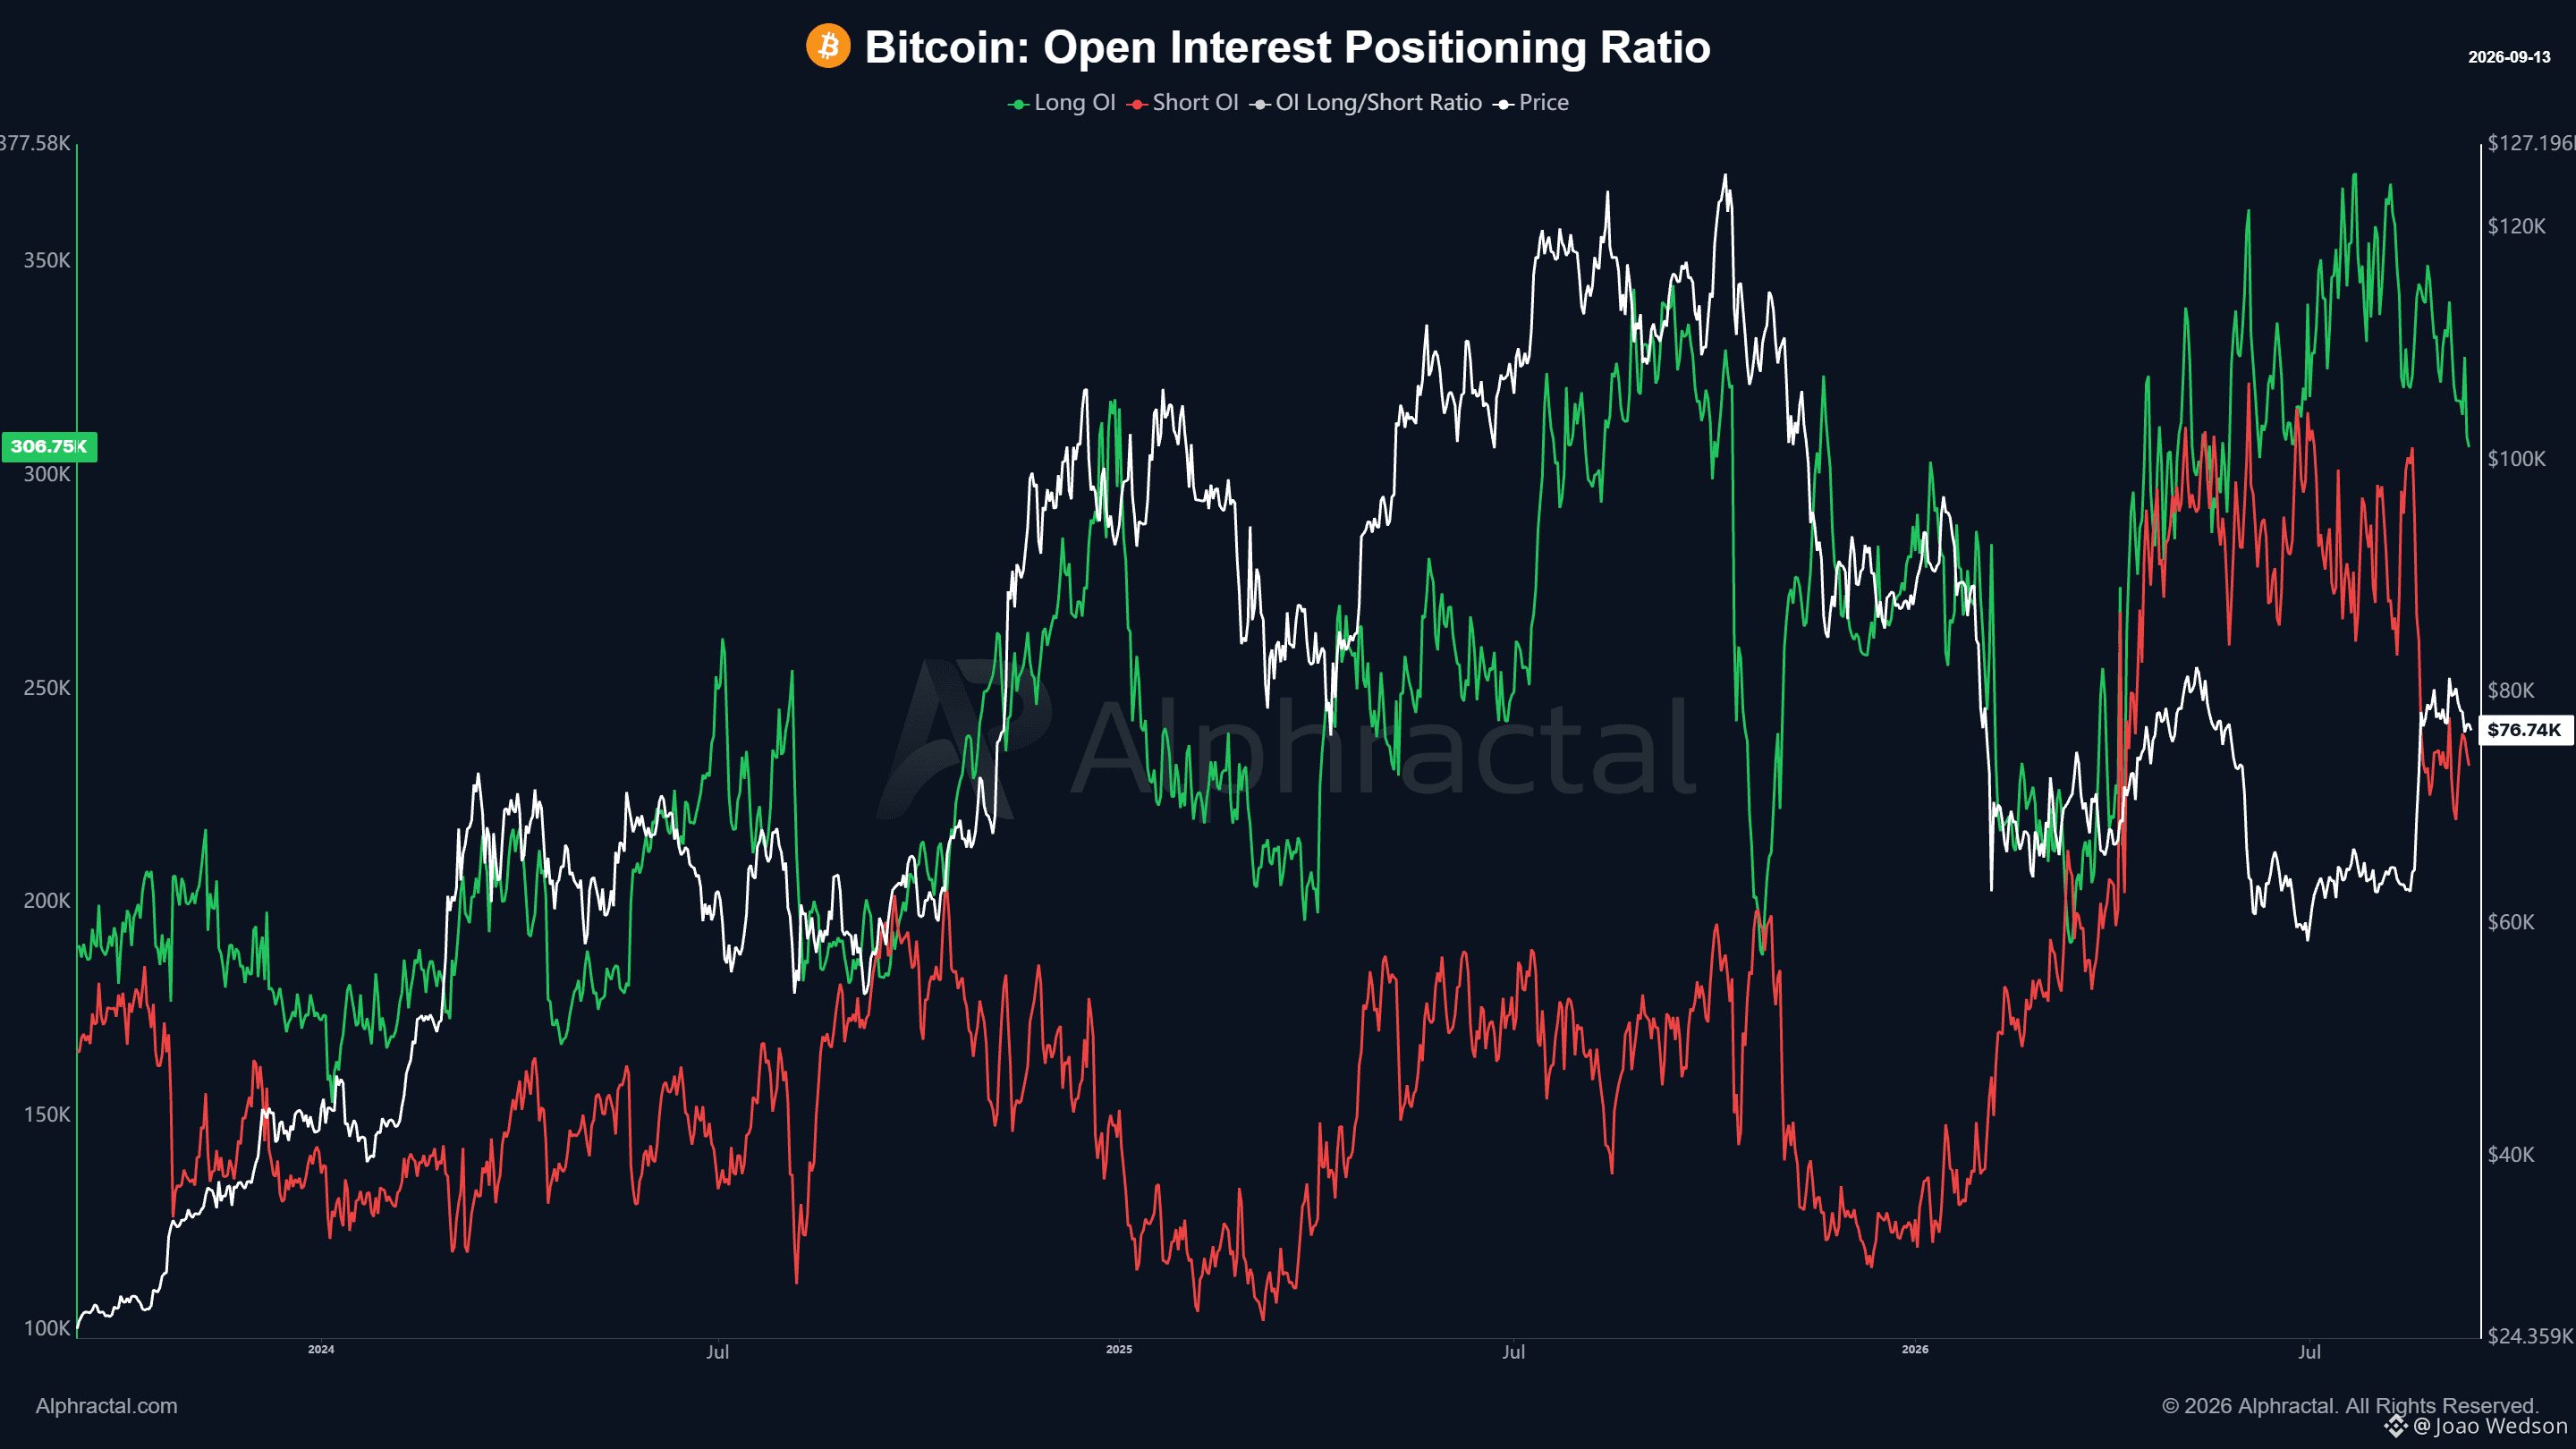
比特币多头和空头仓位正在再次在全市场走低。近期约有50K的$BTC多头仓位被平仓,这表明多头交易者累积的部分杠杆正在被削减。空头仓位也在下移,暗示整体曝险水平也在降低。即便如此,OI多空比仍保持在1.32的正值区间,意味着在多家交易所中,多头依然占据明显优势。市场的杠杆程度在下降,但仓位结构仍偏向多头一侧。
比特币多头和空头仓位正在再次在全市场走低。近期约有50K的$BTC多头仓位被平仓,这表明多头交易者累积的部分杠杆正在被削减。空头仓位也在下移,暗示整体曝险水平也在降低。即便如此,OI多空比仍保持在1.32的正值区间,意味着在多家交易所中,多头依然占据明显优势。市场的杠杆程度在下降,但仓位结构仍偏向多头一侧。
59
·
--
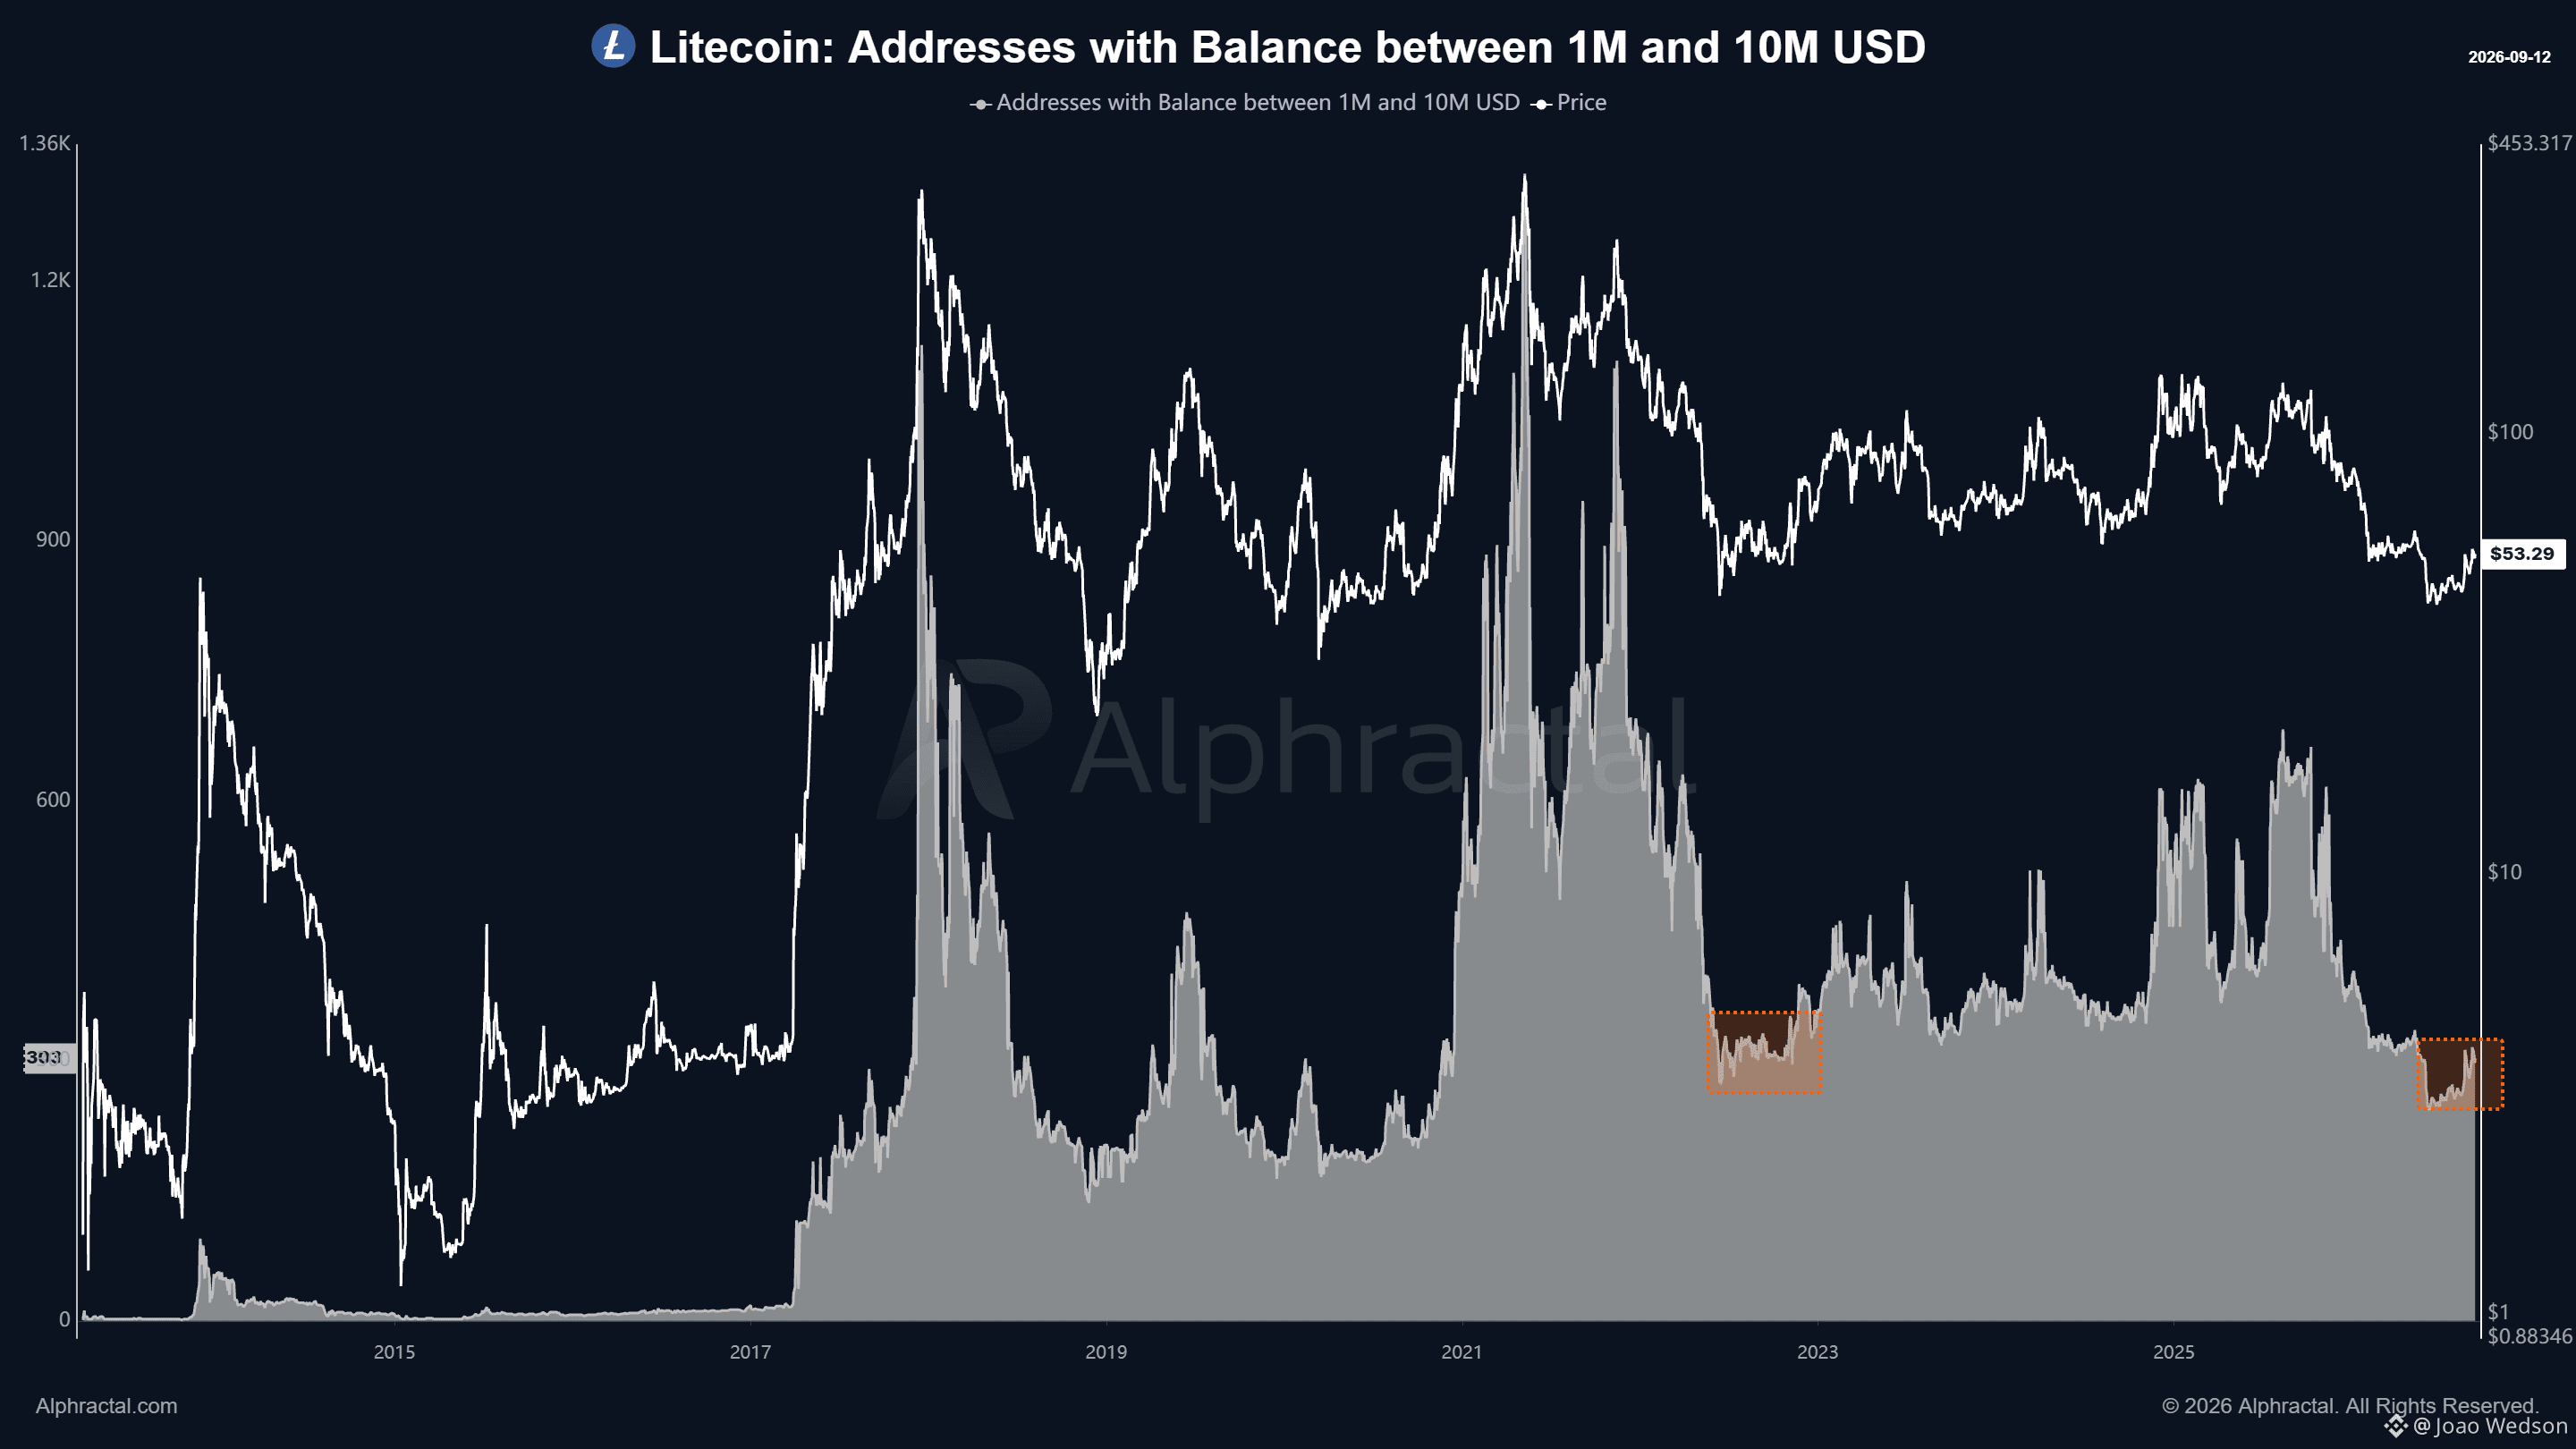
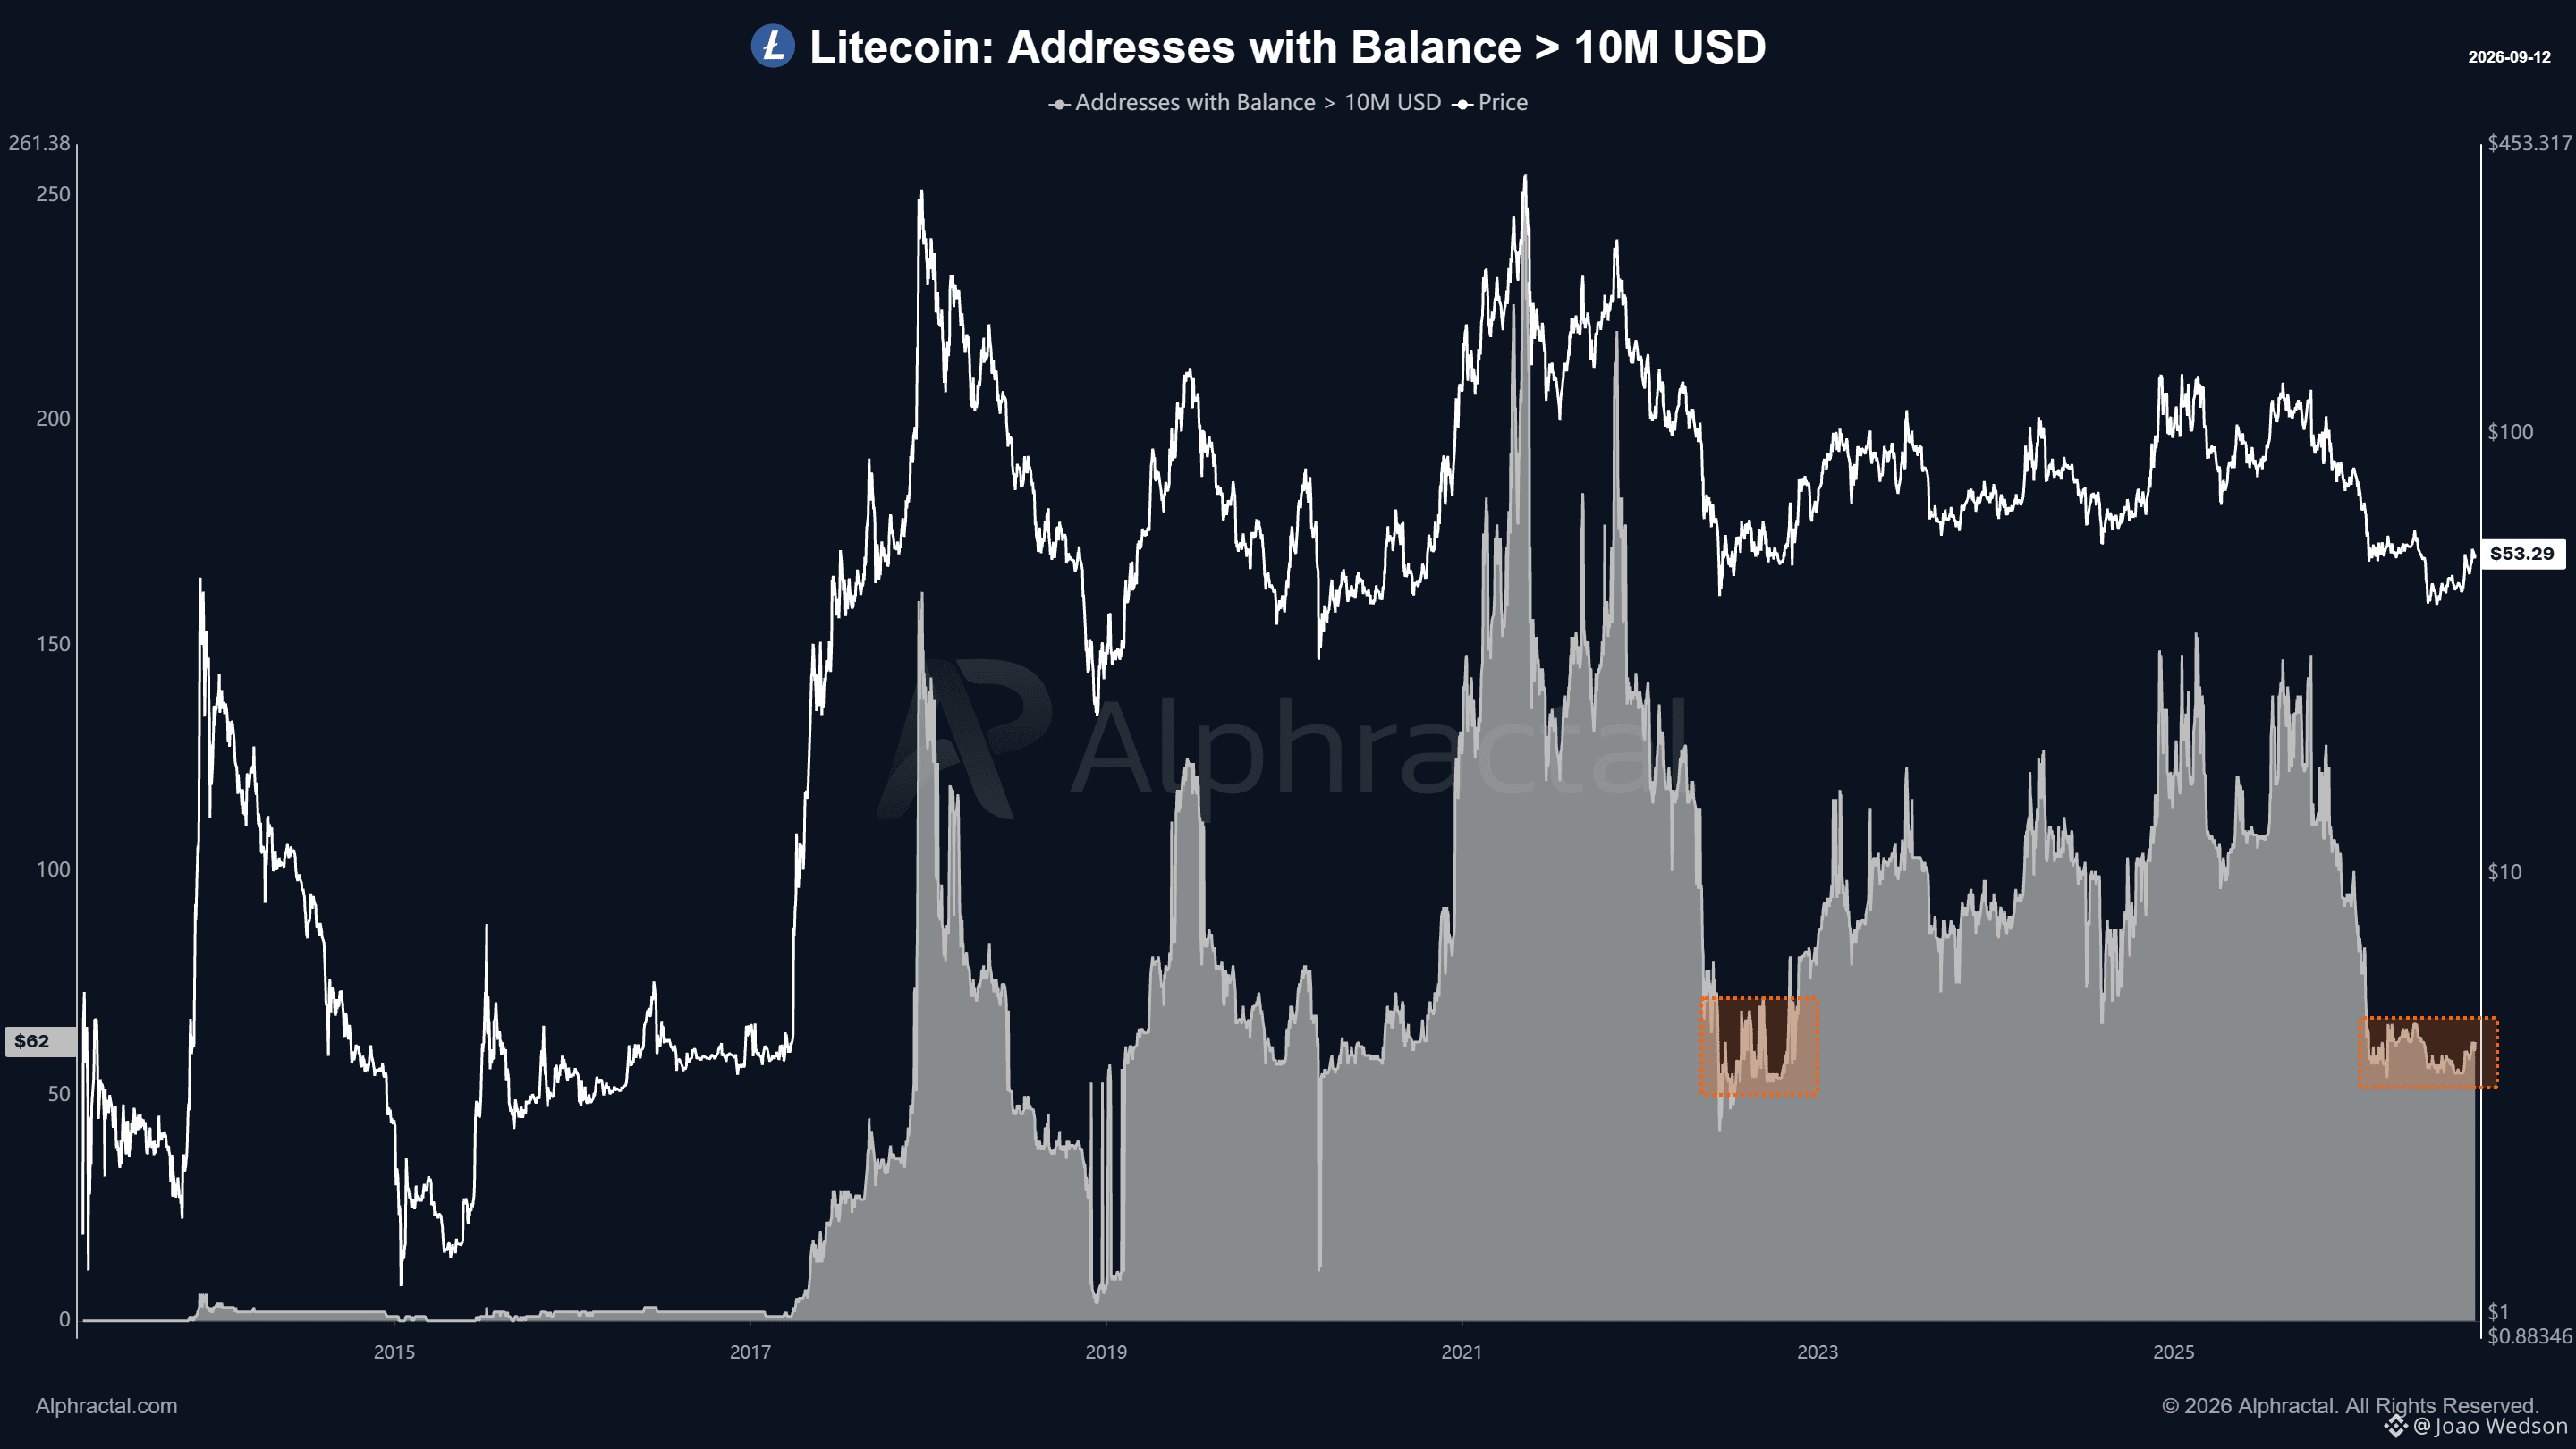
持有介于 100 万至 1,000 万美元的莱特币(LTC)地址数量,以及持有超过 1,000 万美元的地址数量,都已回落至约见于 2022 年周期底部时的水准。
这是一个重要的鲸鱼(大户)参与度转变。与周期中较强势的阶段相比,大型持有者的占比显著降低。
历史上,类似的收缩曾出现在市场承压与深度重置的时期。这并不保证 LTC 已触底,但它显示目前鲸鱼活动正处于历史上偏低的水准附近。
$LTC #Litecoin
持有介于 100 万至 1,000 万美元的莱特币(LTC)地址数量,以及持有超过 1,000 万美元的地址数量,都已回落至约见于 2022 年周期底部时的水准。
这是一个重要的鲸鱼(大户)参与度转变。与周期中较强势的阶段相比,大型持有者的占比显著降低。
历史上,类似的收缩曾出现在市场承压与深度重置的时期。这并不保证 LTC 已触底,但它显示目前鲸鱼活动正处于历史上偏低的水准附近。
$LTC #Litecoin
这是一个重要的鲸鱼(大户)参与度转变。与周期中较强势的阶段相比,大型持有者的占比显著降低。
历史上,类似的收缩曾出现在市场承压与深度重置的时期。这并不保证 LTC 已触底,但它显示目前鲸鱼活动正处于历史上偏低的水准附近。
$LTC #Litecoin
46
·
--
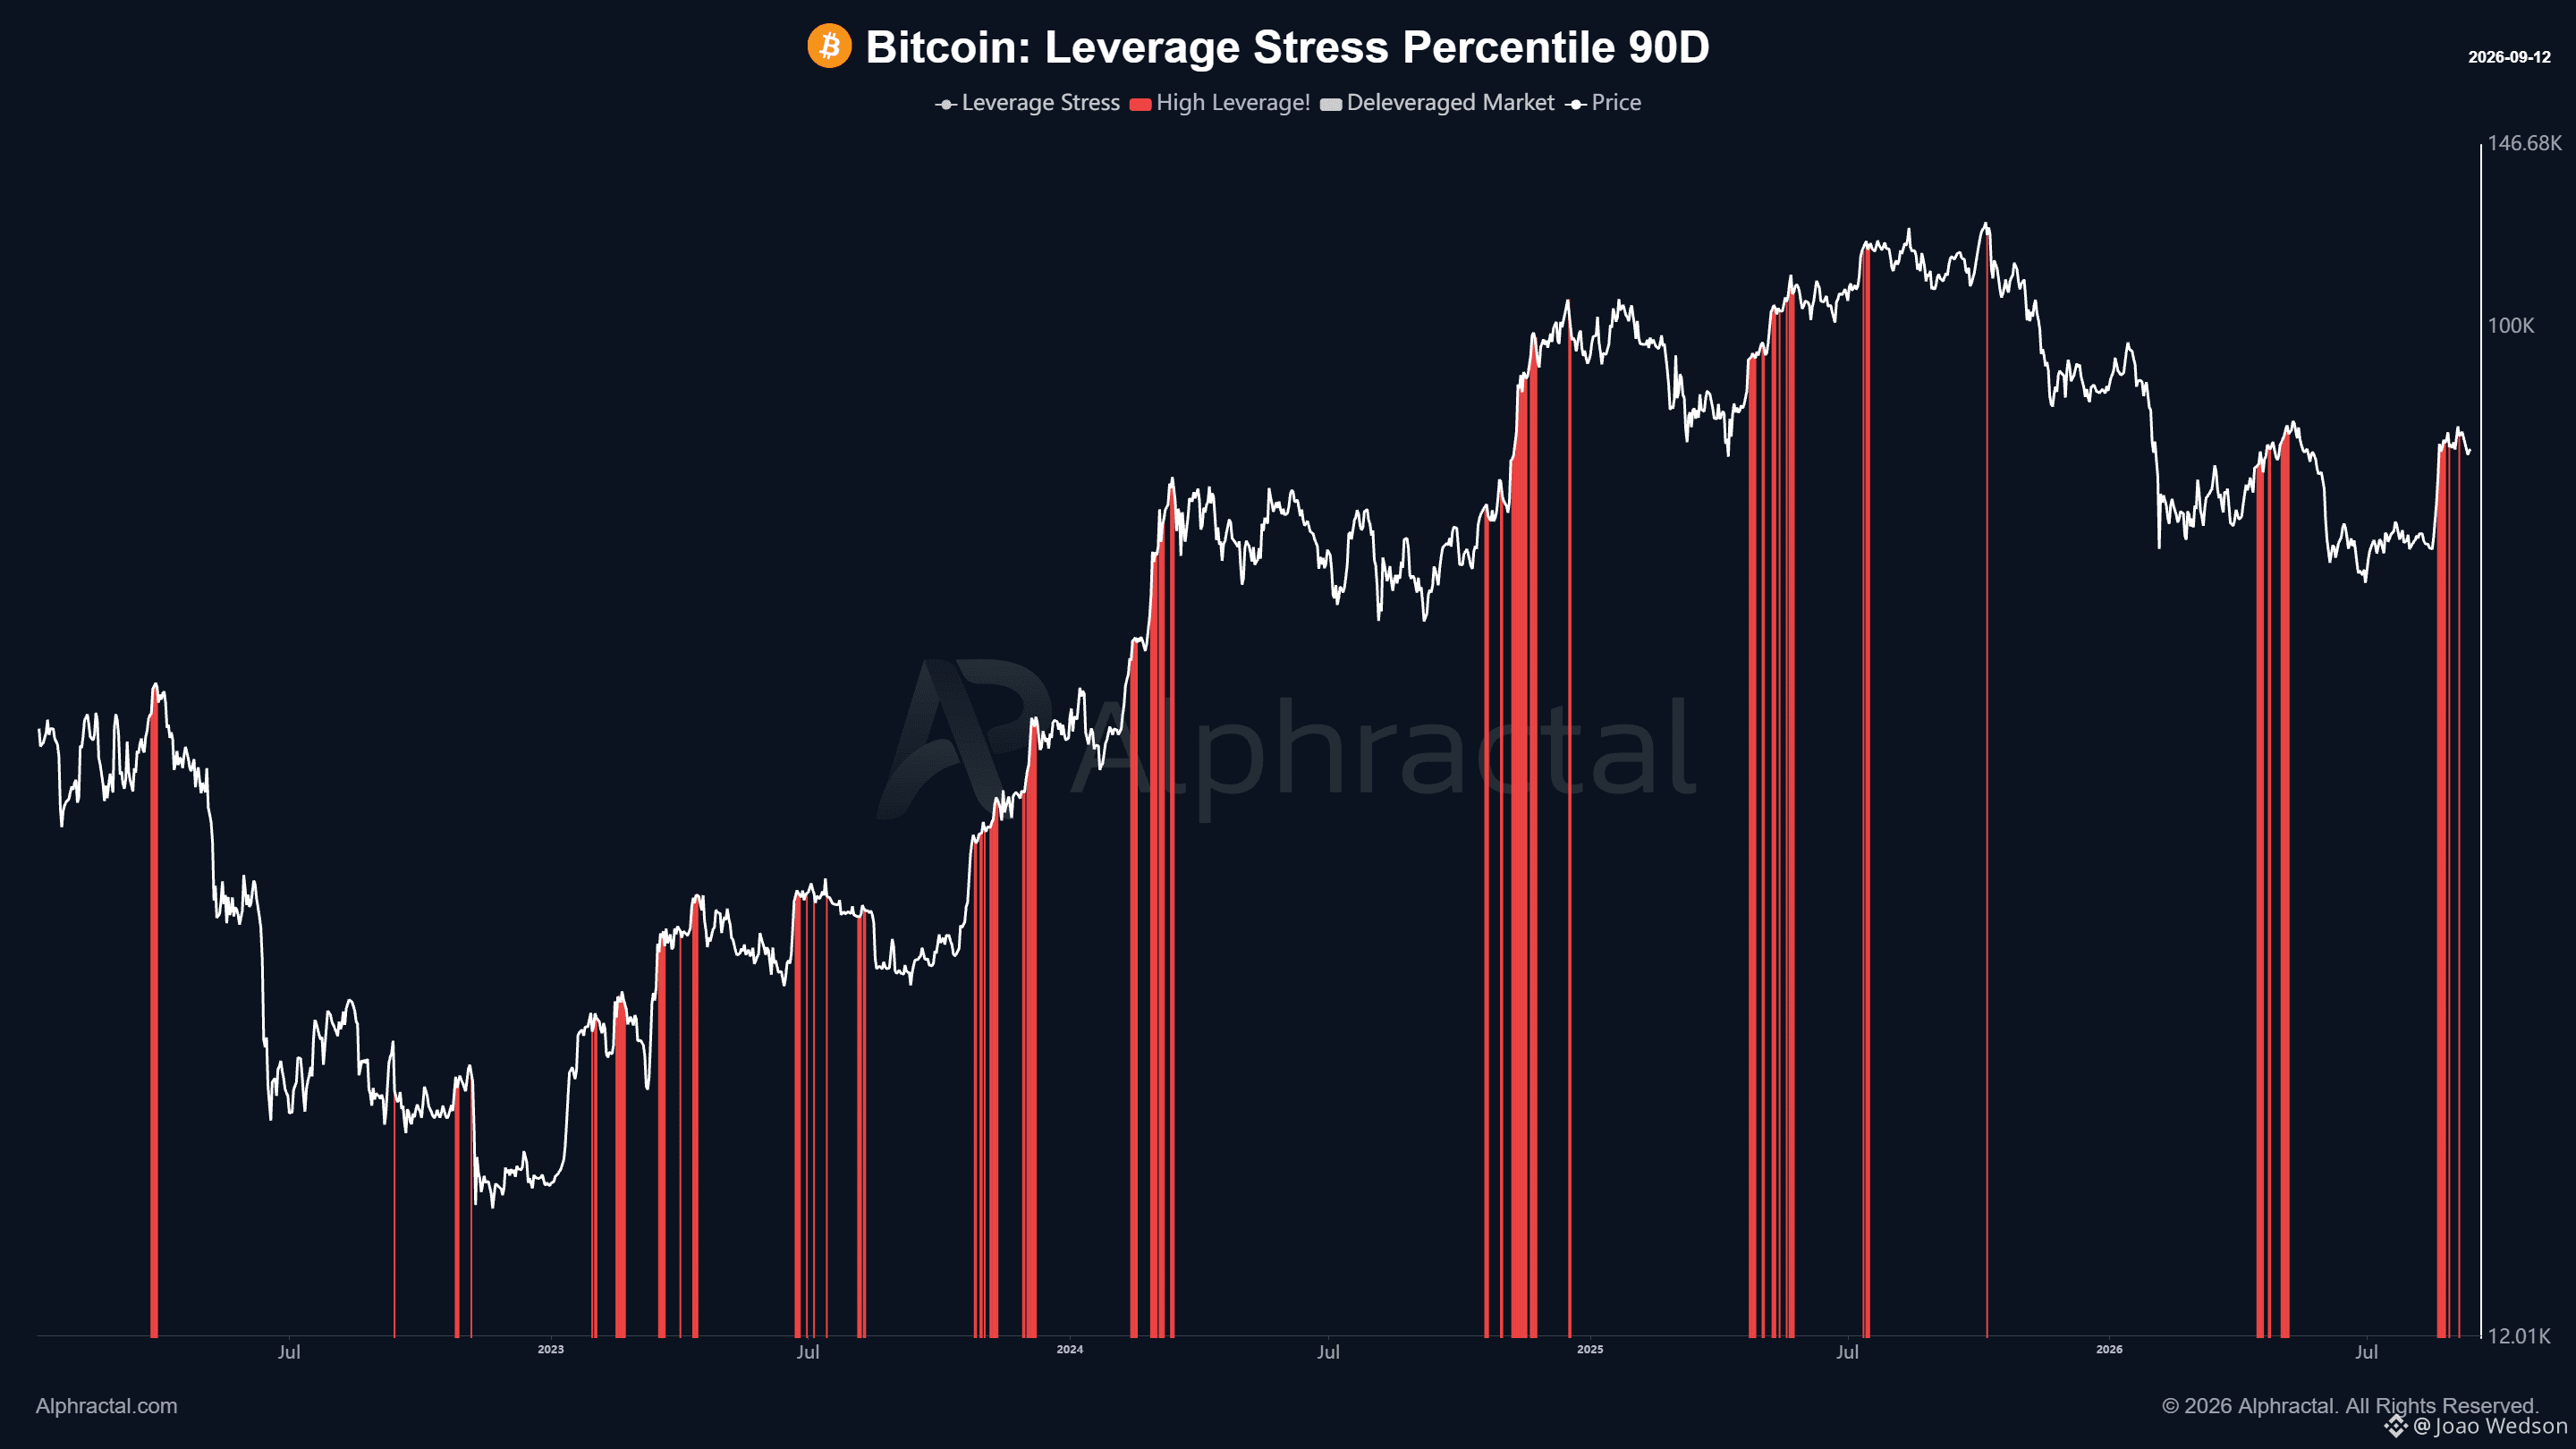
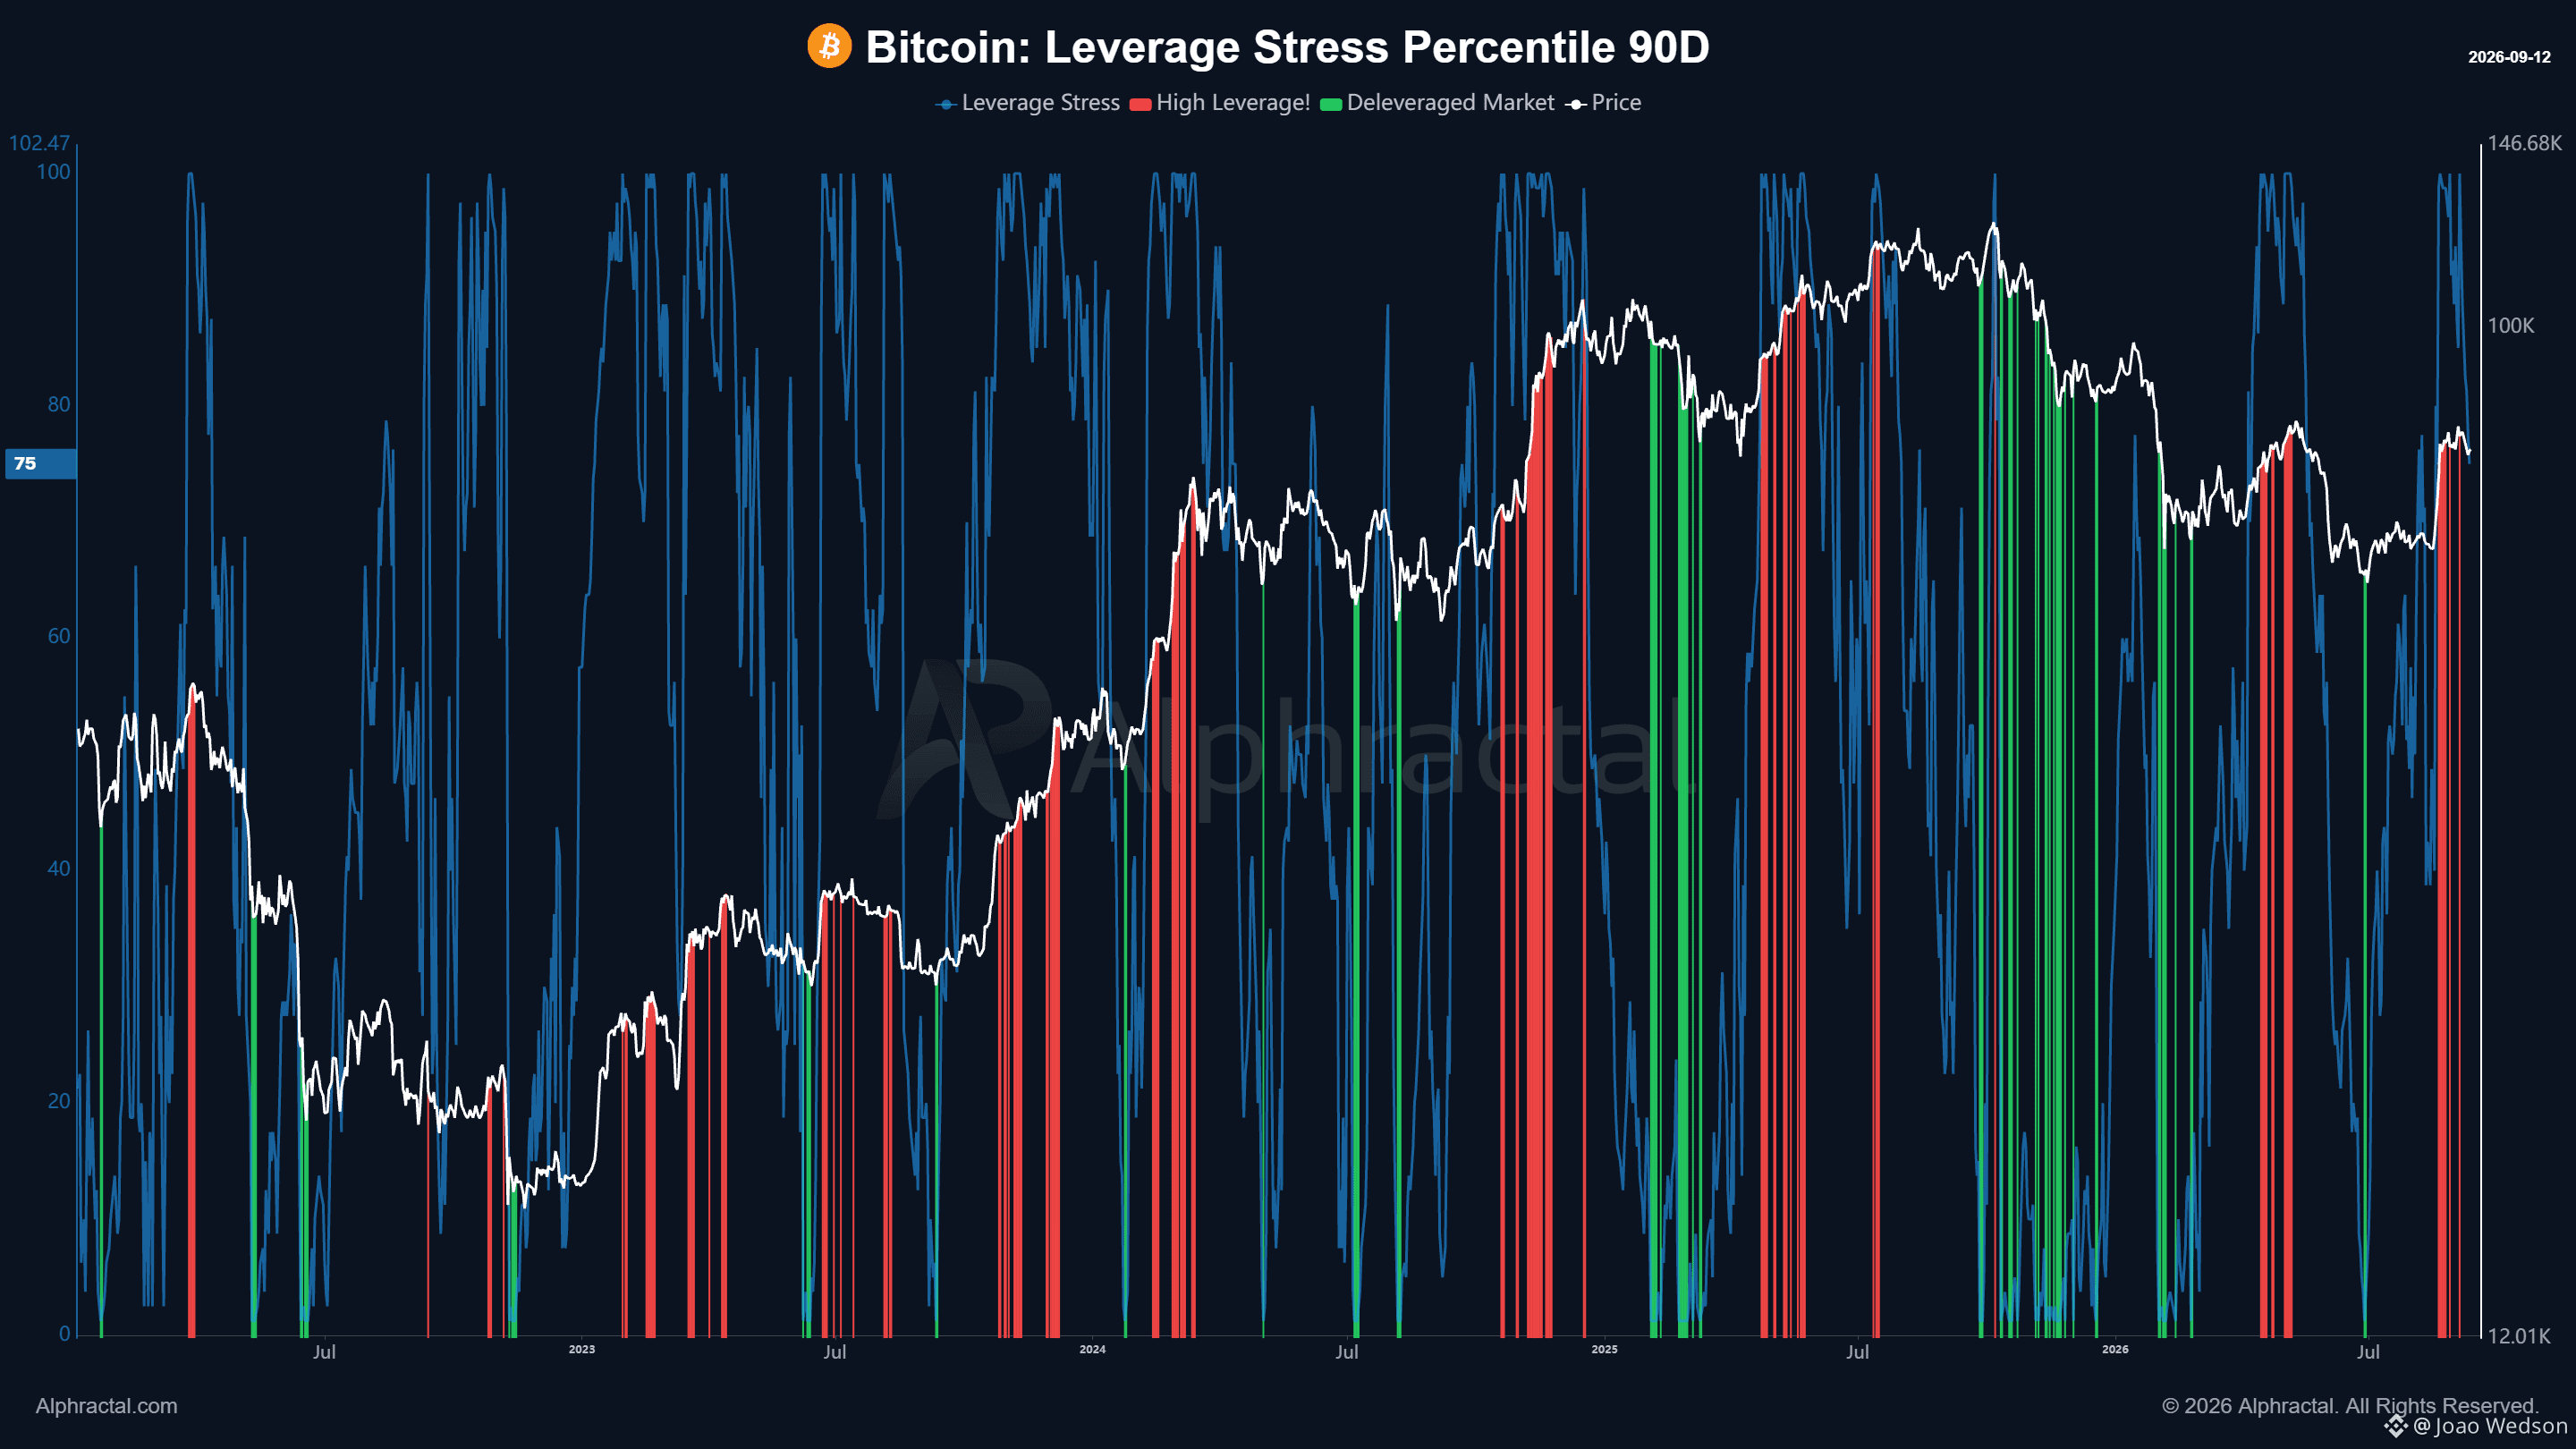
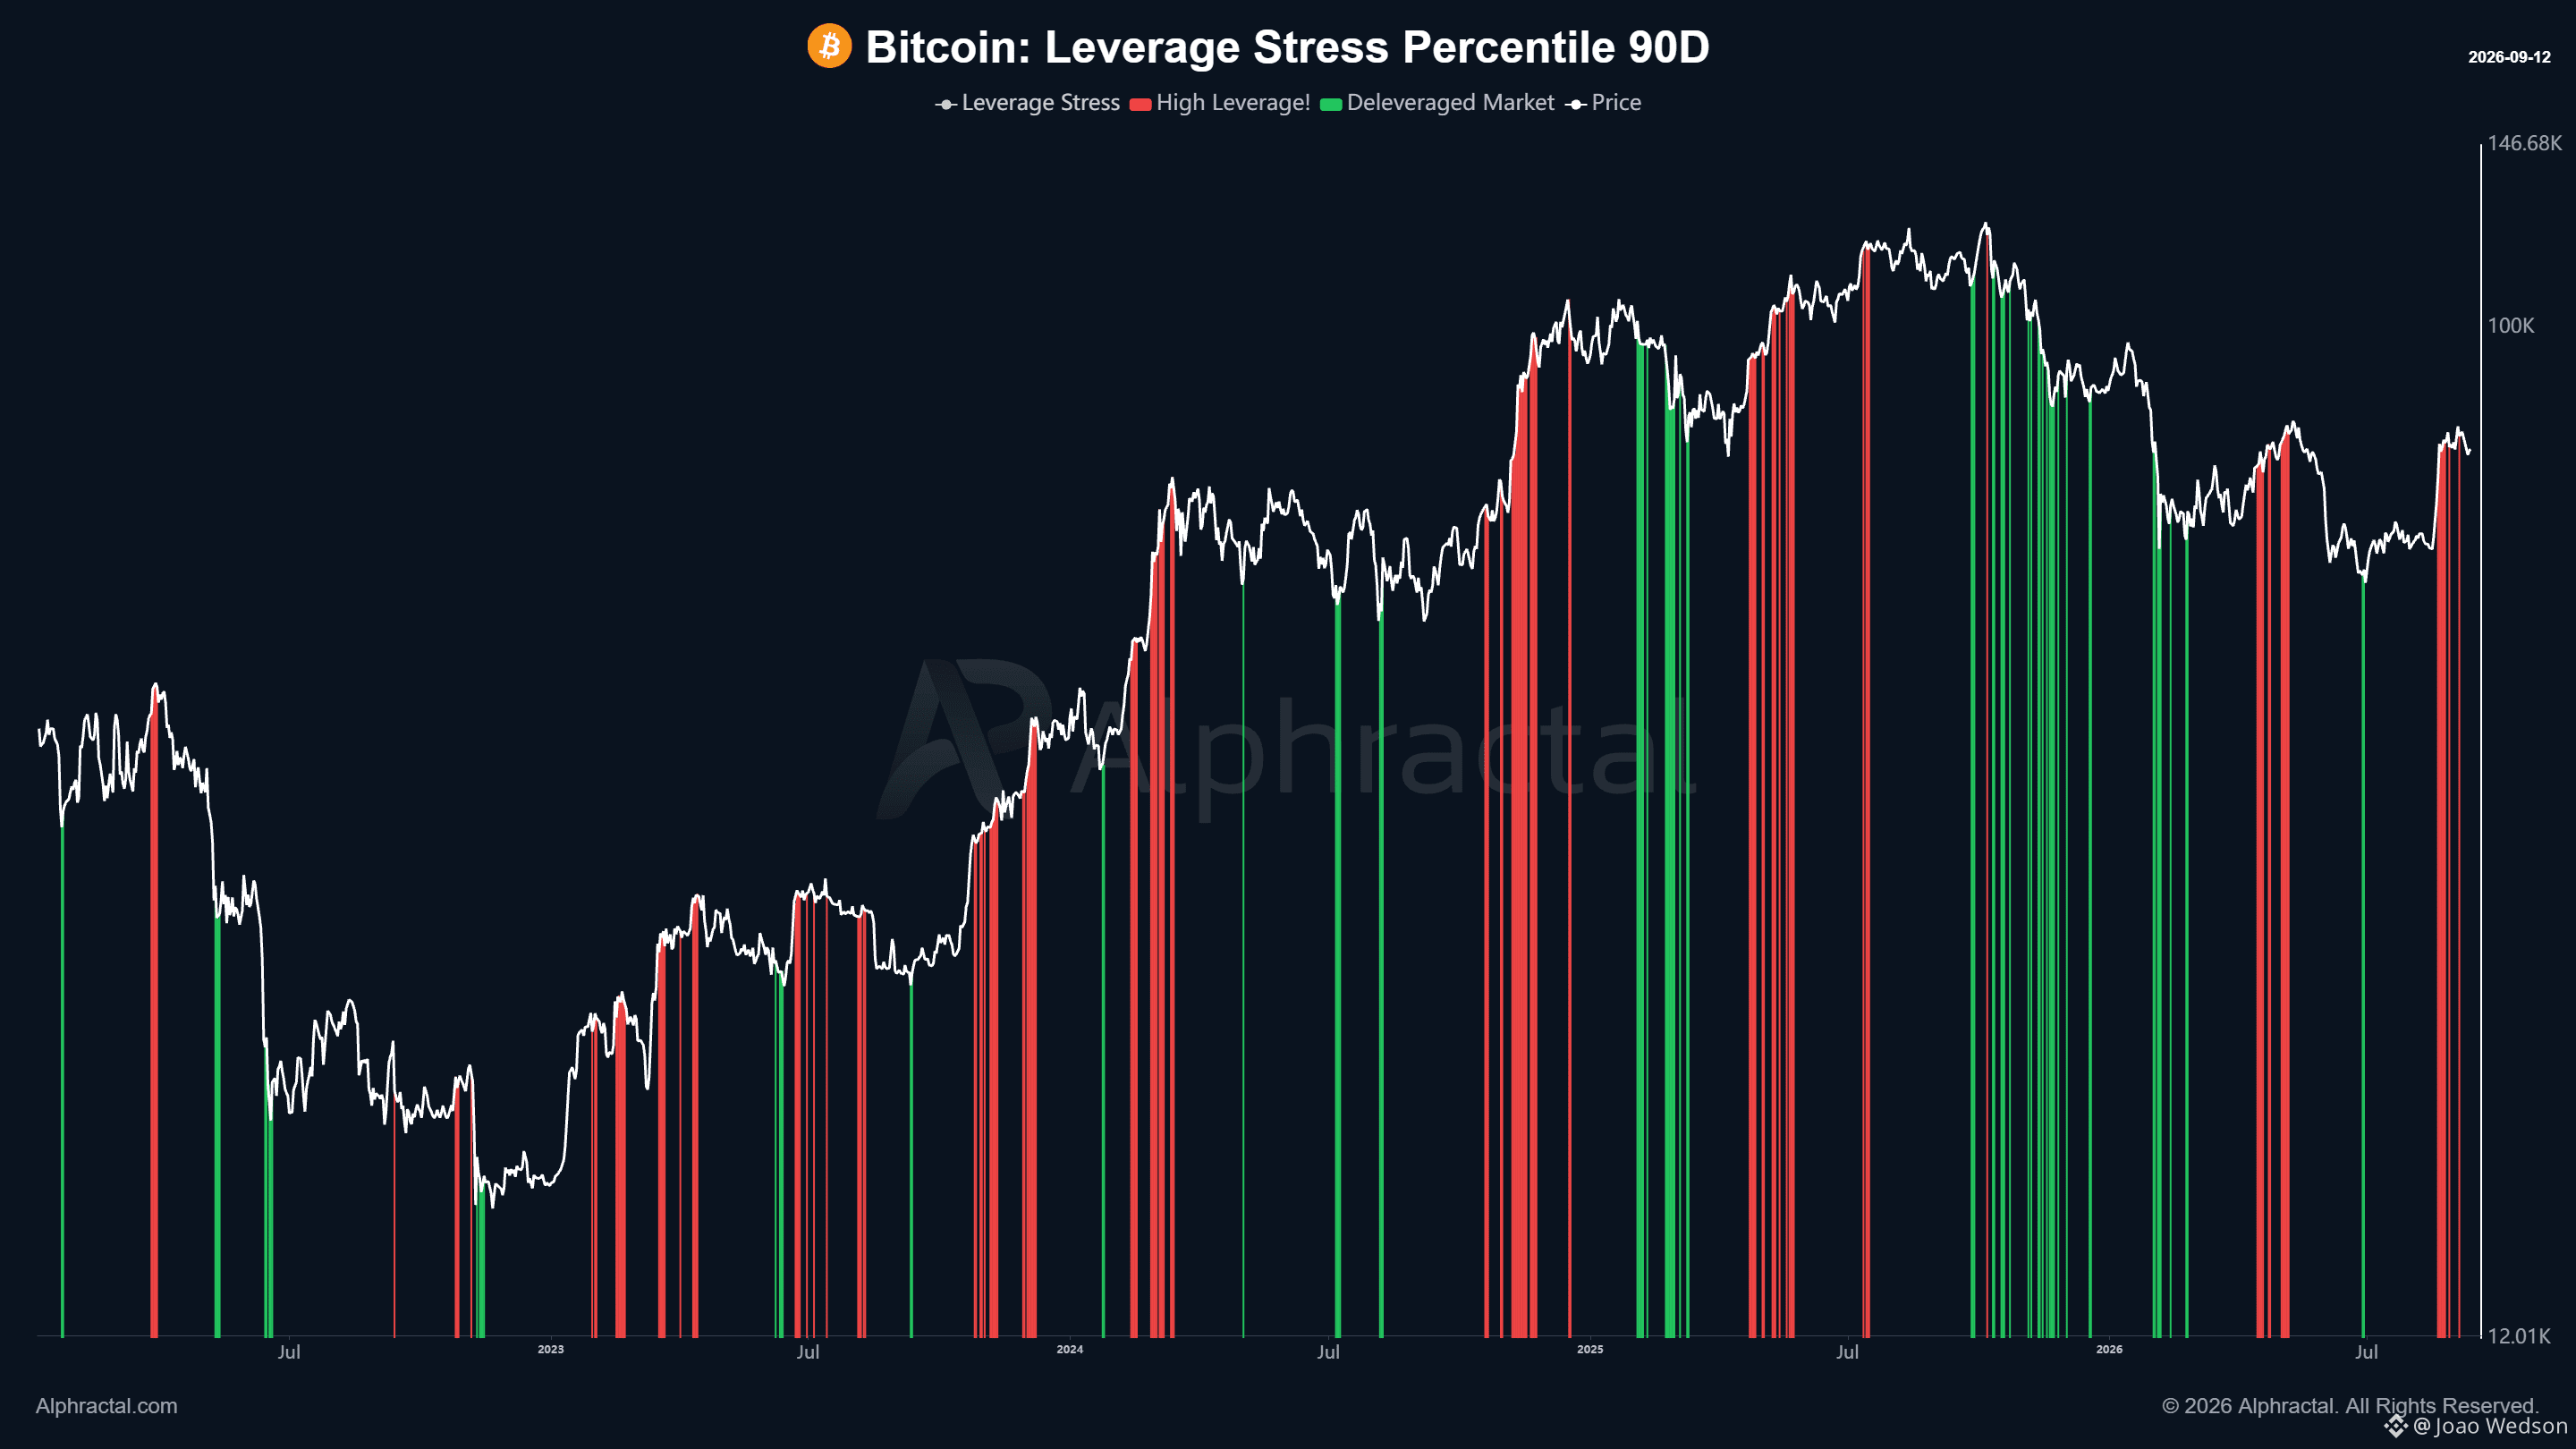
比特币在过去几天内高度杠杆化,如今多余的杠杆开始回吐(去杠杆)。市场通常会用两种方式解决这类失衡:要不就是价格修正,或是在杠杆降温的同时进行一段横盘整理。若比特币能在杠杆下降的同时维持目前的结构,那将为下一步走势提供更健康的条件。若价格开始走弱、但杠杆仍维持在高位,则会暗示可能存在更广泛的去杠杆进程,并提高在市场再次稳定之前仍可能进一步下行的机率。 $BTC #Bitcoin
比特币在过去几天内高度杠杆化,如今多余的杠杆开始回吐(去杠杆)。市场通常会用两种方式解决这类失衡:要不就是价格修正,或是在杠杆降温的同时进行一段横盘整理。若比特币能在杠杆下降的同时维持目前的结构,那将为下一步走势提供更健康的条件。若价格开始走弱、但杠杆仍维持在高位,则会暗示可能存在更广泛的去杠杆进程,并提高在市场再次稳定之前仍可能进一步下行的机率。 $BTC #Bitcoin
50
·
--
Zcash 已进入一个区域:此时开始获利了结,会变得有一定道理。
目前价格已高于数个重要的链上水位,且相较于斐波那契调整后的市场平均价格,涨幅也显著上移,进入一个更为拉伸的区域。
市场压力也已达到该模型的第二高水平,而这通常是一个很有意思的起点,用来开始降低曝险。
NUPL 仍维持为正,显示网路仍持有相当可观的未实现利润。
还有一个重要细节。持有 100K 到 1M $ZEC 的地址开始出现小幅下滑,这是鲸鱼进行获利了结的典型讯号。
至于那些累积成本更低的人,这里已经是一个值得特别留意的区域。
#Zcash $ZEC
Zcash 已进入一个区域:此时开始获利了结,会变得有一定道理。
目前价格已高于数个重要的链上水位,且相较于斐波那契调整后的市场平均价格,涨幅也显著上移,进入一个更为拉伸的区域。
市场压力也已达到该模型的第二高水平,而这通常是一个很有意思的起点,用来开始降低曝险。
NUPL 仍维持为正,显示网路仍持有相当可观的未实现利润。
还有一个重要细节。持有 100K 到 1M $ZEC 的地址开始出现小幅下滑,这是鲸鱼进行获利了结的典型讯号。
至于那些累积成本更低的人,这里已经是一个值得特别留意的区域。
#Zcash $ZEC
目前价格已高于数个重要的链上水位,且相较于斐波那契调整后的市场平均价格,涨幅也显著上移,进入一个更为拉伸的区域。
市场压力也已达到该模型的第二高水平,而这通常是一个很有意思的起点,用来开始降低曝险。
NUPL 仍维持为正,显示网路仍持有相当可观的未实现利润。
还有一个重要细节。持有 100K 到 1M $ZEC 的地址开始出现小幅下滑,这是鲸鱼进行获利了结的典型讯号。
至于那些累积成本更低的人,这里已经是一个值得特别留意的区域。
#Zcash $ZEC


54
·
--
Zcash 已进入一个开始获利了结变得有意义的区域。
目前价格已站上数个重要的链上关键位,且在费波那契调整后的市场均价(Fibonacci-Adjusted Market Mean Price)内也明显上涨,进入更为拉伸的区间。
市场压力也已达到模型的第二高水平,这通常是开始降低曝险的有趣切入点。
NUPL 仍维持正值,表示网路正持有相当可观的未实现获利。
还有一个更重要的细节。持有 100K 到 1M $ZEC 的地址已开始略微下滑,这是鲸鱼进行获利了结的典型迹象。
至于那些累积成本更低的人,这一区间已值得密切关注。
我们在所有 Alphractal 方案上的 50% OFF 优惠将于本周结束。
如果你还没尝试过该平台,现在就把握免费试用,探索我们的指标、Alpha AI 与各种工具,看看 Alphractal 能为你做什么。
限时 50% OFF。别错过。
https://app.alphractal.com/plans?utm_source=coinmarketcap&utm_medium=update
Zcash 已进入一个开始获利了结变得有意义的区域。
目前价格已站上数个重要的链上关键位,且在费波那契调整后的市场均价(Fibonacci-Adjusted Market Mean Price)内也明显上涨,进入更为拉伸的区间。
市场压力也已达到模型的第二高水平,这通常是开始降低曝险的有趣切入点。
NUPL 仍维持正值,表示网路正持有相当可观的未实现获利。
还有一个更重要的细节。持有 100K 到 1M $ZEC 的地址已开始略微下滑,这是鲸鱼进行获利了结的典型迹象。
至于那些累积成本更低的人,这一区间已值得密切关注。
我们在所有 Alphractal 方案上的 50% OFF 优惠将于本周结束。
如果你还没尝试过该平台,现在就把握免费试用,探索我们的指标、Alpha AI 与各种工具,看看 Alphractal 能为你做什么。
限时 50% OFF。别错过。
https://app.alphractal.com/plans?utm_source=coinmarketcap&utm_medium=update
目前价格已站上数个重要的链上关键位,且在费波那契调整后的市场均价(Fibonacci-Adjusted Market Mean Price)内也明显上涨,进入更为拉伸的区间。
市场压力也已达到模型的第二高水平,这通常是开始降低曝险的有趣切入点。
NUPL 仍维持正值,表示网路正持有相当可观的未实现获利。
还有一个更重要的细节。持有 100K 到 1M $ZEC 的地址已开始略微下滑,这是鲸鱼进行获利了结的典型迹象。
至于那些累积成本更低的人,这一区间已值得密切关注。
我们在所有 Alphractal 方案上的 50% OFF 优惠将于本周结束。
如果你还没尝试过该平台,现在就把握免费试用,探索我们的指标、Alpha AI 与各种工具,看看 Alphractal 能为你做什么。
限时 50% OFF。别错过。
https://app.alphractal.com/plans?utm_source=coinmarketcap&utm_medium=update


50
·
--
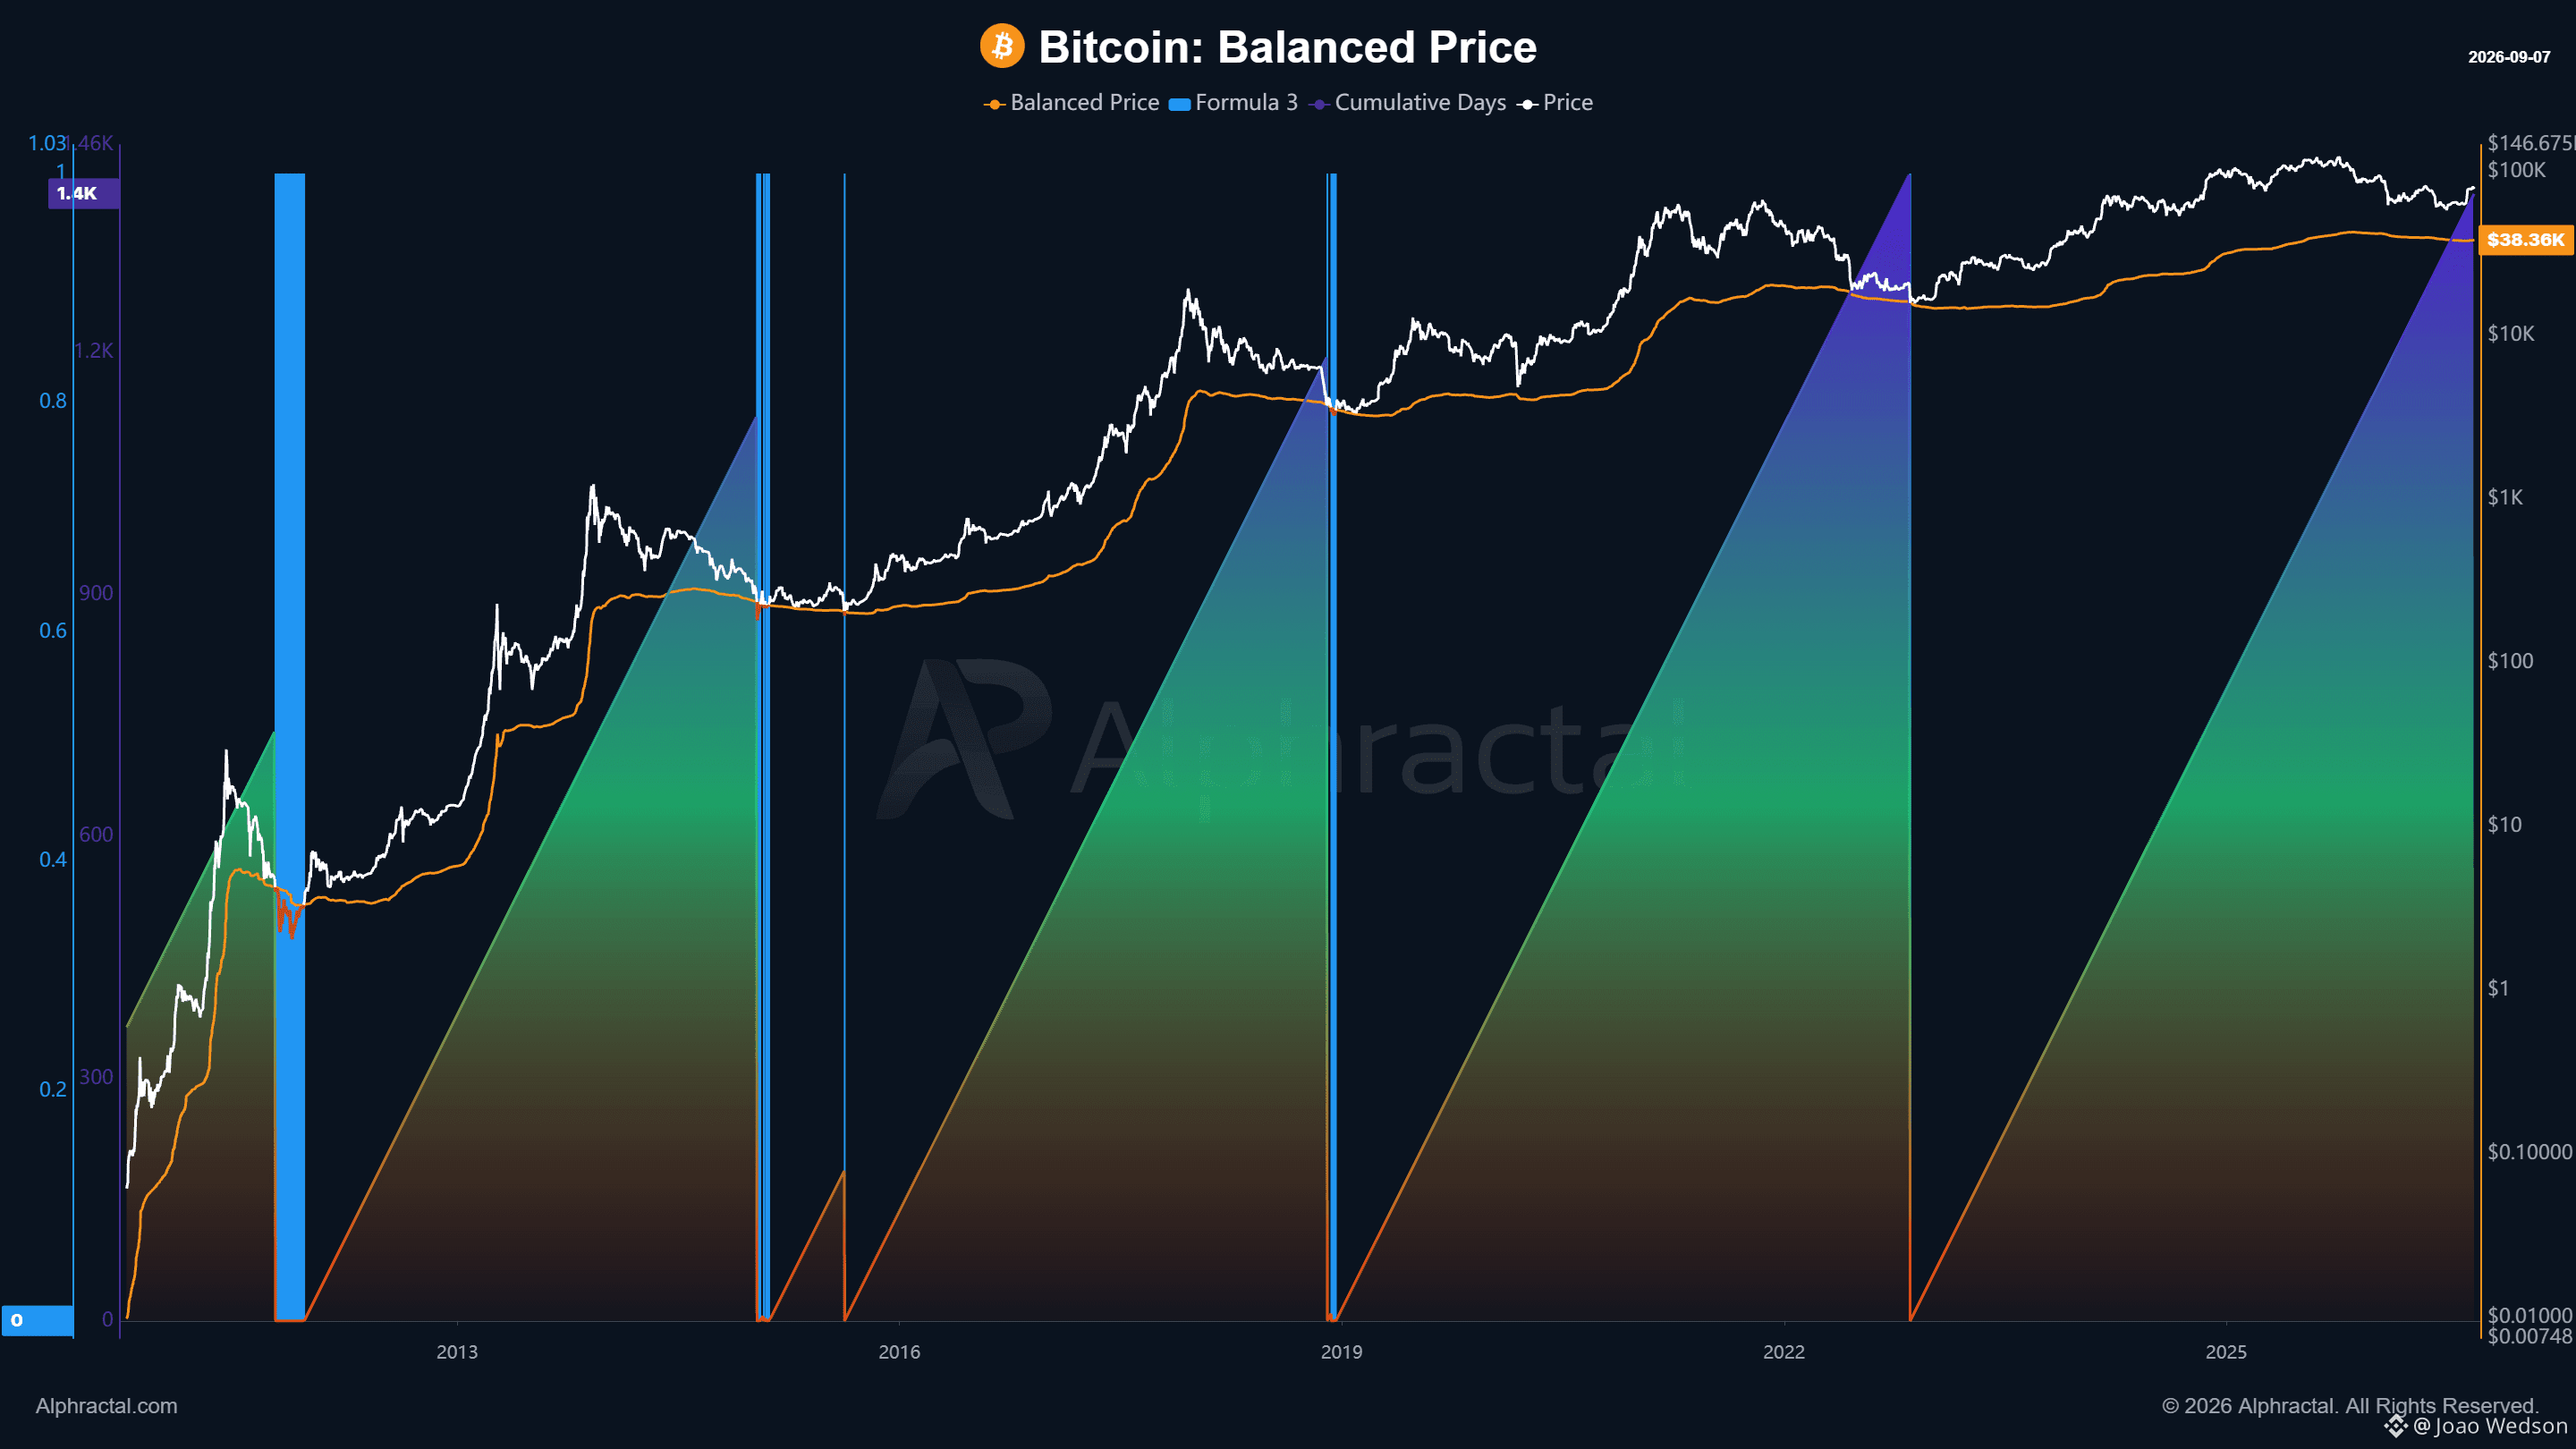
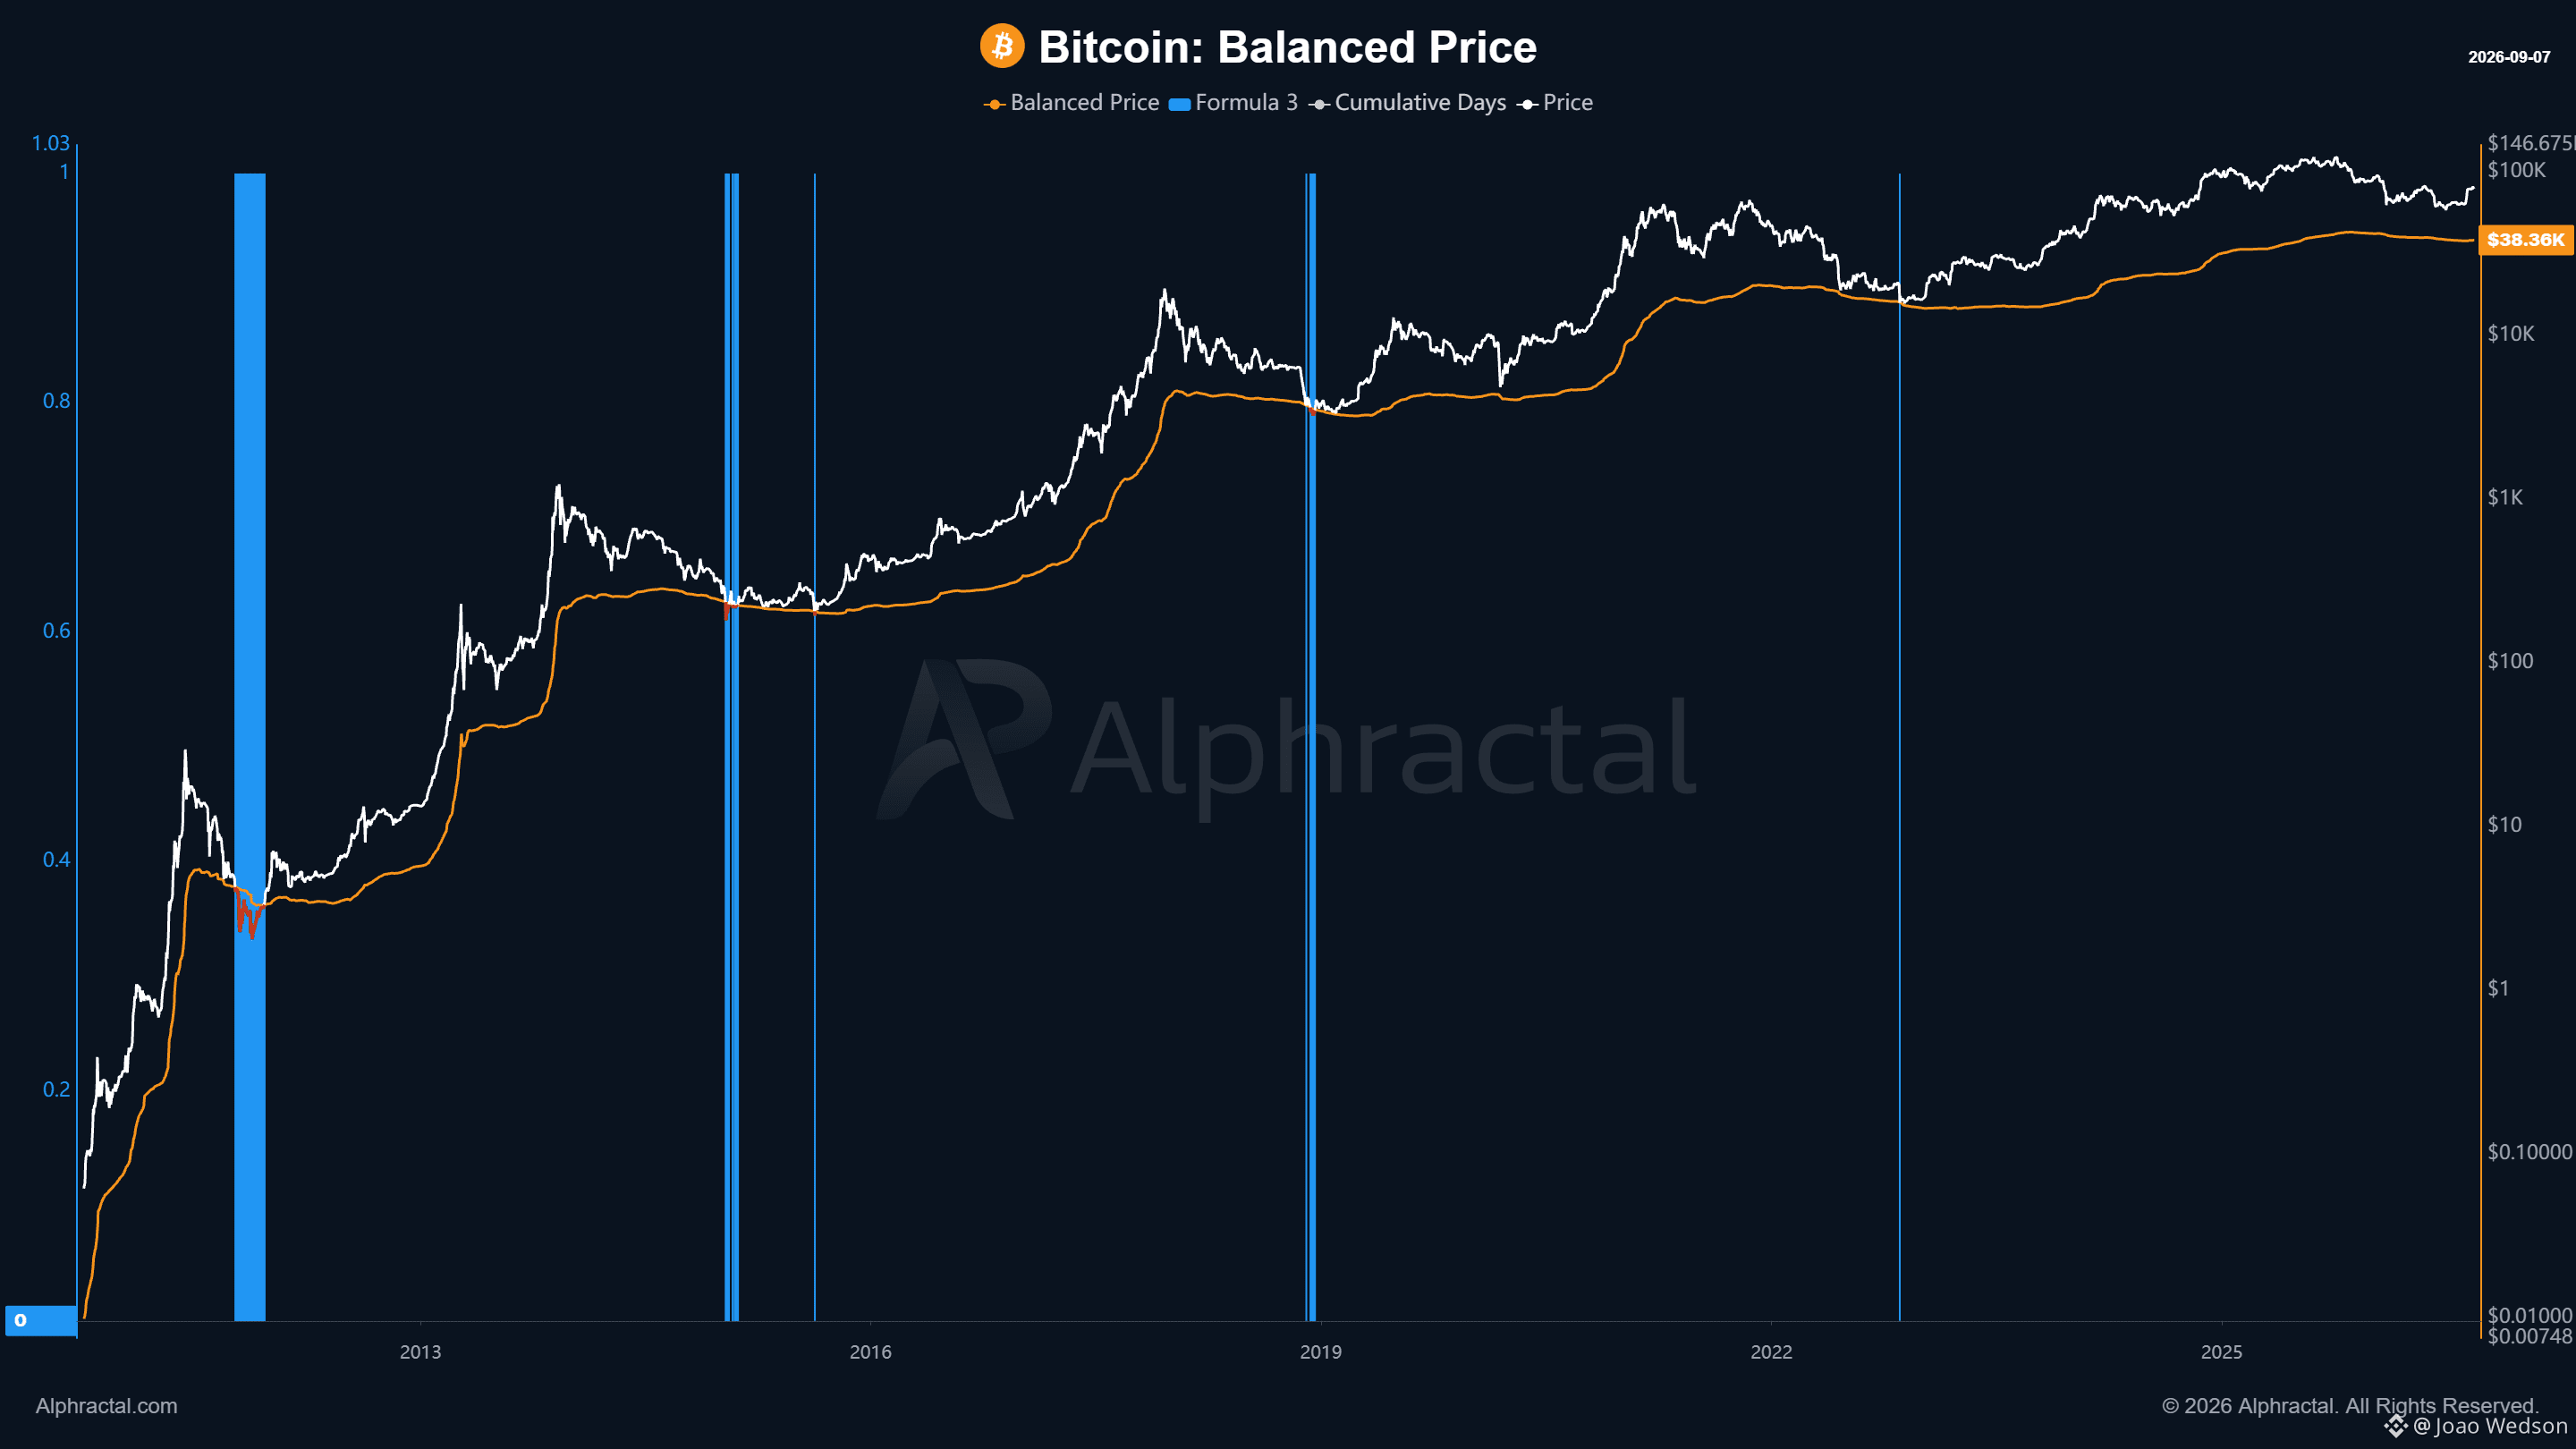
我们还会再见到比特币跌破 4 万美元以下吗?
这不是预测。只是基于“平衡价格(Balanced Price)”的一条有趣观察。该指标在过去曾极其有效地识别比特币深度周期的底部。
自从价格与该区间的主要互动开始以来,累计时间一直在增加:
732 天 → 1.12K → 1.20K → 1.42K 天
目前这个周期距离上一次与平衡价格的互动,已经累计了大约 1.40K 天。
还有一个有趣的细节:比特币在该指标之下所停留的时间也在减少。早期周期里,它会在该区域下方停留数周;之后大约为 20 天;再后来更少;而在 2022 年,价格几乎有将近 1 天都在该区域下方。
今天,平衡价格接近 3.84 万美元。
平衡价格会根据更长期持有的旧币的支出足迹来调整市场的整体成本基础,从而形成一个估值区间。历史上,这一区间通常会在极端恐慌(大规模抛售、逼近“投降”)的时期出现。
这并不意味着比特币一定需要回到 3.8 万美元。历史演变本身引出了一个更有意思的问题:
如果有一天,比特币干脆不再回访平衡价格,会怎样?
另一方面,如果这种历史行为再次重演,那么是的,我们就会在链上获得理由,从而认为 4 万美元区域可能是一个潜在的投降目标。立即访问!https://app.alphractal.com/plans?utm_source=coinmarketcap&utm_medium=update&utm_campaign=founding_access&utm_content=ceo_joao
我们还会再见到比特币跌破 4 万美元以下吗?
这不是预测。只是基于“平衡价格(Balanced Price)”的一条有趣观察。该指标在过去曾极其有效地识别比特币深度周期的底部。
自从价格与该区间的主要互动开始以来,累计时间一直在增加:
732 天 → 1.12K → 1.20K → 1.42K 天
目前这个周期距离上一次与平衡价格的互动,已经累计了大约 1.40K 天。
还有一个有趣的细节:比特币在该指标之下所停留的时间也在减少。早期周期里,它会在该区域下方停留数周;之后大约为 20 天;再后来更少;而在 2022 年,价格几乎有将近 1 天都在该区域下方。
今天,平衡价格接近 3.84 万美元。
平衡价格会根据更长期持有的旧币的支出足迹来调整市场的整体成本基础,从而形成一个估值区间。历史上,这一区间通常会在极端恐慌(大规模抛售、逼近“投降”)的时期出现。
这并不意味着比特币一定需要回到 3.8 万美元。历史演变本身引出了一个更有意思的问题:
如果有一天,比特币干脆不再回访平衡价格,会怎样?
另一方面,如果这种历史行为再次重演,那么是的,我们就会在链上获得理由,从而认为 4 万美元区域可能是一个潜在的投降目标。立即访问!https://app.alphractal.com/plans?utm_source=coinmarketcap&utm_medium=update&utm_campaign=founding_access&utm_content=ceo_joao
这不是预测。只是基于“平衡价格(Balanced Price)”的一条有趣观察。该指标在过去曾极其有效地识别比特币深度周期的底部。
自从价格与该区间的主要互动开始以来,累计时间一直在增加:
732 天 → 1.12K → 1.20K → 1.42K 天
目前这个周期距离上一次与平衡价格的互动,已经累计了大约 1.40K 天。
还有一个有趣的细节:比特币在该指标之下所停留的时间也在减少。早期周期里,它会在该区域下方停留数周;之后大约为 20 天;再后来更少;而在 2022 年,价格几乎有将近 1 天都在该区域下方。
今天,平衡价格接近 3.84 万美元。
平衡价格会根据更长期持有的旧币的支出足迹来调整市场的整体成本基础,从而形成一个估值区间。历史上,这一区间通常会在极端恐慌(大规模抛售、逼近“投降”)的时期出现。
这并不意味着比特币一定需要回到 3.8 万美元。历史演变本身引出了一个更有意思的问题:
如果有一天,比特币干脆不再回访平衡价格,会怎样?
另一方面,如果这种历史行为再次重演,那么是的,我们就会在链上获得理由,从而认为 4 万美元区域可能是一个潜在的投降目标。立即访问!https://app.alphractal.com/plans?utm_source=coinmarketcap&utm_medium=update&utm_campaign=founding_access&utm_content=ceo_joao
48
·
--
新的影片已上线。
加密叙事的变化速度,比多数人所想得更快。
而且非常常见的原因其实很简单:价格先动,接著叙事才跟进。
在这支影片中,我将用以下方式从不同角度探讨加密市场情绪:
Google 趋势
加密影响者的活动
贴文数量
Fear & Greed 指数
Wikipedia 关注度
Alphractal 情绪指标
还有更多
目标是理解:注意力、信念与市场叙事,会如何随价格走势而改变。
有时候,最有趣的讯号并不是人们在说什么。
而是他们开始这么说的时候。
在这里观看完整影片:
https://youtu.be/LhTu8OzN7WI
新的影片已上线。
加密叙事的变化速度,比多数人所想得更快。
而且非常常见的原因其实很简单:价格先动,接著叙事才跟进。
在这支影片中,我将用以下方式从不同角度探讨加密市场情绪:
Google 趋势
加密影响者的活动
贴文数量
Fear & Greed 指数
Wikipedia 关注度
Alphractal 情绪指标
还有更多
目标是理解:注意力、信念与市场叙事,会如何随价格走势而改变。
有时候,最有趣的讯号并不是人们在说什么。
而是他们开始这么说的时候。
在这里观看完整影片:
https://youtu.be/LhTu8OzN7WI
加密叙事的变化速度,比多数人所想得更快。
而且非常常见的原因其实很简单:价格先动,接著叙事才跟进。
在这支影片中,我将用以下方式从不同角度探讨加密市场情绪:
Google 趋势
加密影响者的活动
贴文数量
Fear & Greed 指数
Wikipedia 关注度
Alphractal 情绪指标
还有更多
目标是理解:注意力、信念与市场叙事,会如何随价格走势而改变。
有时候,最有趣的讯号并不是人们在说什么。
而是他们开始这么说的时候。
在这里观看完整影片:
https://youtu.be/LhTu8OzN7WI
78
·
--
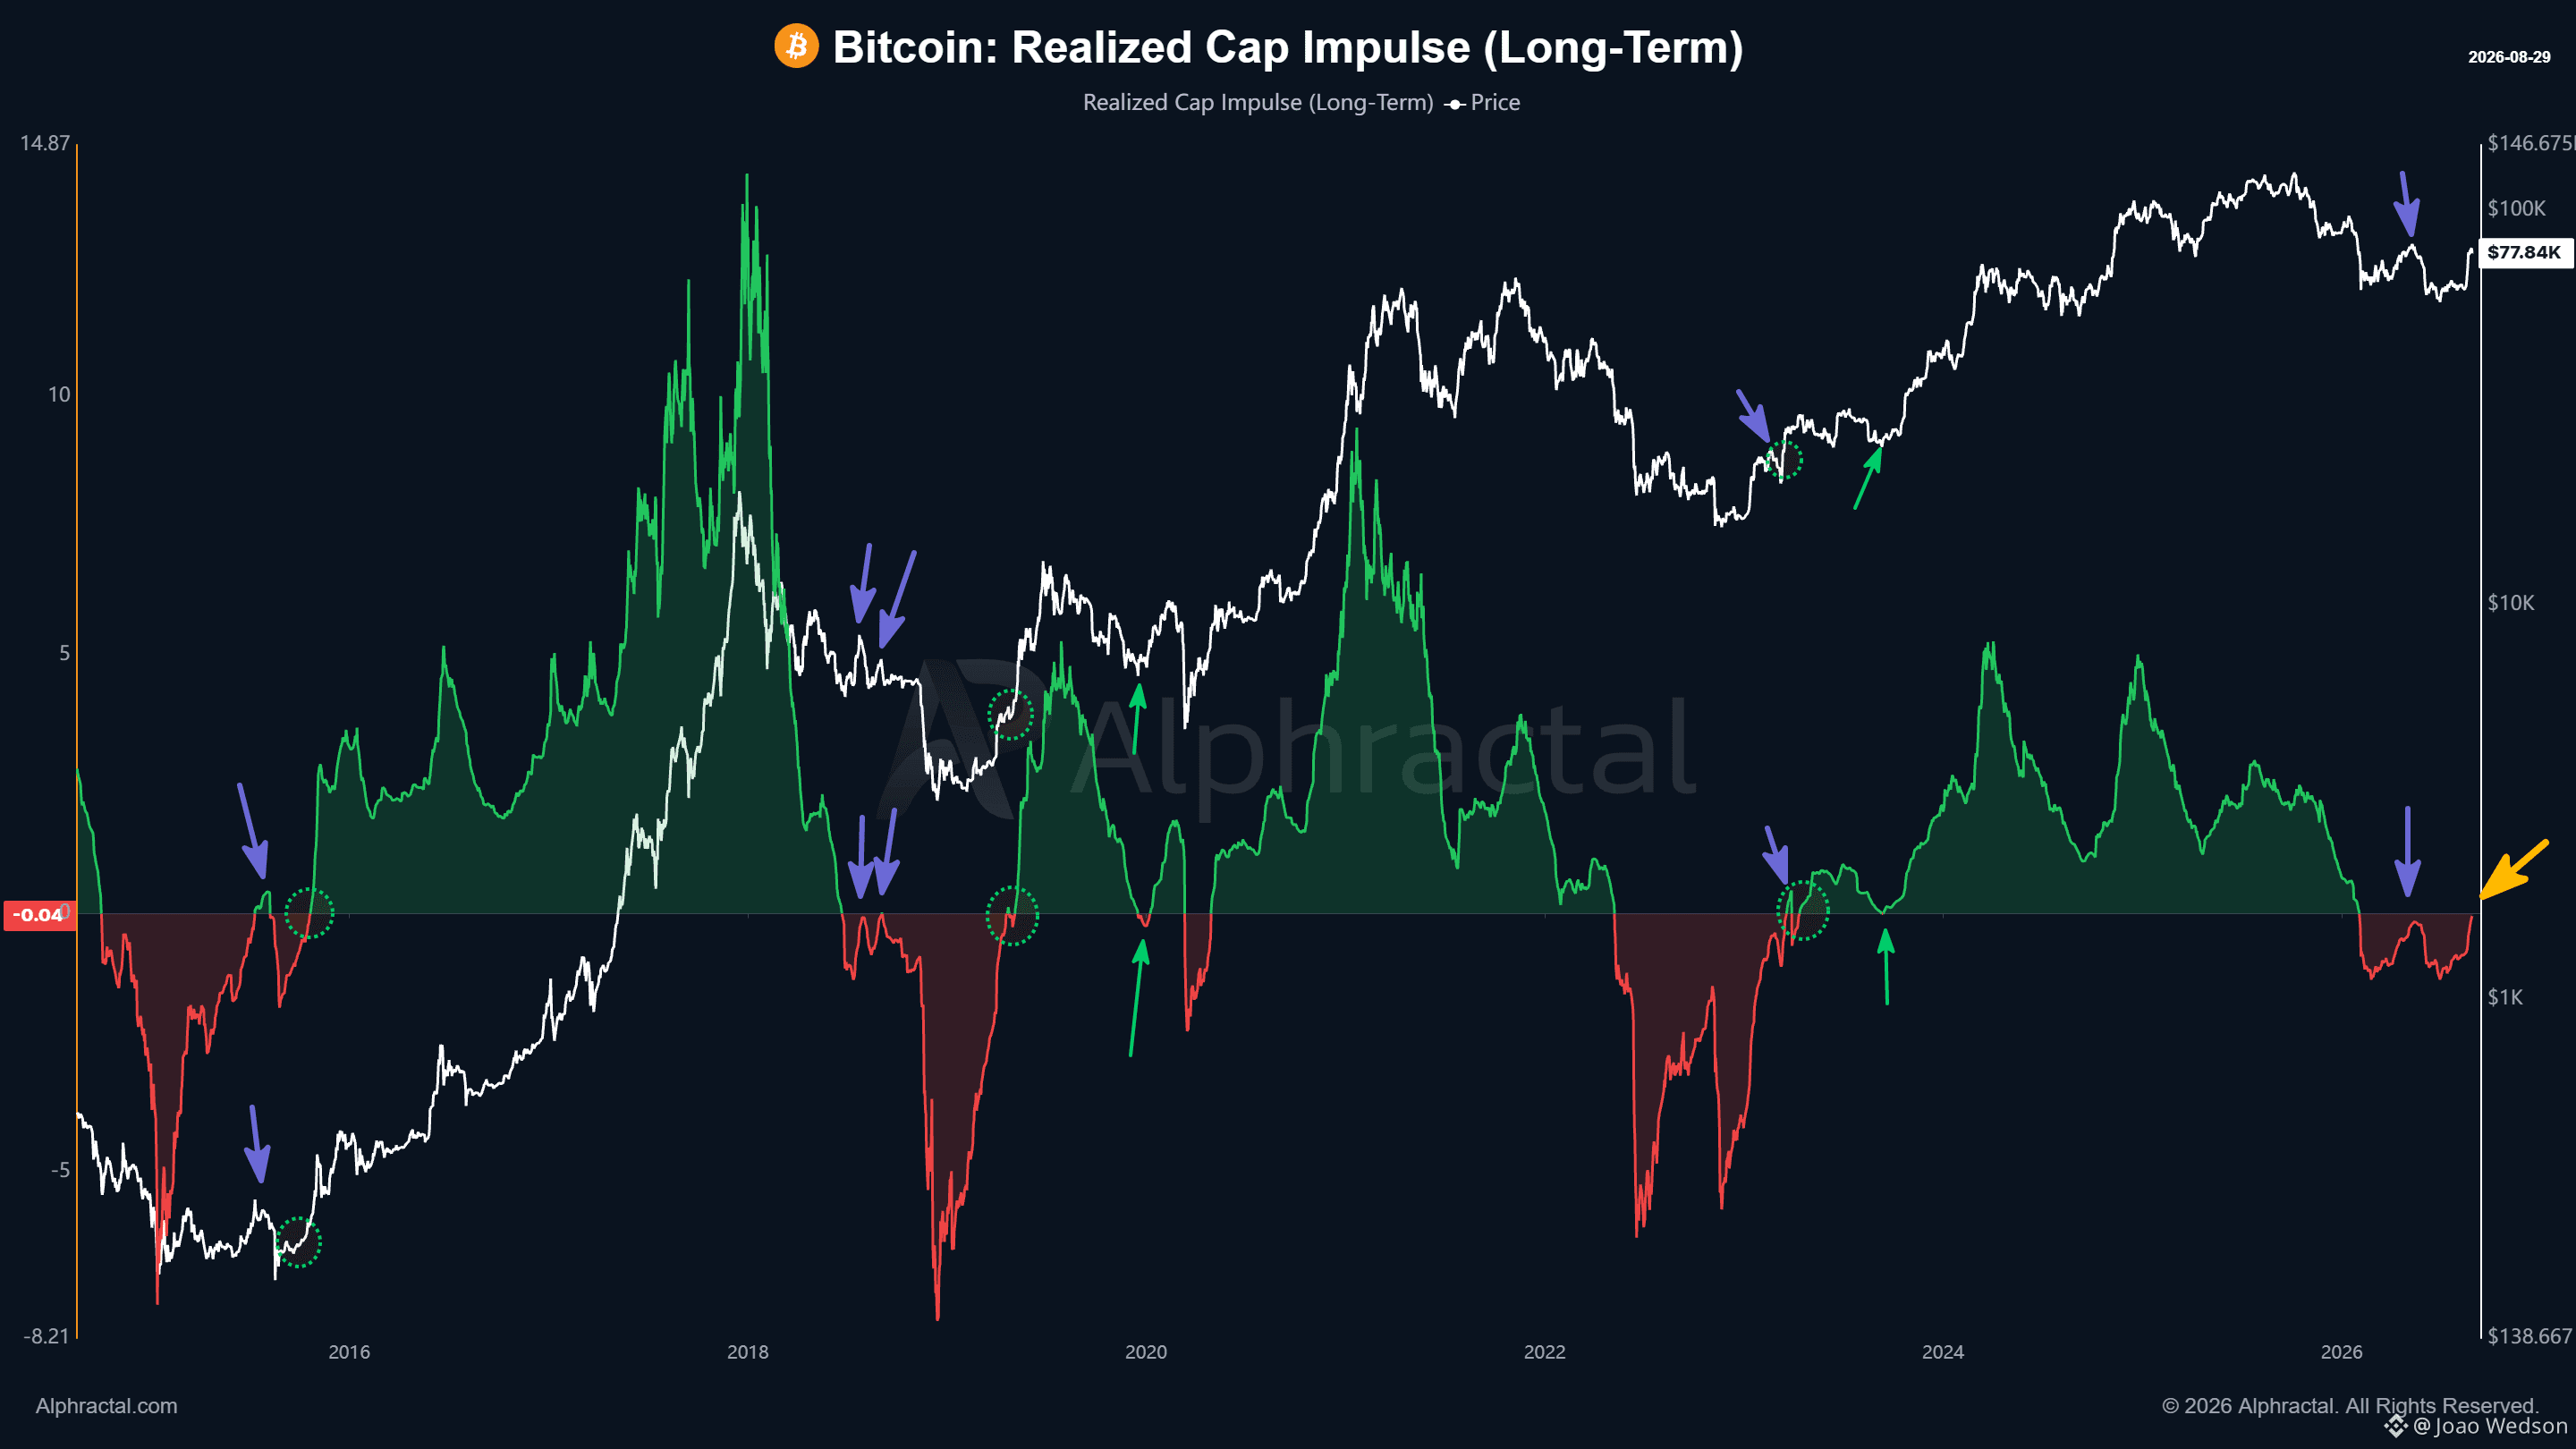
已实现资本冲动正再次接近正值区域,这使得目前的设定特别重要。这项指标有助于追踪比特币已实现市值的较长期变化,并让我们了解资本何时开始更一致地在链上流通。历史上,更具建设性的讯号之一出现在该指标**至少连续两周保持在零以上**的时候。当情况如此时,通常与**牛市环境**相吻合,暗示新的需求正在进入,而资本再次支撑市场结构。然而,仍需考虑一个重要风险。在过去的周期中,首次尝试转为正值并不总是会直接导向延续。**已实现资本冲动**有时会表现得像是一种阻力。在这些情况下,比特币要嘛在反弹前形成**更高的低点**,要嘛如我们在2018年所见那样,进入另一段下跌走势。这也使得未来几天对链上分析特别关键。现在的核心问题是:指标能否在持续的资本流入下守在零之上,还是会出现新的卖压并迫使其再次被打回?如果它能够维持在正值,这将是整体比特币周期非常具建设性的讯号。想要存取这项指标,以及涵盖链上数据、衍生品、清算、宏观与市场结构的1,500+项指标吗?使用代码 BEAR50 在限时内享有 Alphractal **五折(50% OFF)**。https://app.alphractal.com/plans?utm_source=coinmarketcap&utm_medium=update&utm_campaign=founding_access&utm_content=ceo_joao
已实现资本冲动正再次接近正值区域,这使得目前的设定特别重要。这项指标有助于追踪比特币已实现市值的较长期变化,并让我们了解资本何时开始更一致地在链上流通。历史上,更具建设性的讯号之一出现在该指标**至少连续两周保持在零以上**的时候。当情况如此时,通常与**牛市环境**相吻合,暗示新的需求正在进入,而资本再次支撑市场结构。然而,仍需考虑一个重要风险。在过去的周期中,首次尝试转为正值并不总是会直接导向延续。**已实现资本冲动**有时会表现得像是一种阻力。在这些情况下,比特币要嘛在反弹前形成**更高的低点**,要嘛如我们在2018年所见那样,进入另一段下跌走势。这也使得未来几天对链上分析特别关键。现在的核心问题是:指标能否在持续的资本流入下守在零之上,还是会出现新的卖压并迫使其再次被打回?如果它能够维持在正值,这将是整体比特币周期非常具建设性的讯号。想要存取这项指标,以及涵盖链上数据、衍生品、清算、宏观与市场结构的1,500+项指标吗?使用代码 BEAR50 在限时内享有 Alphractal **五折(50% OFF)**。https://app.alphractal.com/plans?utm_source=coinmarketcap&utm_medium=update&utm_campaign=founding_access&utm_content=ceo_joao
73
·
--
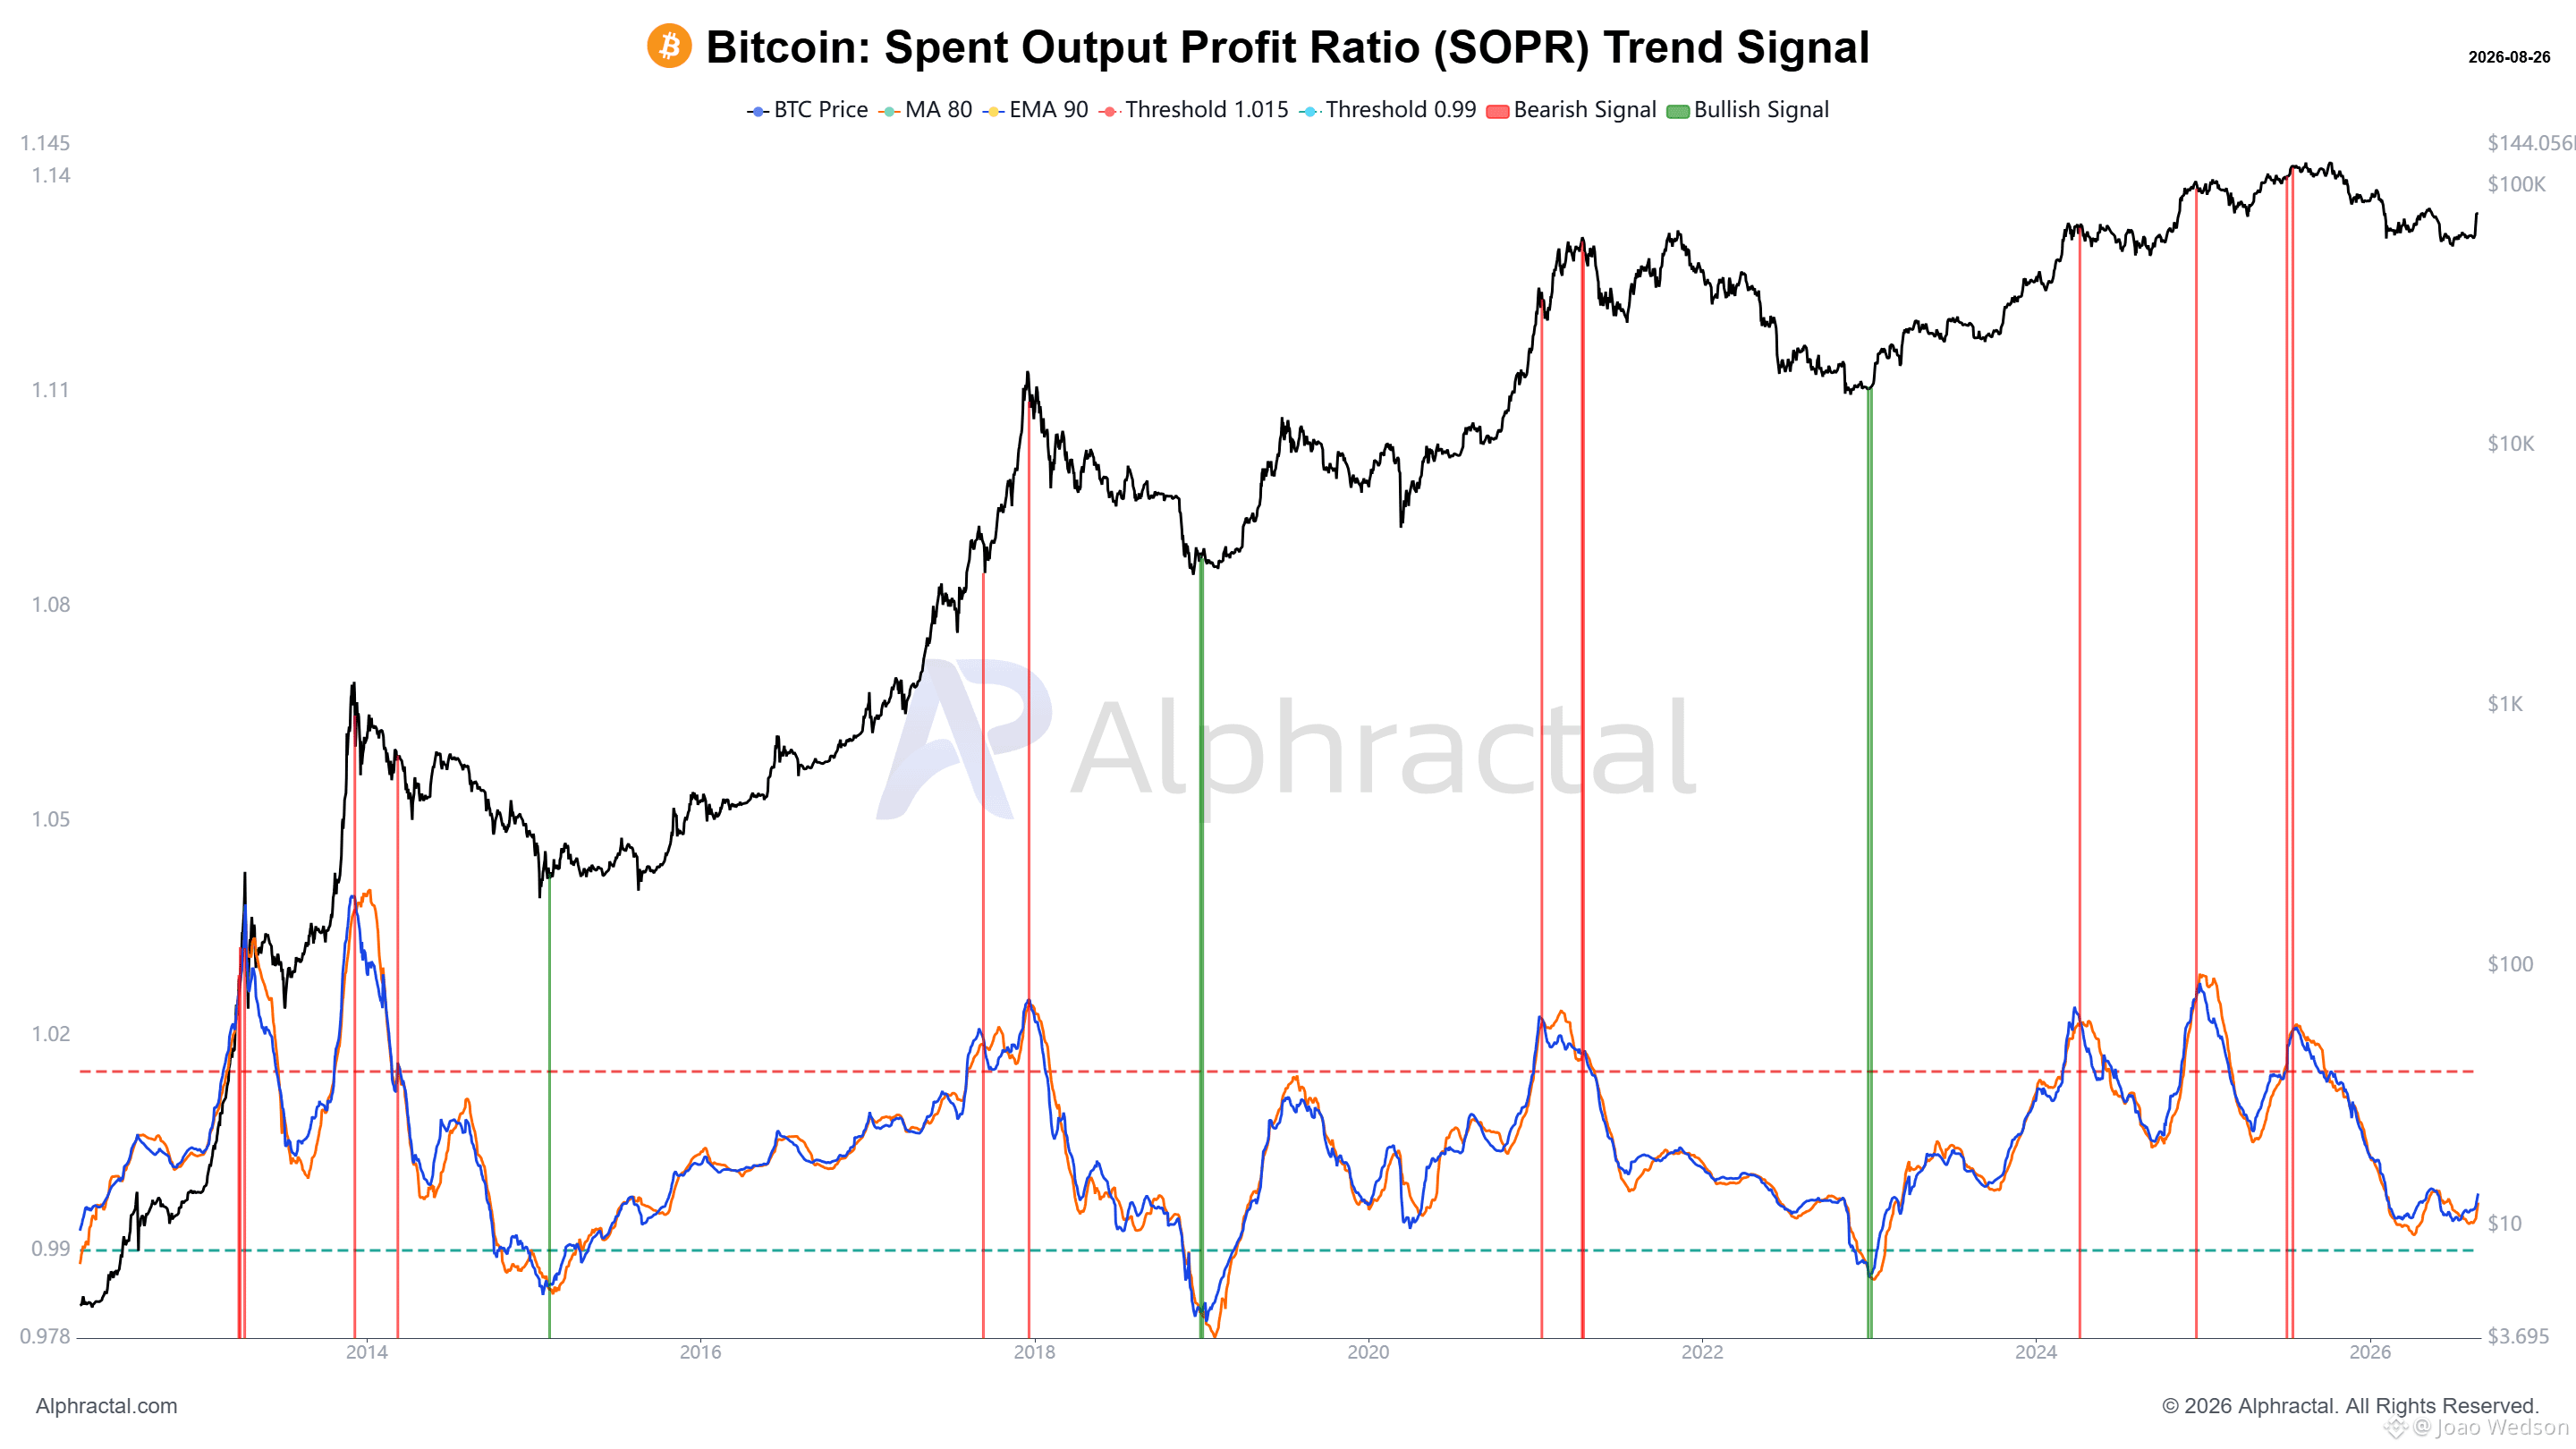
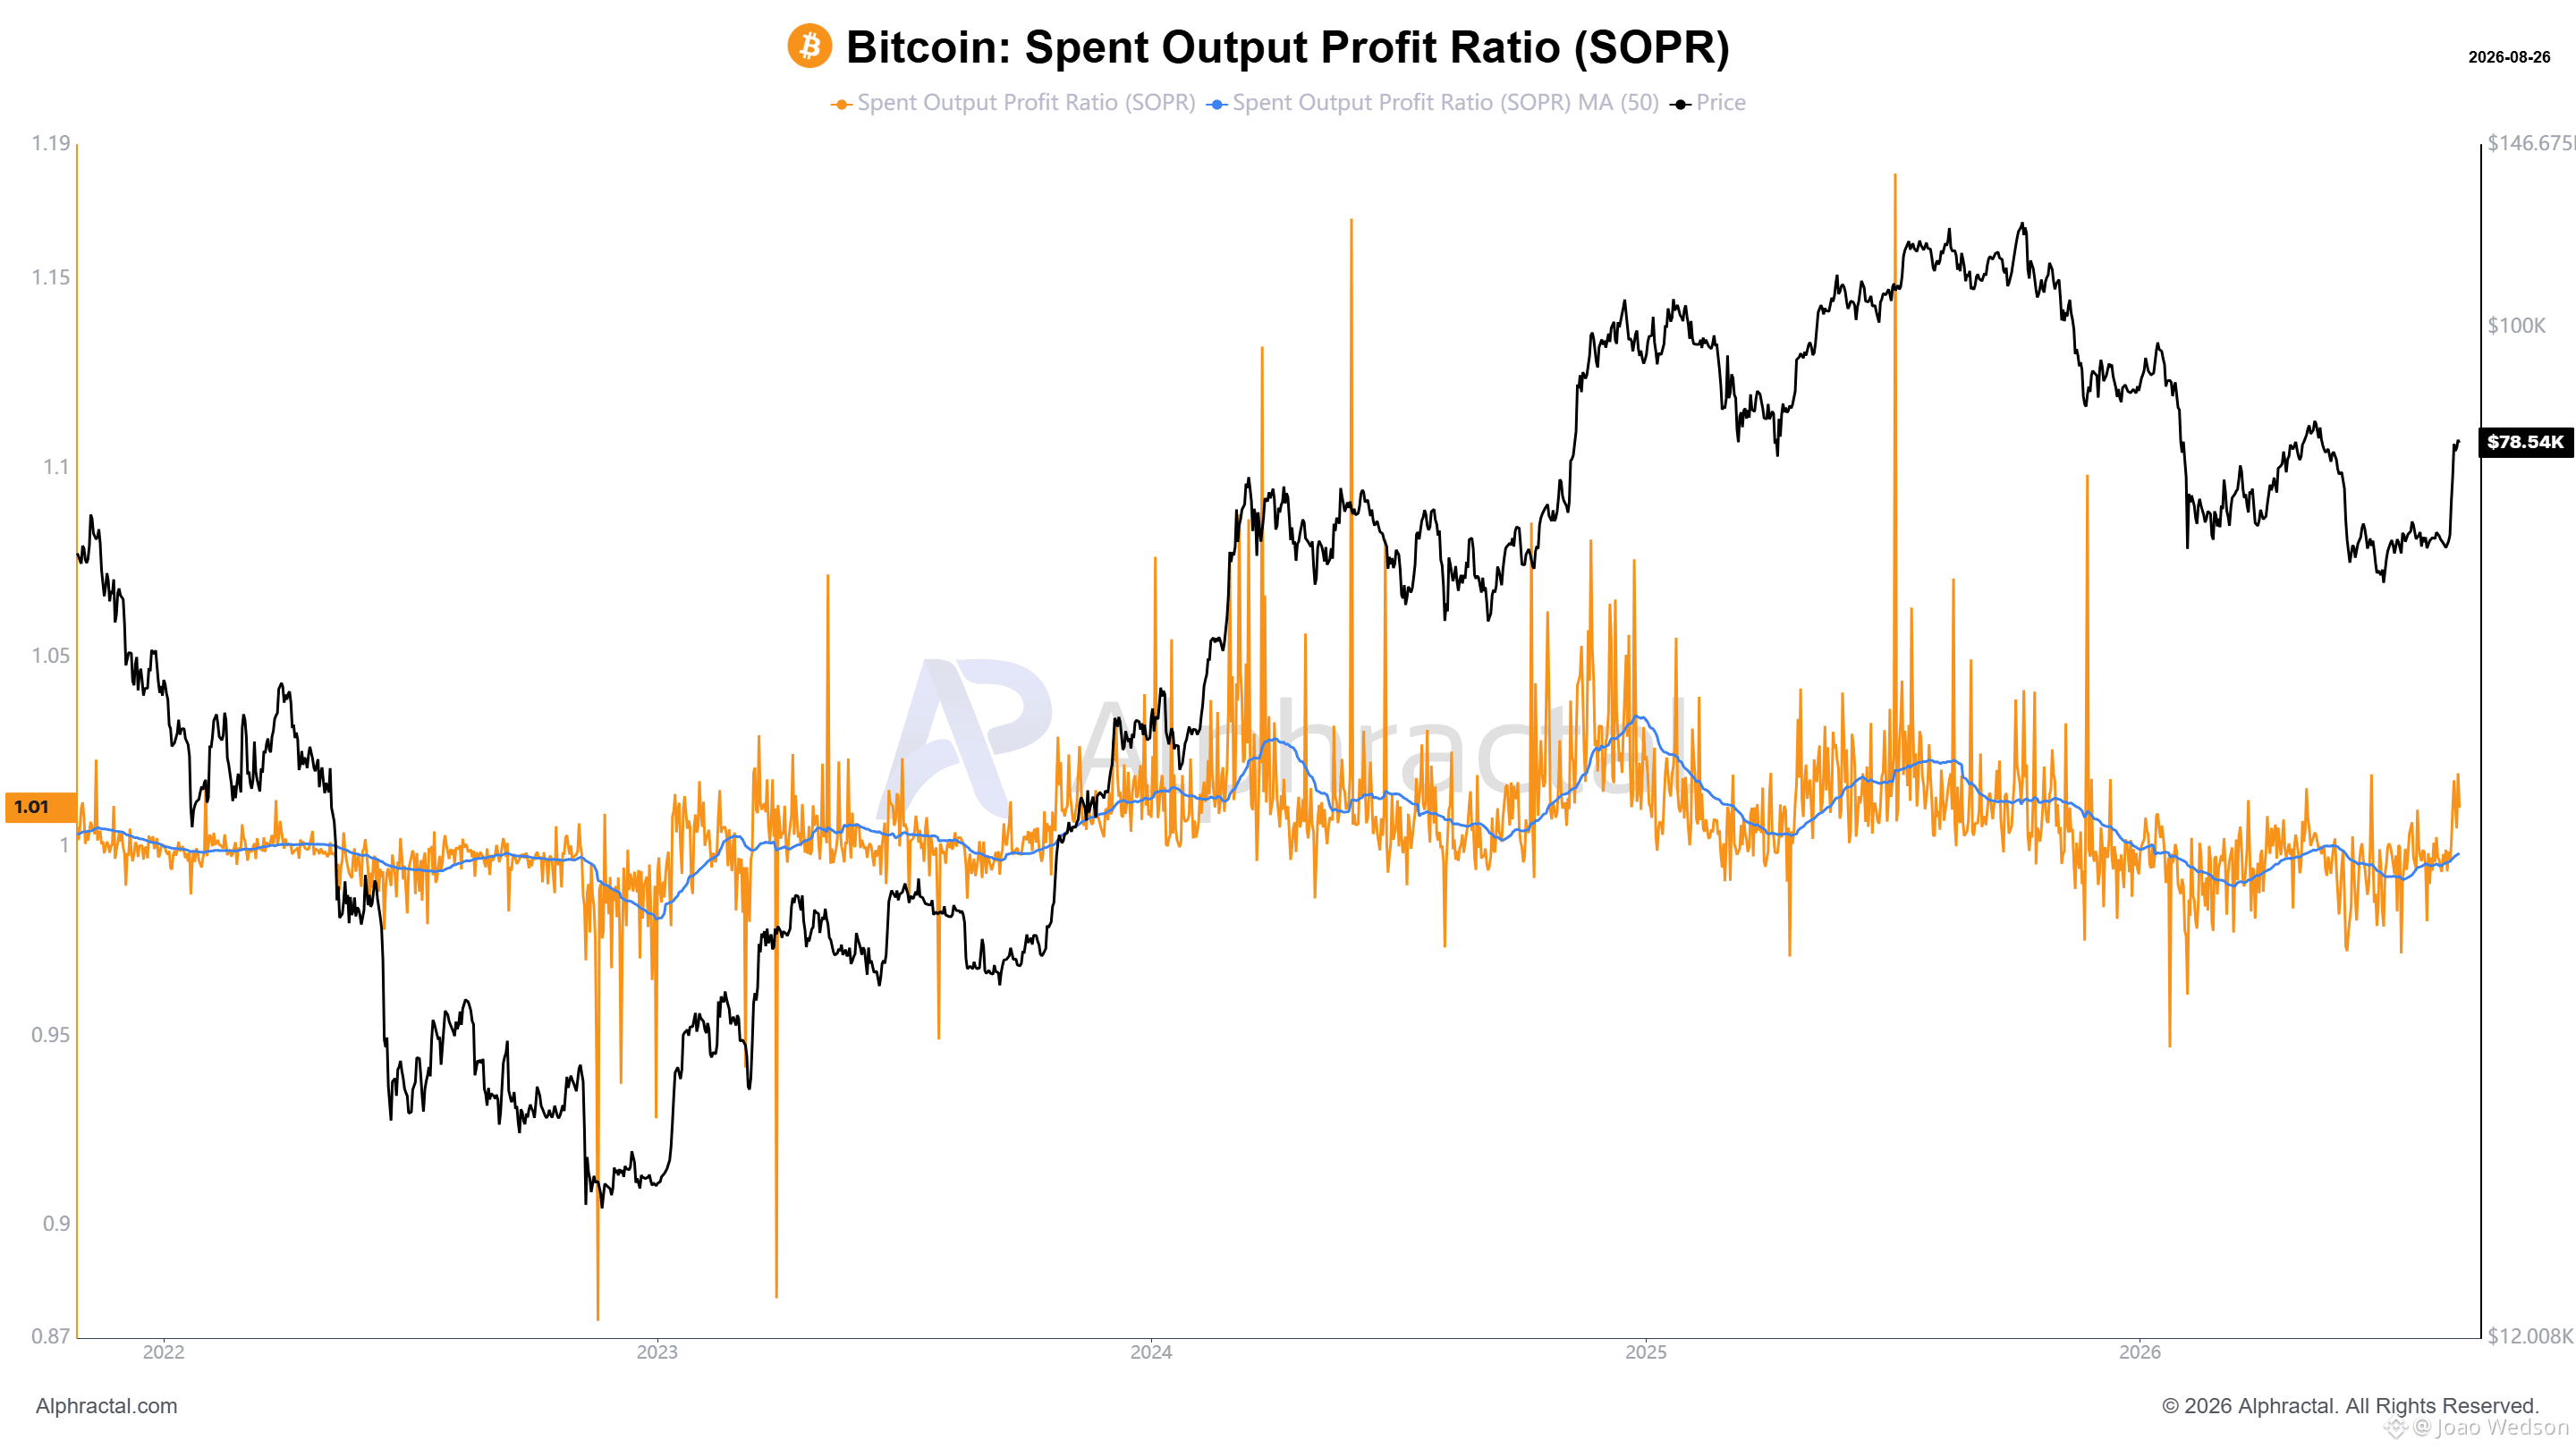
⚠️链上支出仍在以以获利为主的情况下持续发生。到目前为止,在这一轮最新的看跌循环中,我们尚未看到像 2022 年那样出现大规模、在重大亏损下的动向。我并不是说这种情况一定会发生。我只是分享目前正在比特币区块链上发生的事情。而 SOPR 趋势讯号(历史上曾提供非常出色的中期与长期买入/卖出讯号)仍然没有产生看涨讯号。值得注意的是,这个讯号在过去每一次主要价格底部附近都曾出现。所以我们应该要问的问题是:比特币还会不会再度下跌,还是这类机会讯号这次根本不会再回来?以我的做法,我更倾向于再耐心等一点,等到更明确之后再宣告牛市已经开始——而不是像许多人那样现在就下结论。 🔥把握 Alphractal 的免费试用!那里可能正有无数讯号在等著你。市场对于那些行动太早的人并不宽容。而且是的,本周仍可享有任何方案 50% 的折扣。每一个方案都包含:讯号(Signals)、MCP、Alpha AI 的 Telegram Bot、Email/Telegram 警报、Workbench,以及整个宇宙般的工具与洞察。 https://app.alphractal.com/plans?utm_source=coinmarketcap&utm_medium=update&utm_campaign=founding_access&utm_content=ceo_joao
⚠️链上支出仍在以以获利为主的情况下持续发生。到目前为止,在这一轮最新的看跌循环中,我们尚未看到像 2022 年那样出现大规模、在重大亏损下的动向。我并不是说这种情况一定会发生。我只是分享目前正在比特币区块链上发生的事情。而 SOPR 趋势讯号(历史上曾提供非常出色的中期与长期买入/卖出讯号)仍然没有产生看涨讯号。值得注意的是,这个讯号在过去每一次主要价格底部附近都曾出现。所以我们应该要问的问题是:比特币还会不会再度下跌,还是这类机会讯号这次根本不会再回来?以我的做法,我更倾向于再耐心等一点,等到更明确之后再宣告牛市已经开始——而不是像许多人那样现在就下结论。 🔥把握 Alphractal 的免费试用!那里可能正有无数讯号在等著你。市场对于那些行动太早的人并不宽容。而且是的,本周仍可享有任何方案 50% 的折扣。每一个方案都包含:讯号(Signals)、MCP、Alpha AI 的 Telegram Bot、Email/Telegram 警报、Workbench,以及整个宇宙般的工具与洞察。 https://app.alphractal.com/plans?utm_source=coinmarketcap&utm_medium=update&utm_campaign=founding_access&utm_content=ceo_joao
71
·
--
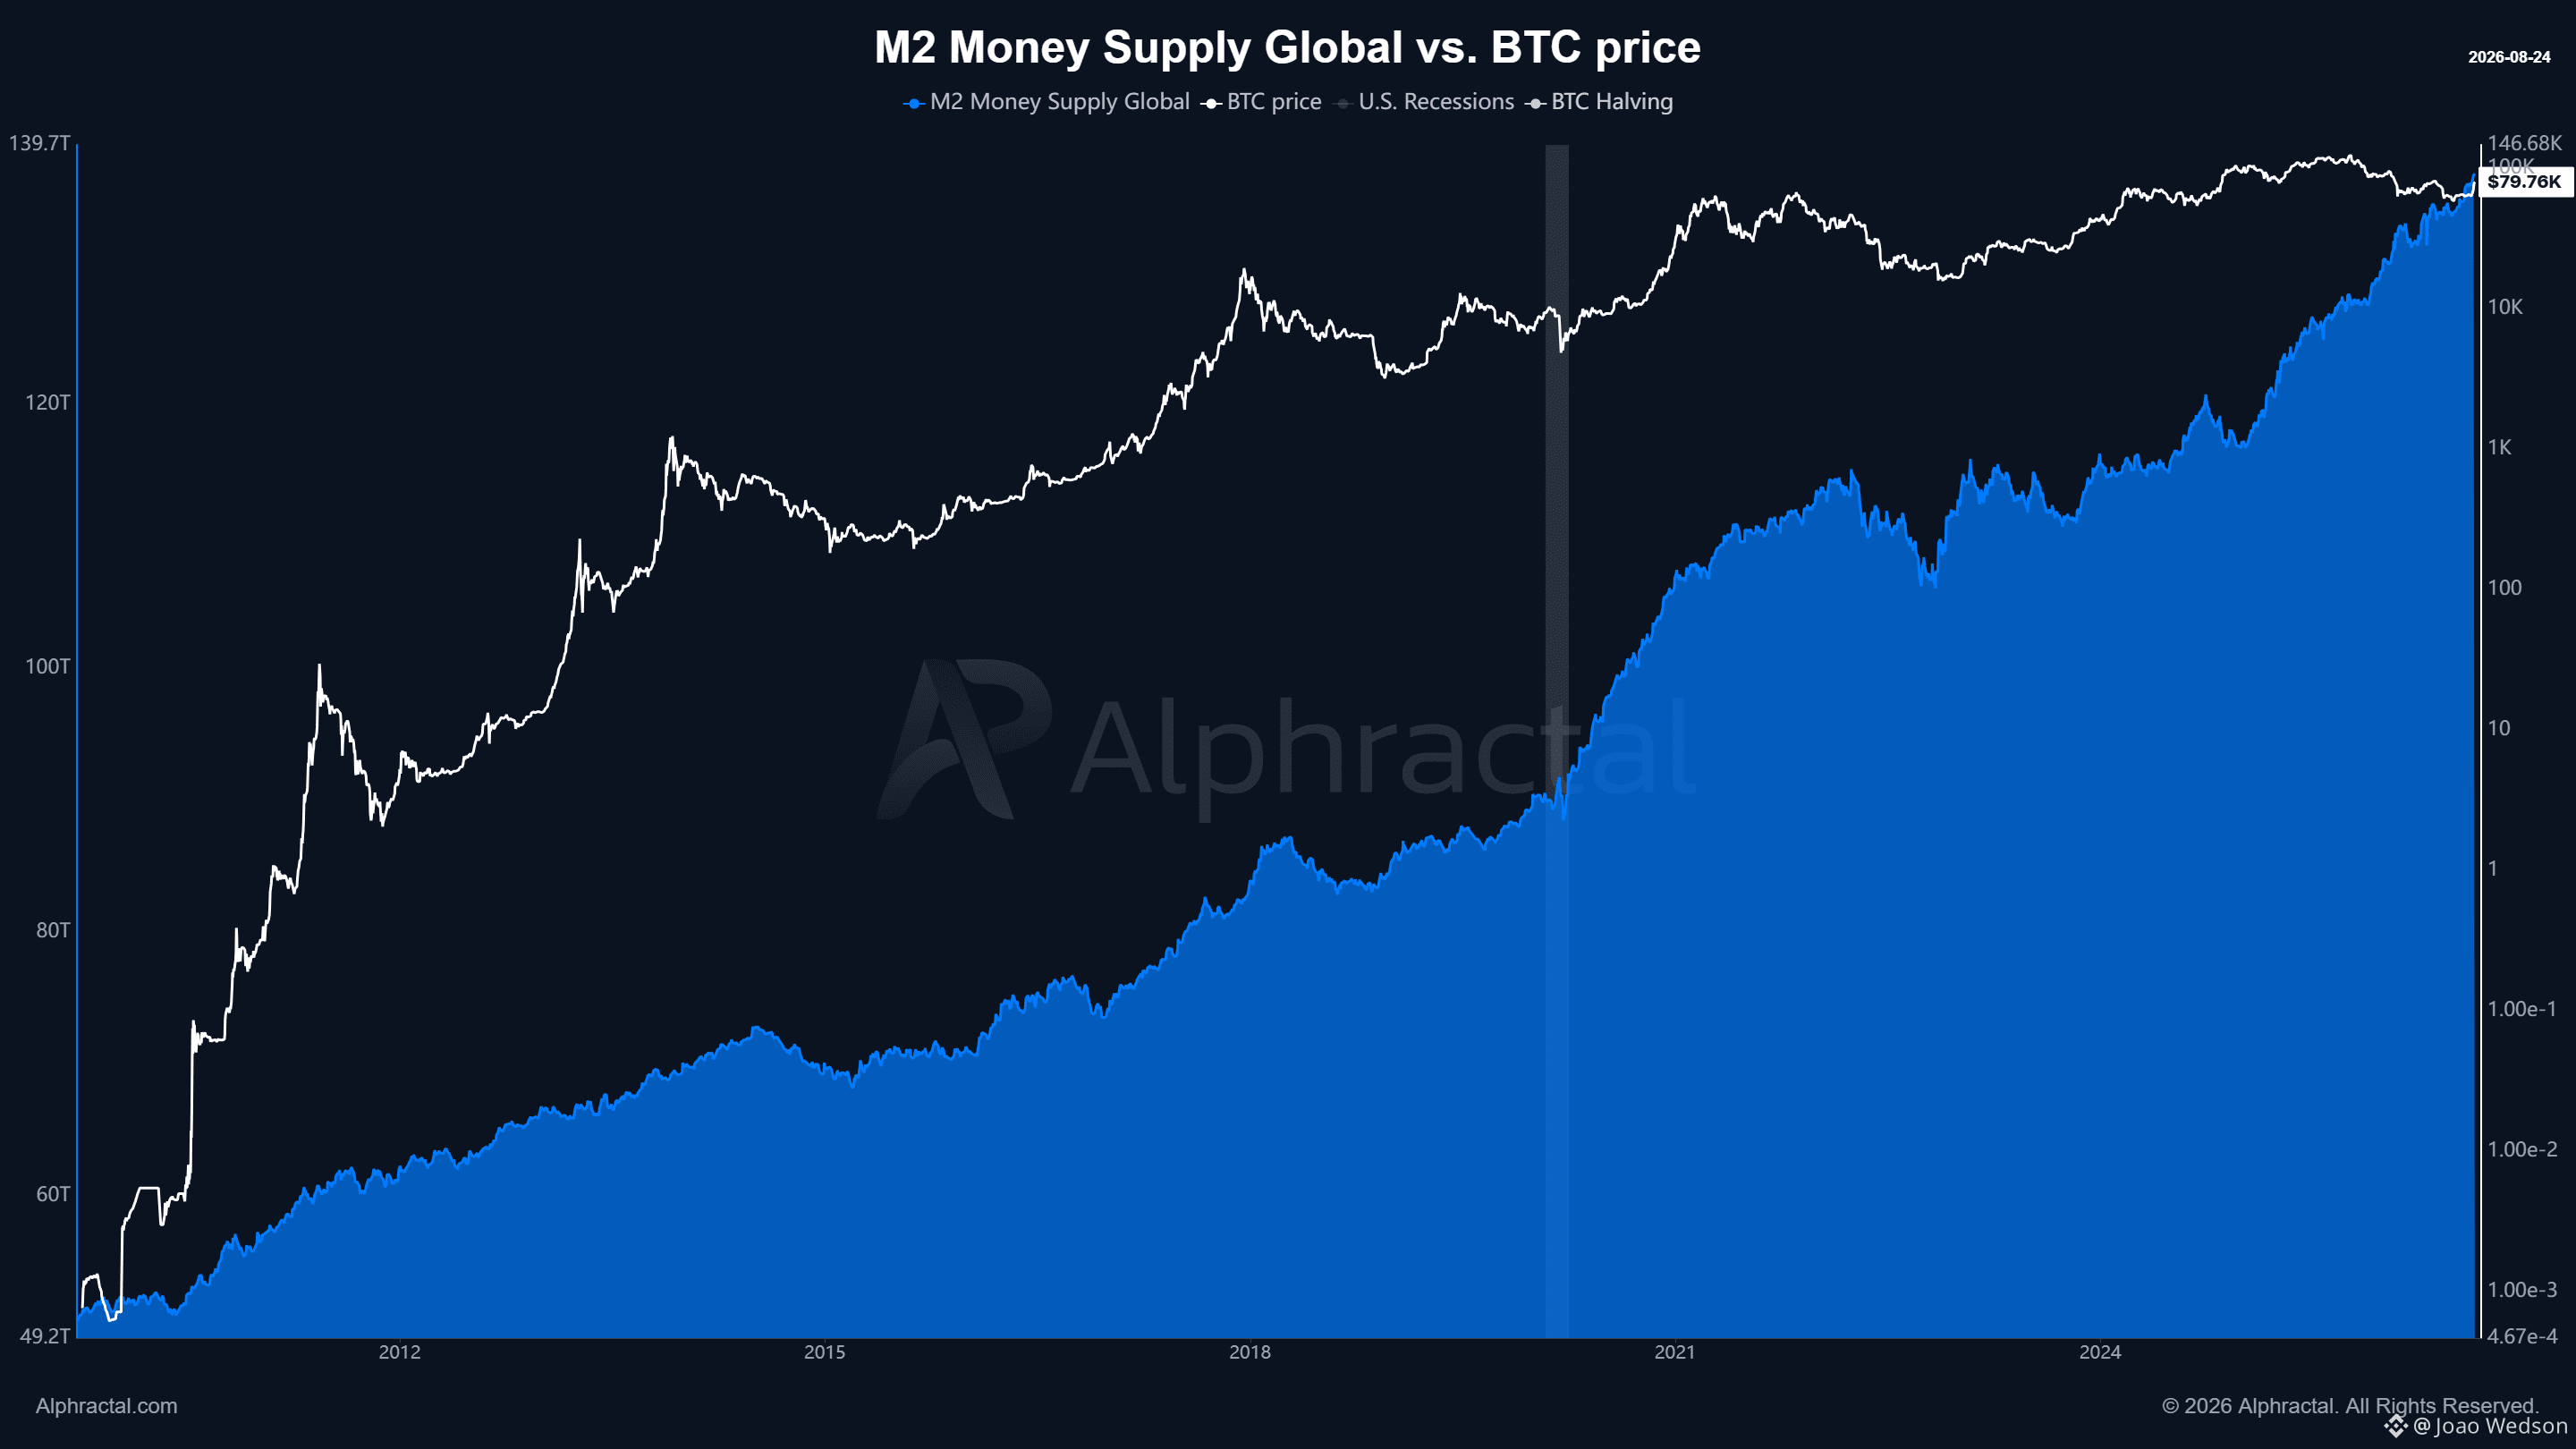
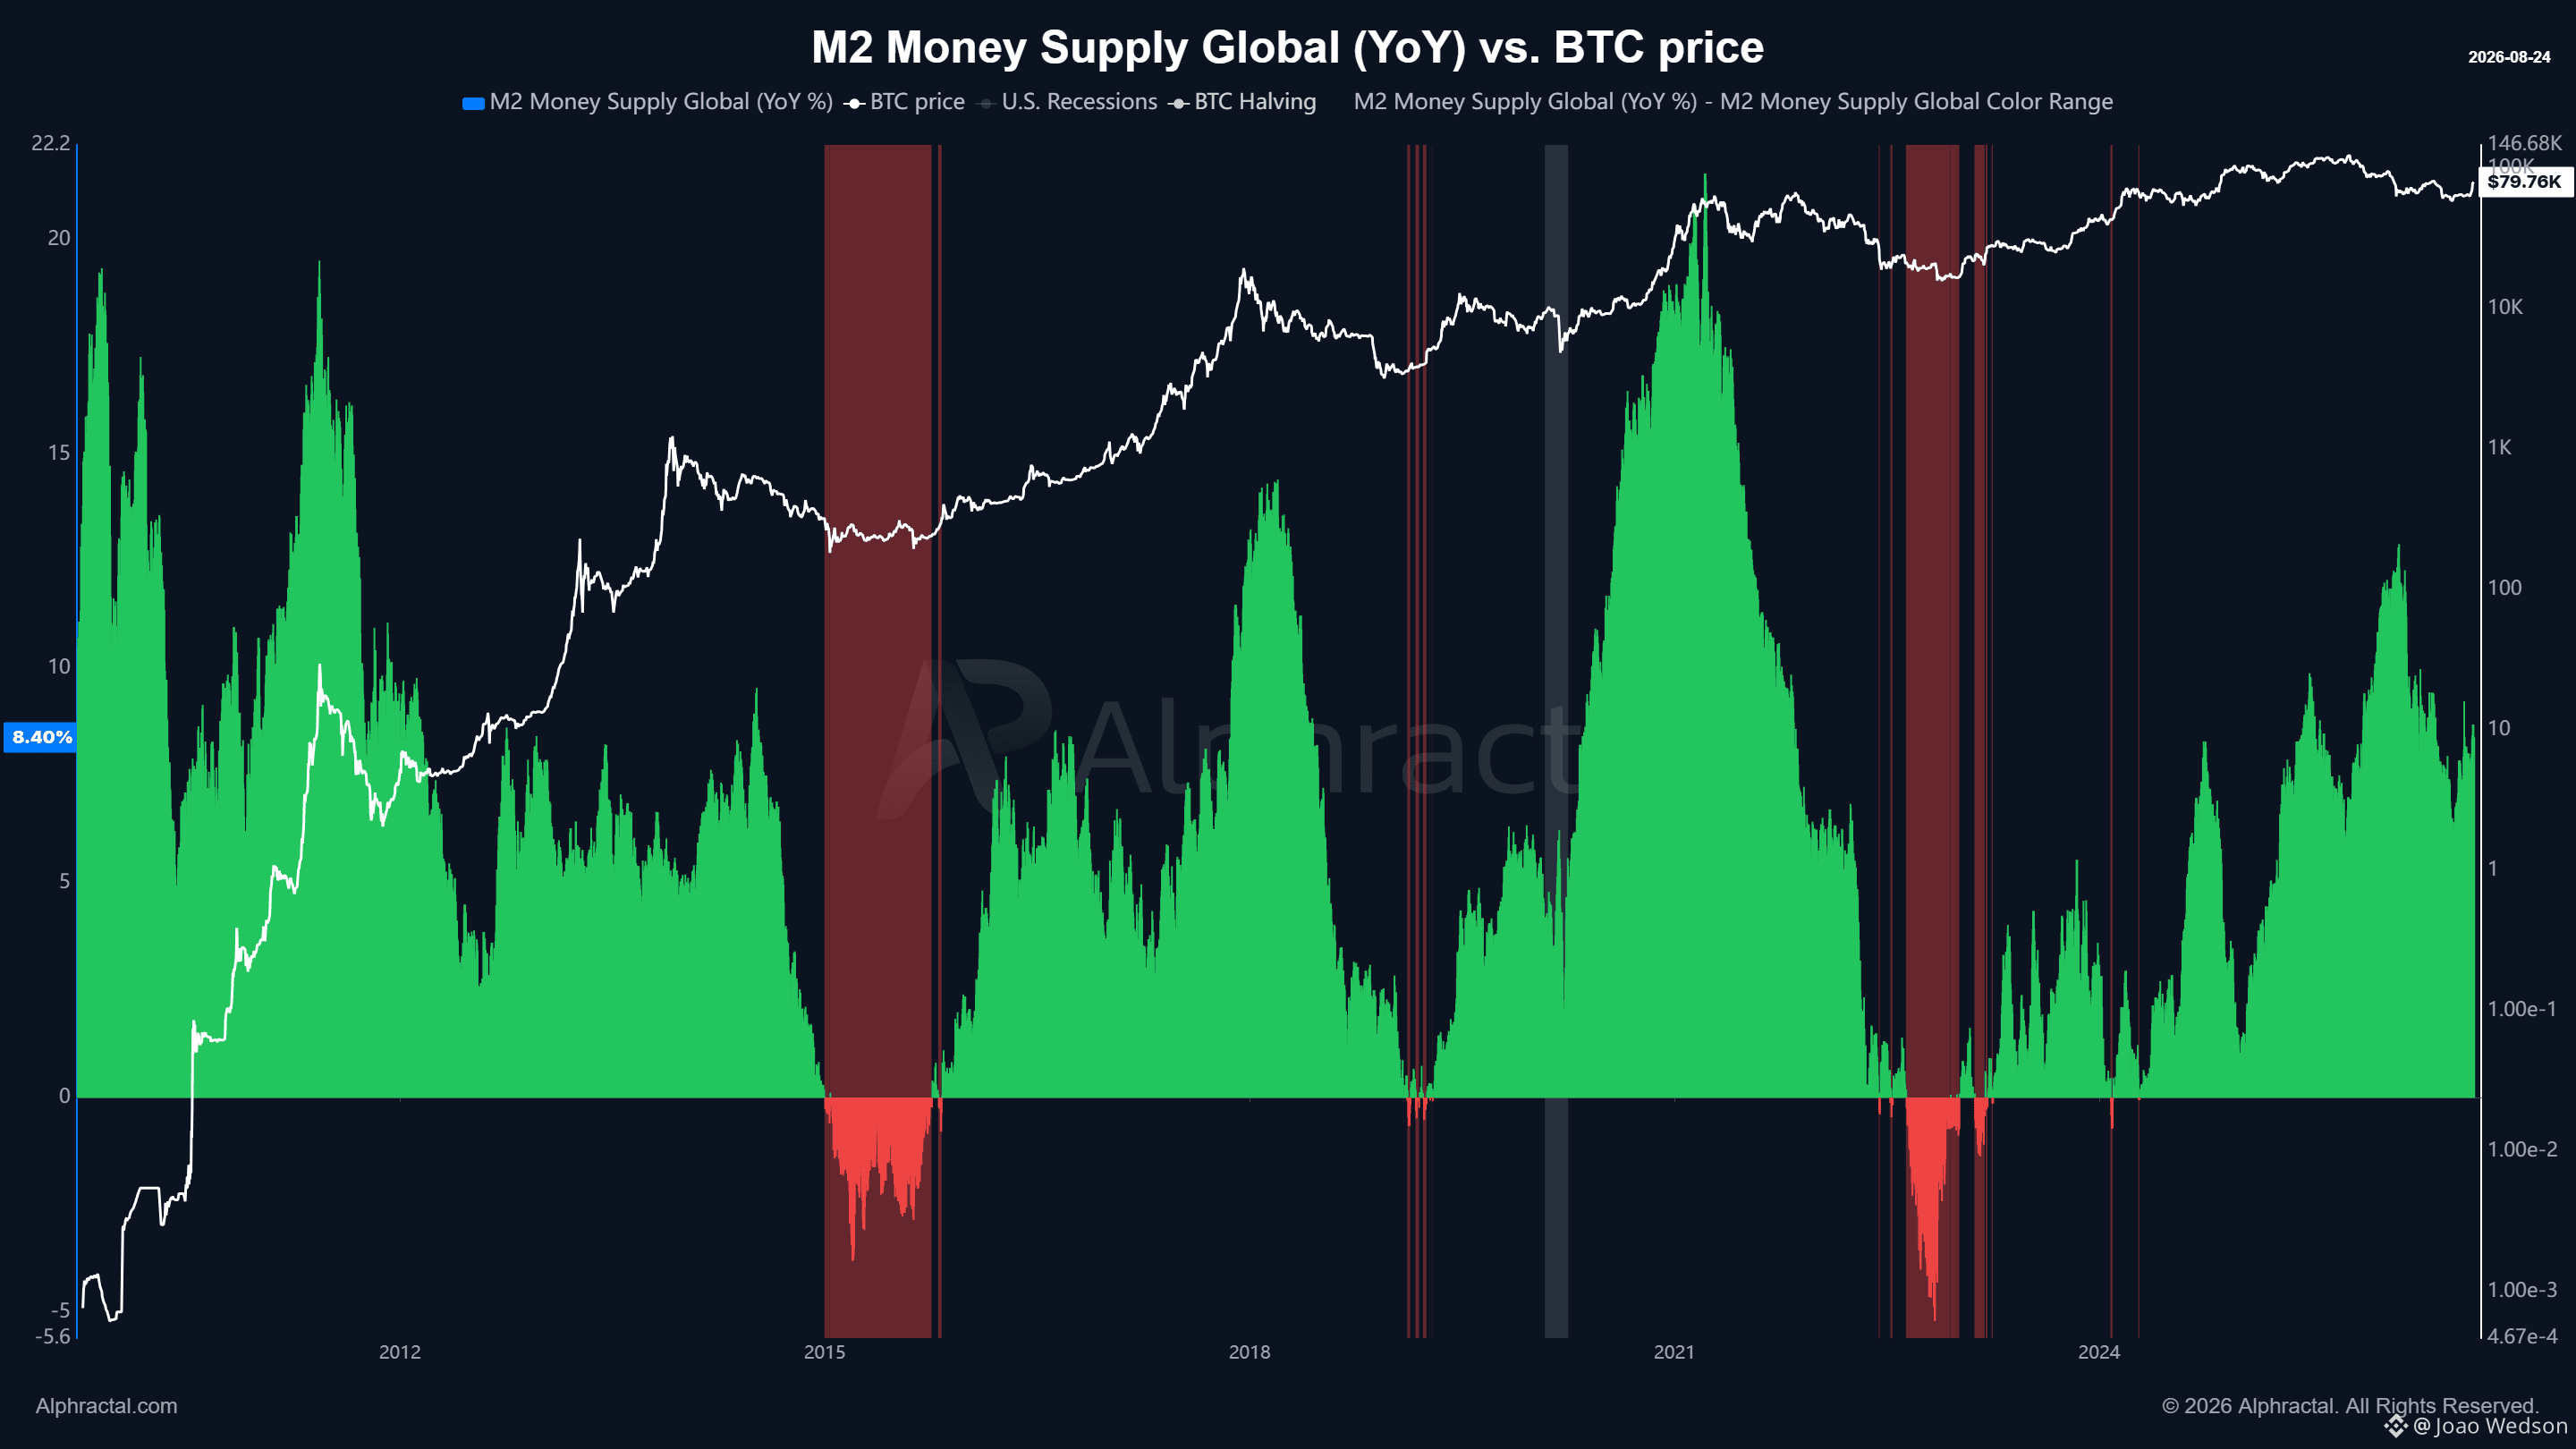
全球 M2 正在讲述一个有趣的故事。
在过去 3 次主要的比特币熊市循环中,全球 M2 年增率(YoY)下滑至负值区间时,与 BTC 的价格底部高度同步:
2015
2018–2019
2022
每一次,当全球流动性成长达到最弱点时,比特币早已接近其循环低点。
但今天的情况截然不同。
全球 M2 的年增率(YoY)仍然强劲为正,约 8.4%,而比特币目前交易在约 80K 美元附近。
如果历史能够呼应,那么这是一个值得密切关注的重大宏观背离。
立刻把握限时所有方案 5 折优惠!
app.alphractal.com
全球 M2 正在讲述一个有趣的故事。
在过去 3 次主要的比特币熊市循环中,全球 M2 年增率(YoY)下滑至负值区间时,与 BTC 的价格底部高度同步:
2015
2018–2019
2022
每一次,当全球流动性成长达到最弱点时,比特币早已接近其循环低点。
但今天的情况截然不同。
全球 M2 的年增率(YoY)仍然强劲为正,约 8.4%,而比特币目前交易在约 80K 美元附近。
如果历史能够呼应,那么这是一个值得密切关注的重大宏观背离。
立刻把握限时所有方案 5 折优惠!
app.alphractal.com
在过去 3 次主要的比特币熊市循环中,全球 M2 年增率(YoY)下滑至负值区间时,与 BTC 的价格底部高度同步:
2015
2018–2019
2022
每一次,当全球流动性成长达到最弱点时,比特币早已接近其循环低点。
但今天的情况截然不同。
全球 M2 的年增率(YoY)仍然强劲为正,约 8.4%,而比特币目前交易在约 80K 美元附近。
如果历史能够呼应,那么这是一个值得密切关注的重大宏观背离。
立刻把握限时所有方案 5 折优惠!
app.alphractal.com
57
·
--
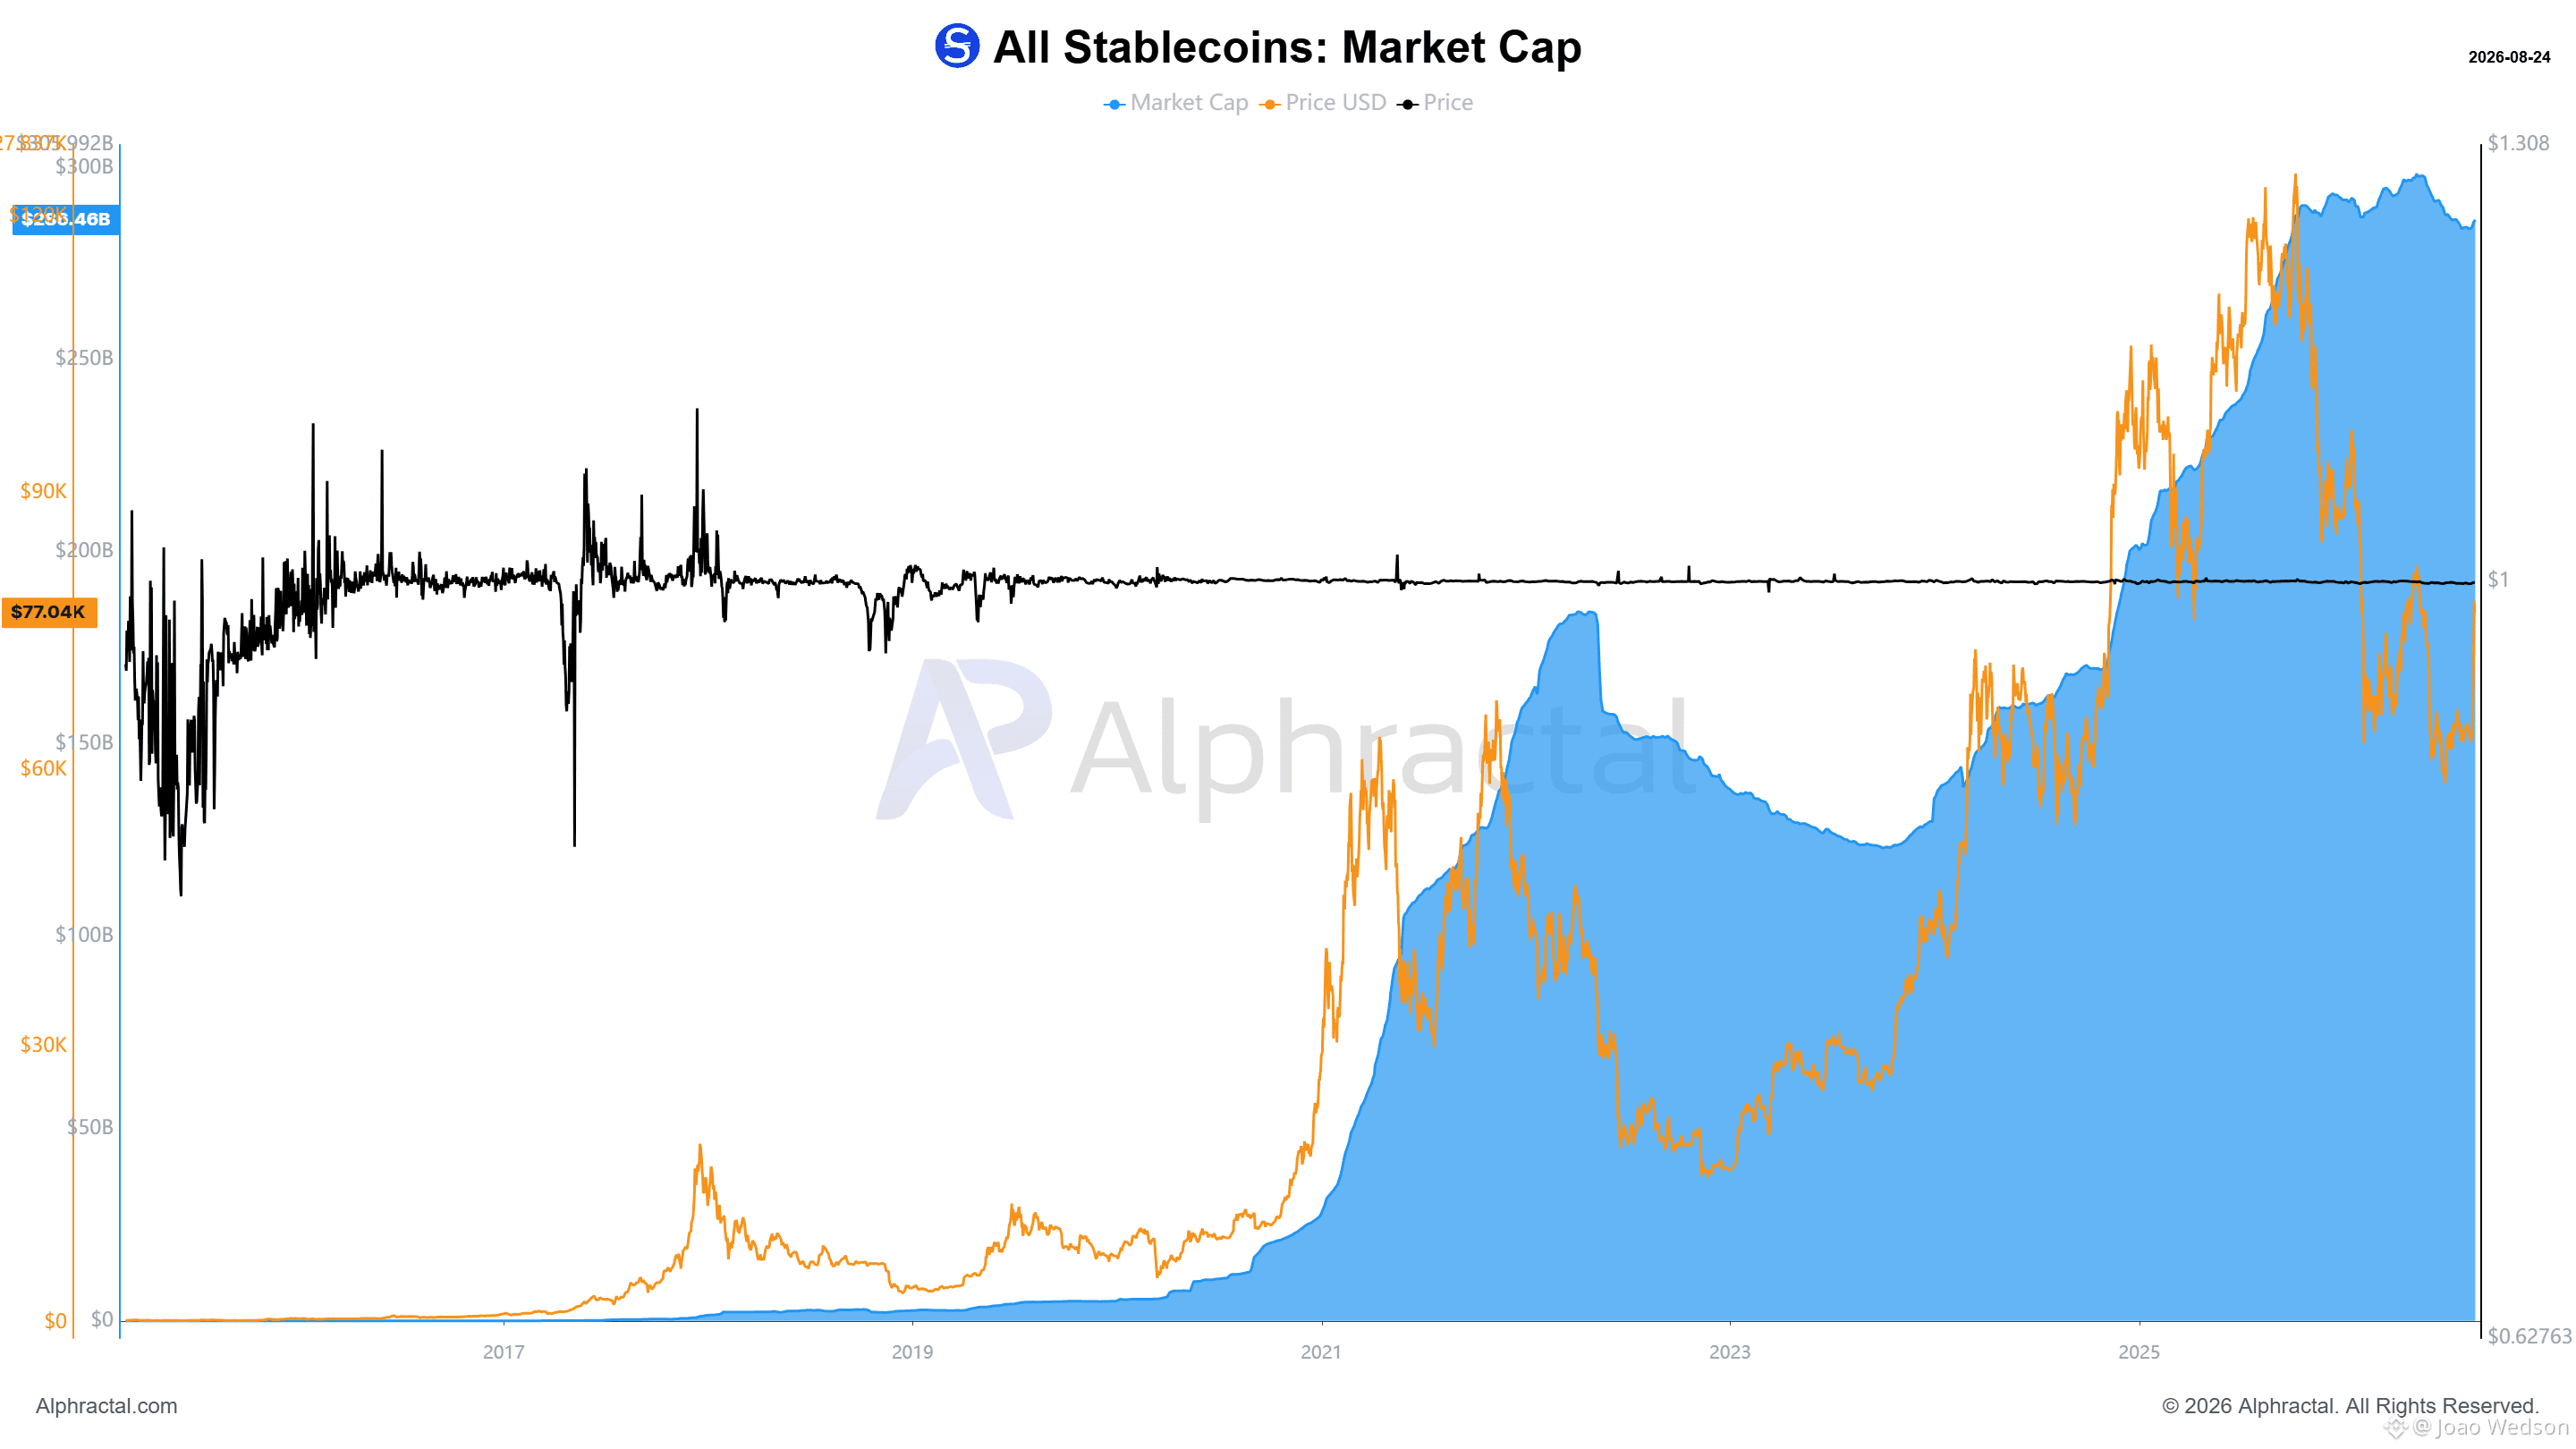
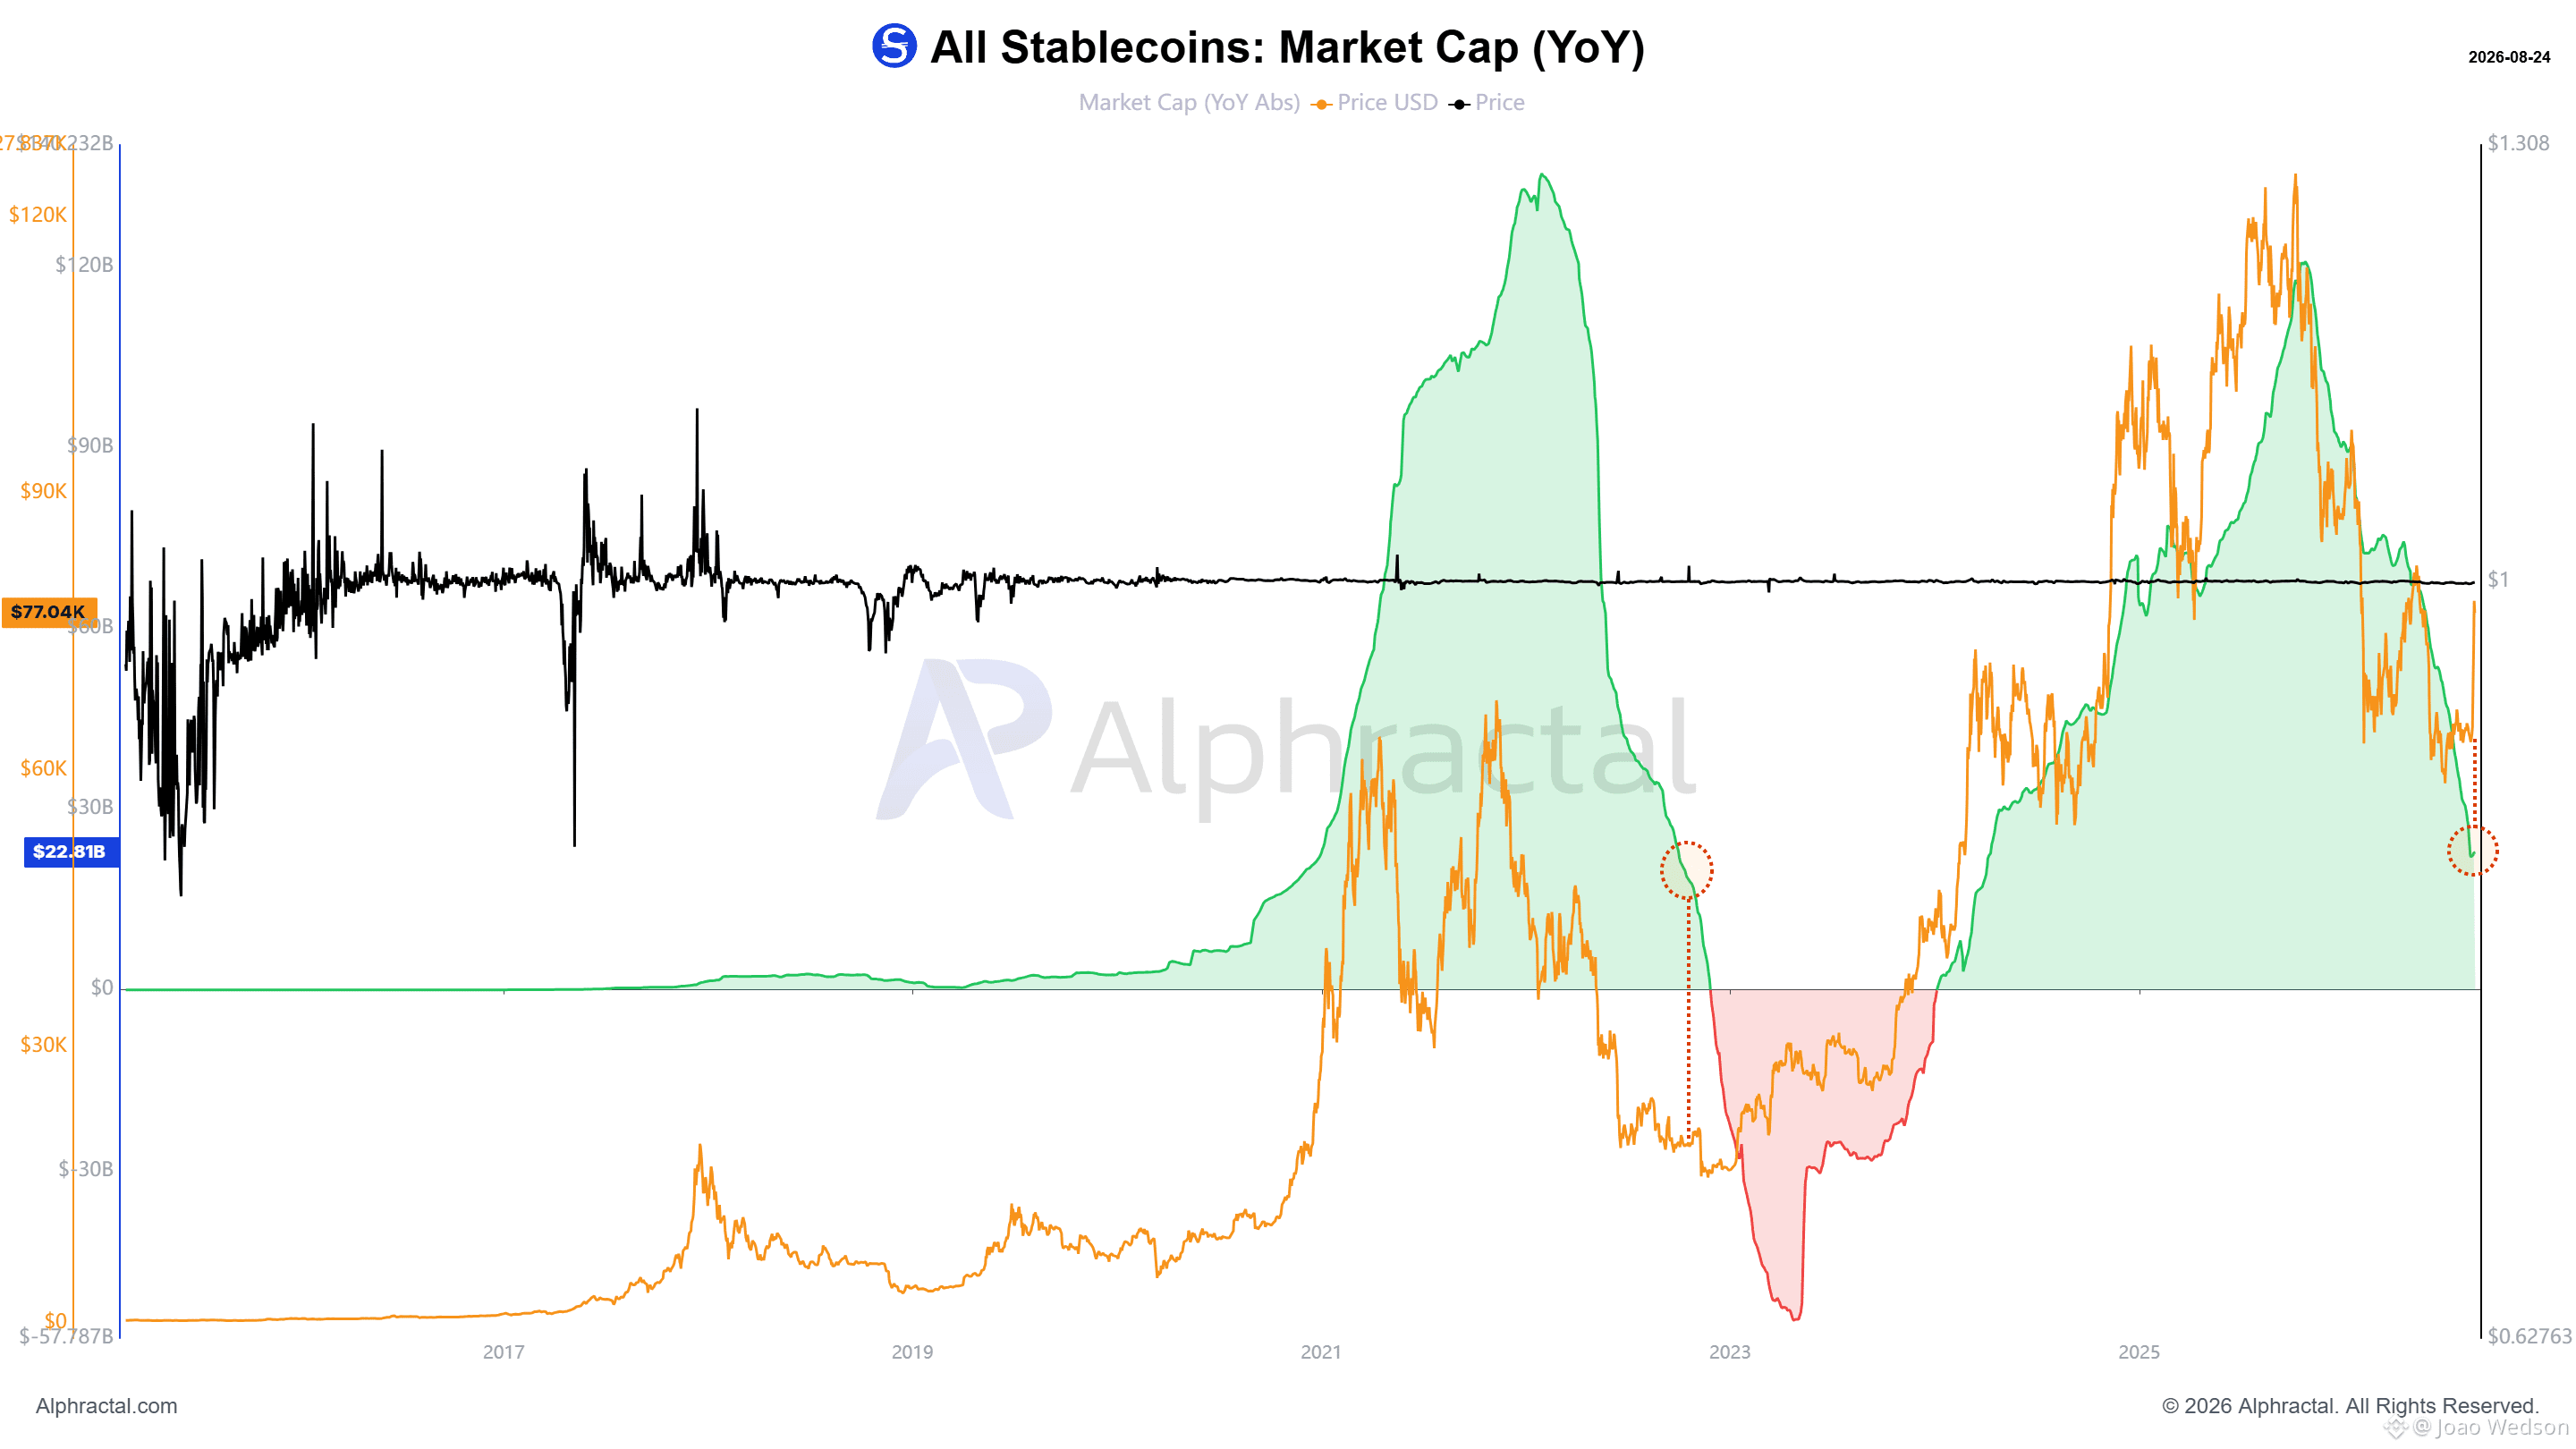
所有稳定币的总市值不再像之前那样持续上升,情况类似于 2022 年年底发生的状况。其年增长率也正逐步转向负值,再次呈现出与 2022 年相似的迹象。稳定币是加密市场的主要流动性引擎之一。他们需要被所有人关注。来源:app.alphractal.com
所有稳定币的总市值不再像之前那样持续上升,情况类似于 2022 年年底发生的状况。其年增长率也正逐步转向负值,再次呈现出与 2022 年相似的迹象。稳定币是加密市场的主要流动性引擎之一。他们需要被所有人关注。来源:app.alphractal.com
73
·
--
⚠️有一个新的风险信号正在针对比特币出现,某个时点可能还会发生另一波多头清算潮。
首先,看看未平仓合约(Open Interest)。
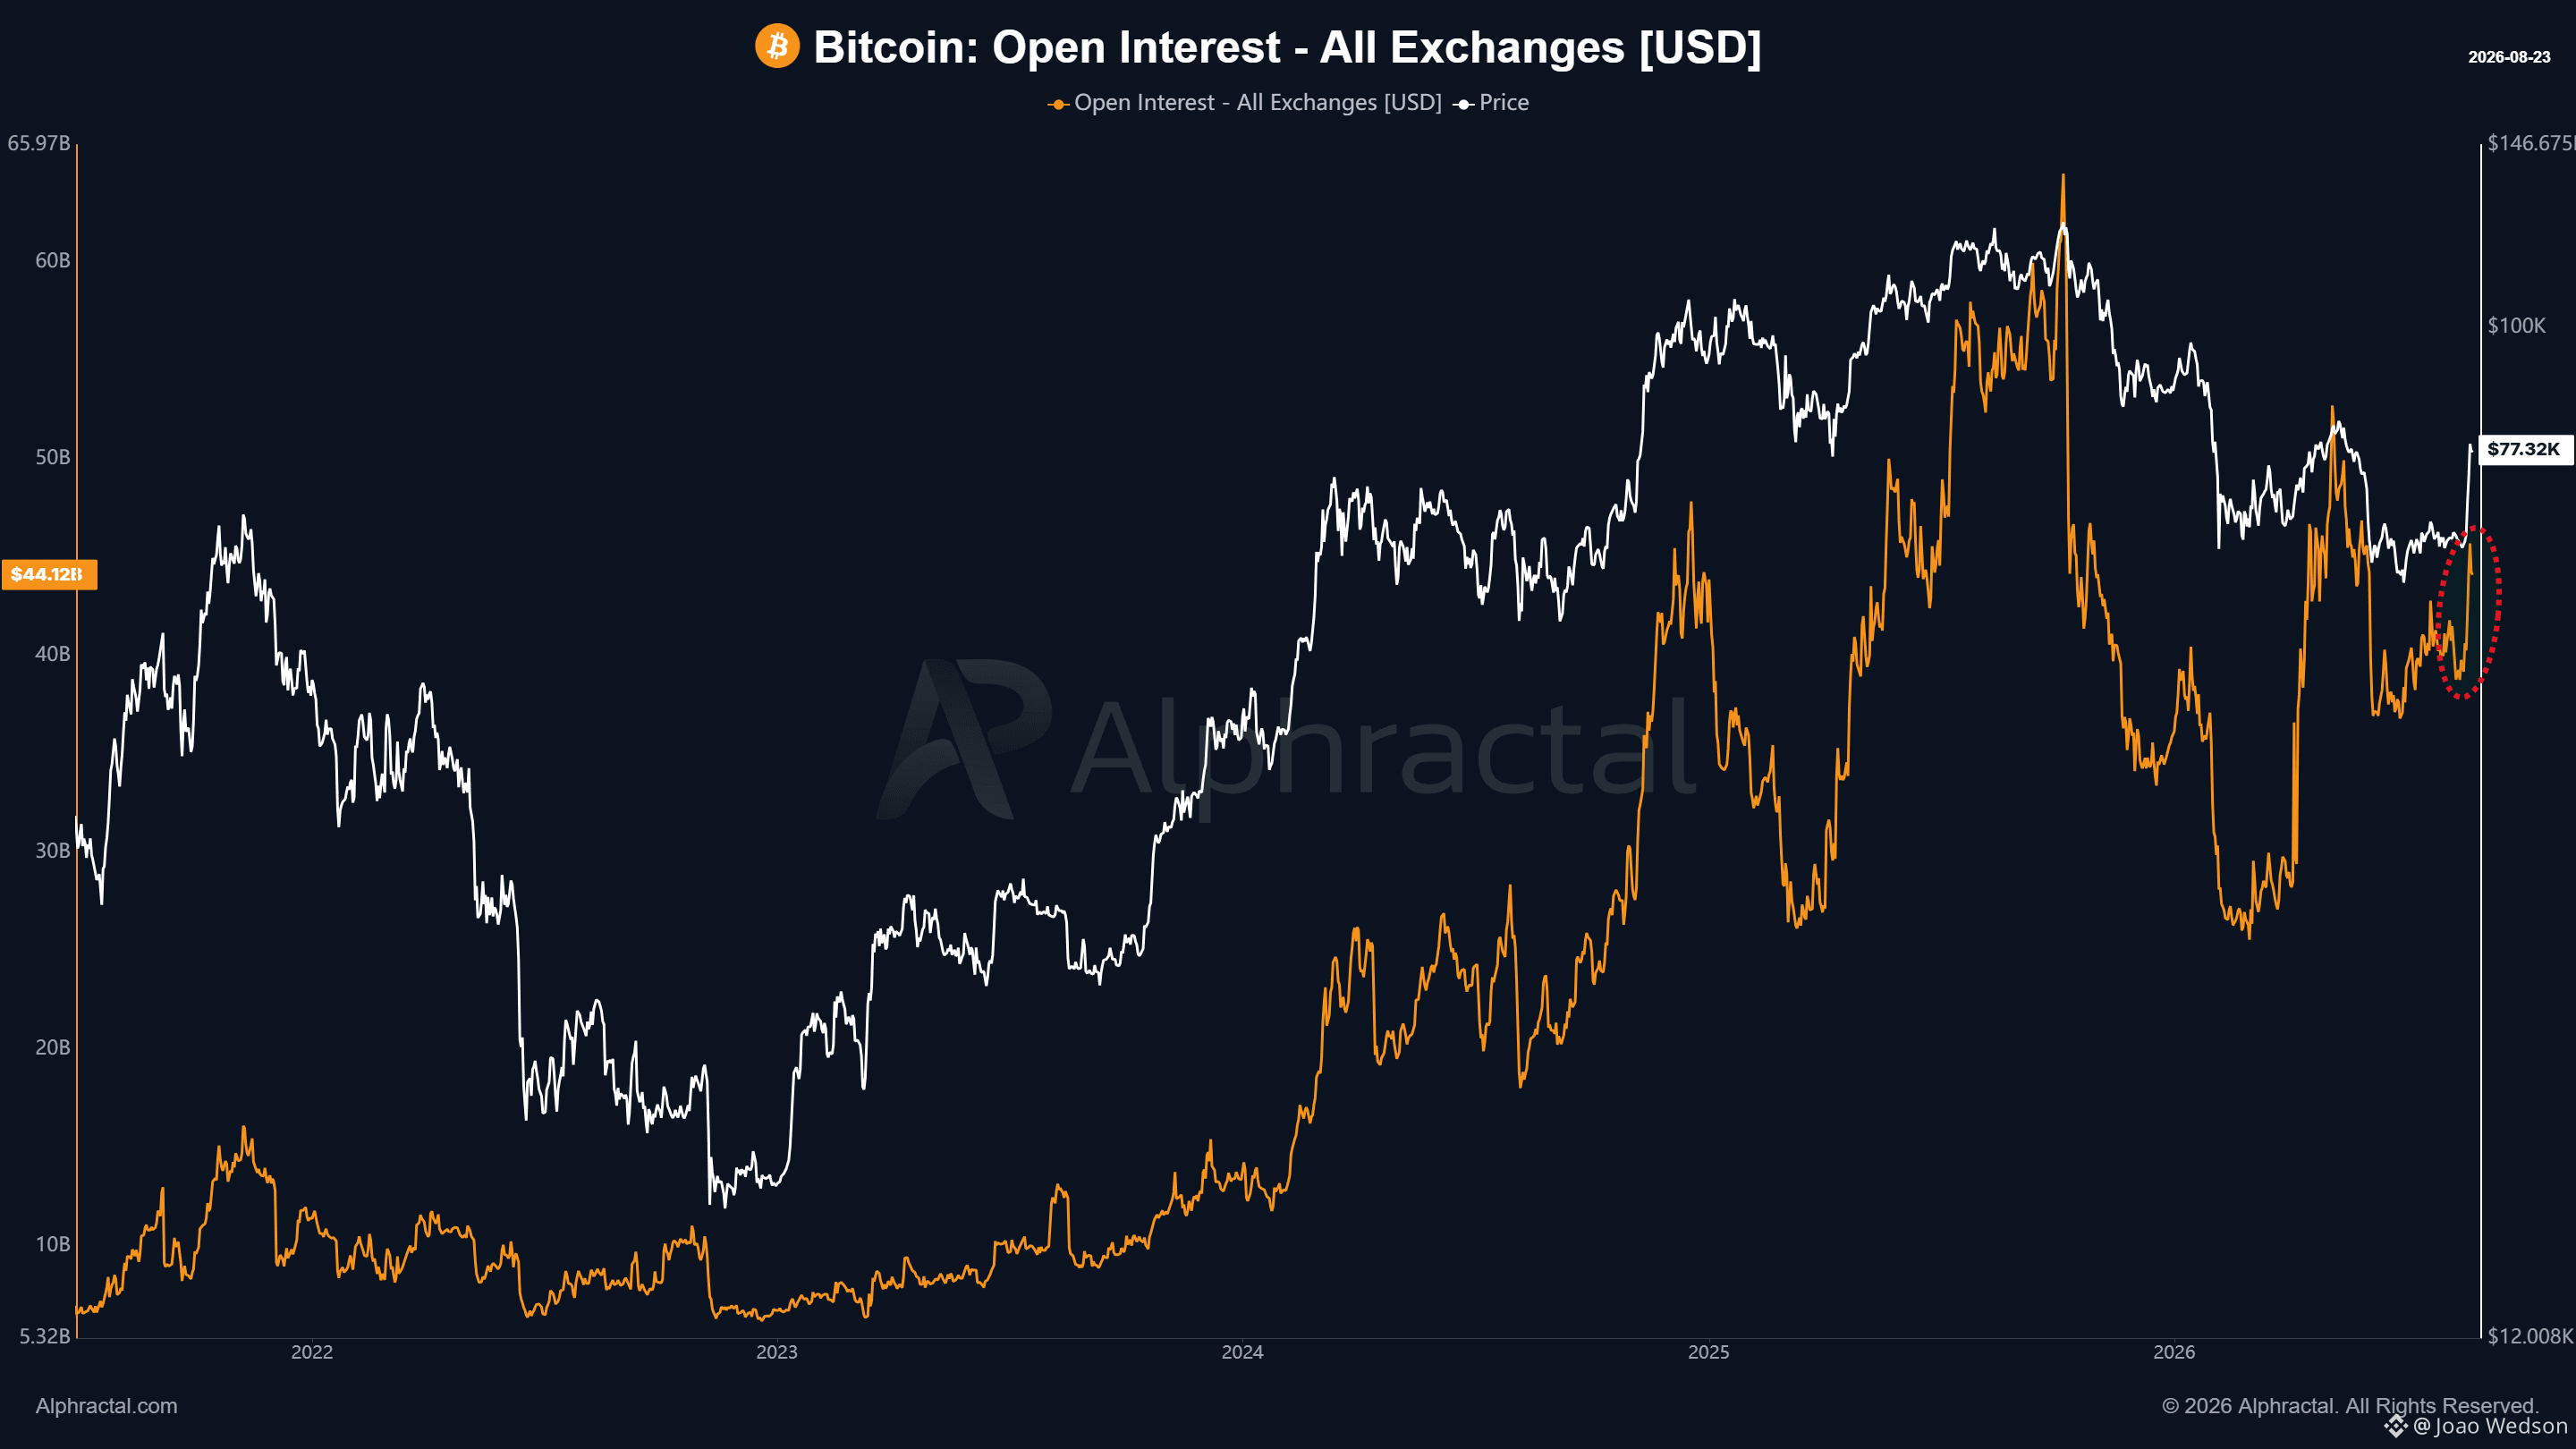
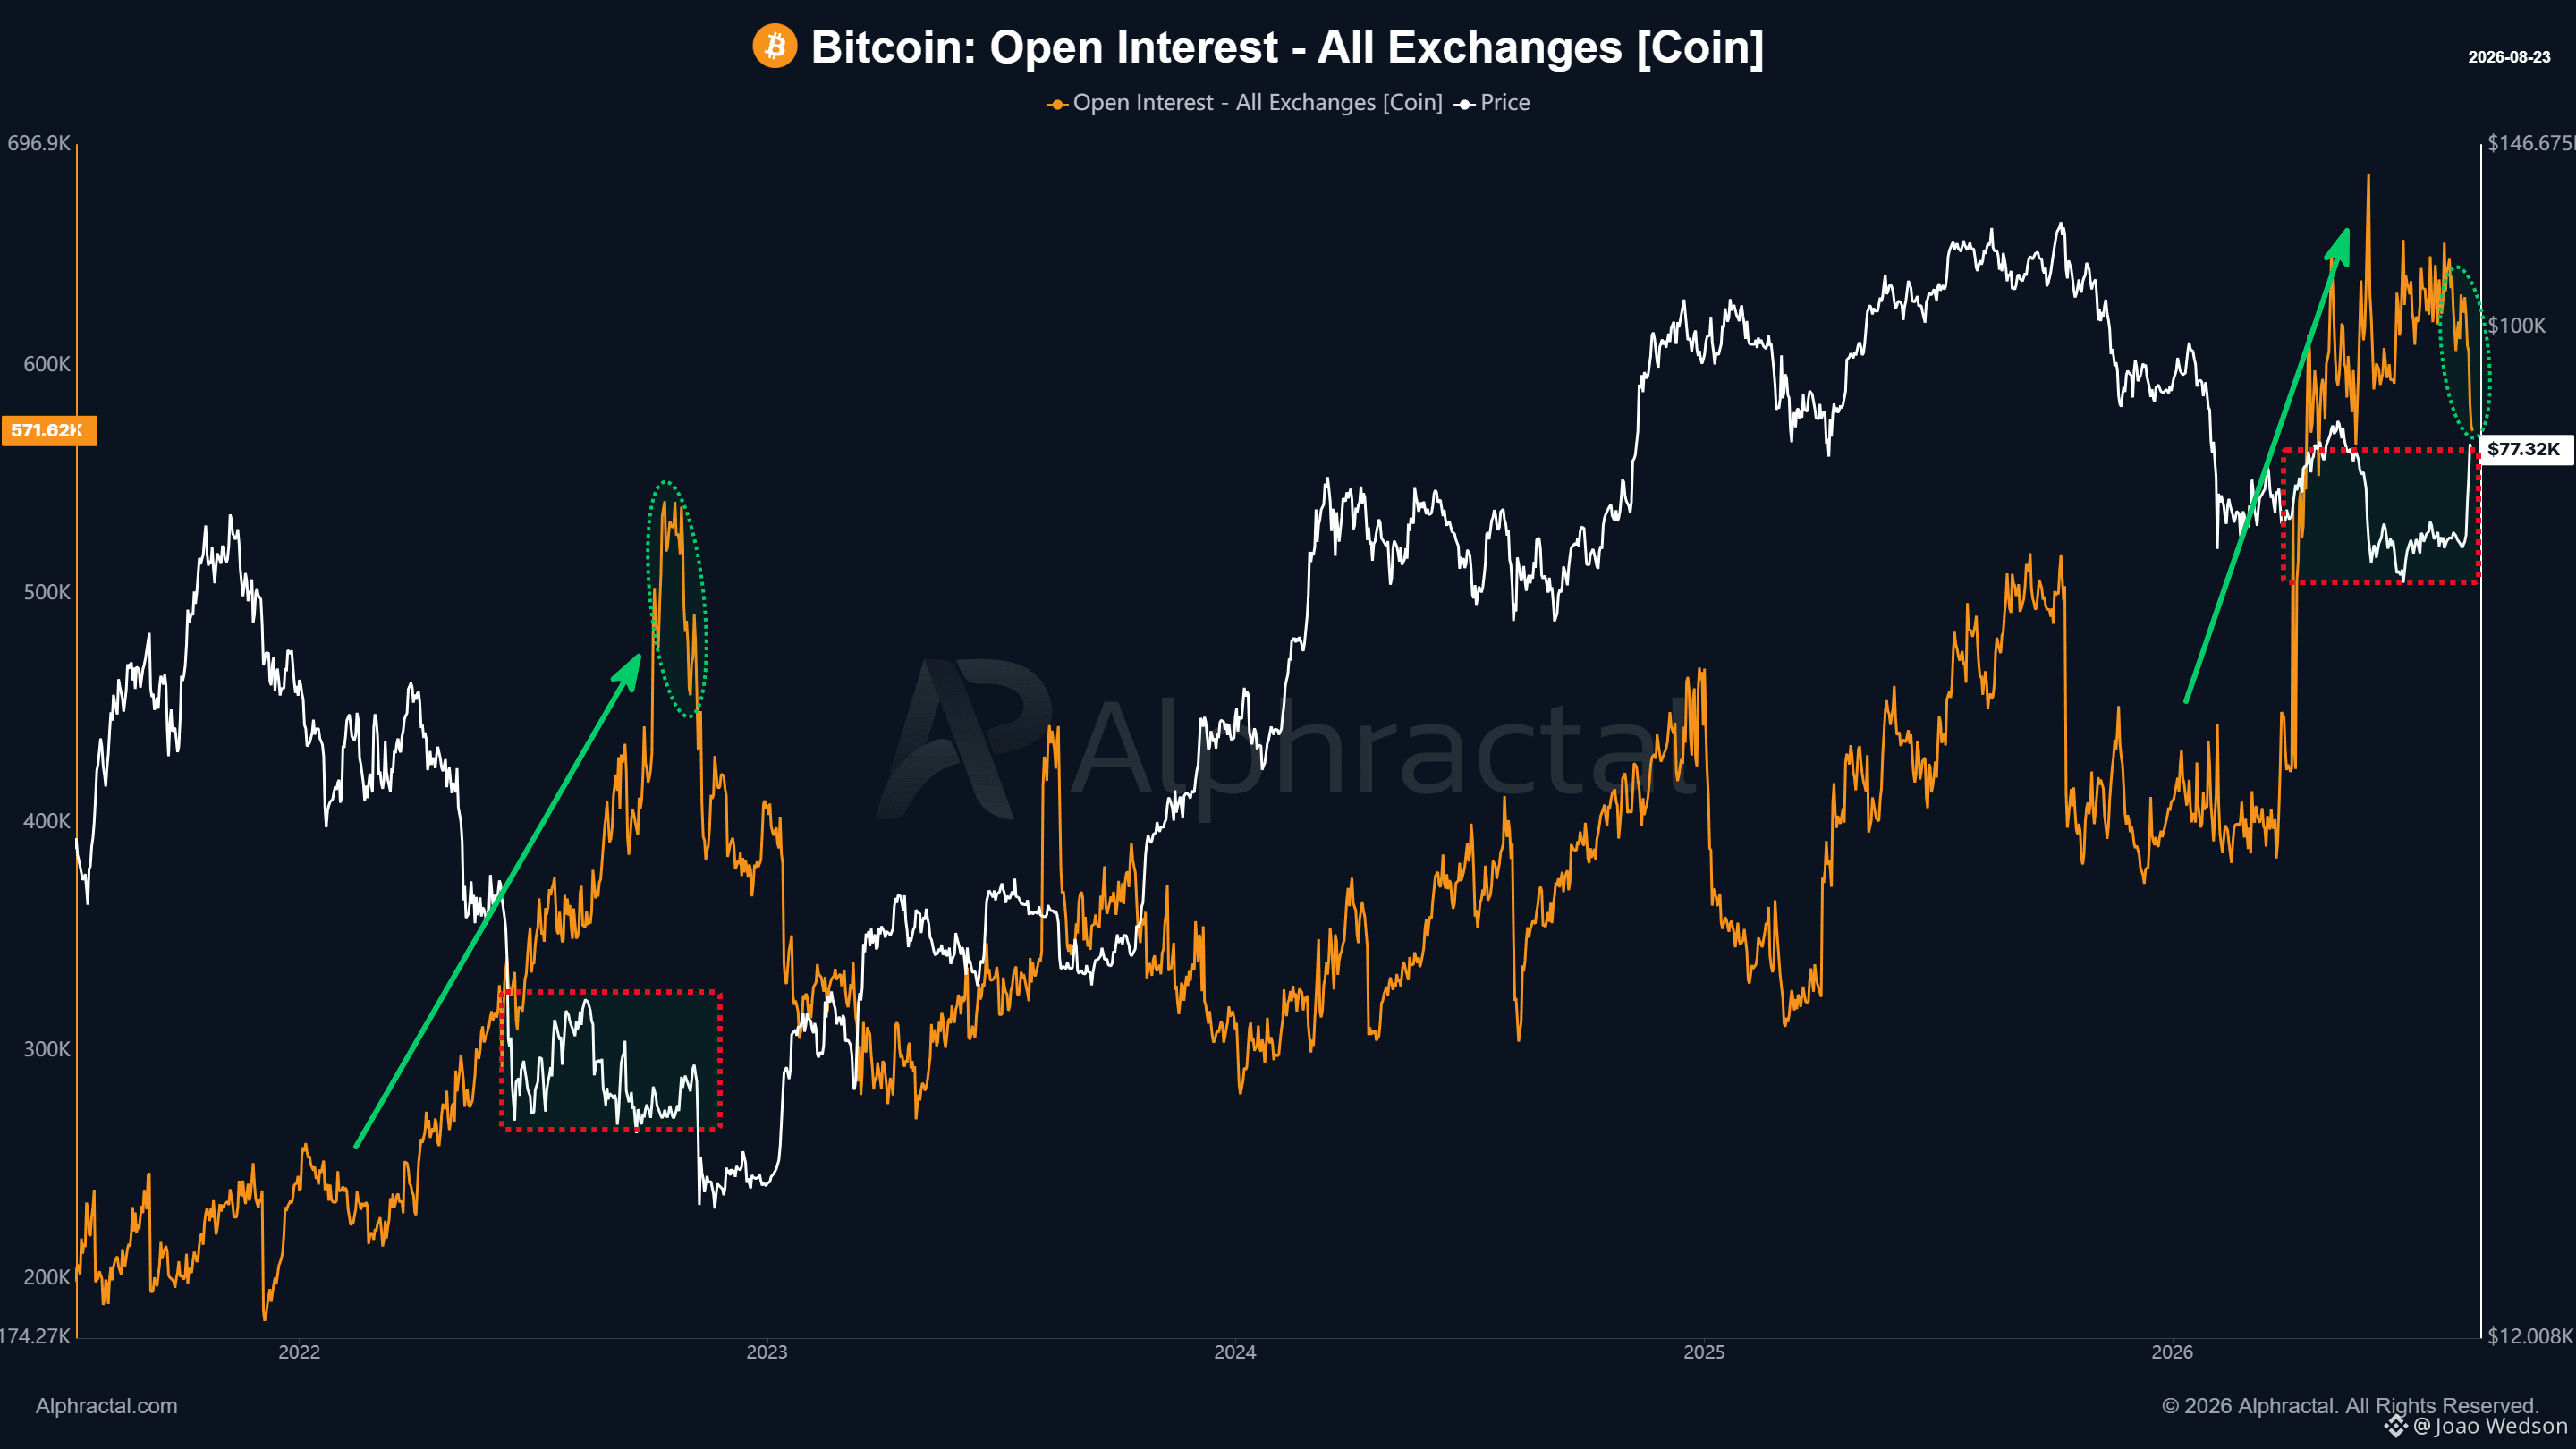
以美元计,未平仓合约在增加。但用 BTC 来衡量时,它实际上却在下降。2022 年也发生过类似情况——那是在 FTX 崩盘前大约一个月。
当时,由于几乎没人预料到 FTX 会崩溃,大量杠杆多头仓位被打开。
到 2026 年,未平仓合约同样暴涨,表明在比特币交易于约 6 万至 7 万美元区间时,开立的杠杆仓位出现了显著增长。
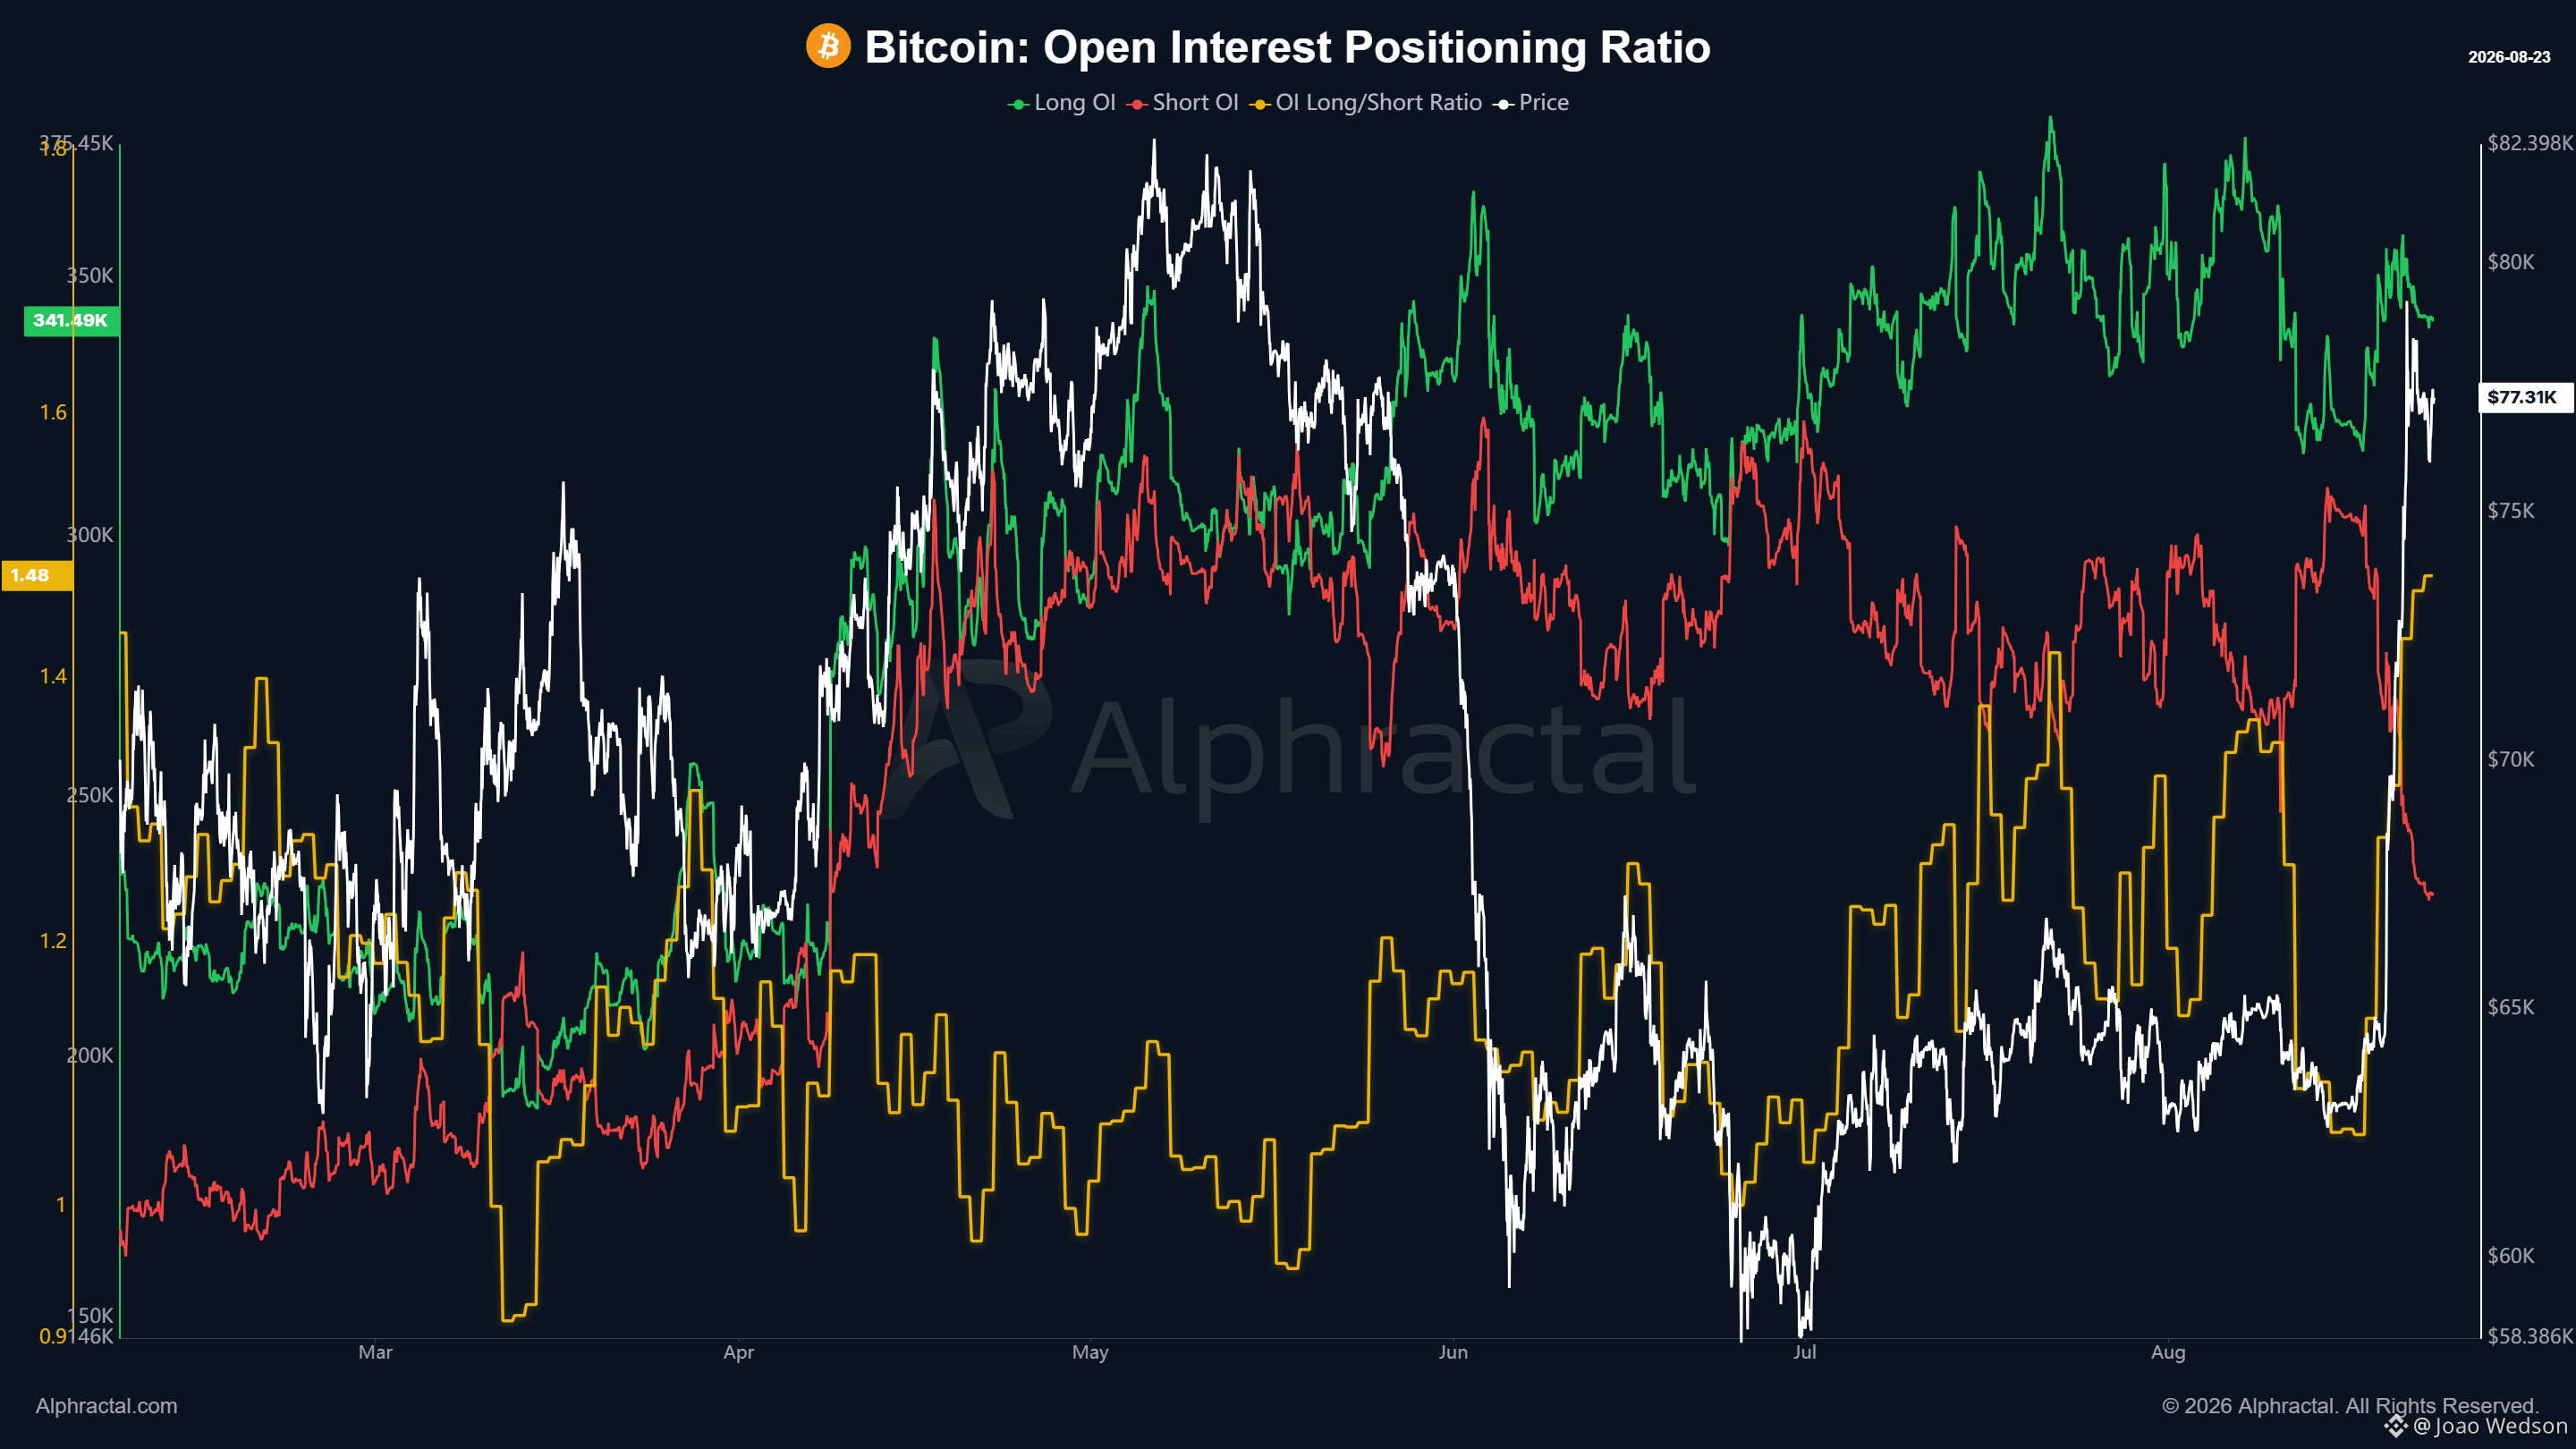
最近 BTC 计价的未平仓合约下降与空头密切相关。许多空单被清算,但也有一些空头因为价格急剧上行而被迫平仓。
但现在,做多与做空之间的差距已经变得非常巨大。
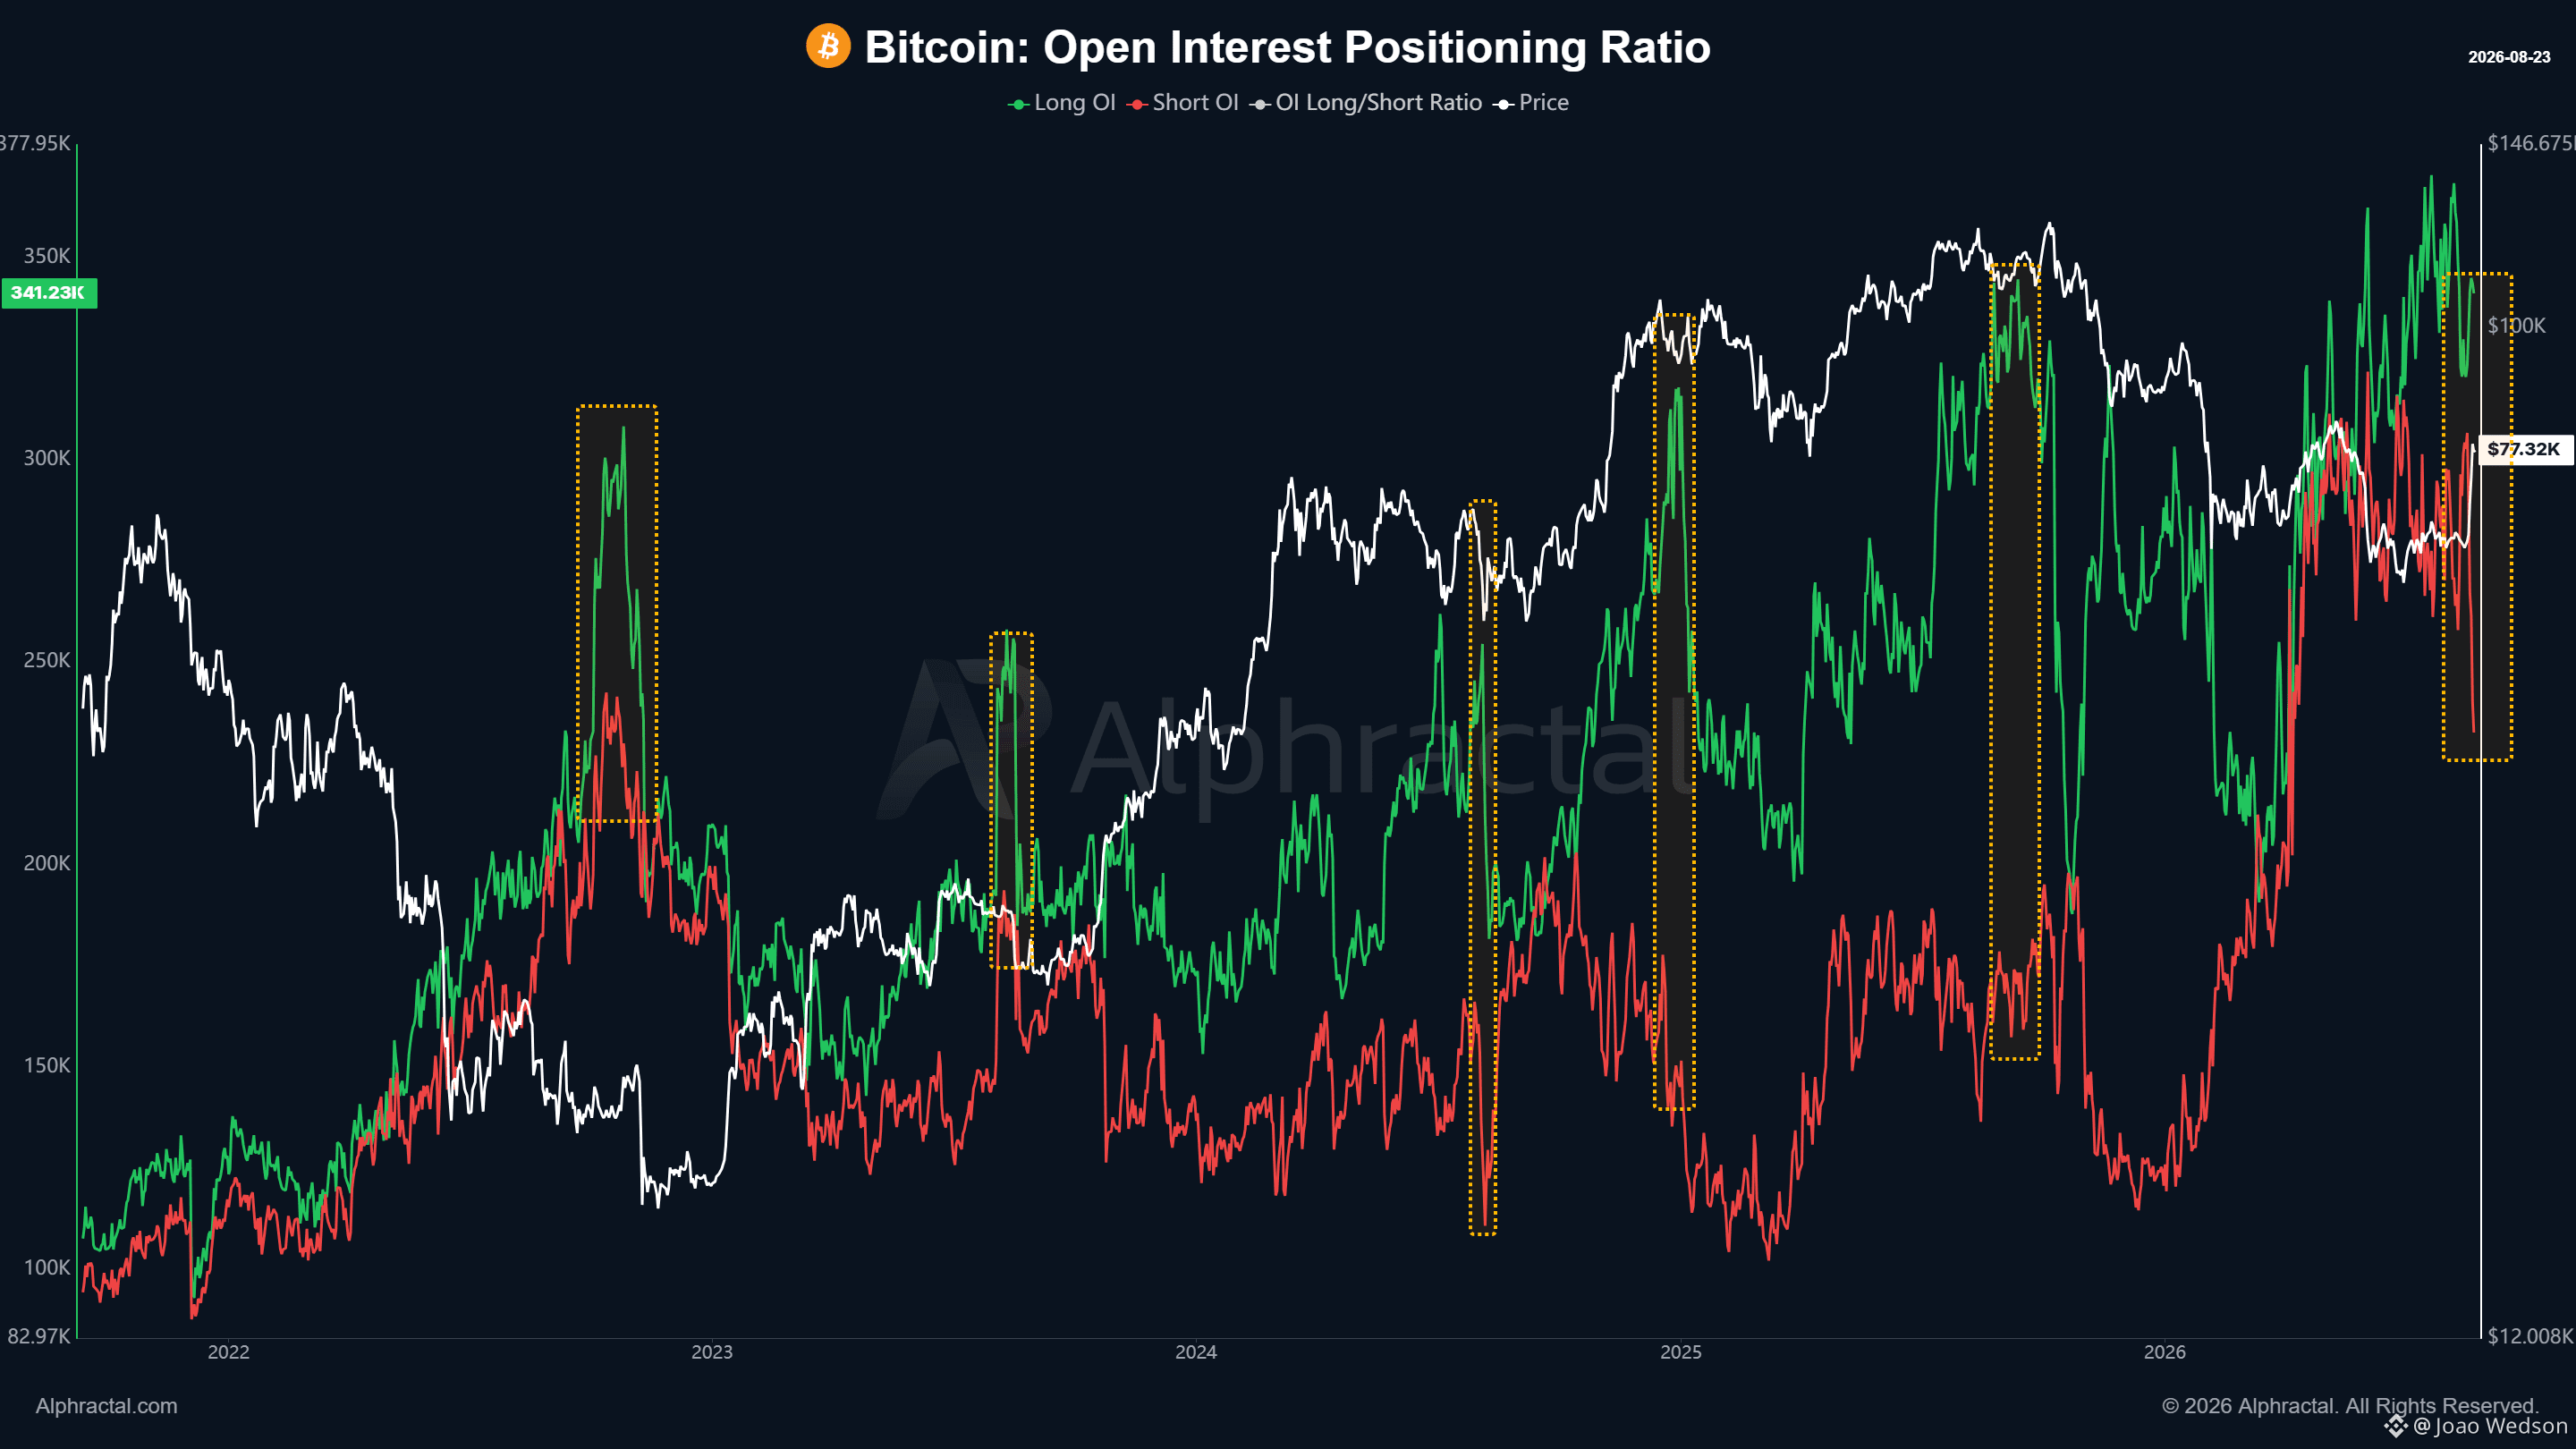
目前,多头约有 34.2 万 BTC,而空头为 23.3 万 BTC**。
历史上,这种规模的失衡往往随后会被急剧的下跌所跟随,并且通常不会等太久。这或许部分解释了我们过去看到的一些重大清算事件,包括 FTX 崩盘、2023 年 8 月、2024 年 8 月、2025 年 1 月,以及比特币创下历史新高前不久的那段时间。
我并不是在说比特币一定要暴跌来支撑看空倾向。
我只是描述实际数据所显示的情况。
多头与空头之间的差距仍然可能继续扩大;如果真的扩大,风险因素也会随之增加。相应地,发生剧烈清算事件的概率也会更高。
从风险角度来看,做多的更好时机是在 6 万美元附近,而不是现在——当比特币接近 8 万美元时。
在 6 万美元左右,多头与空头之间的不平衡要小得多。今天,这个不平衡则大得多。
50% OFF Alphractal https://app.alphractal.com/plans?utm_source=coinmarketcap&utm_medium=update&utm_campaign=founding_access&utm_content=ceo_joao
⚠️有一个新的风险信号正在针对比特币出现,某个时点可能还会发生另一波多头清算潮。
首先,看看未平仓合约(Open Interest)。
以美元计,未平仓合约在增加。但用 BTC 来衡量时,它实际上却在下降。2022 年也发生过类似情况——那是在 FTX 崩盘前大约一个月。
当时,由于几乎没人预料到 FTX 会崩溃,大量杠杆多头仓位被打开。
到 2026 年,未平仓合约同样暴涨,表明在比特币交易于约 6 万至 7 万美元区间时,开立的杠杆仓位出现了显著增长。
最近 BTC 计价的未平仓合约下降与空头密切相关。许多空单被清算,但也有一些空头因为价格急剧上行而被迫平仓。
但现在,做多与做空之间的差距已经变得非常巨大。
目前,多头约有 34.2 万 BTC,而空头为 23.3 万 BTC**。
历史上,这种规模的失衡往往随后会被急剧的下跌所跟随,并且通常不会等太久。这或许部分解释了我们过去看到的一些重大清算事件,包括 FTX 崩盘、2023 年 8 月、2024 年 8 月、2025 年 1 月,以及比特币创下历史新高前不久的那段时间。
我并不是在说比特币一定要暴跌来支撑看空倾向。
我只是描述实际数据所显示的情况。
多头与空头之间的差距仍然可能继续扩大;如果真的扩大,风险因素也会随之增加。相应地,发生剧烈清算事件的概率也会更高。
从风险角度来看,做多的更好时机是在 6 万美元附近,而不是现在——当比特币接近 8 万美元时。
在 6 万美元左右,多头与空头之间的不平衡要小得多。今天,这个不平衡则大得多。
50% OFF Alphractal https://app.alphractal.com/plans?utm_source=coinmarketcap&utm_medium=update&utm_campaign=founding_access&utm_content=ceo_joao
首先,看看未平仓合约(Open Interest)。
以美元计,未平仓合约在增加。但用 BTC 来衡量时,它实际上却在下降。2022 年也发生过类似情况——那是在 FTX 崩盘前大约一个月。
当时,由于几乎没人预料到 FTX 会崩溃,大量杠杆多头仓位被打开。
到 2026 年,未平仓合约同样暴涨,表明在比特币交易于约 6 万至 7 万美元区间时,开立的杠杆仓位出现了显著增长。
最近 BTC 计价的未平仓合约下降与空头密切相关。许多空单被清算,但也有一些空头因为价格急剧上行而被迫平仓。
但现在,做多与做空之间的差距已经变得非常巨大。
目前,多头约有 34.2 万 BTC,而空头为 23.3 万 BTC**。
历史上,这种规模的失衡往往随后会被急剧的下跌所跟随,并且通常不会等太久。这或许部分解释了我们过去看到的一些重大清算事件,包括 FTX 崩盘、2023 年 8 月、2024 年 8 月、2025 年 1 月,以及比特币创下历史新高前不久的那段时间。
我并不是在说比特币一定要暴跌来支撑看空倾向。
我只是描述实际数据所显示的情况。
多头与空头之间的差距仍然可能继续扩大;如果真的扩大,风险因素也会随之增加。相应地,发生剧烈清算事件的概率也会更高。
从风险角度来看,做多的更好时机是在 6 万美元附近,而不是现在——当比特币接近 8 万美元时。
在 6 万美元左右,多头与空头之间的不平衡要小得多。今天,这个不平衡则大得多。
50% OFF Alphractal https://app.alphractal.com/plans?utm_source=coinmarketcap&utm_medium=update&utm_campaign=founding_access&utm_content=ceo_joao
58
·
--
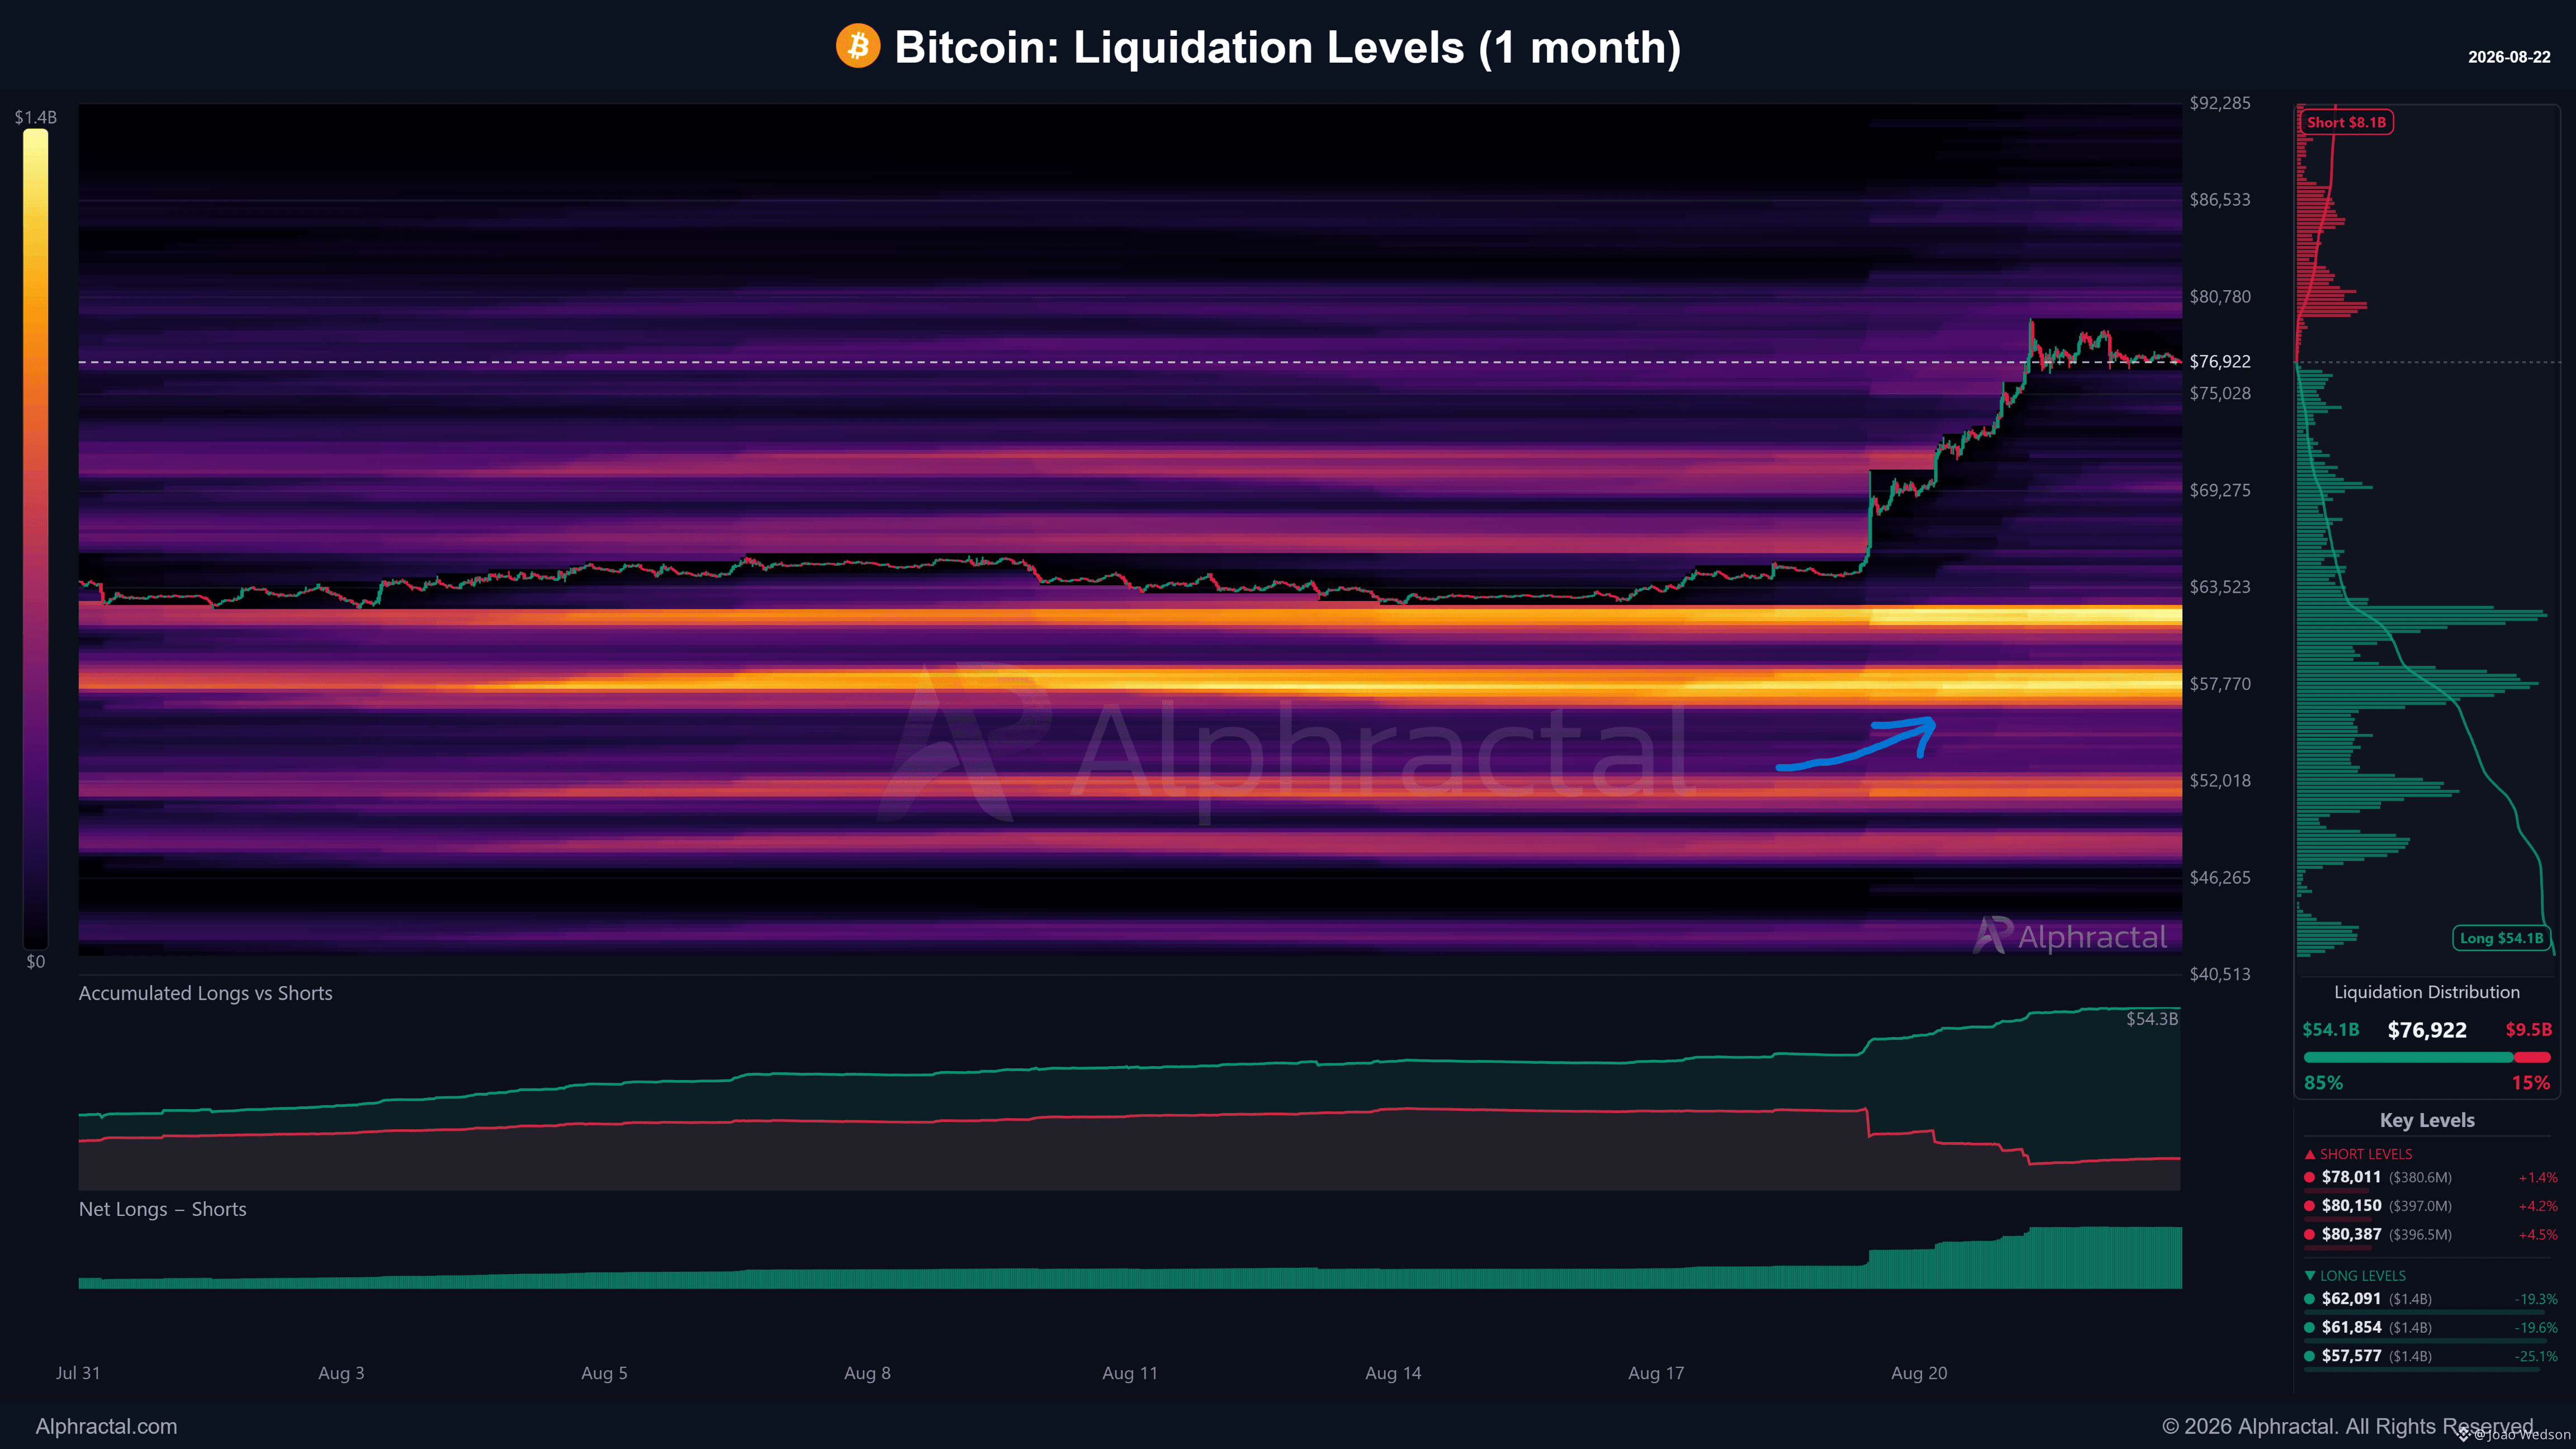
随著比特币价格上升,它留下了一串清算(liquidation)水位的轨迹。
但在回顾过去30天的未平仓部位时,以下两个水位特别引人注目:
$61,000:当比特币交易在约 $65,000 到 $68,000 之间时,许多交易者在此区域开仓。
$57,000:一个可能造成大量交易者被清算的区域。这些部位中的不少是在 $63,000 到 $66,000 左右开立的。
有趣的是,这些水位也往往是交易者设定停损(stop losses)的区域,他们认为价格不太可能触及这些位置。
另外,在更高的地方也有清算水位,大约在 $85,000 到 $86,000,但这些多数与超过一个月的较旧部位相关。它们也可能成为清算目标。
保持警觉。
Alphractal 在限时期间享有 50% OFF!
趁优惠还在,立即把握机会。
https://app.alphractal.com/plans?utm_source=coinmarketcap&utm_medium=update&utm_campaign=founding_access&utm_content=ceo_joao
随著比特币价格上升,它留下了一串清算(liquidation)水位的轨迹。
但在回顾过去30天的未平仓部位时,以下两个水位特别引人注目:
$61,000:当比特币交易在约 $65,000 到 $68,000 之间时,许多交易者在此区域开仓。
$57,000:一个可能造成大量交易者被清算的区域。这些部位中的不少是在 $63,000 到 $66,000 左右开立的。
有趣的是,这些水位也往往是交易者设定停损(stop losses)的区域,他们认为价格不太可能触及这些位置。
另外,在更高的地方也有清算水位,大约在 $85,000 到 $86,000,但这些多数与超过一个月的较旧部位相关。它们也可能成为清算目标。
保持警觉。
Alphractal 在限时期间享有 50% OFF!
趁优惠还在,立即把握机会。
https://app.alphractal.com/plans?utm_source=coinmarketcap&utm_medium=update&utm_campaign=founding_access&utm_content=ceo_joao
但在回顾过去30天的未平仓部位时,以下两个水位特别引人注目:
$61,000:当比特币交易在约 $65,000 到 $68,000 之间时,许多交易者在此区域开仓。
$57,000:一个可能造成大量交易者被清算的区域。这些部位中的不少是在 $63,000 到 $66,000 左右开立的。
有趣的是,这些水位也往往是交易者设定停损(stop losses)的区域,他们认为价格不太可能触及这些位置。
另外,在更高的地方也有清算水位,大约在 $85,000 到 $86,000,但这些多数与超过一个月的较旧部位相关。它们也可能成为清算目标。
保持警觉。
Alphractal 在限时期间享有 50% OFF!
趁优惠还在,立即把握机会。
https://app.alphractal.com/plans?utm_source=coinmarketcap&utm_medium=update&utm_campaign=founding_access&utm_content=ceo_joao
8
·
--
BTC 今天 +11%。ETH +18%。每个人都看得到价格在移动。真正的问题是:你知道为什么吗?是谁在推动这波行情?杠杆集中在哪里?刚刚被强制平仓的是哪一边?接下来的主要关键位在哪里?这就是数据带来的差异。限时优惠:Alphractal Pro 与 Max 享 5 折(50% OFF),可选月付或年付。同一个市场。提供更深层的可视性。 🔗https://app.alphractal.com/plans?utm_source=coinmarketcap&utm_medium=update&utm_campaign=founding_access&utm_content=ceo_joao
BTC 今天 +11%。ETH +18%。每个人都看得到价格在移动。真正的问题是:你知道为什么吗?是谁在推动这波行情?杠杆集中在哪里?刚刚被强制平仓的是哪一边?接下来的主要关键位在哪里?这就是数据带来的差异。限时优惠:Alphractal Pro 与 Max 享 5 折(50% OFF),可选月付或年付。同一个市场。提供更深层的可视性。 🔗https://app.alphractal.com/plans?utm_source=coinmarketcap&utm_medium=update&utm_campaign=founding_access&utm_content=ceo_joao

69
登录解锁更多内容
加入币安广场,与全球加密货币用户互动
⚡️ 获取关于加密货币的最新实用信息。
💬 受到全球最大加密货币交易平台的信赖。
👍 发现来自认证创作者的真知灼见。
邮箱/手机号码
热门话题
以太坊三季度涨70.9%
35,038 次浏览
122 人讨论中
以太坊三季度涨70.9%,这次不只是跟着比特币走了。
三季度结束,以太坊交出了一张很强的成绩单:单季上涨约70.9%,从7月初约1570美元一路涨到季度末的2680美元附近,创下2021年一季度以来最强季度表现。
同期比特币涨幅约44%,以太坊明显跑赢了。
资金面也在配合,三季度美国现货以太坊ETF重新转为明显净流入,累计约31亿美元,9月下旬多次出现单日过亿美元的资金流入。
这轮上涨里,ETF资金回流、机构需求升温,再加上以太坊本身在稳定币、DeFi和链上金融里的使用,几条线同时在发力。
花旗本周也上调了ETH未来12个月目标价,理由里就提到了ETF资金重新流入和加密市场活跃度提升。
不过四季度的难度也上来了,美国10年期美债收益率已经站上5%附近,资金成本明显变贵。
ETH三个月涨了七成,后面还能不能继续走强,得看ETF流入能不能接得住,以及2700美元上方有没有新的买盘。
#以太坊三季度涨70.9%
金麦飞JMF
·16次点赞
·24.5k 次浏览
美财政部允许各州提前提交稳定币认证
0 次浏览
20 人讨论中
美国10年期美债收益率逼近5.3%
53,371 次浏览
218 人讨论中