
Steve Cryptoo 1
369 个内容

Steve Cryptoo 1
举报
屏蔽用户
Crypto Advisor| Chart Analyst| Web3 Guru|
0 关注
3 粉丝
18 点赞
帖子
查看翻译
BITCOIN UNDER HEAVY SELLING PRESSURE — BEARS ARE IN CONTROL
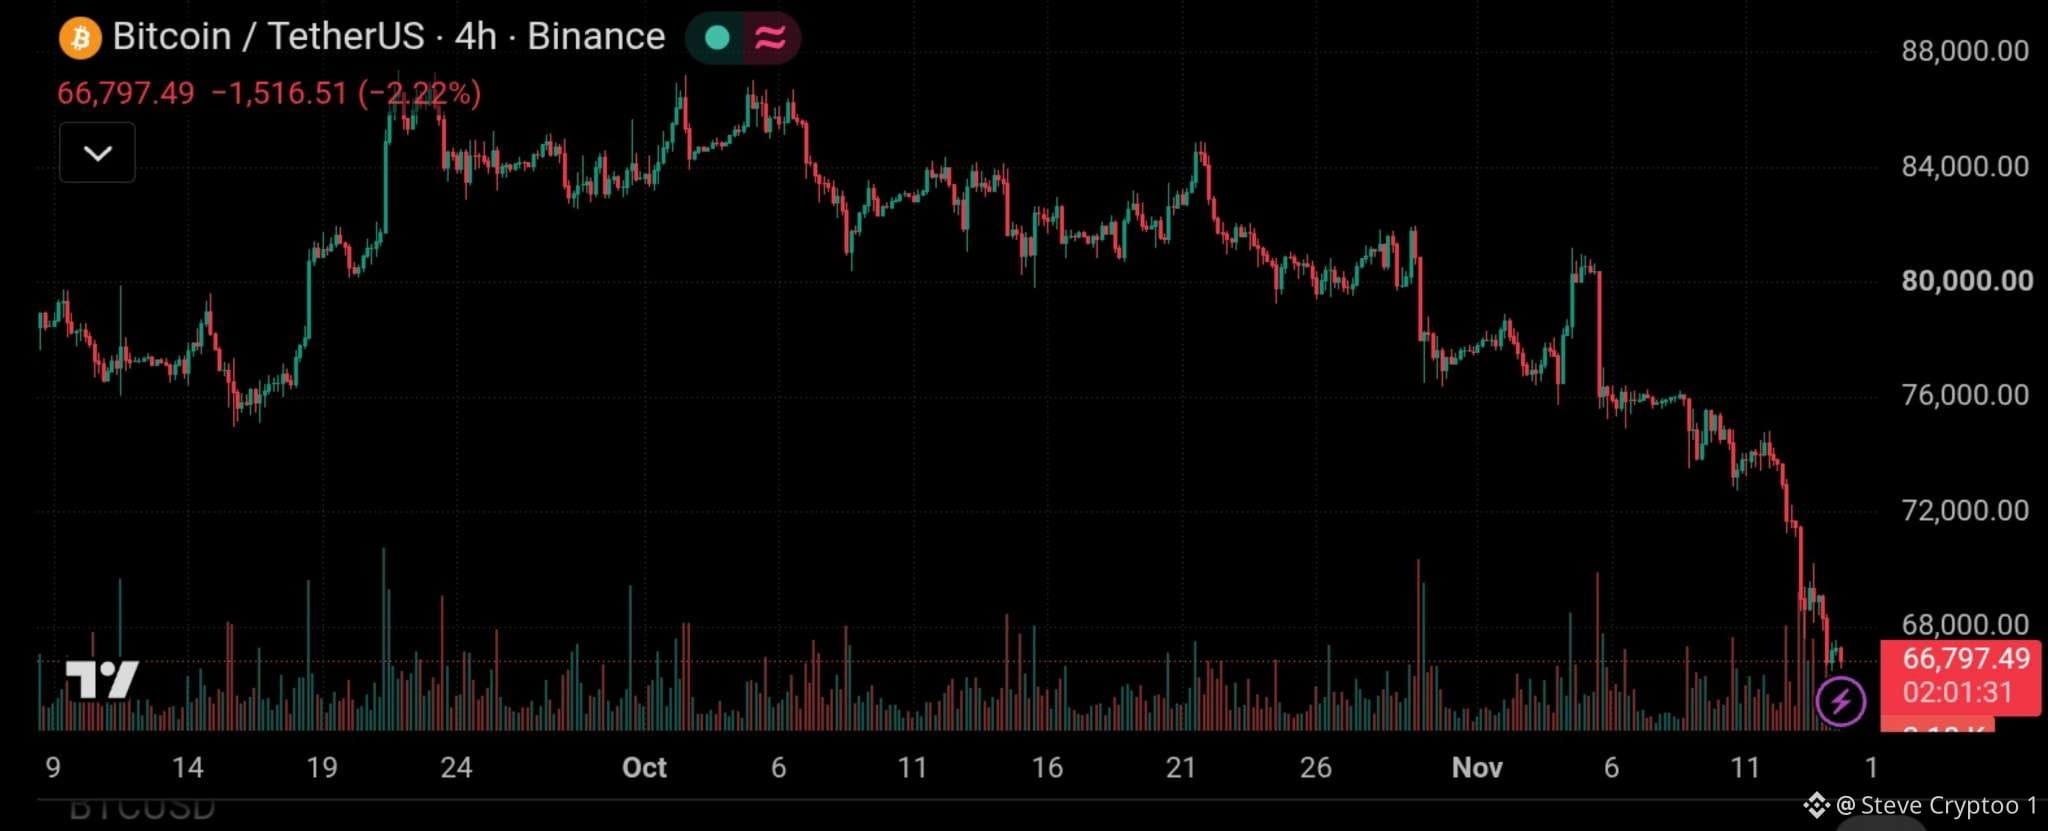
$BTC has taken another sharp hit, dropping to around $66,797 on the 4H chart, down approximately 2.22% at the time of the screenshot.
The technical picture is becoming increasingly bearish.
📉 What the chart tells us:
• BTC continues forming lower highs and lower lows.
• The $72,000 support zone has already given way.
• Price has now slipped below the important $68,000 level.
• Selling volume has increased during the latest breakdown, showing strong bearish pressure.
Key levels to watch:
🔴 Resistance: $68,000 – $72,000
🔴 Next resistance: $76,000
🟢 Immediate area to monitor: $66,000 – $65,000
What comes next?
Bulls need to reclaim $68K and establish support above it to improve the short-term outlook. Otherwise, further downside remains a possibility.
The broader market pressure is also significant, with ETF outflows, heavy liquidations and macroeconomic uncertainty weighing on sentiment.
#Bitcoin #BTC #CryptoMarket
BITCOIN UNDER HEAVY SELLING PRESSURE — BEARS ARE IN CONTROL
$BTC has taken another sharp hit, dropping to around $66,797 on the 4H chart, down approximately 2.22% at the time of the screenshot.
The technical picture is becoming increasingly bearish.
📉 What the chart tells us:
• BTC continues forming lower highs and lower lows.
• The $72,000 support zone has already given way.
• Price has now slipped below the important $68,000 level.
• Selling volume has increased during the latest breakdown, showing strong bearish pressure.
Key levels to watch:
🔴 Resistance: $68,000 – $72,000
🔴 Next resistance: $76,000
🟢 Immediate area to monitor: $66,000 – $65,000
What comes next?
Bulls need to reclaim $68K and establish support above it to improve the short-term outlook. Otherwise, further downside remains a possibility.
The broader market pressure is also significant, with ETF outflows, heavy liquidations and macroeconomic uncertainty weighing on sentiment.
#Bitcoin #BTC #CryptoMarket
$BTC has taken another sharp hit, dropping to around $66,797 on the 4H chart, down approximately 2.22% at the time of the screenshot.
The technical picture is becoming increasingly bearish.
📉 What the chart tells us:
• BTC continues forming lower highs and lower lows.
• The $72,000 support zone has already given way.
• Price has now slipped below the important $68,000 level.
• Selling volume has increased during the latest breakdown, showing strong bearish pressure.
Key levels to watch:
🔴 Resistance: $68,000 – $72,000
🔴 Next resistance: $76,000
🟢 Immediate area to monitor: $66,000 – $65,000
What comes next?
Bulls need to reclaim $68K and establish support above it to improve the short-term outlook. Otherwise, further downside remains a possibility.
The broader market pressure is also significant, with ETF outflows, heavy liquidations and macroeconomic uncertainty weighing on sentiment.
#Bitcoin #BTC #CryptoMarket
66
查看翻译
RLUSD JUST FLIPPED PYUSD!
Ripple is gaining ground in the stablecoin market.
According to DefiLlama, Ripple’s $RLUSD has overtaken PayPal’s $PYUSD to become the 7th-largest stablecoin by market capitalization.
Here's where they stand:
🔹 $RLUSD : $2.70B
🔹 $PYUSD: $2.63B
The gap is relatively small, but the milestone is significant.
Ripple continues to strengthen its position in the stablecoin space, showing how competition is heating up among major financial players.
Stablecoin adoption is growing, and the race is far from over. 👀
#Ripple #Stablecoins #PYUSD
RLUSD JUST FLIPPED PYUSD!
Ripple is gaining ground in the stablecoin market.
According to DefiLlama, Ripple’s $RLUSD has overtaken PayPal’s $PYUSD to become the 7th-largest stablecoin by market capitalization.
Here's where they stand:
🔹 $RLUSD : $2.70B
🔹 $PYUSD: $2.63B
The gap is relatively small, but the milestone is significant.
Ripple continues to strengthen its position in the stablecoin space, showing how competition is heating up among major financial players.
Stablecoin adoption is growing, and the race is far from over. 👀
#Ripple #Stablecoins #PYUSD
Ripple is gaining ground in the stablecoin market.
According to DefiLlama, Ripple’s $RLUSD has overtaken PayPal’s $PYUSD to become the 7th-largest stablecoin by market capitalization.
Here's where they stand:
🔹 $RLUSD : $2.70B
🔹 $PYUSD: $2.63B
The gap is relatively small, but the milestone is significant.
Ripple continues to strengthen its position in the stablecoin space, showing how competition is heating up among major financial players.
Stablecoin adoption is growing, and the race is far from over. 👀
#Ripple #Stablecoins #PYUSD

67
查看翻译
$ERA IS SHOWING SERIOUS BULLISH MOMENTUM! Can Caldera push toward $0.11?
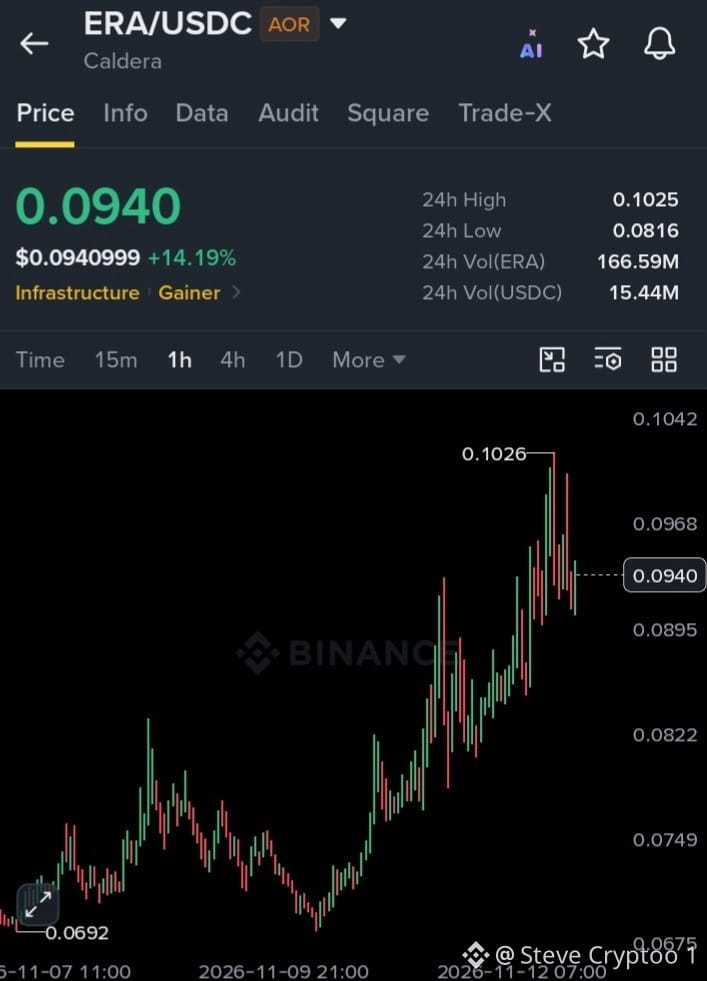
$ERA /USDC is gaining strength, currently trading around $0.0940, up 14.19% in 24 hours.
The 1H chart is showing a clear recovery structure, with higher highs and higher lows.
Buyers are still active, but the next resistance zone will be important.
📊 Key Technical Levels:
🟢 Upside Targets:
TP1: $0.0980
TP2: $0.1025
TP3: $0.1060
TP4: $0.1120
🔴 Important Support Zones:
Support 1: $0.0895
Support 2: $0.0822
Major support: $0.0749
What to Watch Next:
$0.0968 is the first important resistance to watch. A strong 1H close above this level could bring another attempt at $0.1025.
A confirmed breakout above $0.1025 could open the door toward $0.1060 and potentially $0.1120.
#BTC Price Analysis# #Macro Insights#
$ERA IS SHOWING SERIOUS BULLISH MOMENTUM! Can Caldera push toward $0.11?
$ERA /USDC is gaining strength, currently trading around $0.0940, up 14.19% in 24 hours.
The 1H chart is showing a clear recovery structure, with higher highs and higher lows.
Buyers are still active, but the next resistance zone will be important.
📊 Key Technical Levels:
🟢 Upside Targets:
TP1: $0.0980
TP2: $0.1025
TP3: $0.1060
TP4: $0.1120
🔴 Important Support Zones:
Support 1: $0.0895
Support 2: $0.0822
Major support: $0.0749
What to Watch Next:
$0.0968 is the first important resistance to watch. A strong 1H close above this level could bring another attempt at $0.1025.
A confirmed breakout above $0.1025 could open the door toward $0.1060 and potentially $0.1120.
#BTC Price Analysis# #Macro Insights#
$ERA /USDC is gaining strength, currently trading around $0.0940, up 14.19% in 24 hours.
The 1H chart is showing a clear recovery structure, with higher highs and higher lows.
Buyers are still active, but the next resistance zone will be important.
📊 Key Technical Levels:
🟢 Upside Targets:
TP1: $0.0980
TP2: $0.1025
TP3: $0.1060
TP4: $0.1120
🔴 Important Support Zones:
Support 1: $0.0895
Support 2: $0.0822
Major support: $0.0749
What to Watch Next:
$0.0968 is the first important resistance to watch. A strong 1H close above this level could bring another attempt at $0.1025.
A confirmed breakout above $0.1025 could open the door toward $0.1060 and potentially $0.1120.
#BTC Price Analysis# #Macro Insights#
56
查看翻译
$BTC has seen it all, but history keeps teaching the same lesson: volatility is part of the journey. 🟠
Look at Bitcoin’s price on November 11 over the years:
2016: $715 2017: $6,350 2018: $6,375 2019: $8,750 2020: $15,700 2021: $64,900 2022: $17,000 2023: $37,000 2024: $88,000 2025: $103,000 2026: $74,000
Now look at the bigger picture.
Bitcoin has experienced major corrections, painful bear markets, and periods when confidence was low. Yet it has continued to evolve through multiple market cycles.
What about the current chart?
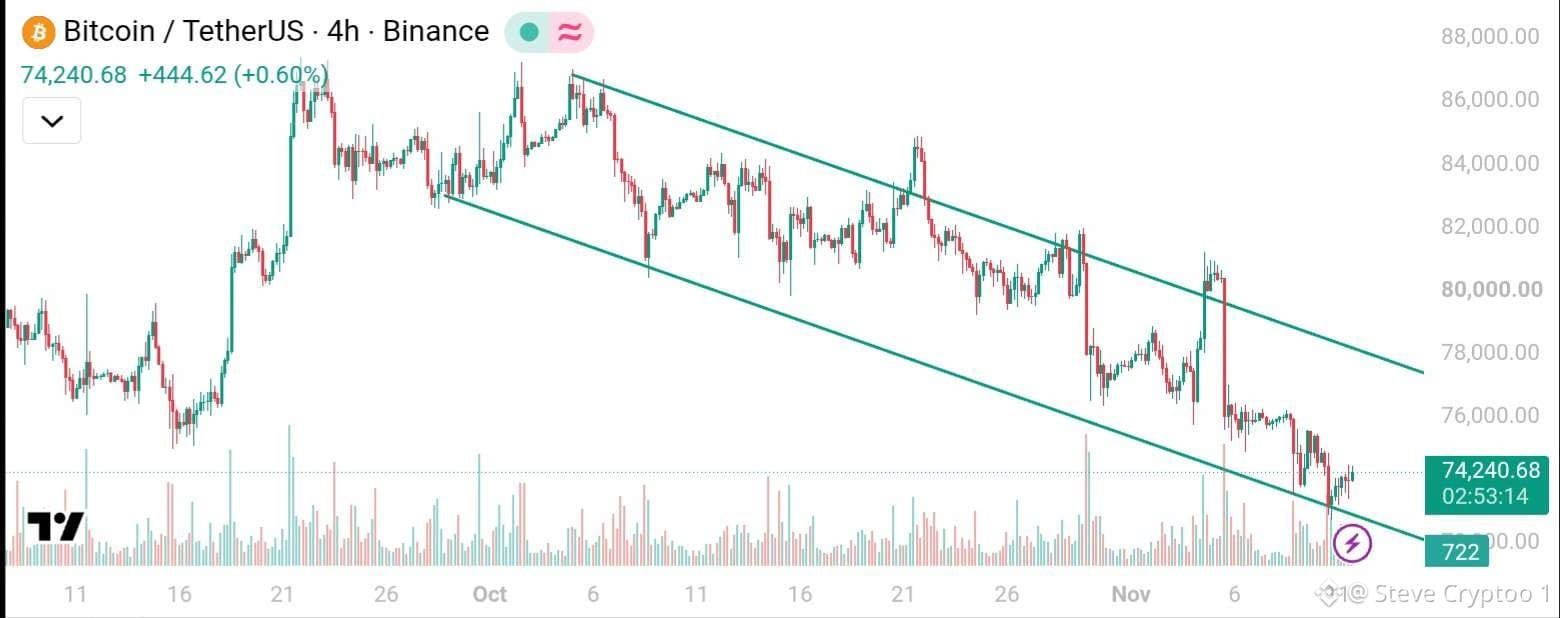
BTC is trading around $74K on the 4H timeframe, moving inside a descending channel. Price is approaching the lower boundary, making this an important technical area to watch.
A sustained bounce could offer a recovery opportunity, while a breakdown may open the door to further downside.
The key is confirmation, not assumptions.
Markets move in cycles. Patience and perspective matter.
Don't let short-term volatility erase the bigger picture.
#BTC Price Analysis# #Macro Insights#
$BTC has seen it all, but history keeps teaching the same lesson: volatility is part of the journey. 🟠
Look at Bitcoin’s price on November 11 over the years:
2016: $715 2017: $6,350 2018: $6,375 2019: $8,750 2020: $15,700 2021: $64,900 2022: $17,000 2023: $37,000 2024: $88,000 2025: $103,000 2026: $74,000
Now look at the bigger picture.
Bitcoin has experienced major corrections, painful bear markets, and periods when confidence was low. Yet it has continued to evolve through multiple market cycles.
What about the current chart?
BTC is trading around $74K on the 4H timeframe, moving inside a descending channel. Price is approaching the lower boundary, making this an important technical area to watch.
A sustained bounce could offer a recovery opportunity, while a breakdown may open the door to further downside.
The key is confirmation, not assumptions.
Markets move in cycles. Patience and perspective matter.
Don't let short-term volatility erase the bigger picture.
#BTC Price Analysis# #Macro Insights#
Look at Bitcoin’s price on November 11 over the years:
2016: $715 2017: $6,350 2018: $6,375 2019: $8,750 2020: $15,700 2021: $64,900 2022: $17,000 2023: $37,000 2024: $88,000 2025: $103,000 2026: $74,000
Now look at the bigger picture.
Bitcoin has experienced major corrections, painful bear markets, and periods when confidence was low. Yet it has continued to evolve through multiple market cycles.
What about the current chart?
BTC is trading around $74K on the 4H timeframe, moving inside a descending channel. Price is approaching the lower boundary, making this an important technical area to watch.
A sustained bounce could offer a recovery opportunity, while a breakdown may open the door to further downside.
The key is confirmation, not assumptions.
Markets move in cycles. Patience and perspective matter.
Don't let short-term volatility erase the bigger picture.
#BTC Price Analysis# #Macro Insights#
76
查看翻译
$XRP THE DIP IS GETTING INTERESTING 👀
$XRP is showing a significant pullback, but the current zone deserves attention.
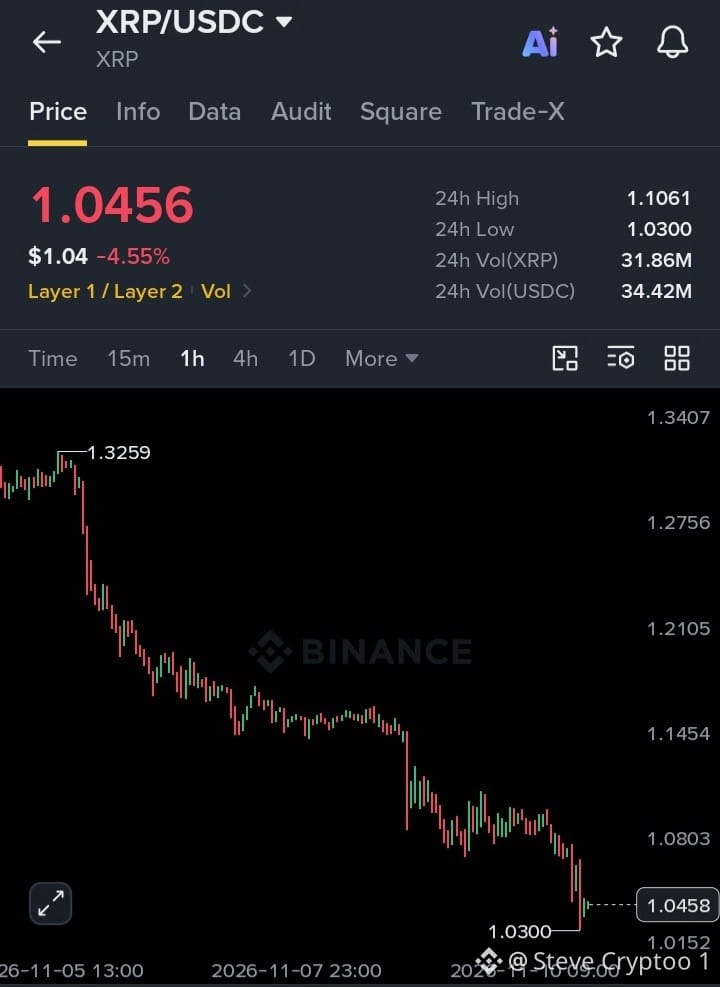
On the 1H chart, XRP has dropped from around $1.3259 to a recent low of $1.0300, putting strong selling pressure on the market.
Here's what I'm watching:
🔹 Key Support: $1.0300 — critical zone for buyers to defend.
🔹 Immediate Resistance: $1.0800 — reclaiming this level could be the first sign of improving momentum.
🔹 Next Resistance: $1.1450 — an important level for a stronger recovery attempt.
🔹 Major Resistance: $1.2100.
My Take:
This could be an interesting dip-buying zone, but catching a falling market without confirmation is risky.
#BTC Price Analysis# #Macro Insights#
$XRP THE DIP IS GETTING INTERESTING 👀
$XRP is showing a significant pullback, but the current zone deserves attention.
On the 1H chart, XRP has dropped from around $1.3259 to a recent low of $1.0300, putting strong selling pressure on the market.
Here's what I'm watching:
🔹 Key Support: $1.0300 — critical zone for buyers to defend.
🔹 Immediate Resistance: $1.0800 — reclaiming this level could be the first sign of improving momentum.
🔹 Next Resistance: $1.1450 — an important level for a stronger recovery attempt.
🔹 Major Resistance: $1.2100.
My Take:
This could be an interesting dip-buying zone, but catching a falling market without confirmation is risky.
#BTC Price Analysis# #Macro Insights#
$XRP is showing a significant pullback, but the current zone deserves attention.
On the 1H chart, XRP has dropped from around $1.3259 to a recent low of $1.0300, putting strong selling pressure on the market.
Here's what I'm watching:
🔹 Key Support: $1.0300 — critical zone for buyers to defend.
🔹 Immediate Resistance: $1.0800 — reclaiming this level could be the first sign of improving momentum.
🔹 Next Resistance: $1.1450 — an important level for a stronger recovery attempt.
🔹 Major Resistance: $1.2100.
My Take:
This could be an interesting dip-buying zone, but catching a falling market without confirmation is risky.
#BTC Price Analysis# #Macro Insights#
76
查看翻译
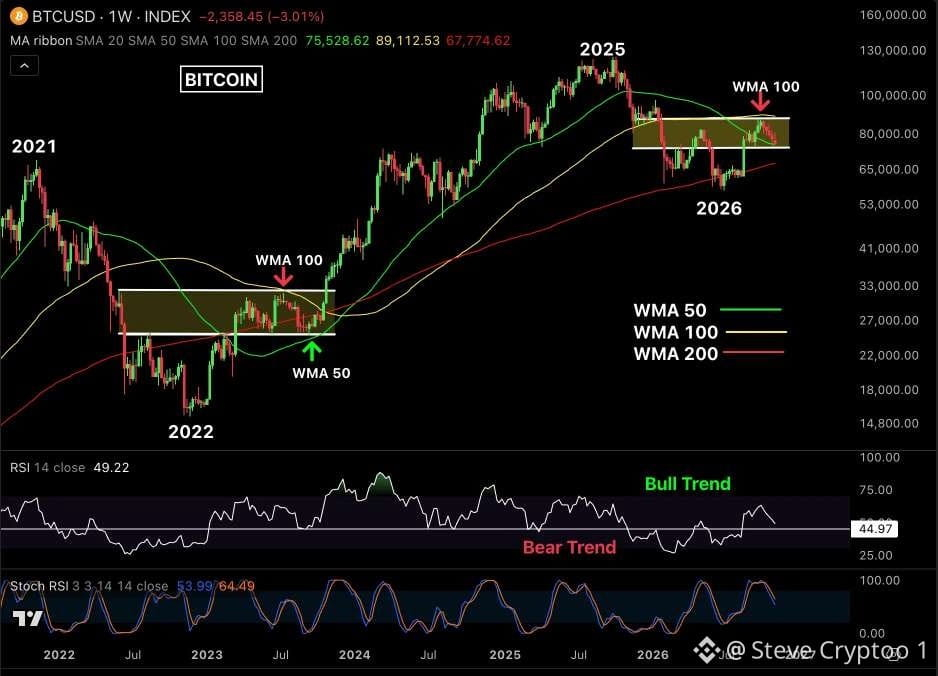
BITCOIN IS REPEATING A FAMILIAR WEEKLY STRUCTURE. IS ANOTHER MAJOR BREAKOUT APPROACHING?
The current $BTC setup is drawing strong similarities to 2023, when Bitcoin consolidated between its weekly MA 50 and MA 100 before breaking out into a powerful rally.
Now, in 2026, a similar structure is developing.
After facing rejection near the weekly MA 100 around $87,400, Bitcoin is once again trading within a critical range.
Key Levels to Watch:
🟢 Support • Weekly MA 50: $75,500 • Weekly MA 200: $67,800
🔴 Resistance • Immediate: $82,000 • Major: $87,400 (Weekly MA 100)
Momentum Check:
• RSI near 50 indicates neutral momentum
• Stochastic RSI is weakening, suggesting potential short-term downside.
• A sustained move above the weekly MA 100 would strengthen the bullish outlook.
My Take:
The 2023 comparison is interesting, but history doesn't guarantee repetition.
Bitcoin needs to defend its key support levels and reclaim the weekly MA 100 with a confirmed weekly close.
A successful breakout could open the door to another significant upside move. However, losing support would weaken the bullish structure.
Patience is key. Let the weekly candles confirm the next direction.
#BTC Price Analysis# #Macro Insights#
BITCOIN IS REPEATING A FAMILIAR WEEKLY STRUCTURE. IS ANOTHER MAJOR BREAKOUT APPROACHING?
The current $BTC setup is drawing strong similarities to 2023, when Bitcoin consolidated between its weekly MA 50 and MA 100 before breaking out into a powerful rally.
Now, in 2026, a similar structure is developing.
After facing rejection near the weekly MA 100 around $87,400, Bitcoin is once again trading within a critical range.
Key Levels to Watch:
🟢 Support • Weekly MA 50: $75,500 • Weekly MA 200: $67,800
🔴 Resistance • Immediate: $82,000 • Major: $87,400 (Weekly MA 100)
Momentum Check:
• RSI near 50 indicates neutral momentum
• Stochastic RSI is weakening, suggesting potential short-term downside.
• A sustained move above the weekly MA 100 would strengthen the bullish outlook.
My Take:
The 2023 comparison is interesting, but history doesn't guarantee repetition.
Bitcoin needs to defend its key support levels and reclaim the weekly MA 100 with a confirmed weekly close.
A successful breakout could open the door to another significant upside move. However, losing support would weaken the bullish structure.
Patience is key. Let the weekly candles confirm the next direction.
#BTC Price Analysis# #Macro Insights#
The current $BTC setup is drawing strong similarities to 2023, when Bitcoin consolidated between its weekly MA 50 and MA 100 before breaking out into a powerful rally.
Now, in 2026, a similar structure is developing.
After facing rejection near the weekly MA 100 around $87,400, Bitcoin is once again trading within a critical range.
Key Levels to Watch:
🟢 Support • Weekly MA 50: $75,500 • Weekly MA 200: $67,800
🔴 Resistance • Immediate: $82,000 • Major: $87,400 (Weekly MA 100)
Momentum Check:
• RSI near 50 indicates neutral momentum
• Stochastic RSI is weakening, suggesting potential short-term downside.
• A sustained move above the weekly MA 100 would strengthen the bullish outlook.
My Take:
The 2023 comparison is interesting, but history doesn't guarantee repetition.
Bitcoin needs to defend its key support levels and reclaim the weekly MA 100 with a confirmed weekly close.
A successful breakout could open the door to another significant upside move. However, losing support would weaken the bullish structure.
Patience is key. Let the weekly candles confirm the next direction.
#BTC Price Analysis# #Macro Insights#
55
加密货币市场充满不确定性,而预测市场提供了一种有趣的方式,让人追踪市场预期的变化。
@polymarket 聚焦于围绕主要加密货币的关键问题:
₿ $BTC — 比特币能否维持市场领先地位?
ETH — 以太坊能否重拾强劲动能?
$DOGE — 狗狗币能否重新吸引关注?
✕ $XRP — XRP 能否持续提升市场实力?
每种资产都有不同的发展故事,但市场情绪、流动性和即将到来的进展仍将是重要因素。
有趣之处不只是预测接下来会发生什么,而是理解市场为何如此预期。
#Polymarket #BTC 价格分析# #宏观洞察#
加密货币市场充满不确定性,而预测市场提供了一种有趣的方式,让人追踪市场预期的变化。
@polymarket 聚焦于围绕主要加密货币的关键问题:
₿ $BTC — 比特币能否维持市场领先地位?
ETH — 以太坊能否重拾强劲动能?
$DOGE — 狗狗币能否重新吸引关注?
✕ $XRP — XRP 能否持续提升市场实力?
每种资产都有不同的发展故事,但市场情绪、流动性和即将到来的进展仍将是重要因素。
有趣之处不只是预测接下来会发生什么,而是理解市场为何如此预期。
#Polymarket #BTC 价格分析# #宏观洞察#
@polymarket 聚焦于围绕主要加密货币的关键问题:
₿ $BTC — 比特币能否维持市场领先地位?
ETH — 以太坊能否重拾强劲动能?
$DOGE — 狗狗币能否重新吸引关注?
✕ $XRP — XRP 能否持续提升市场实力?
每种资产都有不同的发展故事,但市场情绪、流动性和即将到来的进展仍将是重要因素。
有趣之处不只是预测接下来会发生什么,而是理解市场为何如此预期。
#Polymarket #BTC 价格分析# #宏观洞察#

71
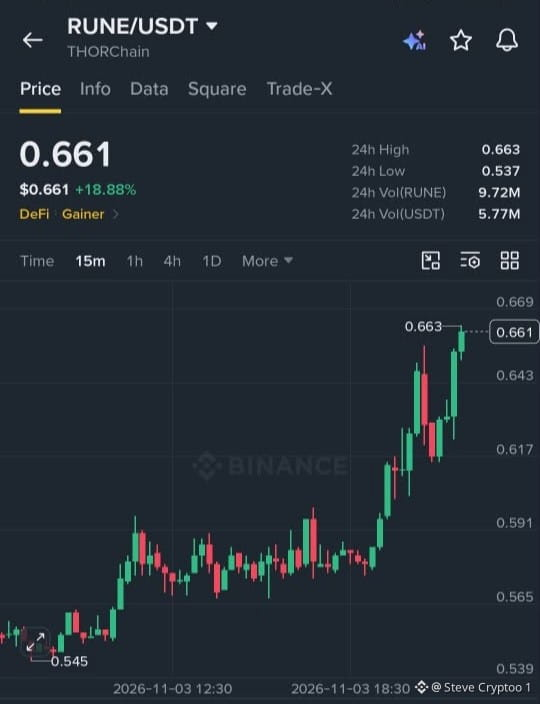
$RUNE 展现强劲看涨动能|前方关键阻力位
$RUNE 正迎来令人印象深刻的涨势,目前在 15 分钟图表上的交易价格约为 $0.661(+18.88%)。
关键技术位:
🔹 阻力位:$0.663–$0.669
🔹 支撑位 1:$0.643
🔹 支撑位 2:$0.617
🔹 主要支撑位:$0.591
接下来会如何?
若在强劲成交量支撑下,价格确认突破 $0.663–$0.669,将有望进一步上涨。
我的看法:目前动能明显偏向买方,但仍需确认。请密切留意阻力区。
#BTC 价格分析# #总体经济洞察#
$RUNE 展现强劲看涨动能|前方关键阻力位
$RUNE 正迎来令人印象深刻的涨势,目前在 15 分钟图表上的交易价格约为 $0.661(+18.88%)。
关键技术位:
🔹 阻力位:$0.663–$0.669
🔹 支撑位 1:$0.643
🔹 支撑位 2:$0.617
🔹 主要支撑位:$0.591
接下来会如何?
若在强劲成交量支撑下,价格确认突破 $0.663–$0.669,将有望进一步上涨。
我的看法:目前动能明显偏向买方,但仍需确认。请密切留意阻力区。
#BTC 价格分析# #总体经济洞察#
$RUNE 正迎来令人印象深刻的涨势,目前在 15 分钟图表上的交易价格约为 $0.661(+18.88%)。
关键技术位:
🔹 阻力位:$0.663–$0.669
🔹 支撑位 1:$0.643
🔹 支撑位 2:$0.617
🔹 主要支撑位:$0.591
接下来会如何?
若在强劲成交量支撑下,价格确认突破 $0.663–$0.669,将有望进一步上涨。
我的看法:目前动能明显偏向买方,但仍需确认。请密切留意阻力区。
#BTC 价格分析# #总体经济洞察#
73
市场仍让所有人捉摸不定之际,大型玩家正采取行动。
Strategy 再购入价值 6,550 万美元的 811 $BTC,使其持有总量达到惊人的 849,327 $BTC。
与此同时,Metaplanet 在 10 月 14 日至 31 日期间,以 252.7 亿日圆回购了 9,645 万股。
两项重大动作,带来一个明确的讯息:企业的比特币策略仍是市场焦点。
这些机构动向值得关注。
#Bitcoin #Metaplanet #Strategy
市场仍让所有人捉摸不定之际,大型玩家正采取行动。
Strategy 再购入价值 6,550 万美元的 811 $BTC,使其持有总量达到惊人的 849,327 $BTC。
与此同时,Metaplanet 在 10 月 14 日至 31 日期间,以 252.7 亿日圆回购了 9,645 万股。
两项重大动作,带来一个明确的讯息:企业的比特币策略仍是市场焦点。
这些机构动向值得关注。
#Bitcoin #Metaplanet #Strategy
Strategy 再购入价值 6,550 万美元的 811 $BTC,使其持有总量达到惊人的 849,327 $BTC。
与此同时,Metaplanet 在 10 月 14 日至 31 日期间,以 252.7 亿日圆回购了 9,645 万股。
两项重大动作,带来一个明确的讯息:企业的比特币策略仍是市场焦点。
这些机构动向值得关注。
#Bitcoin #Metaplanet #Strategy


53
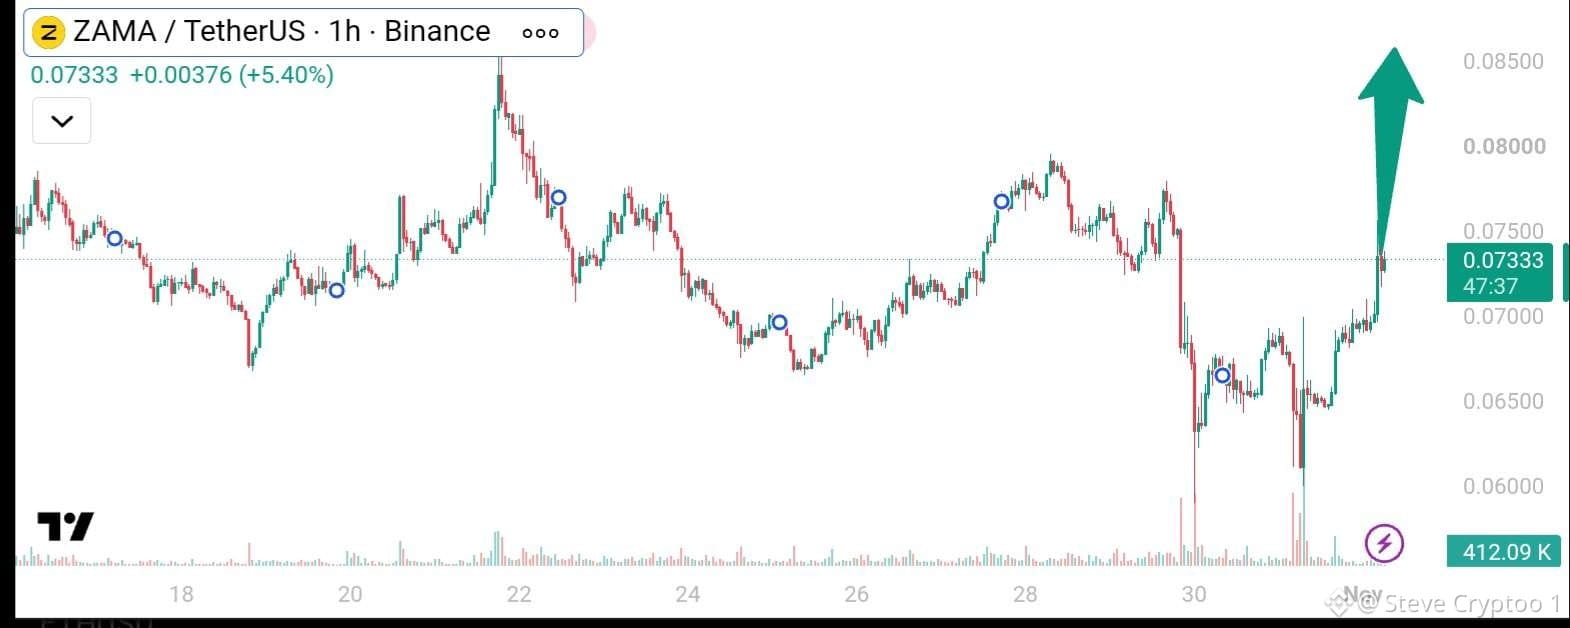
$ZAMA — 多头正重新掌控局势!
ZAMA 在 1 小时图表上展现强劲反弹,目前交易价格约为 $0.0733(+5.40%),此前从 $0.061–$0.065 支撑区反弹。
关键技术价位:
即时支撑:$0.070–$0.071
主要支撑:$0.065–$0.067
阻力位:$0.075–$0.078
上行目标:$0.080–$0.085
市场展望:买方正逐步重建动能,近期的反弹也显示短期市场情绪有所改善。
若 1 小时 K 线强势收于 $0.075–$0.078 之上,且成交量同步增加,可能会强化看涨格局,并为价格迈向 $0.080、甚至 $0.085 打开空间。
然而,若在阻力位遭遇压制,价格可能再次回测 $0.070 支撑区。
#BTC 价格分析# #宏观洞察#
$ZAMA — 多头正重新掌控局势!
ZAMA 在 1 小时图表上展现强劲反弹,目前交易价格约为 $0.0733(+5.40%),此前从 $0.061–$0.065 支撑区反弹。
关键技术价位:
即时支撑:$0.070–$0.071
主要支撑:$0.065–$0.067
阻力位:$0.075–$0.078
上行目标:$0.080–$0.085
市场展望:买方正逐步重建动能,近期的反弹也显示短期市场情绪有所改善。
若 1 小时 K 线强势收于 $0.075–$0.078 之上,且成交量同步增加,可能会强化看涨格局,并为价格迈向 $0.080、甚至 $0.085 打开空间。
然而,若在阻力位遭遇压制,价格可能再次回测 $0.070 支撑区。
#BTC 价格分析# #宏观洞察#
ZAMA 在 1 小时图表上展现强劲反弹,目前交易价格约为 $0.0733(+5.40%),此前从 $0.061–$0.065 支撑区反弹。
关键技术价位:
即时支撑:$0.070–$0.071
主要支撑:$0.065–$0.067
阻力位:$0.075–$0.078
上行目标:$0.080–$0.085
市场展望:买方正逐步重建动能,近期的反弹也显示短期市场情绪有所改善。
若 1 小时 K 线强势收于 $0.075–$0.078 之上,且成交量同步增加,可能会强化看涨格局,并为价格迈向 $0.080、甚至 $0.085 打开空间。
然而,若在阻力位遭遇压制,价格可能再次回测 $0.070 支撑区。
#BTC 价格分析# #宏观洞察#
57
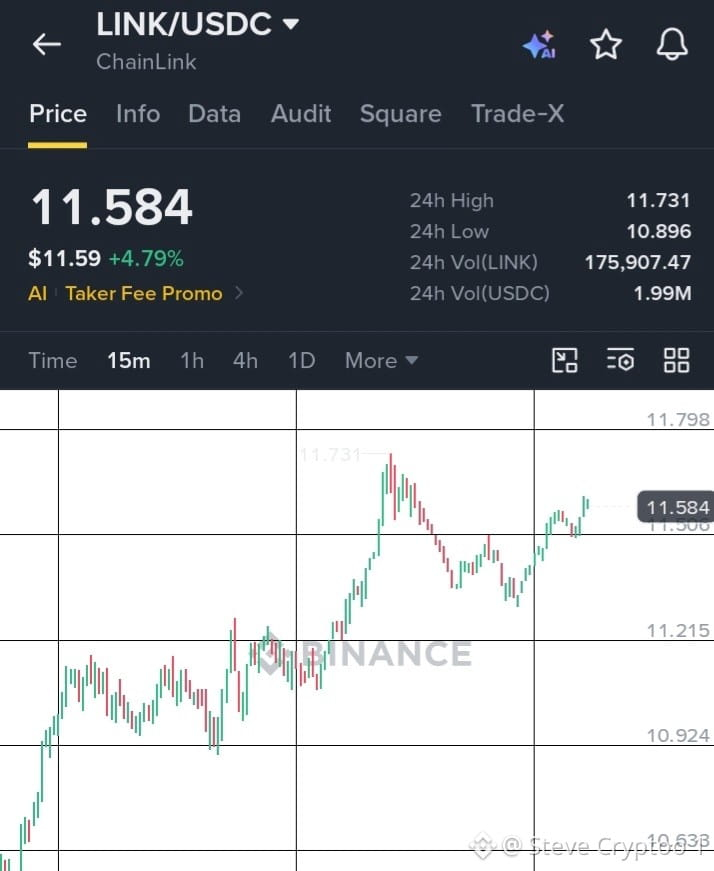
$LINK 正展现强劲的看涨动能!
Chainlink 目前在 $11.58 附近交易,上涨 4.79%,买方在 15 分钟图表上持续掌控局势。
走势呈现高点逐步垫高、低点逐步垫高,显示短期强势可能延续。
📊 值得关注的关键价位:
阻力位:$11.70–$11.73
支撑位:$11.50
较低支撑位:$11.35–$11.22
看涨情境:若放量确认突破 $11.73,价格可能进一步迈向更高水位。
我的看法:$LINK 的走势看来正面,但下一次突破需要成交量确认。请密切关注 $11.73 价位。
#BTC 价格分析# #宏观见解# #山寨币季# #迷因币 Alpha# #BNBChain#
$LINK 正展现强劲的看涨动能!
Chainlink 目前在 $11.58 附近交易,上涨 4.79%,买方在 15 分钟图表上持续掌控局势。
走势呈现高点逐步垫高、低点逐步垫高,显示短期强势可能延续。
📊 值得关注的关键价位:
阻力位:$11.70–$11.73
支撑位:$11.50
较低支撑位:$11.35–$11.22
看涨情境:若放量确认突破 $11.73,价格可能进一步迈向更高水位。
我的看法:$LINK 的走势看来正面,但下一次突破需要成交量确认。请密切关注 $11.73 价位。
#BTC 价格分析# #宏观见解# #山寨币季# #迷因币 Alpha# #BNBChain#
Chainlink 目前在 $11.58 附近交易,上涨 4.79%,买方在 15 分钟图表上持续掌控局势。
走势呈现高点逐步垫高、低点逐步垫高,显示短期强势可能延续。
📊 值得关注的关键价位:
阻力位:$11.70–$11.73
支撑位:$11.50
较低支撑位:$11.35–$11.22
看涨情境:若放量确认突破 $11.73,价格可能进一步迈向更高水位。
我的看法:$LINK 的走势看来正面,但下一次突破需要成交量确认。请密切关注 $11.73 价位。
#BTC 价格分析# #宏观见解# #山寨币季# #迷因币 Alpha# #BNBChain#
82
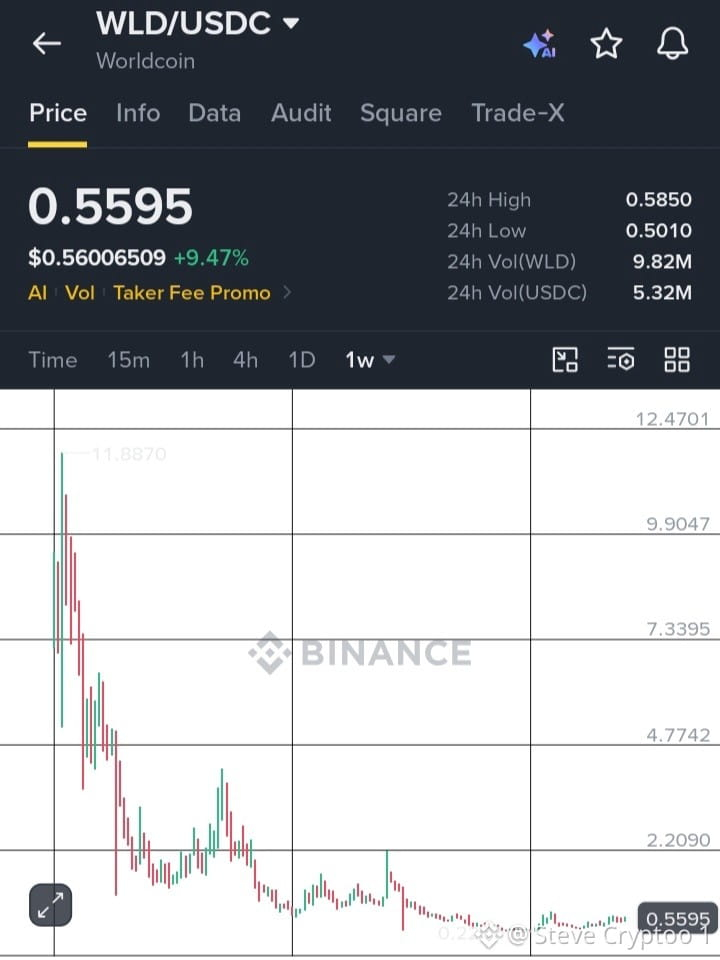
$WLD 当前交易价格为 $0.5595,24 小时内上涨 9.47%,表明在长期看跌压力后出现短期回升。
🔹 阻力位:$0.5850
🔹 关键支撑位:$0.5010
📈 看涨情景:若放量确认突破 $0.5850,回升势头可能延续。
📉 看跌情景:若失守 $0.5010,可能引发新一轮抛售压力。
展望:市场动能正在改善,但整体趋势仍然看跌。在确认突破之前,谨慎看待趋势是否已持续反转。
#WLD #Worldcoin #TechnicalAnalysis #CryptoMarkets
$WLD 当前交易价格为 $0.5595,24 小时内上涨 9.47%,表明在长期看跌压力后出现短期回升。
🔹 阻力位:$0.5850
🔹 关键支撑位:$0.5010
📈 看涨情景:若放量确认突破 $0.5850,回升势头可能延续。
📉 看跌情景:若失守 $0.5010,可能引发新一轮抛售压力。
展望:市场动能正在改善,但整体趋势仍然看跌。在确认突破之前,谨慎看待趋势是否已持续反转。
#WLD #Worldcoin #TechnicalAnalysis #CryptoMarkets
🔹 阻力位:$0.5850
🔹 关键支撑位:$0.5010
📈 看涨情景:若放量确认突破 $0.5850,回升势头可能延续。
📉 看跌情景:若失守 $0.5010,可能引发新一轮抛售压力。
展望:市场动能正在改善,但整体趋势仍然看跌。在确认突破之前,谨慎看待趋势是否已持续反转。
#WLD #Worldcoin #TechnicalAnalysis #CryptoMarkets
45
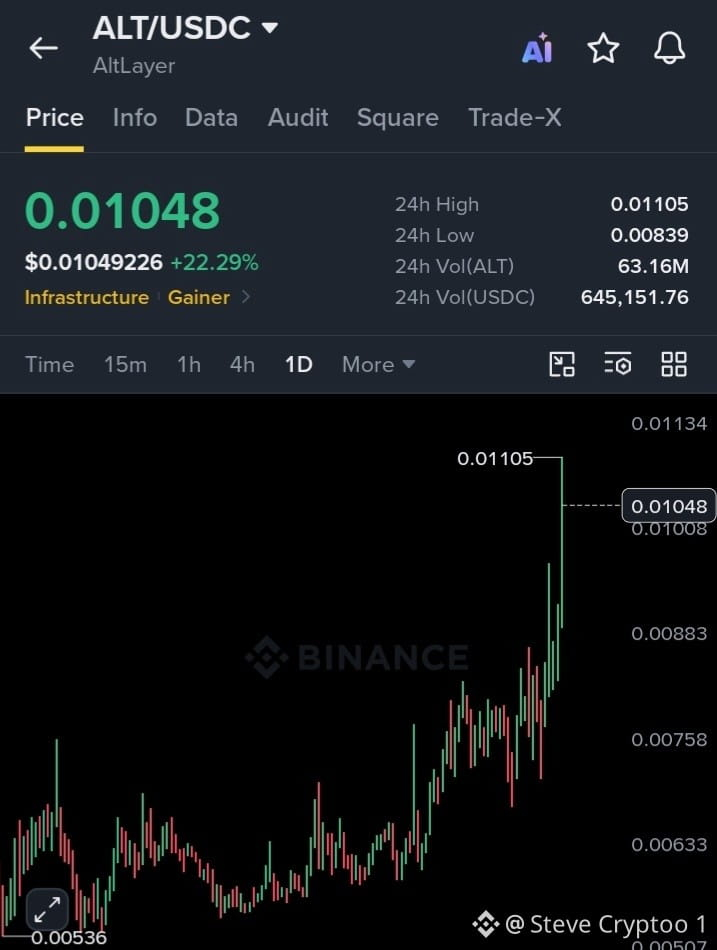
根据图表,$ALT 表现强劲,目前交投于约 $0.01048,24 小时涨幅达 22.29%。
市场要点:
💚 24 小时最高价:$0.01105
📊 24 小时最低价:$0.00839
⚡ 24 小时成交量:63.16M ALT
📈 价格在大幅上涨后,正向关键阻力区推进。
🎯 关注价位:
🔹 阻力位:$0.01105–$0.01134
🔹 支撑位:$0.01000,其次是 $0.00883
🔹 若价格持续突破阻力位,可能预示着进一步走强;若受阻回落,则可能引发回调。
市场动能偏多,但如此快速的上涨之后,波动和获利了结仍是重要风险。下结论前,请留意确认信号。
$ALT 能否突破 $0.01105,还是会暂歇整固?👀
#BTC价格分析# #宏观洞察#
根据图表,$ALT 表现强劲,目前交投于约 $0.01048,24 小时涨幅达 22.29%。
市场要点:
💚 24 小时最高价:$0.01105
📊 24 小时最低价:$0.00839
⚡ 24 小时成交量:63.16M ALT
📈 价格在大幅上涨后,正向关键阻力区推进。
🎯 关注价位:
🔹 阻力位:$0.01105–$0.01134
🔹 支撑位:$0.01000,其次是 $0.00883
🔹 若价格持续突破阻力位,可能预示着进一步走强;若受阻回落,则可能引发回调。
市场动能偏多,但如此快速的上涨之后,波动和获利了结仍是重要风险。下结论前,请留意确认信号。
$ALT 能否突破 $0.01105,还是会暂歇整固?👀
#BTC价格分析# #宏观洞察#
市场要点:
💚 24 小时最高价:$0.01105
📊 24 小时最低价:$0.00839
⚡ 24 小时成交量:63.16M ALT
📈 价格在大幅上涨后,正向关键阻力区推进。
🎯 关注价位:
🔹 阻力位:$0.01105–$0.01134
🔹 支撑位:$0.01000,其次是 $0.00883
🔹 若价格持续突破阻力位,可能预示着进一步走强;若受阻回落,则可能引发回调。
市场动能偏多,但如此快速的上涨之后,波动和获利了结仍是重要风险。下结论前,请留意确认信号。
$ALT 能否突破 $0.01105,还是会暂歇整固?👀
#BTC价格分析# #宏观洞察#
70
AI 并未失去增长势头——资本成本正在上升。
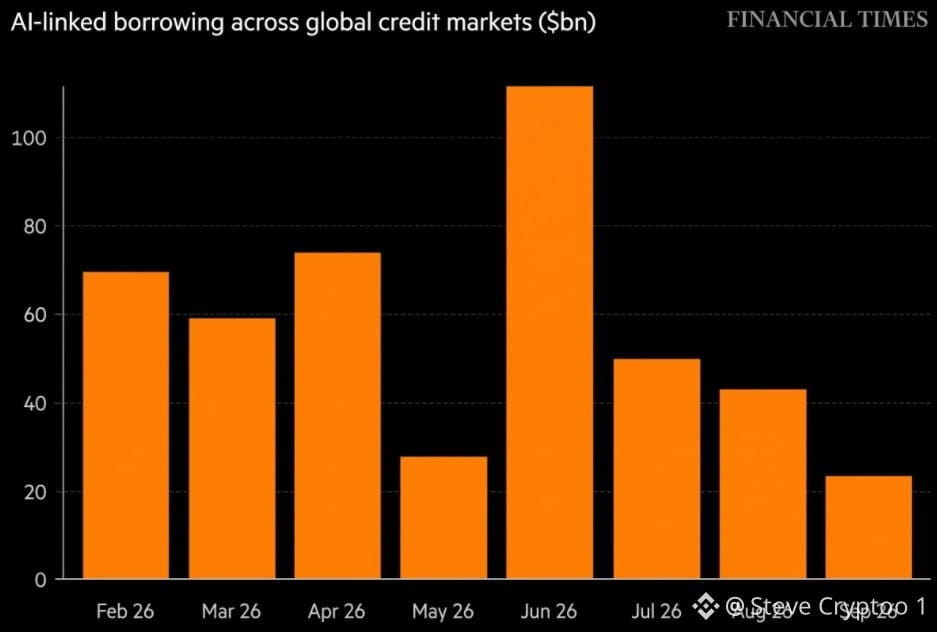
全球信贷市场中与 AI 相关的借贷情况揭示了一个耐人寻味的趋势。6 月借贷额一度超过 1,100 亿美元,随后大幅下降,到 9 月约为 240 亿美元。
但这是否意味着 AI 需求正在减弱?未必。
🇺🇸 美国债务攀升以及长期国债收益率居高不下,可能会推高数据中心、芯片和 AI 基础设施的融资成本。当资本变得更加昂贵时,即使是高速增长的行业,也可能放缓支出和借贷。
关键区别在于:融资压力并不意味着需求必然遭到破坏。
长期来看,AI 的投资逻辑仍值得关注,但执行能力、估值以及获取可负担资本的渠道都将至关重要。
👀 密切关注 AI 基础设施生态:
🔹 $SNDK — 数据存储
🔹 $MU — 内存和高带宽内存
🔹 $TAO — 去中心化 AI
🔹 $NEAR — 区块链基础设施及 AI 相关开发
📊 真正的问题是:这是暂时的融资放缓,还是 AI 投资整体进入更广泛调整的开端?
下一阶段,基本面或许会比炒作更受青睐。
#BTC 价格分析# #宏观洞察#
AI 并未失去增长势头——资本成本正在上升。
全球信贷市场中与 AI 相关的借贷情况揭示了一个耐人寻味的趋势。6 月借贷额一度超过 1,100 亿美元,随后大幅下降,到 9 月约为 240 亿美元。
但这是否意味着 AI 需求正在减弱?未必。
🇺🇸 美国债务攀升以及长期国债收益率居高不下,可能会推高数据中心、芯片和 AI 基础设施的融资成本。当资本变得更加昂贵时,即使是高速增长的行业,也可能放缓支出和借贷。
关键区别在于:融资压力并不意味着需求必然遭到破坏。
长期来看,AI 的投资逻辑仍值得关注,但执行能力、估值以及获取可负担资本的渠道都将至关重要。
👀 密切关注 AI 基础设施生态:
🔹 $SNDK — 数据存储
🔹 $MU — 内存和高带宽内存
🔹 $TAO — 去中心化 AI
🔹 $NEAR — 区块链基础设施及 AI 相关开发
📊 真正的问题是:这是暂时的融资放缓,还是 AI 投资整体进入更广泛调整的开端?
下一阶段,基本面或许会比炒作更受青睐。
#BTC 价格分析# #宏观洞察#
全球信贷市场中与 AI 相关的借贷情况揭示了一个耐人寻味的趋势。6 月借贷额一度超过 1,100 亿美元,随后大幅下降,到 9 月约为 240 亿美元。
但这是否意味着 AI 需求正在减弱?未必。
🇺🇸 美国债务攀升以及长期国债收益率居高不下,可能会推高数据中心、芯片和 AI 基础设施的融资成本。当资本变得更加昂贵时,即使是高速增长的行业,也可能放缓支出和借贷。
关键区别在于:融资压力并不意味着需求必然遭到破坏。
长期来看,AI 的投资逻辑仍值得关注,但执行能力、估值以及获取可负担资本的渠道都将至关重要。
👀 密切关注 AI 基础设施生态:
🔹 $SNDK — 数据存储
🔹 $MU — 内存和高带宽内存
🔹 $TAO — 去中心化 AI
🔹 $NEAR — 区块链基础设施及 AI 相关开发
📊 真正的问题是:这是暂时的融资放缓,还是 AI 投资整体进入更广泛调整的开端?
下一阶段,基本面或许会比炒作更受青睐。
#BTC 价格分析# #宏观洞察#
86
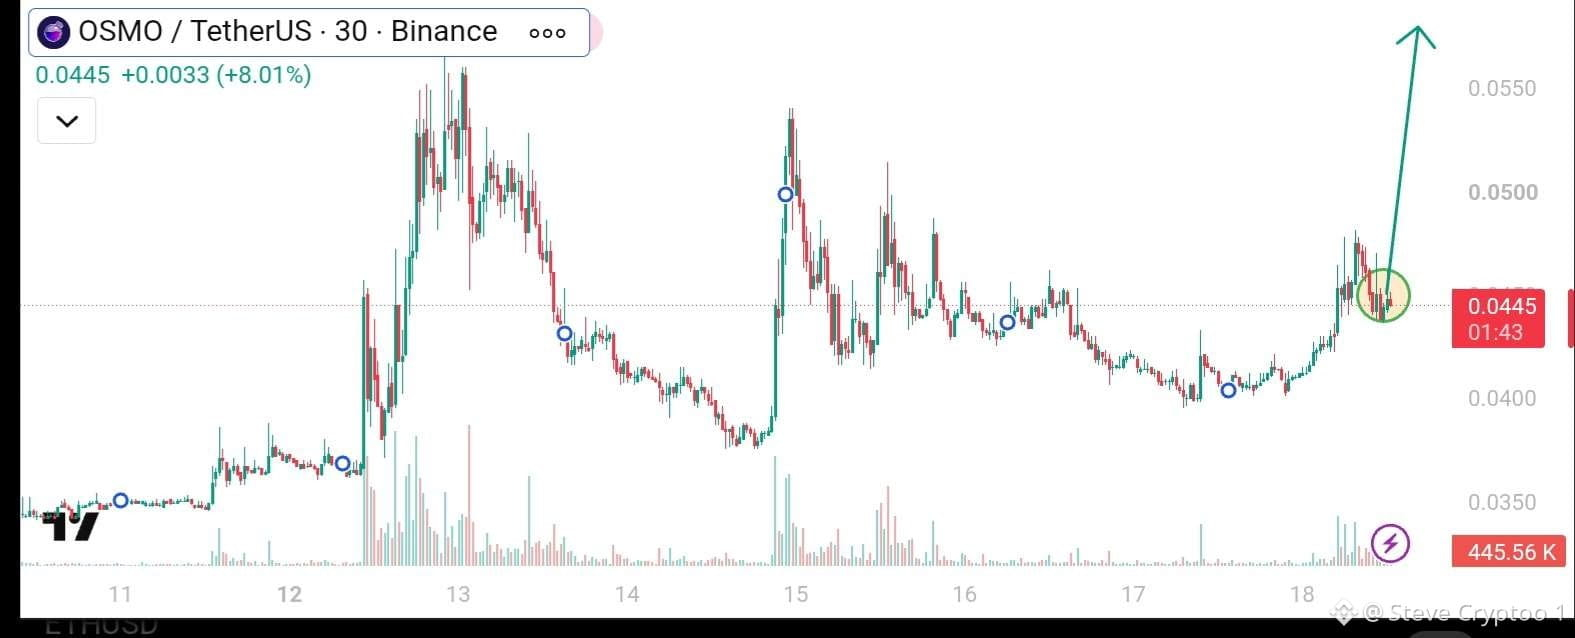
$OSMO 目前交易价格约为 $0.0445,涨幅为 8.01%。经过长时间盘整后,买盘兴趣再度升温。
📊 技术展望:近期突破后,价格正在测试 $0.0440–$0.0450 区间。
若能守住该区间,价格或有望进一步升至 $0.0470–$0.0500。若强势突破 $0.0500,则可能进一步上探 $0.0550。
关键风险:若失守 $0.0440,可能回调至 $0.0420–$0.0400 区间。
我的看法:目前动能前景不错,但仍需持续放量买入来确认。请密切关注支撑位和阻力位。
#BTC 价格分析# #宏观洞察#
$OSMO 目前交易价格约为 $0.0445,涨幅为 8.01%。经过长时间盘整后,买盘兴趣再度升温。
📊 技术展望:近期突破后,价格正在测试 $0.0440–$0.0450 区间。
若能守住该区间,价格或有望进一步升至 $0.0470–$0.0500。若强势突破 $0.0500,则可能进一步上探 $0.0550。
关键风险:若失守 $0.0440,可能回调至 $0.0420–$0.0400 区间。
我的看法:目前动能前景不错,但仍需持续放量买入来确认。请密切关注支撑位和阻力位。
#BTC 价格分析# #宏观洞察#
📊 技术展望:近期突破后,价格正在测试 $0.0440–$0.0450 区间。
若能守住该区间,价格或有望进一步升至 $0.0470–$0.0500。若强势突破 $0.0500,则可能进一步上探 $0.0550。
关键风险:若失守 $0.0440,可能回调至 $0.0420–$0.0400 区间。
我的看法:目前动能前景不错,但仍需持续放量买入来确认。请密切关注支撑位和阻力位。
#BTC 价格分析# #宏观洞察#
75
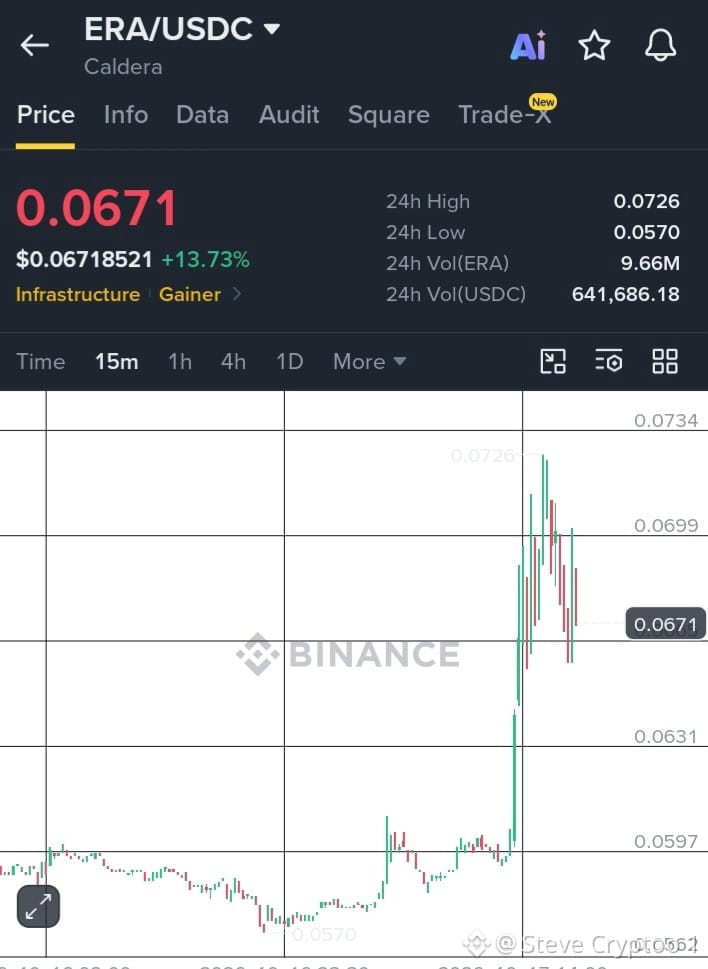
$ERA 展现出强劲的看涨势头,涨幅达 13.73%,买方正推动价格升向 $0.0671。
在 $0.0570–$0.0600 附近盘整后,ERA 强势突破,盘中一度触及 $0.0726,随后面临获利了结带来的抛压。
💰 当前价格:$0.0671
📈 24 小时涨跌幅:+13.73%
🔥 24 小时最高价:$0.0726
📉 24 小时最低价:$0.0570
💎 交易量:9.66M ERA
若能持续突破 $0.0699,价格或将再次测试 $0.0726。若突破该阻力位,看涨延续格局可能进一步增强。
不过,若跌破 $0.0665,价格可能进一步回调至 $0.0631 附近。
多头是在蓄势开启新一轮上涨,还是市场即将进入冷却期?
#交易 #BTC价格分析 #宏观洞察
$ERA 展现出强劲的看涨势头,涨幅达 13.73%,买方正推动价格升向 $0.0671。
在 $0.0570–$0.0600 附近盘整后,ERA 强势突破,盘中一度触及 $0.0726,随后面临获利了结带来的抛压。
💰 当前价格:$0.0671
📈 24 小时涨跌幅:+13.73%
🔥 24 小时最高价:$0.0726
📉 24 小时最低价:$0.0570
💎 交易量:9.66M ERA
若能持续突破 $0.0699,价格或将再次测试 $0.0726。若突破该阻力位,看涨延续格局可能进一步增强。
不过,若跌破 $0.0665,价格可能进一步回调至 $0.0631 附近。
多头是在蓄势开启新一轮上涨,还是市场即将进入冷却期?
#交易 #BTC价格分析 #宏观洞察
在 $0.0570–$0.0600 附近盘整后,ERA 强势突破,盘中一度触及 $0.0726,随后面临获利了结带来的抛压。
💰 当前价格:$0.0671
📈 24 小时涨跌幅:+13.73%
🔥 24 小时最高价:$0.0726
📉 24 小时最低价:$0.0570
💎 交易量:9.66M ERA
若能持续突破 $0.0699,价格或将再次测试 $0.0726。若突破该阻力位,看涨延续格局可能进一步增强。
不过,若跌破 $0.0665,价格可能进一步回调至 $0.0631 附近。
多头是在蓄势开启新一轮上涨,还是市场即将进入冷却期?
#交易 #BTC价格分析 #宏观洞察
61
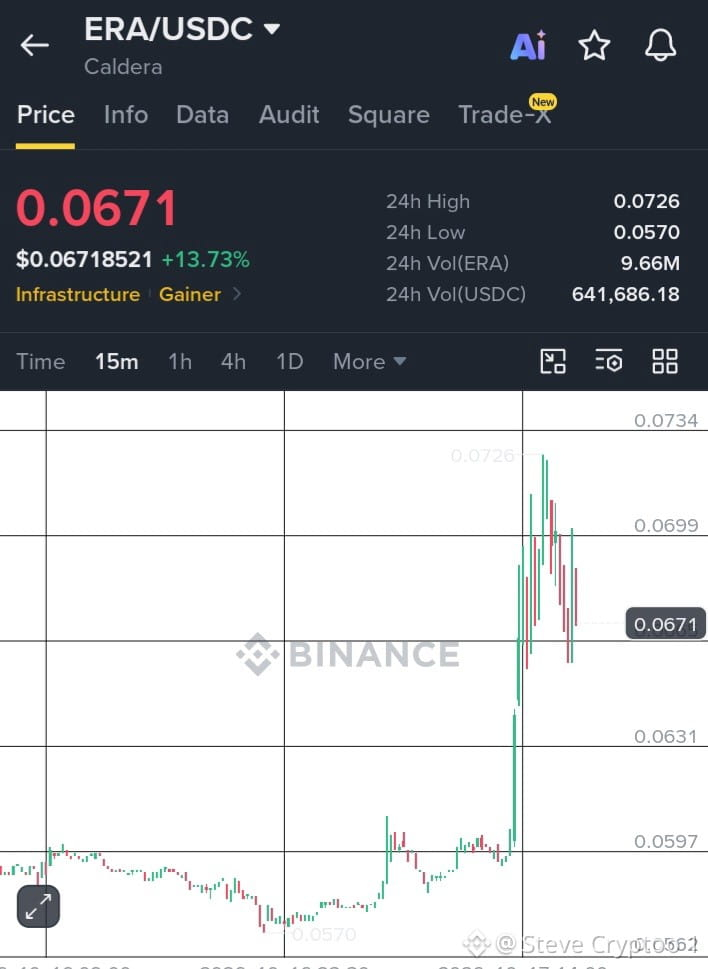
$ERA 展现出强劲的看涨动能,涨幅达 13.73%,买方正推动价格升至 $0.0671。
在 $0.0570–$0.0600 附近盘整后,ERA 强势突破,盘中一度触及 $0.0726,随后遭遇获利了结带来的压力。
💰 当前价格:$0.0671
📈 24 小时涨幅:+13.73%
🔥 24 小时最高价:$0.0726
📉 24 小时最低价:$0.0570
💎 交易量:9.66M ERA
若能持续突破 $0.0699,价格或将再次测试 $0.0726。若突破这一阻力位,看涨延续的可能性或将增强。
不过,若跌破 $0.0665,可能引发更深的回调,目标位在 $0.0631 附近。
多头是在蓄势再创新高,还是市场即将迎来降温?
#交易 #BTC价格分析# #宏观洞察#
$ERA 展现出强劲的看涨动能,涨幅达 13.73%,买方正推动价格升至 $0.0671。
在 $0.0570–$0.0600 附近盘整后,ERA 强势突破,盘中一度触及 $0.0726,随后遭遇获利了结带来的压力。
💰 当前价格:$0.0671
📈 24 小时涨幅:+13.73%
🔥 24 小时最高价:$0.0726
📉 24 小时最低价:$0.0570
💎 交易量:9.66M ERA
若能持续突破 $0.0699,价格或将再次测试 $0.0726。若突破这一阻力位,看涨延续的可能性或将增强。
不过,若跌破 $0.0665,可能引发更深的回调,目标位在 $0.0631 附近。
多头是在蓄势再创新高,还是市场即将迎来降温?
#交易 #BTC价格分析# #宏观洞察#
在 $0.0570–$0.0600 附近盘整后,ERA 强势突破,盘中一度触及 $0.0726,随后遭遇获利了结带来的压力。
💰 当前价格:$0.0671
📈 24 小时涨幅:+13.73%
🔥 24 小时最高价:$0.0726
📉 24 小时最低价:$0.0570
💎 交易量:9.66M ERA
若能持续突破 $0.0699,价格或将再次测试 $0.0726。若突破这一阻力位,看涨延续的可能性或将增强。
不过,若跌破 $0.0665,可能引发更深的回调,目标位在 $0.0631 附近。
多头是在蓄势再创新高,还是市场即将迎来降温?
#交易 #BTC价格分析# #宏观洞察#
81
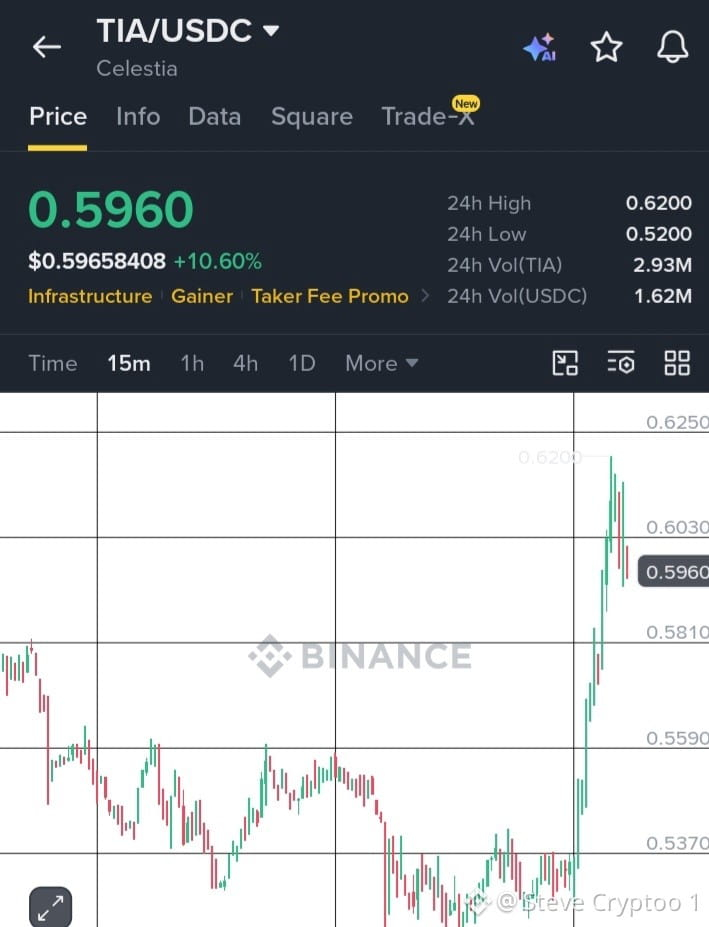
$TIA 现报 $0.5960,涨幅 10.60%,此前在 15 分钟图上强势突破。
📊 关键价位:
🟢 阻力位:$0.6030 – $0.6200
🔵 支撑位:$0.5810 – $0.5590
📈 24 小时最高价:$0.6200
🔥 24 小时最低价:$0.520
强劲上涨后,多头已占据主导,但这轮快速拉升后,短期内可能出现盘整。
若突破 $0.6200,可能预示着还有进一步上涨空间;若跌破 $0.5810,则可能表明上涨动能减弱。
#BTC 价格分析# #宏观洞察# #山寨币季节# #Meme Alpha# #BNBChain#
$TIA 现报 $0.5960,涨幅 10.60%,此前在 15 分钟图上强势突破。
📊 关键价位:
🟢 阻力位:$0.6030 – $0.6200
🔵 支撑位:$0.5810 – $0.5590
📈 24 小时最高价:$0.6200
🔥 24 小时最低价:$0.520
强劲上涨后,多头已占据主导,但这轮快速拉升后,短期内可能出现盘整。
若突破 $0.6200,可能预示着还有进一步上涨空间;若跌破 $0.5810,则可能表明上涨动能减弱。
#BTC 价格分析# #宏观洞察# #山寨币季节# #Meme Alpha# #BNBChain#
📊 关键价位:
🟢 阻力位:$0.6030 – $0.6200
🔵 支撑位:$0.5810 – $0.5590
📈 24 小时最高价:$0.6200
🔥 24 小时最低价:$0.520
强劲上涨后,多头已占据主导,但这轮快速拉升后,短期内可能出现盘整。
若突破 $0.6200,可能预示着还有进一步上涨空间;若跌破 $0.5810,则可能表明上涨动能减弱。
#BTC 价格分析# #宏观洞察# #山寨币季节# #Meme Alpha# #BNBChain#
73
加密货币市场接下来会预测什么?
Polymarket 提供对未来事件的实时概率预测和大众情绪。
📊 三种值得关注的资产
₿ $BTC — 即将再创新高?
⚡ $XRP — 即将迎来突破?
☀️ $SOL — 还有更多上涨空间?
预测反映的是市场情绪,并不保证结果。
你在关注哪一个:BTC、XRP 还是 SOL?👇
@polymarket #Polymarket #宏观洞察# #宏观洞察#
加密货币市场接下来会预测什么?
Polymarket 提供对未来事件的实时概率预测和大众情绪。
📊 三种值得关注的资产
₿ $BTC — 即将再创新高?
⚡ $XRP — 即将迎来突破?
☀️ $SOL — 还有更多上涨空间?
预测反映的是市场情绪,并不保证结果。
你在关注哪一个:BTC、XRP 还是 SOL?👇
@polymarket #Polymarket #宏观洞察# #宏观洞察#
Polymarket 提供对未来事件的实时概率预测和大众情绪。
📊 三种值得关注的资产
₿ $BTC — 即将再创新高?
⚡ $XRP — 即将迎来突破?
☀️ $SOL — 还有更多上涨空间?
预测反映的是市场情绪,并不保证结果。
你在关注哪一个:BTC、XRP 还是 SOL?👇
@polymarket #Polymarket #宏观洞察# #宏观洞察#

60
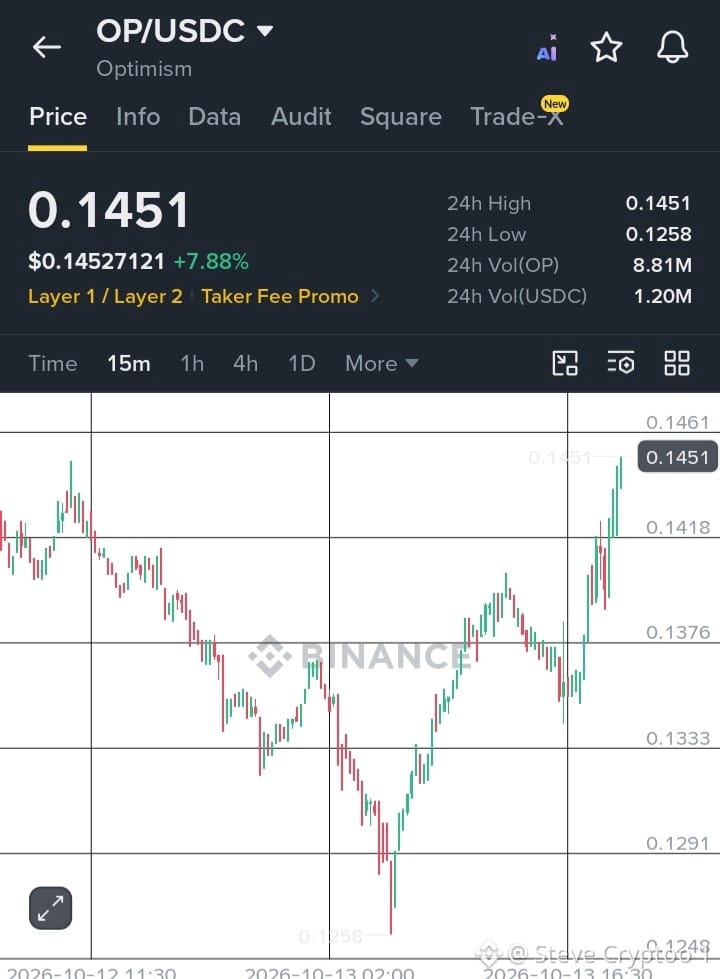
$OP 上涨 7.88%,报 $0.1451,在 15 分钟图表上突破 $0.1418。
🎯 阻力位:$0.1461
🟢 支撑位:$0.1418 / $0.1376
📈 若动能持续,目标价为 $0.1500。
$OP 能否守住突破,还是卖方会入场?👀
#BTC 价格分析# #宏观洞察# #山寨币季# #Meme Alpha# #BNBChain#
$OP 上涨 7.88%,报 $0.1451,在 15 分钟图表上突破 $0.1418。
🎯 阻力位:$0.1461
🟢 支撑位:$0.1418 / $0.1376
📈 若动能持续,目标价为 $0.1500。
$OP 能否守住突破,还是卖方会入场?👀
#BTC 价格分析# #宏观洞察# #山寨币季# #Meme Alpha# #BNBChain#
🎯 阻力位:$0.1461
🟢 支撑位:$0.1418 / $0.1376
📈 若动能持续,目标价为 $0.1500。
$OP 能否守住突破,还是卖方会入场?👀
#BTC 价格分析# #宏观洞察# #山寨币季# #Meme Alpha# #BNBChain#
76
登录解锁更多内容
加入币安广场,与全球加密货币用户互动
⚡️ 获取关于加密货币的最新实用信息。
💬 受到全球最大加密货币交易平台的信赖。
👍 发现来自认证创作者的真知灼见。
邮箱/手机号码
热门话题
美国现货XRPETF周流出创8个月新高
91,686 次浏览
284 人讨论中
$ETH
8个月最大资金出逃
XRP ETF一周被抽走1913万美元
机构也扛不住了
卧槽
兄弟们
XRP这次是真的有点难受了
美国现货XRP ETF在截至11月13日的一周内
净流出高达1913万美元
创下近8个月以来最大单周流出纪录
其中
11月9日单日就流出了1042万美元
11月10日又流出762万美元
这可不是几个散户卖掉几百块钱那么简单
机构资金也开始出现撤退迹象了
更TM扎心的是
XRP本身也跌破了1美元
11月以来累计下跌约20%
ETF资金流出、币价下跌
两件事撞在一起
市场情绪自然好不到哪里去
不过啊
兄弟们
自美国现货XRP ETF上市以来
累计净流入仍然约有17.9亿美元
也就是说
虽然最近资金开始撤退
但是这点钱目前还扛得住
不代表XRP就TM垮了
而且ETF资产规模一周缩水约1.91亿美元
其中真正由资金净流出造成的只有约1913万美元
其余大部分是币价下跌带来的资产缩水
这说明现在的问题不只是有人卖
而是XRP价格下跌正在进一步打击市场信心
接下来最值得关注的是0.99美元附近的支撑
如果这个位置守不住
市场恐慌可能继续放大
如果能重新站回1美元上方
才有机会缓解眼下的压力
兄弟们啊
我觉得机会快来了
现在各种消息都是利空的
好像要崩盘了
可能恰恰这个时候
大的就要来了
哈哈
你抄底了吗
#美国现货xrpetf周流出创8个月新高
孔大锤
·7次点赞
·34k 次浏览
美国PPI年率6.5%,低于预期或缓解BTC压力
476,630 次浏览
839 人讨论中
比特币活跃供应盈利占比跌破45%
372,632 次浏览
300 人讨论中