

R3N 1
557 个内容

R3N 1
举报
屏蔽用户
Web3 & crypto Analyst || Breaking down market moves || token updates daily ➪NFA!!!
0 关注
3 粉丝
3 点赞
帖子
·
--
此处并未窃取任何私钥。这个细节比「3.516 亿美元」的标题数字更重要,因为它会改变这件事本质上到底是什么问题。
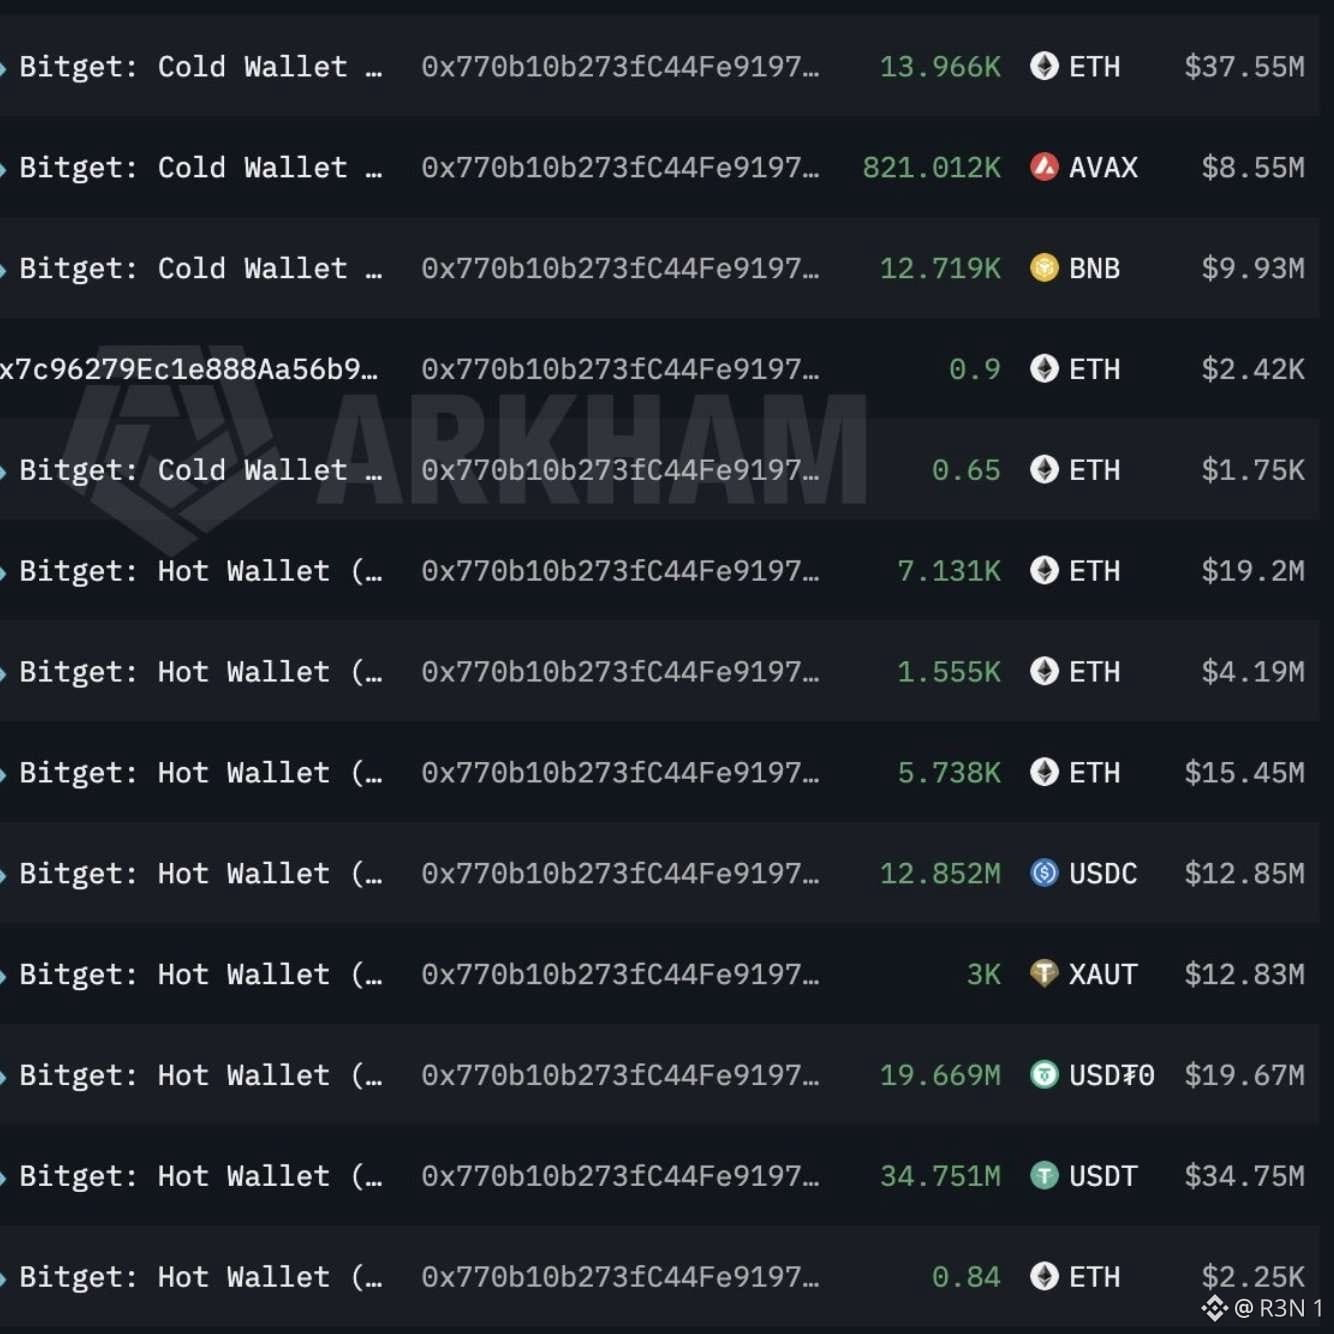
Bitget 执行长 Gracy Chen 确认,攻击者在钱包基础设施中的后端系统遭到入侵,并伪造交易资料,同时触发交易所自身的授权流程以转移资金,而不是直接取得金钥。此次骇侵影响了热钱包与温钱包,于 9 月 24 日 18:31(UTC)被侦测到。据 Lookonchain 估计,被窃的最大单一资产为 XRP,涉及 1.0293 亿枚代币,价值 1.5748 亿美元。Bitget 表示,冷钱包仍然完全安全,且未被触及。
从「纸上」来看,回应速度确实很快。紧急协定在数分钟内启动,暂停提领以待安全审查,但存款与交易仍保持开放;Chen 也表示,全部损失落在 Bitget 的「用户保护基金」之内,该基金规模超过 4.64 亿美元。警方与链上安全公司已被通知,并已标记出可疑地址。Chen 也提到,初步的 IP 与 VPN 相似性可能指向北韩参与,但她尚未明确证实。
关键在于脉络:这现在是 2026 年迄今规模最大的单一加密资产盗窃,超越 9 月 6 日从 Blockstream 的 Liquid Network 窃走的约 3.2 亿美元,使今年 9 月成为加密骇客事件最昂贵的月份。
我真诚的判读是:这更像是「被攻破的授权流程」而不是「被窃取的金钥」;属于较可控的失效模式——是基础设施或存取控制的漏洞,而非加密学层面的妥协;而冷钱包的隔离也确实存在。不过,资金是否真的安全,仍取决于那笔保护基金是否会如承诺般支付。
我在关注:Chen 承诺的完整技术报告,以及一旦审查完成提领是否会恢复。她已明确表示,她不会承诺一个自己无法保证的时间表。
#BTC Price Analysis# #Altcoin Season# $BTC $ETH
此处并未窃取任何私钥。这个细节比「3.516 亿美元」的标题数字更重要,因为它会改变这件事本质上到底是什么问题。
Bitget 执行长 Gracy Chen 确认,攻击者在钱包基础设施中的后端系统遭到入侵,并伪造交易资料,同时触发交易所自身的授权流程以转移资金,而不是直接取得金钥。此次骇侵影响了热钱包与温钱包,于 9 月 24 日 18:31(UTC)被侦测到。据 Lookonchain 估计,被窃的最大单一资产为 XRP,涉及 1.0293 亿枚代币,价值 1.5748 亿美元。Bitget 表示,冷钱包仍然完全安全,且未被触及。
从「纸上」来看,回应速度确实很快。紧急协定在数分钟内启动,暂停提领以待安全审查,但存款与交易仍保持开放;Chen 也表示,全部损失落在 Bitget 的「用户保护基金」之内,该基金规模超过 4.64 亿美元。警方与链上安全公司已被通知,并已标记出可疑地址。Chen 也提到,初步的 IP 与 VPN 相似性可能指向北韩参与,但她尚未明确证实。
关键在于脉络:这现在是 2026 年迄今规模最大的单一加密资产盗窃,超越 9 月 6 日从 Blockstream 的 Liquid Network 窃走的约 3.2 亿美元,使今年 9 月成为加密骇客事件最昂贵的月份。
我真诚的判读是:这更像是「被攻破的授权流程」而不是「被窃取的金钥」;属于较可控的失效模式——是基础设施或存取控制的漏洞,而非加密学层面的妥协;而冷钱包的隔离也确实存在。不过,资金是否真的安全,仍取决于那笔保护基金是否会如承诺般支付。
我在关注:Chen 承诺的完整技术报告,以及一旦审查完成提领是否会恢复。她已明确表示,她不会承诺一个自己无法保证的时间表。
#BTC Price Analysis# #Altcoin Season# $BTC $ETH
Bitget 执行长 Gracy Chen 确认,攻击者在钱包基础设施中的后端系统遭到入侵,并伪造交易资料,同时触发交易所自身的授权流程以转移资金,而不是直接取得金钥。此次骇侵影响了热钱包与温钱包,于 9 月 24 日 18:31(UTC)被侦测到。据 Lookonchain 估计,被窃的最大单一资产为 XRP,涉及 1.0293 亿枚代币,价值 1.5748 亿美元。Bitget 表示,冷钱包仍然完全安全,且未被触及。
从「纸上」来看,回应速度确实很快。紧急协定在数分钟内启动,暂停提领以待安全审查,但存款与交易仍保持开放;Chen 也表示,全部损失落在 Bitget 的「用户保护基金」之内,该基金规模超过 4.64 亿美元。警方与链上安全公司已被通知,并已标记出可疑地址。Chen 也提到,初步的 IP 与 VPN 相似性可能指向北韩参与,但她尚未明确证实。
关键在于脉络:这现在是 2026 年迄今规模最大的单一加密资产盗窃,超越 9 月 6 日从 Blockstream 的 Liquid Network 窃走的约 3.2 亿美元,使今年 9 月成为加密骇客事件最昂贵的月份。
我真诚的判读是:这更像是「被攻破的授权流程」而不是「被窃取的金钥」;属于较可控的失效模式——是基础设施或存取控制的漏洞,而非加密学层面的妥协;而冷钱包的隔离也确实存在。不过,资金是否真的安全,仍取决于那笔保护基金是否会如承诺般支付。
我在关注:Chen 承诺的完整技术报告,以及一旦审查完成提领是否会恢复。她已明确表示,她不会承诺一个自己无法保证的时间表。
#BTC Price Analysis# #Altcoin Season# $BTC $ETH

57
·
--
查看翻译
A liquidity pool is a smart contract holding two assets that users can swap between. The assets are deposited by liquidity providers, people who lock their tokens in the contract in exchange for a share of the fees every swap generates.
When someone swaps Token A for Token B on a DEX like Ston.fi they are not trading against another person. They are trading against the pool. The pool always provides a price using a formula based on the current ratio of the two assets. Buy Token A and the ratio shifts, Token A becomes more expensive, Token B becomes cheaper. The formula does this automatically with every trade.
Liquidity providers earn because every swap pays a fee. On Ston.fi that fee is 0.2% of the swap amount. That 0.2% distributes to everyone providing liquidity in the pool proportional to their share. If you own 1% of the pool's total liquidity you earn 1% of every fee generated.
The catch is impermanent loss. When the price ratio between the two assets in your pool changes the pool automatically rebalances against you accumulating more of the declining asset and less of the appreciating one. When you withdraw your position reflects that rebalanced ratio rather than what you deposited. The difference between what you would have held and what you actually hold is impermanent loss.
Whether providing liquidity is profitable depends on whether the fees earned exceed the impermanent loss accumulated over the holding period. Pools with high trading volume relative to their total liquidity generate more fees per dollar deployed. Stable pairs where the price ratio rarely changes produce less impermanent loss.
Reading both numbers together before entering any pool is the starting point for evaluating whether the position makes sense.
Explore STONfi pools → https://app.ston.fi/pools
$BTC #BTC Price Analysis# #Meme Alpha# $SOL
A liquidity pool is a smart contract holding two assets that users can swap between. The assets are deposited by liquidity providers, people who lock their tokens in the contract in exchange for a share of the fees every swap generates.
When someone swaps Token A for Token B on a DEX like Ston.fi they are not trading against another person. They are trading against the pool. The pool always provides a price using a formula based on the current ratio of the two assets. Buy Token A and the ratio shifts, Token A becomes more expensive, Token B becomes cheaper. The formula does this automatically with every trade.
Liquidity providers earn because every swap pays a fee. On Ston.fi that fee is 0.2% of the swap amount. That 0.2% distributes to everyone providing liquidity in the pool proportional to their share. If you own 1% of the pool's total liquidity you earn 1% of every fee generated.
The catch is impermanent loss. When the price ratio between the two assets in your pool changes the pool automatically rebalances against you accumulating more of the declining asset and less of the appreciating one. When you withdraw your position reflects that rebalanced ratio rather than what you deposited. The difference between what you would have held and what you actually hold is impermanent loss.
Whether providing liquidity is profitable depends on whether the fees earned exceed the impermanent loss accumulated over the holding period. Pools with high trading volume relative to their total liquidity generate more fees per dollar deployed. Stable pairs where the price ratio rarely changes produce less impermanent loss.
Reading both numbers together before entering any pool is the starting point for evaluating whether the position makes sense.
Explore STONfi pools → https://app.ston.fi/pools
$BTC #BTC Price Analysis# #Meme Alpha# $SOL
When someone swaps Token A for Token B on a DEX like Ston.fi they are not trading against another person. They are trading against the pool. The pool always provides a price using a formula based on the current ratio of the two assets. Buy Token A and the ratio shifts, Token A becomes more expensive, Token B becomes cheaper. The formula does this automatically with every trade.
Liquidity providers earn because every swap pays a fee. On Ston.fi that fee is 0.2% of the swap amount. That 0.2% distributes to everyone providing liquidity in the pool proportional to their share. If you own 1% of the pool's total liquidity you earn 1% of every fee generated.
The catch is impermanent loss. When the price ratio between the two assets in your pool changes the pool automatically rebalances against you accumulating more of the declining asset and less of the appreciating one. When you withdraw your position reflects that rebalanced ratio rather than what you deposited. The difference between what you would have held and what you actually hold is impermanent loss.
Whether providing liquidity is profitable depends on whether the fees earned exceed the impermanent loss accumulated over the holding period. Pools with high trading volume relative to their total liquidity generate more fees per dollar deployed. Stable pairs where the price ratio rarely changes produce less impermanent loss.
Reading both numbers together before entering any pool is the starting point for evaluating whether the position makes sense.
Explore STONfi pools → https://app.ston.fi/pools
$BTC #BTC Price Analysis# #Meme Alpha# $SOL
33
·
--
查看翻译
Omniston is the cross-chain execution protocol built by Ston.fi's development team. It is what powers every swap between TON and the ten chains currently supported in STONfi's cross-chain interface. Understanding what it actually does not just what it is called, is the most useful thing anyone new to TON DeFi can learn before making their first cross-chain move.
The core idea is straightforward. When you submit a cross-chain swap on STONfi you are not sending instructions to a bridge. You are expressing an intent, I want to receive this asset on this chain in this amount. Omniston broadcasts that intent to a network of professional liquidity providers called resolvers. Resolvers compete to fill the intent through a Request for Quote process. The one who offers the best rate wins the order.
The resolver who wins does not just promise to deliver. They lock the destination-side assets in a Hashed Timelock Contract before the user's source-side assets commit. Both contracts share the same cryptographic condition. When the condition is met both sides settle simultaneously. The user receives exactly what was quoted or both sides return to their starting position automatically through the timelock. There is no execution path where both parties lose funds.
This is why quote certainty is the defining property of Omniston swaps. The amount shown at confirmation is the amount that arrives. The resolver committed to delivering it. The HTLC structure enforced that commitment cryptographically rather than through trust.
Omniston currently connects TON to TRON, Ethereum, Base, BNB Chain, Polygon, Avalanche, Arbitrum, Robinhood Chain, and X Layer. It is also integrated into TONCO, My Wallet, TractionEye, Predict, Gramstox, Gram Store, and a growing list of TON products.
Try Omniston →https://app.ston.fi/swap?mode=cross-chain
#BTC Price Analysis# #Macro Insights# $ONDO #Altcoin Season# $LTC
Omniston is the cross-chain execution protocol built by Ston.fi's development team. It is what powers every swap between TON and the ten chains currently supported in STONfi's cross-chain interface. Understanding what it actually does not just what it is called, is the most useful thing anyone new to TON DeFi can learn before making their first cross-chain move.
The core idea is straightforward. When you submit a cross-chain swap on STONfi you are not sending instructions to a bridge. You are expressing an intent, I want to receive this asset on this chain in this amount. Omniston broadcasts that intent to a network of professional liquidity providers called resolvers. Resolvers compete to fill the intent through a Request for Quote process. The one who offers the best rate wins the order.
The resolver who wins does not just promise to deliver. They lock the destination-side assets in a Hashed Timelock Contract before the user's source-side assets commit. Both contracts share the same cryptographic condition. When the condition is met both sides settle simultaneously. The user receives exactly what was quoted or both sides return to their starting position automatically through the timelock. There is no execution path where both parties lose funds.
This is why quote certainty is the defining property of Omniston swaps. The amount shown at confirmation is the amount that arrives. The resolver committed to delivering it. The HTLC structure enforced that commitment cryptographically rather than through trust.
Omniston currently connects TON to TRON, Ethereum, Base, BNB Chain, Polygon, Avalanche, Arbitrum, Robinhood Chain, and X Layer. It is also integrated into TONCO, My Wallet, TractionEye, Predict, Gramstox, Gram Store, and a growing list of TON products.
Try Omniston →https://app.ston.fi/swap?mode=cross-chain
#BTC Price Analysis# #Macro Insights# $ONDO #Altcoin Season# $LTC
The core idea is straightforward. When you submit a cross-chain swap on STONfi you are not sending instructions to a bridge. You are expressing an intent, I want to receive this asset on this chain in this amount. Omniston broadcasts that intent to a network of professional liquidity providers called resolvers. Resolvers compete to fill the intent through a Request for Quote process. The one who offers the best rate wins the order.
The resolver who wins does not just promise to deliver. They lock the destination-side assets in a Hashed Timelock Contract before the user's source-side assets commit. Both contracts share the same cryptographic condition. When the condition is met both sides settle simultaneously. The user receives exactly what was quoted or both sides return to their starting position automatically through the timelock. There is no execution path where both parties lose funds.
This is why quote certainty is the defining property of Omniston swaps. The amount shown at confirmation is the amount that arrives. The resolver committed to delivering it. The HTLC structure enforced that commitment cryptographically rather than through trust.
Omniston currently connects TON to TRON, Ethereum, Base, BNB Chain, Polygon, Avalanche, Arbitrum, Robinhood Chain, and X Layer. It is also integrated into TONCO, My Wallet, TractionEye, Predict, Gramstox, Gram Store, and a growing list of TON products.
Try Omniston →https://app.ston.fi/swap?mode=cross-chain
#BTC Price Analysis# #Macro Insights# $ONDO #Altcoin Season# $LTC
54
·
--
查看翻译
"USDT on Bitcoin. It's coming home." That's the actual line from Ardoino, and the phrasing matters, Tether wasn't founded on Bitcoin rails originally, this framing treats it as a return rather than a new expansion.
Per multiple reports today, Tether has been working on bringing USDT to Bitcoin through Taproot Assets, the Lightning Network, and RGB, three genuinely different approaches to issuing assets on top of Bitcoin's base layer rather than needing a separate chain entirely. This isn't Tether abandoning Ethereum or Tron, where the overwhelming majority of USDT supply and volume already lives, it's adding Bitcoin as another settlement rail alongside those.
Worth being precise about what this actually changes and what it doesn't. Crypto Rover's framing on this seems accurate, USDT on Bitcoin isn't Bitcoin becoming a dollar system, it's the dollar using Bitcoin as a rail, a distinction that matters because it doesn't touch Bitcoin's own monetary policy or supply, it just gives stablecoin transfers another network to settle on, one with genuinely deep liquidity and security assumptions behind it.
My honest read: this is still an announcement of intent and direction, Ardoino confirmed it's coming, not that it's live with a specific date attached. The technical building blocks, Taproot Assets and RGB specifically, are real and have been in development for a while, so this isn't vaporware, but there's a real gap between "confirmed direction" and "shipped product" that's worth keeping in mind before treating this as already operational.
What I'm watching: an actual launch timeline or testnet activity, and whether Lightning specifically sees measurable stablecoin volume once this goes live rather than staying a theoretical use case.
$USDT#Altcoin Season# #BTC Price Analysis# $BTC
"USDT on Bitcoin. It's coming home." That's the actual line from Ardoino, and the phrasing matters, Tether wasn't founded on Bitcoin rails originally, this framing treats it as a return rather than a new expansion.
Per multiple reports today, Tether has been working on bringing USDT to Bitcoin through Taproot Assets, the Lightning Network, and RGB, three genuinely different approaches to issuing assets on top of Bitcoin's base layer rather than needing a separate chain entirely. This isn't Tether abandoning Ethereum or Tron, where the overwhelming majority of USDT supply and volume already lives, it's adding Bitcoin as another settlement rail alongside those.
Worth being precise about what this actually changes and what it doesn't. Crypto Rover's framing on this seems accurate, USDT on Bitcoin isn't Bitcoin becoming a dollar system, it's the dollar using Bitcoin as a rail, a distinction that matters because it doesn't touch Bitcoin's own monetary policy or supply, it just gives stablecoin transfers another network to settle on, one with genuinely deep liquidity and security assumptions behind it.
My honest read: this is still an announcement of intent and direction, Ardoino confirmed it's coming, not that it's live with a specific date attached. The technical building blocks, Taproot Assets and RGB specifically, are real and have been in development for a while, so this isn't vaporware, but there's a real gap between "confirmed direction" and "shipped product" that's worth keeping in mind before treating this as already operational.
What I'm watching: an actual launch timeline or testnet activity, and whether Lightning specifically sees measurable stablecoin volume once this goes live rather than staying a theoretical use case.
$USDT#Altcoin Season# #BTC Price Analysis# $BTC
Per multiple reports today, Tether has been working on bringing USDT to Bitcoin through Taproot Assets, the Lightning Network, and RGB, three genuinely different approaches to issuing assets on top of Bitcoin's base layer rather than needing a separate chain entirely. This isn't Tether abandoning Ethereum or Tron, where the overwhelming majority of USDT supply and volume already lives, it's adding Bitcoin as another settlement rail alongside those.
Worth being precise about what this actually changes and what it doesn't. Crypto Rover's framing on this seems accurate, USDT on Bitcoin isn't Bitcoin becoming a dollar system, it's the dollar using Bitcoin as a rail, a distinction that matters because it doesn't touch Bitcoin's own monetary policy or supply, it just gives stablecoin transfers another network to settle on, one with genuinely deep liquidity and security assumptions behind it.
My honest read: this is still an announcement of intent and direction, Ardoino confirmed it's coming, not that it's live with a specific date attached. The technical building blocks, Taproot Assets and RGB specifically, are real and have been in development for a while, so this isn't vaporware, but there's a real gap between "confirmed direction" and "shipped product" that's worth keeping in mind before treating this as already operational.
What I'm watching: an actual launch timeline or testnet activity, and whether Lightning specifically sees measurable stablecoin volume once this goes live rather than staying a theoretical use case.
$USDT#Altcoin Season# #BTC Price Analysis# $BTC

66
·
--
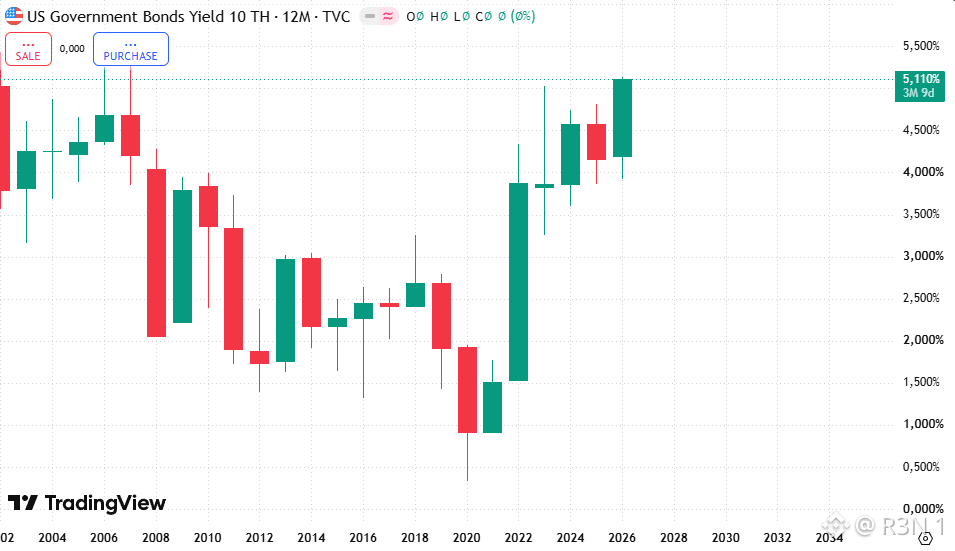
美国国债收益率飙升至2007年以来的最高水平。10年期国债刚刚出现近18个月来最剧烈的单日变动,而这一幕发生在市场正在为美联储再次加息进行定价的同一周。两者叠加才是实情,而不仅仅是把情况和2007年作比较。10年期收益率今日一度升至5.13%,为2007年以来最高;30年期触及5.4%;甚至5年期也首次突破5%,是自金融危机之前以来的首次。并且这并非孤立的短暂冲高——收益率早在9月15日、也就是8天前,就已达到同一里程碑,随后回落;而现在则在其基础上再度刷新高点。今天具体推动因素是一组偏鹰的利好数据“叠加”落地。企业活动数据比预期更热:据S&P Global称,这是一年来五年多以来的最快增速。美联储理事迈克尔·巴尔表示还需要更多加息;油价也重新站上每桶103美元。特朗普支持禁止美国柴油出口的举措,进一步加剧了供应担忧。市场目前定价10月再次加息的概率为70%。这里有必要把结构性因素和短期急性因素区分开来。财政部长贝森特为国债回购计划辩护,称其是在限制“可能会更糟”的程度;与此同时,他还在进行另一项行动,专门支撑日元,以阻止日本出售美国债券——否则收益率会进一步上升。现实中的干预已经在发生,而不是假设。让我特别关注的是抵押贷款的传导效应:今日30年期固定利率跃升至7.26%,为2025年1月以来的最高水平。这就是把“债券市场的故事”连接到“实际家庭成本”的机制,而且其传导速度比大多数人想象的更快。悬而未决的问题并不是10月美联储是否会再次加息——这已经接近市场定价。关键在于:财政部的干预能否跟上这种抛售的节奏。抛售在短短8个交易日里已经经历了两次如此剧烈的下跌;而通过在边际上支撑需求来解决的问题,规模上与一次性冲击是不同量级的。 #BTC Price Analysis# $BTC #BTC Price Analysis# $XAUt #Meme Alpha#
美国国债收益率飙升至2007年以来的最高水平。10年期国债刚刚出现近18个月来最剧烈的单日变动,而这一幕发生在市场正在为美联储再次加息进行定价的同一周。两者叠加才是实情,而不仅仅是把情况和2007年作比较。10年期收益率今日一度升至5.13%,为2007年以来最高;30年期触及5.4%;甚至5年期也首次突破5%,是自金融危机之前以来的首次。并且这并非孤立的短暂冲高——收益率早在9月15日、也就是8天前,就已达到同一里程碑,随后回落;而现在则在其基础上再度刷新高点。今天具体推动因素是一组偏鹰的利好数据“叠加”落地。企业活动数据比预期更热:据S&P Global称,这是一年来五年多以来的最快增速。美联储理事迈克尔·巴尔表示还需要更多加息;油价也重新站上每桶103美元。特朗普支持禁止美国柴油出口的举措,进一步加剧了供应担忧。市场目前定价10月再次加息的概率为70%。这里有必要把结构性因素和短期急性因素区分开来。财政部长贝森特为国债回购计划辩护,称其是在限制“可能会更糟”的程度;与此同时,他还在进行另一项行动,专门支撑日元,以阻止日本出售美国债券——否则收益率会进一步上升。现实中的干预已经在发生,而不是假设。让我特别关注的是抵押贷款的传导效应:今日30年期固定利率跃升至7.26%,为2025年1月以来的最高水平。这就是把“债券市场的故事”连接到“实际家庭成本”的机制,而且其传导速度比大多数人想象的更快。悬而未决的问题并不是10月美联储是否会再次加息——这已经接近市场定价。关键在于:财政部的干预能否跟上这种抛售的节奏。抛售在短短8个交易日里已经经历了两次如此剧烈的下跌;而通过在边际上支撑需求来解决的问题,规模上与一次性冲击是不同量级的。 #BTC Price Analysis# $BTC #BTC Price Analysis# $XAUt #Meme Alpha#
25
·
--
查看翻译
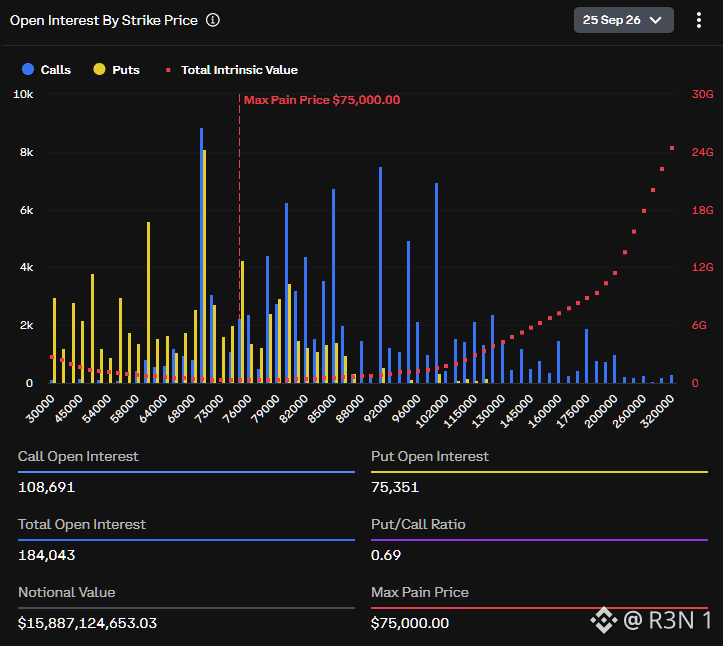
BTC is actually down 2.88% today , moving in that direction rather than away from it. Worth updating the read on that alone.
Max pain theory holds that price gravitates toward the strike where the most option contracts expire worthless, benefiting sellers, as market makers hedge their books into expiry. It's a genuinely debated mechanic though, not a reliable predictive tool, and a $10,000 gap this large going in is unusual enough that I'd have treated the pull toward it as weak, until today's move.
What still argues against a full drag toward $75,000 specifically is the standing positioning. BTC call open interest sits at $9.61 billion against $6.52 billion in puts, a put to call ratio around 0.68, genuinely lopsided bullish, with the heaviest call concentration at $90,000 and $100,000, both well above current price. That's a book positioned for continuation, working against the max pain pull, not with it. Today's red candle doesn't erase that positioning, it just means price and options flow are pulling in opposite directions right now.
My honest read: this is genuinely two forces in tension, not a settled direction. Today's decline shows real downward pressure exists, but the option book itself is still betting heavily on upside above $90,000. Large expiries tend to produce real volatility as positions close or roll, the actual settlement direction isn't decided by either force alone.
What I'm watching: whether this pullback continues toward max pain into Friday, or whether it's a temporary dip inside a book still positioned for $90,000 and higher.
$BTC #Bitcoin Price Prediction: What is Bitcoins next move?#
BTC is actually down 2.88% today , moving in that direction rather than away from it. Worth updating the read on that alone.
Max pain theory holds that price gravitates toward the strike where the most option contracts expire worthless, benefiting sellers, as market makers hedge their books into expiry. It's a genuinely debated mechanic though, not a reliable predictive tool, and a $10,000 gap this large going in is unusual enough that I'd have treated the pull toward it as weak, until today's move.
What still argues against a full drag toward $75,000 specifically is the standing positioning. BTC call open interest sits at $9.61 billion against $6.52 billion in puts, a put to call ratio around 0.68, genuinely lopsided bullish, with the heaviest call concentration at $90,000 and $100,000, both well above current price. That's a book positioned for continuation, working against the max pain pull, not with it. Today's red candle doesn't erase that positioning, it just means price and options flow are pulling in opposite directions right now.
My honest read: this is genuinely two forces in tension, not a settled direction. Today's decline shows real downward pressure exists, but the option book itself is still betting heavily on upside above $90,000. Large expiries tend to produce real volatility as positions close or roll, the actual settlement direction isn't decided by either force alone.
What I'm watching: whether this pullback continues toward max pain into Friday, or whether it's a temporary dip inside a book still positioned for $90,000 and higher.
$BTC #Bitcoin Price Prediction: What is Bitcoins next move?#
Max pain theory holds that price gravitates toward the strike where the most option contracts expire worthless, benefiting sellers, as market makers hedge their books into expiry. It's a genuinely debated mechanic though, not a reliable predictive tool, and a $10,000 gap this large going in is unusual enough that I'd have treated the pull toward it as weak, until today's move.
What still argues against a full drag toward $75,000 specifically is the standing positioning. BTC call open interest sits at $9.61 billion against $6.52 billion in puts, a put to call ratio around 0.68, genuinely lopsided bullish, with the heaviest call concentration at $90,000 and $100,000, both well above current price. That's a book positioned for continuation, working against the max pain pull, not with it. Today's red candle doesn't erase that positioning, it just means price and options flow are pulling in opposite directions right now.
My honest read: this is genuinely two forces in tension, not a settled direction. Today's decline shows real downward pressure exists, but the option book itself is still betting heavily on upside above $90,000. Large expiries tend to produce real volatility as positions close or roll, the actual settlement direction isn't decided by either force alone.
What I'm watching: whether this pullback continues toward max pain into Friday, or whether it's a temporary dip inside a book still positioned for $90,000 and higher.
$BTC #Bitcoin Price Prediction: What is Bitcoins next move?#
36
·
--
查看翻译
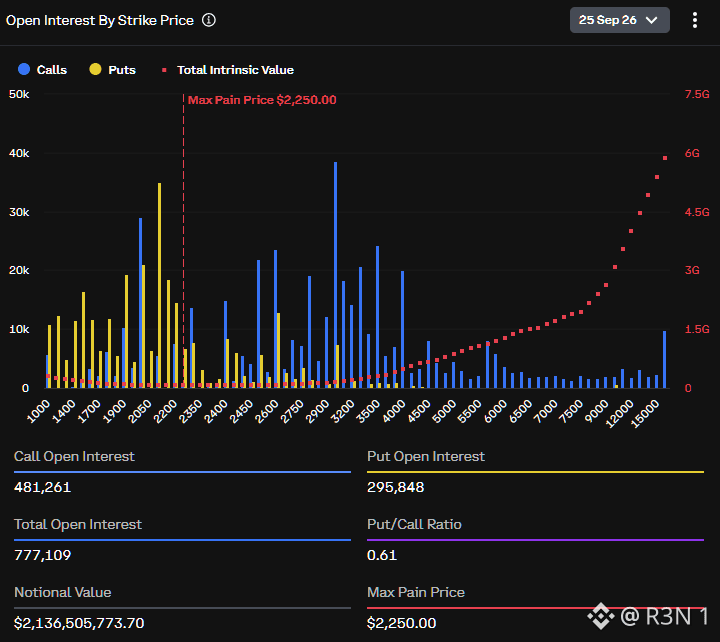
$18.1 billion in BTC and ETH options expire Friday, and BTC is trading nearly $11,000 above the max pain level tied to this event. Worth flagging that gap directly, if max pain is genuinely $75,000 while spot sits at $86,000 plus, that's an unusually wide dislocation, and I'd want that number confirmed before treating it as settled.
The scale itself checks out cleanly. Deribit data puts BTC open interest at $16.13 billion, ETH at $2.16 billion, lining up with Coinbase's own $18.1 billion combined estimate. Positioning is genuinely lopsided toward calls, BTC call open interest sits at $9.61 billion against $6.52 billion in puts, a put to call ratio around 0.68, and that skew has reportedly gotten more pronounced in recent flow, not just the standing book. Call concentration is heaviest at $90,000 and $100,000 on BTC, spread between $3,000 and $4,000 on ETH.
What that positioning tells you matters more than the dollar figure. A call heavy book with strikes clustered above current price reflects traders betting on continuation, not necessarily predicting it. Max pain theory suggests price gravitates toward the strike where the most contracts expire worthless, benefiting option sellers, but it's a debated mechanic, not guaranteed, and large expiries typically bring real volatility as positions get closed or rolled rather than a clean pin to one level.
My honest read: the size and directional skew here are real and well documented, genuine bullish positioning heading into Friday. But I'd want that $75,000 max pain figure specifically verified before repeating it, since it doesn't reconcile with where BTC is actually trading right now.
What I'm watching: how price behaves relative to the $90,000 strike specifically as Friday's settlement approaches, since that's where the heaviest call concentration actually sits.
$BTC #BTC Price Analysis# #Altcoin Season# $ETH
$18.1 billion in BTC and ETH options expire Friday, and BTC is trading nearly $11,000 above the max pain level tied to this event. Worth flagging that gap directly, if max pain is genuinely $75,000 while spot sits at $86,000 plus, that's an unusually wide dislocation, and I'd want that number confirmed before treating it as settled.
The scale itself checks out cleanly. Deribit data puts BTC open interest at $16.13 billion, ETH at $2.16 billion, lining up with Coinbase's own $18.1 billion combined estimate. Positioning is genuinely lopsided toward calls, BTC call open interest sits at $9.61 billion against $6.52 billion in puts, a put to call ratio around 0.68, and that skew has reportedly gotten more pronounced in recent flow, not just the standing book. Call concentration is heaviest at $90,000 and $100,000 on BTC, spread between $3,000 and $4,000 on ETH.
What that positioning tells you matters more than the dollar figure. A call heavy book with strikes clustered above current price reflects traders betting on continuation, not necessarily predicting it. Max pain theory suggests price gravitates toward the strike where the most contracts expire worthless, benefiting option sellers, but it's a debated mechanic, not guaranteed, and large expiries typically bring real volatility as positions get closed or rolled rather than a clean pin to one level.
My honest read: the size and directional skew here are real and well documented, genuine bullish positioning heading into Friday. But I'd want that $75,000 max pain figure specifically verified before repeating it, since it doesn't reconcile with where BTC is actually trading right now.
What I'm watching: how price behaves relative to the $90,000 strike specifically as Friday's settlement approaches, since that's where the heaviest call concentration actually sits.
$BTC #BTC Price Analysis# #Altcoin Season# $ETH
The scale itself checks out cleanly. Deribit data puts BTC open interest at $16.13 billion, ETH at $2.16 billion, lining up with Coinbase's own $18.1 billion combined estimate. Positioning is genuinely lopsided toward calls, BTC call open interest sits at $9.61 billion against $6.52 billion in puts, a put to call ratio around 0.68, and that skew has reportedly gotten more pronounced in recent flow, not just the standing book. Call concentration is heaviest at $90,000 and $100,000 on BTC, spread between $3,000 and $4,000 on ETH.
What that positioning tells you matters more than the dollar figure. A call heavy book with strikes clustered above current price reflects traders betting on continuation, not necessarily predicting it. Max pain theory suggests price gravitates toward the strike where the most contracts expire worthless, benefiting option sellers, but it's a debated mechanic, not guaranteed, and large expiries typically bring real volatility as positions get closed or rolled rather than a clean pin to one level.
My honest read: the size and directional skew here are real and well documented, genuine bullish positioning heading into Friday. But I'd want that $75,000 max pain figure specifically verified before repeating it, since it doesn't reconcile with where BTC is actually trading right now.
What I'm watching: how price behaves relative to the $90,000 strike specifically as Friday's settlement approaches, since that's where the heaviest call concentration actually sits.
$BTC #BTC Price Analysis# #Altcoin Season# $ETH
54
·
--
贝莱德(BlackRock)刚发布一份报告,主张 AI 可能是一个被低估的需求驱动因素,并且是针对加密货币而言,内容比标题暗示得更具体。这点值得先标记:我找不到任何报导中提到的「$15 trillion」数字或「MASSIVE demand engine」这种用语;相关说法在实际报导中并未找到,这种叙事看起来也不是出自贝莱德本身。
该报告题为《The Machine-Native Economy》,9 月 22 日发布,实际上可拆成两条线索。第一条是机器对机器(machine-to-machine)的支付:随著 AI 代理能够自主进行交易,赚取数据、API、算力并且持续运行,传统清算体系在处理「低于一美分」的交易、24/7 的结算方面会遇到困难;而稳定币在结构上更适合。他们以 2025 年经调整后的稳定币规模超过 $11 trillion 作为既有基础,再加上正在涌现的真实协议,例如 x402、Stripe/Tempo 的 Machine Payments Protocol,以及 Stripe/OpenAI 的 Agentic Commerce Protocol。
第二条线索是把算力作为可代币化的资产:GPU 存取可透过可转让的合约来使用、也可作为抵押品,并可透过像 MCP 和 A2A 这类协议进行交易。$1.1 trillion 这个数字指的是到 2030 年对超大规模云端(hyperscaler)云服务收入的预测,属于 2025 年水准上约 29% 的 CAGR(年复合增长率),是可达市场规模(addressable market size),而不是加密货币特定的数字。
对我而言,最引人注意的是贝莱德自己的保留说法:代币化并不会消除既有要求——KYC、AML、以及资格/适格性规则仍会在链上适用。这是一个能对「代币化能绕过监管」这类解读形成实质对冲的论点。
也值得把 speculative(推测)距离讲得更直接:这是一份框架型的论文,而不是证明目前已在规模化落地。即使是贝莱德自己的表述也仍停留在「could(可能)」而不是「is(正在/就是)」。
开放问题不在于 AI 代理最终是否需要支付通路——那套逻辑是成立的。真正的问题是:稳定币与代币化算力是否会成为主导通路,或者传统金融是否能够足够快地适应,以至于加密货币并不是必需,才能够撷取这份需求。
$BTC #BTC Price Analysis# #Altcoin Season# $ETH
贝莱德(BlackRock)刚发布一份报告,主张 AI 可能是一个被低估的需求驱动因素,并且是针对加密货币而言,内容比标题暗示得更具体。这点值得先标记:我找不到任何报导中提到的「$15 trillion」数字或「MASSIVE demand engine」这种用语;相关说法在实际报导中并未找到,这种叙事看起来也不是出自贝莱德本身。
该报告题为《The Machine-Native Economy》,9 月 22 日发布,实际上可拆成两条线索。第一条是机器对机器(machine-to-machine)的支付:随著 AI 代理能够自主进行交易,赚取数据、API、算力并且持续运行,传统清算体系在处理「低于一美分」的交易、24/7 的结算方面会遇到困难;而稳定币在结构上更适合。他们以 2025 年经调整后的稳定币规模超过 $11 trillion 作为既有基础,再加上正在涌现的真实协议,例如 x402、Stripe/Tempo 的 Machine Payments Protocol,以及 Stripe/OpenAI 的 Agentic Commerce Protocol。
第二条线索是把算力作为可代币化的资产:GPU 存取可透过可转让的合约来使用、也可作为抵押品,并可透过像 MCP 和 A2A 这类协议进行交易。$1.1 trillion 这个数字指的是到 2030 年对超大规模云端(hyperscaler)云服务收入的预测,属于 2025 年水准上约 29% 的 CAGR(年复合增长率),是可达市场规模(addressable market size),而不是加密货币特定的数字。
对我而言,最引人注意的是贝莱德自己的保留说法:代币化并不会消除既有要求——KYC、AML、以及资格/适格性规则仍会在链上适用。这是一个能对「代币化能绕过监管」这类解读形成实质对冲的论点。
也值得把 speculative(推测)距离讲得更直接:这是一份框架型的论文,而不是证明目前已在规模化落地。即使是贝莱德自己的表述也仍停留在「could(可能)」而不是「is(正在/就是)」。
开放问题不在于 AI 代理最终是否需要支付通路——那套逻辑是成立的。真正的问题是:稳定币与代币化算力是否会成为主导通路,或者传统金融是否能够足够快地适应,以至于加密货币并不是必需,才能够撷取这份需求。
$BTC #BTC Price Analysis# #Altcoin Season# $ETH
该报告题为《The Machine-Native Economy》,9 月 22 日发布,实际上可拆成两条线索。第一条是机器对机器(machine-to-machine)的支付:随著 AI 代理能够自主进行交易,赚取数据、API、算力并且持续运行,传统清算体系在处理「低于一美分」的交易、24/7 的结算方面会遇到困难;而稳定币在结构上更适合。他们以 2025 年经调整后的稳定币规模超过 $11 trillion 作为既有基础,再加上正在涌现的真实协议,例如 x402、Stripe/Tempo 的 Machine Payments Protocol,以及 Stripe/OpenAI 的 Agentic Commerce Protocol。
第二条线索是把算力作为可代币化的资产:GPU 存取可透过可转让的合约来使用、也可作为抵押品,并可透过像 MCP 和 A2A 这类协议进行交易。$1.1 trillion 这个数字指的是到 2030 年对超大规模云端(hyperscaler)云服务收入的预测,属于 2025 年水准上约 29% 的 CAGR(年复合增长率),是可达市场规模(addressable market size),而不是加密货币特定的数字。
对我而言,最引人注意的是贝莱德自己的保留说法:代币化并不会消除既有要求——KYC、AML、以及资格/适格性规则仍会在链上适用。这是一个能对「代币化能绕过监管」这类解读形成实质对冲的论点。
也值得把 speculative(推测)距离讲得更直接:这是一份框架型的论文,而不是证明目前已在规模化落地。即使是贝莱德自己的表述也仍停留在「could(可能)」而不是「is(正在/就是)」。
开放问题不在于 AI 代理最终是否需要支付通路——那套逻辑是成立的。真正的问题是:稳定币与代币化算力是否会成为主导通路,或者传统金融是否能够足够快地适应,以至于加密货币并不是必需,才能够撷取这份需求。
$BTC #BTC Price Analysis# #Altcoin Season# $ETH

70
·
--
$1,500 注册费、每月 $500,还有一位会读取遭入侵收件匣、精准找出哪位员工掌控资金的 AI 分析师。这才是 EvilTokens 所贩售的真正产品——不是把 AI 程式硬塞在钓鱼工具上的「钓鱼套件」。而是 AI 本身就是商业模式。
这是微软 DCU 近二十年来第 40 次获法院核准的强制行动,但却是第一次针对「端到端、由 AI 使能」的网路犯罪服务——这点非常关键,属于明确区别,而不只是更大的案件编号。EvilTokens 于 2026 年 2 月启动,入侵超过 12,000 个收件匣,涵盖超过 10,000 个组织,横扫美国、英国、加拿大、澳洲、印度与法国。受害领域包括批发分销、建筑、金融服务、不动产、医疗以及高等教育。该组织利用微软的 OAuth 2.0 装置码(device code)登入流程直接窃取会话令牌,完全绕过密码与 MFA。
Coinbase 的角色是追踪资金。其威胁团队在 2025 年 10 月至 2026 年 6 月期间,追踪到约 110 万美元的收入,分布在四个 Tron 位址之间,期间超过 1,000 次入金,来自超过 700 个不同来源。这条金流线索促成了联邦法院的命令:封押了 50 个网站、停用超过 175 个网域。两名男子(32 岁与 38 岁)于 9 月 11 日在伦敦被伦敦警察厅(Met Police)逮捕,之后获准以保释金等待进行法务鉴定。
令我印象深刻的是这个联盟的规模:Cloudflare、OpenAI、TRM Labs、Health-ISAC、Shadowserver、SpyCloud 与 Railway 都在微软与 Coinbase 之外共同参与。这是一个真正广泛的反应,面对的威胁模型如今已成公开知识且容易被复制。
我接下来在观察的是:既然 EvilTokens 已证明这套模型可行,是否会开始出现类似的、由 AI 驱动、会利用装置码(device code)的服务,以及各平台会多快加强装置码流程的防御措施。
$BTC #BTC Price Analysis# #Meme Alpha# #BNBChain# $COIN
$1,500 注册费、每月 $500,还有一位会读取遭入侵收件匣、精准找出哪位员工掌控资金的 AI 分析师。这才是 EvilTokens 所贩售的真正产品——不是把 AI 程式硬塞在钓鱼工具上的「钓鱼套件」。而是 AI 本身就是商业模式。
这是微软 DCU 近二十年来第 40 次获法院核准的强制行动,但却是第一次针对「端到端、由 AI 使能」的网路犯罪服务——这点非常关键,属于明确区别,而不只是更大的案件编号。EvilTokens 于 2026 年 2 月启动,入侵超过 12,000 个收件匣,涵盖超过 10,000 个组织,横扫美国、英国、加拿大、澳洲、印度与法国。受害领域包括批发分销、建筑、金融服务、不动产、医疗以及高等教育。该组织利用微软的 OAuth 2.0 装置码(device code)登入流程直接窃取会话令牌,完全绕过密码与 MFA。
Coinbase 的角色是追踪资金。其威胁团队在 2025 年 10 月至 2026 年 6 月期间,追踪到约 110 万美元的收入,分布在四个 Tron 位址之间,期间超过 1,000 次入金,来自超过 700 个不同来源。这条金流线索促成了联邦法院的命令:封押了 50 个网站、停用超过 175 个网域。两名男子(32 岁与 38 岁)于 9 月 11 日在伦敦被伦敦警察厅(Met Police)逮捕,之后获准以保释金等待进行法务鉴定。
令我印象深刻的是这个联盟的规模:Cloudflare、OpenAI、TRM Labs、Health-ISAC、Shadowserver、SpyCloud 与 Railway 都在微软与 Coinbase 之外共同参与。这是一个真正广泛的反应,面对的威胁模型如今已成公开知识且容易被复制。
我接下来在观察的是:既然 EvilTokens 已证明这套模型可行,是否会开始出现类似的、由 AI 驱动、会利用装置码(device code)的服务,以及各平台会多快加强装置码流程的防御措施。
$BTC #BTC Price Analysis# #Meme Alpha# #BNBChain# $COIN
这是微软 DCU 近二十年来第 40 次获法院核准的强制行动,但却是第一次针对「端到端、由 AI 使能」的网路犯罪服务——这点非常关键,属于明确区别,而不只是更大的案件编号。EvilTokens 于 2026 年 2 月启动,入侵超过 12,000 个收件匣,涵盖超过 10,000 个组织,横扫美国、英国、加拿大、澳洲、印度与法国。受害领域包括批发分销、建筑、金融服务、不动产、医疗以及高等教育。该组织利用微软的 OAuth 2.0 装置码(device code)登入流程直接窃取会话令牌,完全绕过密码与 MFA。
Coinbase 的角色是追踪资金。其威胁团队在 2025 年 10 月至 2026 年 6 月期间,追踪到约 110 万美元的收入,分布在四个 Tron 位址之间,期间超过 1,000 次入金,来自超过 700 个不同来源。这条金流线索促成了联邦法院的命令:封押了 50 个网站、停用超过 175 个网域。两名男子(32 岁与 38 岁)于 9 月 11 日在伦敦被伦敦警察厅(Met Police)逮捕,之后获准以保释金等待进行法务鉴定。
令我印象深刻的是这个联盟的规模:Cloudflare、OpenAI、TRM Labs、Health-ISAC、Shadowserver、SpyCloud 与 Railway 都在微软与 Coinbase 之外共同参与。这是一个真正广泛的反应,面对的威胁模型如今已成公开知识且容易被复制。
我接下来在观察的是:既然 EvilTokens 已证明这套模型可行,是否会开始出现类似的、由 AI 驱动、会利用装置码(device code)的服务,以及各平台会多快加强装置码流程的防御措施。
$BTC #BTC Price Analysis# #Meme Alpha# #BNBChain# $COIN

1
·
--
NEAR 是一个真实、具体的催化剂最清晰的案例。它在 9 月 17 日推出了保密的永续期货,并由 Hyperliquid 的执行引擎驱动,让交易者能够开立仓位,而无需在公开层面将其与账户关联。该产品为其带来了 7000 万美元的 TVL,并在 3.33 的阈值附近触发了真正的激励机制。NEAR 近期的走强,源自已交付、且有可衡量使用数据的功能,而不仅仅是情绪。
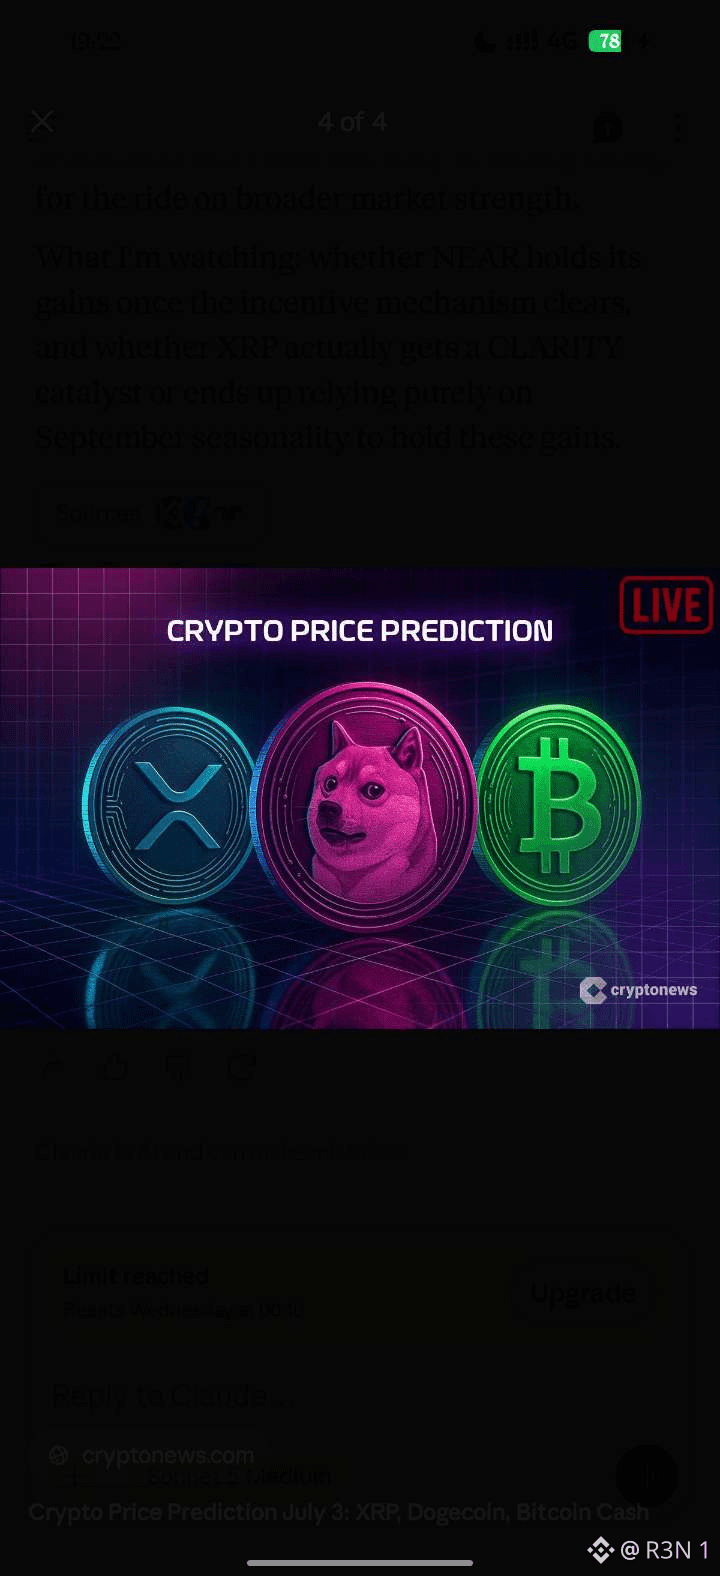
XRP 的故事则不同,更大程度上仍是“催化剂尚待落地”,而不是已经兑现的催化。XRP/BTC 距离 2025 年 1 月高点大约低了 48%,在 2026 年的大多数时间里也跑输 BTC;其中真正的例外是 8 月——当月相对 BTC 的涨幅为 30%,而 BTC 为 25%。分析师们不断指向的驱动因素是 CLARITY 法案:在参议院动议失败后仍未解决。此外,还有一份有据可查的季节性模式——历史上 XRP 在 9 月份的平均涨幅曾达到 17%。这是真实的历史倾向,但并不等同于已确认的基本面转变。
DOGE 和 BCH 则是我最持怀疑态度的。就我目前所见,我没有把两者与任何具体催化剂挂钩:没有产品发布、没有监管事件,也没有结构性的新变化。它们这种走势与“普涨行情”的风险偏好同步,但缺少资产特定驱动,通常更像是贝塔(beta),更偏向随 BTC 的强势而跟涨,而非来自独立需求。
我的坦诚判断:NEAR 的上涨背后有实质内容;XRP 的上涨有一个看起来合理但尚未确认的催化剂,再加上真实的季节性;而 DOGE 和 BCH 则更像是在借更大盘的东风。
我在关注:一旦激励机制放行,NEAR 的涨幅能否守住;以及 XRP 是否真的会迎来 CLARITY 的催化,还是最终只能依靠 9 月季节性来维持这波涨势。
#BTC Price Analysis# #Meme Alpha# $XRP $NEAR
NEAR 是一个真实、具体的催化剂最清晰的案例。它在 9 月 17 日推出了保密的永续期货,并由 Hyperliquid 的执行引擎驱动,让交易者能够开立仓位,而无需在公开层面将其与账户关联。该产品为其带来了 7000 万美元的 TVL,并在 3.33 的阈值附近触发了真正的激励机制。NEAR 近期的走强,源自已交付、且有可衡量使用数据的功能,而不仅仅是情绪。
XRP 的故事则不同,更大程度上仍是“催化剂尚待落地”,而不是已经兑现的催化。XRP/BTC 距离 2025 年 1 月高点大约低了 48%,在 2026 年的大多数时间里也跑输 BTC;其中真正的例外是 8 月——当月相对 BTC 的涨幅为 30%,而 BTC 为 25%。分析师们不断指向的驱动因素是 CLARITY 法案:在参议院动议失败后仍未解决。此外,还有一份有据可查的季节性模式——历史上 XRP 在 9 月份的平均涨幅曾达到 17%。这是真实的历史倾向,但并不等同于已确认的基本面转变。
DOGE 和 BCH 则是我最持怀疑态度的。就我目前所见,我没有把两者与任何具体催化剂挂钩:没有产品发布、没有监管事件,也没有结构性的新变化。它们这种走势与“普涨行情”的风险偏好同步,但缺少资产特定驱动,通常更像是贝塔(beta),更偏向随 BTC 的强势而跟涨,而非来自独立需求。
我的坦诚判断:NEAR 的上涨背后有实质内容;XRP 的上涨有一个看起来合理但尚未确认的催化剂,再加上真实的季节性;而 DOGE 和 BCH 则更像是在借更大盘的东风。
我在关注:一旦激励机制放行,NEAR 的涨幅能否守住;以及 XRP 是否真的会迎来 CLARITY 的催化,还是最终只能依靠 9 月季节性来维持这波涨势。
#BTC Price Analysis# #Meme Alpha# $XRP $NEAR
XRP 的故事则不同,更大程度上仍是“催化剂尚待落地”,而不是已经兑现的催化。XRP/BTC 距离 2025 年 1 月高点大约低了 48%,在 2026 年的大多数时间里也跑输 BTC;其中真正的例外是 8 月——当月相对 BTC 的涨幅为 30%,而 BTC 为 25%。分析师们不断指向的驱动因素是 CLARITY 法案:在参议院动议失败后仍未解决。此外,还有一份有据可查的季节性模式——历史上 XRP 在 9 月份的平均涨幅曾达到 17%。这是真实的历史倾向,但并不等同于已确认的基本面转变。
DOGE 和 BCH 则是我最持怀疑态度的。就我目前所见,我没有把两者与任何具体催化剂挂钩:没有产品发布、没有监管事件,也没有结构性的新变化。它们这种走势与“普涨行情”的风险偏好同步,但缺少资产特定驱动,通常更像是贝塔(beta),更偏向随 BTC 的强势而跟涨,而非来自独立需求。
我的坦诚判断:NEAR 的上涨背后有实质内容;XRP 的上涨有一个看起来合理但尚未确认的催化剂,再加上真实的季节性;而 DOGE 和 BCH 则更像是在借更大盘的东风。
我在关注:一旦激励机制放行,NEAR 的涨幅能否守住;以及 XRP 是否真的会迎来 CLARITY 的催化,还是最终只能依靠 9 月季节性来维持这波涨势。
#BTC Price Analysis# #Meme Alpha# $XRP $NEAR
12
·
--
币安上的XRP储备升至3个月高位
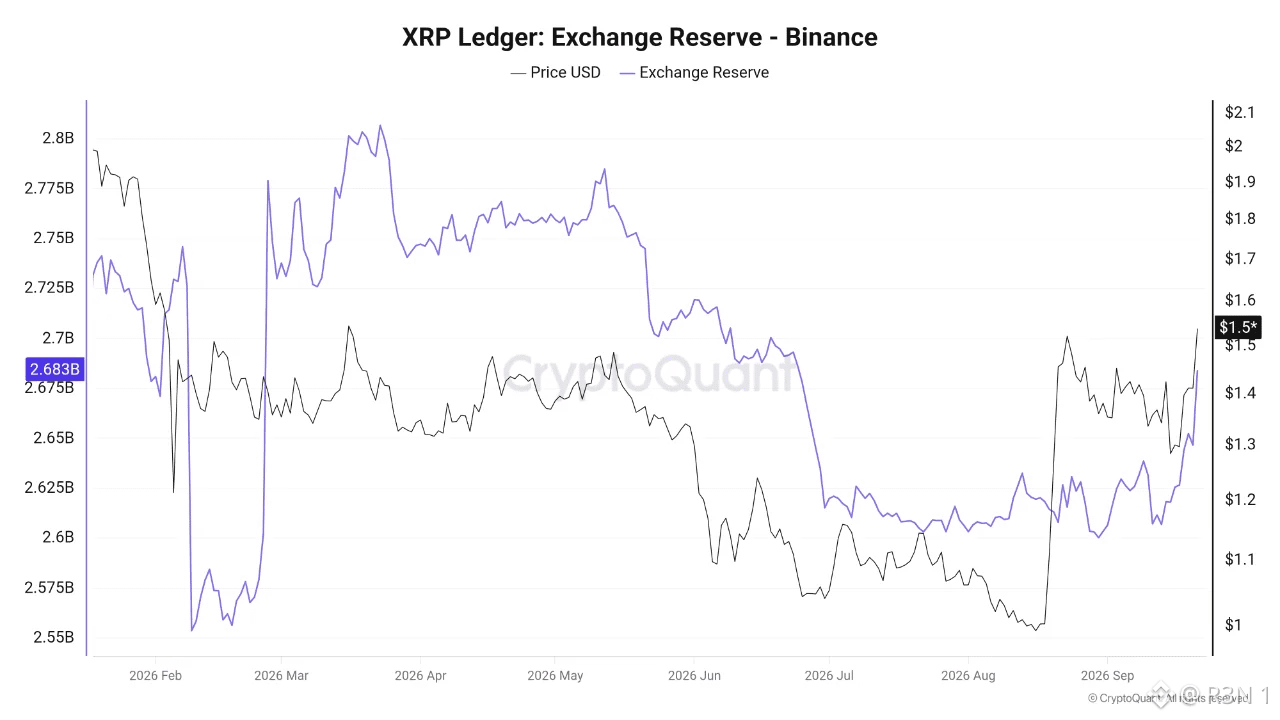
数据显示,币安上的XRP储备近期已升至约26.8亿枚XRP,同时价格在接近1.50美元关口附近交易。根据数据显示,该储备水平达到自去年6月以来的最高点——这是一个显著变化,紧随其后的是此前数月出现的下滑趋势。
这一增长意味着目前有更大规模的$XRP被持有在币安,从而使得流通供应中有更高比例可用于平台上的现货交易。与储备近期走势相比,这种变化尤为重要:在过去几周里,XRP余额曾出现明显下跌,随后才逐步恢复。
从市场动态角度来看,储备上升并不一定意味着XRP持有者正在为即刻抛售做准备;相反,这反映了交易生态系统中所持币的数量增加,从而为交易者提供更充足的流动性。因此,如果储备水平在交易量增加或资金流入的同时继续上升,这一趋势可能会成为短期供应压力的重要影响因素。
如果未来几天储备继续攀升,这可能预示着更大比例的XRP正逐步转移到交易所。该变化值得结合净流向、交易量以及价格走势一并密切关注。 #BTC价格分析# #山寨季# #Meme Alpha#
币安上的XRP储备升至3个月高位
数据显示,币安上的XRP储备近期已升至约26.8亿枚XRP,同时价格在接近1.50美元关口附近交易。根据数据显示,该储备水平达到自去年6月以来的最高点——这是一个显著变化,紧随其后的是此前数月出现的下滑趋势。
这一增长意味着目前有更大规模的$XRP被持有在币安,从而使得流通供应中有更高比例可用于平台上的现货交易。与储备近期走势相比,这种变化尤为重要:在过去几周里,XRP余额曾出现明显下跌,随后才逐步恢复。
从市场动态角度来看,储备上升并不一定意味着XRP持有者正在为即刻抛售做准备;相反,这反映了交易生态系统中所持币的数量增加,从而为交易者提供更充足的流动性。因此,如果储备水平在交易量增加或资金流入的同时继续上升,这一趋势可能会成为短期供应压力的重要影响因素。
如果未来几天储备继续攀升,这可能预示着更大比例的XRP正逐步转移到交易所。该变化值得结合净流向、交易量以及价格走势一并密切关注。 #BTC价格分析# #山寨季# #Meme Alpha#
数据显示,币安上的XRP储备近期已升至约26.8亿枚XRP,同时价格在接近1.50美元关口附近交易。根据数据显示,该储备水平达到自去年6月以来的最高点——这是一个显著变化,紧随其后的是此前数月出现的下滑趋势。
这一增长意味着目前有更大规模的$XRP被持有在币安,从而使得流通供应中有更高比例可用于平台上的现货交易。与储备近期走势相比,这种变化尤为重要:在过去几周里,XRP余额曾出现明显下跌,随后才逐步恢复。
从市场动态角度来看,储备上升并不一定意味着XRP持有者正在为即刻抛售做准备;相反,这反映了交易生态系统中所持币的数量增加,从而为交易者提供更充足的流动性。因此,如果储备水平在交易量增加或资金流入的同时继续上升,这一趋势可能会成为短期供应压力的重要影响因素。
如果未来几天储备继续攀升,这可能预示着更大比例的XRP正逐步转移到交易所。该变化值得结合净流向、交易量以及价格走势一并密切关注。 #BTC价格分析# #山寨季# #Meme Alpha#
·
--
在 TON 上进行代币“毕业”(Token graduation) 是生态系统中最容易被误解的机制之一。大多数人知道它意味着代币从一个绑定曲线(bonding curve)转移到 DEX(去中心化交易所)。但很少有人真正理解在每一步到底发生了什么,以及为什么自动化很重要。如今,TON 上的四个主要发射平台(launchpads)会将已毕业的代币路由到 STONfi、Grambo、Gram Store、Quantum Club 和 Stonks。它们的运作方式略有不同,但毕业流程管线遵循相同的结构。第一阶段是绑定曲线。代币以基于当前供应量的数学公式所决定的价格启动。每一次购买都会自动提高价格。该曲线会把购买资金汇集到储备金中。不存在订单簿(order book)。没有做市商(market makers)。公式就是市场。第二阶段是毕业阈值。当代币达到一个预定义的里程碑——例如达到筹集到的特定资金金额,或售出达到某个代币供应量——毕业事件会自动触发。不需要团队介入,由协议来处理。第三阶段是流动性迁移。绑定曲线阶段收集到的储备资金会进入一个 STONfi V2 池。此时代币将可以在标准的 AMM DEX 上进行交易,而不再通过绑定曲线。价格发现从公式过渡到市场。第四阶段是 LP 代币锁仓。以 Gram Store 为例,用于表示迁移后流动性锁定的 LP 代币会锁定 6 到 12 个月。在这段期间,团队无法移除他们在迁移过程中筹集到的流动性。这正是用来解决最常见的代币发射失败模式的机制:一些团队在毕业后立刻抽走流动性,而持有人却被留下一个流动性不足的仓位。任意这四个发射平台上的每一次成功毕业,都会自动为 STONfi 带来新的流动性和新的交易对。该管线会在不依赖人工上架决策的情况下,持续累积并放大 STONfi 的池子深度。探索 STONfi 池 → https://app.ston.fi/pools #BTC Price Analysis# $BTC #Altcoin Season# $ETH
在 TON 上进行代币“毕业”(Token graduation) 是生态系统中最容易被误解的机制之一。大多数人知道它意味着代币从一个绑定曲线(bonding curve)转移到 DEX(去中心化交易所)。但很少有人真正理解在每一步到底发生了什么,以及为什么自动化很重要。如今,TON 上的四个主要发射平台(launchpads)会将已毕业的代币路由到 STONfi、Grambo、Gram Store、Quantum Club 和 Stonks。它们的运作方式略有不同,但毕业流程管线遵循相同的结构。第一阶段是绑定曲线。代币以基于当前供应量的数学公式所决定的价格启动。每一次购买都会自动提高价格。该曲线会把购买资金汇集到储备金中。不存在订单簿(order book)。没有做市商(market makers)。公式就是市场。第二阶段是毕业阈值。当代币达到一个预定义的里程碑——例如达到筹集到的特定资金金额,或售出达到某个代币供应量——毕业事件会自动触发。不需要团队介入,由协议来处理。第三阶段是流动性迁移。绑定曲线阶段收集到的储备资金会进入一个 STONfi V2 池。此时代币将可以在标准的 AMM DEX 上进行交易,而不再通过绑定曲线。价格发现从公式过渡到市场。第四阶段是 LP 代币锁仓。以 Gram Store 为例,用于表示迁移后流动性锁定的 LP 代币会锁定 6 到 12 个月。在这段期间,团队无法移除他们在迁移过程中筹集到的流动性。这正是用来解决最常见的代币发射失败模式的机制:一些团队在毕业后立刻抽走流动性,而持有人却被留下一个流动性不足的仓位。任意这四个发射平台上的每一次成功毕业,都会自动为 STONfi 带来新的流动性和新的交易对。该管线会在不依赖人工上架决策的情况下,持续累积并放大 STONfi 的池子深度。探索 STONfi 池 → https://app.ston.fi/pools #BTC Price Analysis# $BTC #Altcoin Season# $ETH
18
·
--
截至8月,中国通过进口获得的黄金比2025年全年总量还要多,而其背后的价格背景才是这件事最出人意料的部分。
彭博援引的两大驱动因素是国际金价下跌以及人民币走强。并不是源于恐慌的避险资金外逃。 这点很关键,因为它意味着中国买家是在以更低的成本把握回调机会:在人民币更强的情况下,进口相对更不“贵”,而不是在惊慌中蜂拥而入。
让我觉得突出的是,这一趋势的收尾轨迹。到5月为止,黄金进口量大约为692吨;在当时就已同比增长76%。仅5月单月就达到了163吨,自2024年3月以来的最强单月表现。这并不是年末突然冲刺,而是贯穿全年持续累积的结果;并且到8月突破1,000吨,意味着整个夏季阶段进口节奏要么保持、要么加速,而不是逐步衰退。
这里值得把零售需求和官方储备区分开来,因为报道方式往往会把两者混在一起。这个1,000吨的数字来自海关进口数据,反映的是由商业与零售驱动的实物黄金流入,这与中国央行(PBoC)自身增加主权储备是不同的。央行截至5月通过与其他央行采购相关的渠道,所拥有的主权储备大约为2,331吨。两者都在上升,但购买者不同、动机不同:一方是居民与珠宝商,另一方是货币政策。
文章中引用的一位分析师指出,国内金价相较全球基准仍维持小幅溢价;正是这种差价在实际拉动进口——本地需求强到足以让黄金在中国境内的价格高于境外,从而形成把金带入国内的激励。
悬而未决的问题是,这种节奏能否延续到四季度。若人民币再次走弱,或国际金价反弹,两项顺风因素将会同时消失。并且,这类进口激增之前曾经在价格与汇率的组合条件发生变化后降温。
#Macro Insights# #BTC Price Analysis# $BTC
$XAUt
截至8月,中国通过进口获得的黄金比2025年全年总量还要多,而其背后的价格背景才是这件事最出人意料的部分。
彭博援引的两大驱动因素是国际金价下跌以及人民币走强。并不是源于恐慌的避险资金外逃。 这点很关键,因为它意味着中国买家是在以更低的成本把握回调机会:在人民币更强的情况下,进口相对更不“贵”,而不是在惊慌中蜂拥而入。
让我觉得突出的是,这一趋势的收尾轨迹。到5月为止,黄金进口量大约为692吨;在当时就已同比增长76%。仅5月单月就达到了163吨,自2024年3月以来的最强单月表现。这并不是年末突然冲刺,而是贯穿全年持续累积的结果;并且到8月突破1,000吨,意味着整个夏季阶段进口节奏要么保持、要么加速,而不是逐步衰退。
这里值得把零售需求和官方储备区分开来,因为报道方式往往会把两者混在一起。这个1,000吨的数字来自海关进口数据,反映的是由商业与零售驱动的实物黄金流入,这与中国央行(PBoC)自身增加主权储备是不同的。央行截至5月通过与其他央行采购相关的渠道,所拥有的主权储备大约为2,331吨。两者都在上升,但购买者不同、动机不同:一方是居民与珠宝商,另一方是货币政策。
文章中引用的一位分析师指出,国内金价相较全球基准仍维持小幅溢价;正是这种差价在实际拉动进口——本地需求强到足以让黄金在中国境内的价格高于境外,从而形成把金带入国内的激励。
悬而未决的问题是,这种节奏能否延续到四季度。若人民币再次走弱,或国际金价反弹,两项顺风因素将会同时消失。并且,这类进口激增之前曾经在价格与汇率的组合条件发生变化后降温。
#Macro Insights# #BTC Price Analysis# $BTC
$XAUt
彭博援引的两大驱动因素是国际金价下跌以及人民币走强。并不是源于恐慌的避险资金外逃。 这点很关键,因为它意味着中国买家是在以更低的成本把握回调机会:在人民币更强的情况下,进口相对更不“贵”,而不是在惊慌中蜂拥而入。
让我觉得突出的是,这一趋势的收尾轨迹。到5月为止,黄金进口量大约为692吨;在当时就已同比增长76%。仅5月单月就达到了163吨,自2024年3月以来的最强单月表现。这并不是年末突然冲刺,而是贯穿全年持续累积的结果;并且到8月突破1,000吨,意味着整个夏季阶段进口节奏要么保持、要么加速,而不是逐步衰退。
这里值得把零售需求和官方储备区分开来,因为报道方式往往会把两者混在一起。这个1,000吨的数字来自海关进口数据,反映的是由商业与零售驱动的实物黄金流入,这与中国央行(PBoC)自身增加主权储备是不同的。央行截至5月通过与其他央行采购相关的渠道,所拥有的主权储备大约为2,331吨。两者都在上升,但购买者不同、动机不同:一方是居民与珠宝商,另一方是货币政策。
文章中引用的一位分析师指出,国内金价相较全球基准仍维持小幅溢价;正是这种差价在实际拉动进口——本地需求强到足以让黄金在中国境内的价格高于境外,从而形成把金带入国内的激励。
悬而未决的问题是,这种节奏能否延续到四季度。若人民币再次走弱,或国际金价反弹,两项顺风因素将会同时消失。并且,这类进口激增之前曾经在价格与汇率的组合条件发生变化后降温。
#Macro Insights# #BTC Price Analysis# $BTC
$XAUt


38
·
--
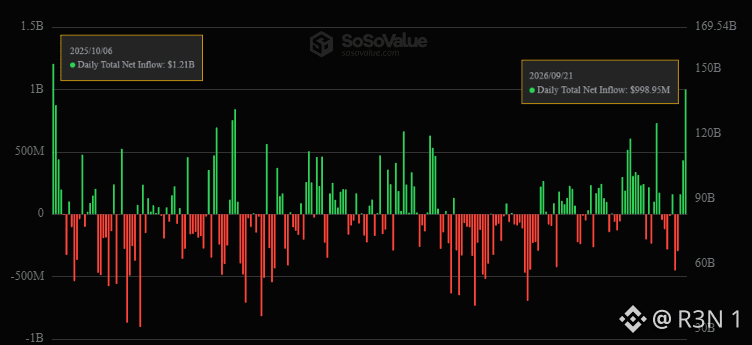
$999 million在一天内流入比特币ETF,而从基金层面的拆分来看,这不是单一“鲸鱼”配置者所为,而是多个产品同时出现的广泛机构需求。
IBIT以$381.4 million领跑,ARKB录得$289.1 million,FBTC则增加$238.8 million——三个不同的发债机构在同一天都投入了真实的大额资金,此外还有来自MSTR、BITB、GBTC和BTC的较小流入。这与单一基金的激增有着明显不同:这是需求在整个产品版图中同步扩散。
让我印象最深的是,价格走势几乎“太巧合”地与资金流数据对上了。BTC站上$86K、ETH也高于$2.7K——两者都是八个月高位——而这同一天恰好也是一年来最大的ETF资金净流入,这并非偶然:机制就是按设计运作的。ETF买盘会直接转化为两种资产的现货需求压力。
不过,这里需要对所作对比保持精确。10月那波流入浪潮——当前所衡量的对象——是在10月10日崩盘之前出现的,而不是带来随后延续的强势。就历史而言,单靠大额的单日流入本身并不能说明问题,真正更关键的是其后的几周发生了什么。这不是用来否定今天数据的理由,而是提醒不要仅凭一个创纪录的日子就把趋势本身当作已被确认。
悬而未决的问题不在于今天是否出现了机构需求——基金层面的数据清楚地证实了这一点。关键在于:这是否会成为一段持续的流入行情的起点,就像8月份那次在四周内把BTC从$63K推到$78K的过程;还是像9月早些时候那样,出现一次异常突出的单日之后很快降温,最初的强势随即褪去。
$BTC #BTC Price Analysis# #Altcoin Season# $ETH
$999 million在一天内流入比特币ETF,而从基金层面的拆分来看,这不是单一“鲸鱼”配置者所为,而是多个产品同时出现的广泛机构需求。
IBIT以$381.4 million领跑,ARKB录得$289.1 million,FBTC则增加$238.8 million——三个不同的发债机构在同一天都投入了真实的大额资金,此外还有来自MSTR、BITB、GBTC和BTC的较小流入。这与单一基金的激增有着明显不同:这是需求在整个产品版图中同步扩散。
让我印象最深的是,价格走势几乎“太巧合”地与资金流数据对上了。BTC站上$86K、ETH也高于$2.7K——两者都是八个月高位——而这同一天恰好也是一年来最大的ETF资金净流入,这并非偶然:机制就是按设计运作的。ETF买盘会直接转化为两种资产的现货需求压力。
不过,这里需要对所作对比保持精确。10月那波流入浪潮——当前所衡量的对象——是在10月10日崩盘之前出现的,而不是带来随后延续的强势。就历史而言,单靠大额的单日流入本身并不能说明问题,真正更关键的是其后的几周发生了什么。这不是用来否定今天数据的理由,而是提醒不要仅凭一个创纪录的日子就把趋势本身当作已被确认。
悬而未决的问题不在于今天是否出现了机构需求——基金层面的数据清楚地证实了这一点。关键在于:这是否会成为一段持续的流入行情的起点,就像8月份那次在四周内把BTC从$63K推到$78K的过程;还是像9月早些时候那样,出现一次异常突出的单日之后很快降温,最初的强势随即褪去。
$BTC #BTC Price Analysis# #Altcoin Season# $ETH
IBIT以$381.4 million领跑,ARKB录得$289.1 million,FBTC则增加$238.8 million——三个不同的发债机构在同一天都投入了真实的大额资金,此外还有来自MSTR、BITB、GBTC和BTC的较小流入。这与单一基金的激增有着明显不同:这是需求在整个产品版图中同步扩散。
让我印象最深的是,价格走势几乎“太巧合”地与资金流数据对上了。BTC站上$86K、ETH也高于$2.7K——两者都是八个月高位——而这同一天恰好也是一年来最大的ETF资金净流入,这并非偶然:机制就是按设计运作的。ETF买盘会直接转化为两种资产的现货需求压力。
不过,这里需要对所作对比保持精确。10月那波流入浪潮——当前所衡量的对象——是在10月10日崩盘之前出现的,而不是带来随后延续的强势。就历史而言,单靠大额的单日流入本身并不能说明问题,真正更关键的是其后的几周发生了什么。这不是用来否定今天数据的理由,而是提醒不要仅凭一个创纪录的日子就把趋势本身当作已被确认。
悬而未决的问题不在于今天是否出现了机构需求——基金层面的数据清楚地证实了这一点。关键在于:这是否会成为一段持续的流入行情的起点,就像8月份那次在四周内把BTC从$63K推到$78K的过程;还是像9月早些时候那样,出现一次异常突出的单日之后很快降温,最初的强势随即褪去。
$BTC #BTC Price Analysis# #Altcoin Season# $ETH
37
·
--
STONfi 的跨链网络现已覆盖十条链。对于任何特定的交换,如何在它们之间做选择是一个务实的决定,但多数内容从来没有清晰地讲明白。下面是我实际使用的框架。
第一个问题是:到达后你需要这些资产用来做什么。这比任何其他因素都更直接地决定目标链。若你需要进入 DeFi 的收益机会,TRON 和以太坊拥有最深厚的稳定币流动性。
如果你需要低成本、频繁的交易,Base、BNB Chain 和 Polygon 更经济。如果你需要代币化的股票敞口,Robinhood Chain 针对该用例而专门打造。如果你需要原生面向 AI 代理的基础设施,X Layer 是为此而设计的。
第二个问题是:源链的 gas 成本。从 TON 起步,不论目的地,大约每笔交易在 $0.06 到 $0.13 之间。若从以太坊主网起步,会产生显著的额外 gas 成本,这会改变小额交易的经济性。如果你的资产分布在多条链上,那么“起始链”的选择会比“具体路由本身”更显著地影响总成本。
第三个问题是:你持有哪些稳定币,以及目的地有哪些稳定币可用。网络中的每条链都支持特定的稳定币。例如:TON 上支持 USDT;以太坊与 BNB Chain 上支持 USDT 和 USDC;Arbitrum 上支持 USDC 和 USDT0;Polygon 上支持 PUSD 和 USDC;Robinhood Chain 上支持 USDG;X Layer 上支持 USDC 和 USDT0。在确认之前请先核对实时界面,因为网络演进会导致支持资产更新。
第四个问题是:交易规模与较新链新增时当前每笔 $1,000 的交易上限之间的关系。超过该上限的金额需要拆分为多笔交易。
以上四个问题足以回答大多数跨链操作中的链选择决策。
试试跨链兑换 →https://app.ston.fi/swap?mode=cross-chain
$BTC #BTC Price Analysis# #Altcoin Season# $PI
STONfi 的跨链网络现已覆盖十条链。对于任何特定的交换,如何在它们之间做选择是一个务实的决定,但多数内容从来没有清晰地讲明白。下面是我实际使用的框架。
第一个问题是:到达后你需要这些资产用来做什么。这比任何其他因素都更直接地决定目标链。若你需要进入 DeFi 的收益机会,TRON 和以太坊拥有最深厚的稳定币流动性。
如果你需要低成本、频繁的交易,Base、BNB Chain 和 Polygon 更经济。如果你需要代币化的股票敞口,Robinhood Chain 针对该用例而专门打造。如果你需要原生面向 AI 代理的基础设施,X Layer 是为此而设计的。
第二个问题是:源链的 gas 成本。从 TON 起步,不论目的地,大约每笔交易在 $0.06 到 $0.13 之间。若从以太坊主网起步,会产生显著的额外 gas 成本,这会改变小额交易的经济性。如果你的资产分布在多条链上,那么“起始链”的选择会比“具体路由本身”更显著地影响总成本。
第三个问题是:你持有哪些稳定币,以及目的地有哪些稳定币可用。网络中的每条链都支持特定的稳定币。例如:TON 上支持 USDT;以太坊与 BNB Chain 上支持 USDT 和 USDC;Arbitrum 上支持 USDC 和 USDT0;Polygon 上支持 PUSD 和 USDC;Robinhood Chain 上支持 USDG;X Layer 上支持 USDC 和 USDT0。在确认之前请先核对实时界面,因为网络演进会导致支持资产更新。
第四个问题是:交易规模与较新链新增时当前每笔 $1,000 的交易上限之间的关系。超过该上限的金额需要拆分为多笔交易。
以上四个问题足以回答大多数跨链操作中的链选择决策。
试试跨链兑换 →https://app.ston.fi/swap?mode=cross-chain
$BTC #BTC Price Analysis# #Altcoin Season# $PI
第一个问题是:到达后你需要这些资产用来做什么。这比任何其他因素都更直接地决定目标链。若你需要进入 DeFi 的收益机会,TRON 和以太坊拥有最深厚的稳定币流动性。
如果你需要低成本、频繁的交易,Base、BNB Chain 和 Polygon 更经济。如果你需要代币化的股票敞口,Robinhood Chain 针对该用例而专门打造。如果你需要原生面向 AI 代理的基础设施,X Layer 是为此而设计的。
第二个问题是:源链的 gas 成本。从 TON 起步,不论目的地,大约每笔交易在 $0.06 到 $0.13 之间。若从以太坊主网起步,会产生显著的额外 gas 成本,这会改变小额交易的经济性。如果你的资产分布在多条链上,那么“起始链”的选择会比“具体路由本身”更显著地影响总成本。
第三个问题是:你持有哪些稳定币,以及目的地有哪些稳定币可用。网络中的每条链都支持特定的稳定币。例如:TON 上支持 USDT;以太坊与 BNB Chain 上支持 USDT 和 USDC;Arbitrum 上支持 USDC 和 USDT0;Polygon 上支持 PUSD 和 USDC;Robinhood Chain 上支持 USDG;X Layer 上支持 USDC 和 USDT0。在确认之前请先核对实时界面,因为网络演进会导致支持资产更新。
第四个问题是:交易规模与较新链新增时当前每笔 $1,000 的交易上限之间的关系。超过该上限的金额需要拆分为多笔交易。
以上四个问题足以回答大多数跨链操作中的链选择决策。
试试跨链兑换 →https://app.ston.fi/swap?mode=cross-chain
$BTC #BTC Price Analysis# #Altcoin Season# $PI
52
·
--
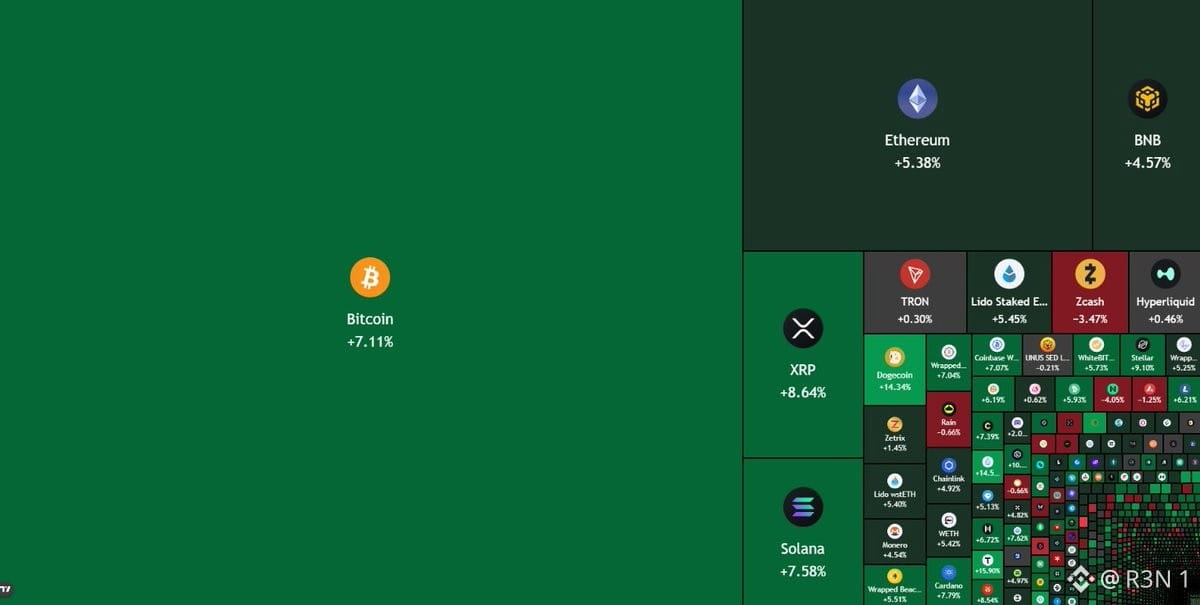
《CLARITY法案》于9月15日在参议院失败。就在同一天, 比特币跌至74,900美元,超过6亿美元发生了长仓的强制清算。六天后,它回到86,000美元,为八个月来的高点。这一连串走势才是真正的故事,而不是从失败直接一路走到反弹。
最初的反应偏空——这正是你所预期的。但随后出现的修复并不真正与《CLARITY》有关。它来自BTC在78,000美元上方清除技术阻力、随后又在82,000美元上方再度突破。每一次突破都引发新的空头清算,从而推动下一段上涨。CoinGlass数据显示,截至今天,随着82,000美元被突破,约有7.5亿美元的看空仓位被清除。再叠加从9月18日开始逐步到账的大约156亿美元美联储国库券(Fed Treasury bill)买入,你就会看到:尽管遭遇了监管挫折,市场仍然从中恢复——而不是因为那次挫折。
这里的表述值得更谨慎一些。把这次上冲说成是《CLARITY》驱动的浪潮,会忽略中间实际发生的一整周:先是一次真正的抛售,然后才出现了由技术面与流动性推动的、彼此独立的反弹,只是碰巧落在同一段时间区间内。Scott Melker的解读似乎更接近事实:坏消息只是让价格不再继续下跌,并非好消息把价格推高——这两种说法因果关系完全不同。
自从82,000美元突破以来,未平仓量大约上升了20亿美元,这意味着这波反弹正在重新累积新的杠杆,而到目前为止它并不是纯粹由空头回补触发的行情。
我的直白判断:价格走势是真的,空头清算也是真的,但把这一切具体归因于《CLARITY》失败就把因果关系倒过来了。这更像是市场对“比实际更糟”的消息进行了定价,然后依靠自身动能继续上行。
我在关注:86,000美元到90,000美元这段区间能否在新杠杆累积的同时站稳,还是这会像某些建立在“重建未平仓量”之上的反弹那样,开始显得过度延伸。
$BTC #BTC Price Analysis# #Altcoin Season# $ETH
《CLARITY法案》于9月15日在参议院失败。就在同一天, 比特币跌至74,900美元,超过6亿美元发生了长仓的强制清算。六天后,它回到86,000美元,为八个月来的高点。这一连串走势才是真正的故事,而不是从失败直接一路走到反弹。
最初的反应偏空——这正是你所预期的。但随后出现的修复并不真正与《CLARITY》有关。它来自BTC在78,000美元上方清除技术阻力、随后又在82,000美元上方再度突破。每一次突破都引发新的空头清算,从而推动下一段上涨。CoinGlass数据显示,截至今天,随着82,000美元被突破,约有7.5亿美元的看空仓位被清除。再叠加从9月18日开始逐步到账的大约156亿美元美联储国库券(Fed Treasury bill)买入,你就会看到:尽管遭遇了监管挫折,市场仍然从中恢复——而不是因为那次挫折。
这里的表述值得更谨慎一些。把这次上冲说成是《CLARITY》驱动的浪潮,会忽略中间实际发生的一整周:先是一次真正的抛售,然后才出现了由技术面与流动性推动的、彼此独立的反弹,只是碰巧落在同一段时间区间内。Scott Melker的解读似乎更接近事实:坏消息只是让价格不再继续下跌,并非好消息把价格推高——这两种说法因果关系完全不同。
自从82,000美元突破以来,未平仓量大约上升了20亿美元,这意味着这波反弹正在重新累积新的杠杆,而到目前为止它并不是纯粹由空头回补触发的行情。
我的直白判断:价格走势是真的,空头清算也是真的,但把这一切具体归因于《CLARITY》失败就把因果关系倒过来了。这更像是市场对“比实际更糟”的消息进行了定价,然后依靠自身动能继续上行。
我在关注:86,000美元到90,000美元这段区间能否在新杠杆累积的同时站稳,还是这会像某些建立在“重建未平仓量”之上的反弹那样,开始显得过度延伸。
$BTC #BTC Price Analysis# #Altcoin Season# $ETH
最初的反应偏空——这正是你所预期的。但随后出现的修复并不真正与《CLARITY》有关。它来自BTC在78,000美元上方清除技术阻力、随后又在82,000美元上方再度突破。每一次突破都引发新的空头清算,从而推动下一段上涨。CoinGlass数据显示,截至今天,随着82,000美元被突破,约有7.5亿美元的看空仓位被清除。再叠加从9月18日开始逐步到账的大约156亿美元美联储国库券(Fed Treasury bill)买入,你就会看到:尽管遭遇了监管挫折,市场仍然从中恢复——而不是因为那次挫折。
这里的表述值得更谨慎一些。把这次上冲说成是《CLARITY》驱动的浪潮,会忽略中间实际发生的一整周:先是一次真正的抛售,然后才出现了由技术面与流动性推动的、彼此独立的反弹,只是碰巧落在同一段时间区间内。Scott Melker的解读似乎更接近事实:坏消息只是让价格不再继续下跌,并非好消息把价格推高——这两种说法因果关系完全不同。
自从82,000美元突破以来,未平仓量大约上升了20亿美元,这意味着这波反弹正在重新累积新的杠杆,而到目前为止它并不是纯粹由空头回补触发的行情。
我的直白判断:价格走势是真的,空头清算也是真的,但把这一切具体归因于《CLARITY》失败就把因果关系倒过来了。这更像是市场对“比实际更糟”的消息进行了定价,然后依靠自身动能继续上行。
我在关注:86,000美元到90,000美元这段区间能否在新杠杆累积的同时站稳,还是这会像某些建立在“重建未平仓量”之上的反弹那样,开始显得过度延伸。
$BTC #BTC Price Analysis# #Altcoin Season# $ETH
73
·
--
币安上的以太坊未平仓合约(open interest)刚刚触及九个月高位,而这究竟算是看涨确认,还是杠杆风险,完全取决于这个数据本身无法回答的一个细节。未平仓合约在8月底约48亿美元左右的水平上升到如今约65.8亿美元,9月期间出现了明显的加速,而不是缓慢爬升。与此同时,以太坊也上涨至约2,644美元,价格和未平仓头寸同步上行。以下这部分,我想对通常如何解读提出反对意见:未平仓合约在价格上涨的同时上升,常被直接解读为自动看涨——更多资金、更多参与、更强的信念。但在缺少构成的情况下,这只是“有道理到一半”。未平仓合约上升可能意味着带着真实信念进入的新多仓;也可能意味着空头被套并继续加码,最终在尚未反映之前积累了更多亏损仓位,之后再发生被动/集中爆仓平仓(capitulation);或者两者同时发生。仅凭美元数值无法区分这些情景。真正能让问题尘埃落定的,是同一时间窗口内的资金费率(funding rates)以及多空比(long/short ratio),但这份数据集中并没有包含。若在这段未平仓合约攀升期间,资金费率保持明显的正值偏高,那么会支持“真实的看涨参与”的解读;相反,如果资金费率维持平稳甚至为负,而未平仓合约却以如此快的速度扩张,则意味着市场更具争议性——卖方在对上涨施压,而不是买方把行情干净利落地推上去。无论最终是哪种情景,也值得直面风险这一面:未平仓合约九个月高位意味着相较于1月以来的任何时点,都有更多杠杆化资金暴露在价格波动之下。这会带来双向效应——如果行情维持,可能推动继续延续;但如果价格反转,也可能让反转速度更快,并在价格逼迫已过度扩张的一侧发生清算。这个问题的关键不在于“参与是否增加”——未平仓合约的数字已经明确证实了参与确实上升。真正需要搞清的是:究竟是哪一方增加了这种暴露,而这份特定报告遗漏了这一点。#BTC Price Analysis# $ETH
币安上的以太坊未平仓合约(open interest)刚刚触及九个月高位,而这究竟算是看涨确认,还是杠杆风险,完全取决于这个数据本身无法回答的一个细节。未平仓合约在8月底约48亿美元左右的水平上升到如今约65.8亿美元,9月期间出现了明显的加速,而不是缓慢爬升。与此同时,以太坊也上涨至约2,644美元,价格和未平仓头寸同步上行。以下这部分,我想对通常如何解读提出反对意见:未平仓合约在价格上涨的同时上升,常被直接解读为自动看涨——更多资金、更多参与、更强的信念。但在缺少构成的情况下,这只是“有道理到一半”。未平仓合约上升可能意味着带着真实信念进入的新多仓;也可能意味着空头被套并继续加码,最终在尚未反映之前积累了更多亏损仓位,之后再发生被动/集中爆仓平仓(capitulation);或者两者同时发生。仅凭美元数值无法区分这些情景。真正能让问题尘埃落定的,是同一时间窗口内的资金费率(funding rates)以及多空比(long/short ratio),但这份数据集中并没有包含。若在这段未平仓合约攀升期间,资金费率保持明显的正值偏高,那么会支持“真实的看涨参与”的解读;相反,如果资金费率维持平稳甚至为负,而未平仓合约却以如此快的速度扩张,则意味着市场更具争议性——卖方在对上涨施压,而不是买方把行情干净利落地推上去。无论最终是哪种情景,也值得直面风险这一面:未平仓合约九个月高位意味着相较于1月以来的任何时点,都有更多杠杆化资金暴露在价格波动之下。这会带来双向效应——如果行情维持,可能推动继续延续;但如果价格反转,也可能让反转速度更快,并在价格逼迫已过度扩张的一侧发生清算。这个问题的关键不在于“参与是否增加”——未平仓合约的数字已经明确证实了参与确实上升。真正需要搞清的是:究竟是哪一方增加了这种暴露,而这份特定报告遗漏了这一点。#BTC Price Analysis# $ETH
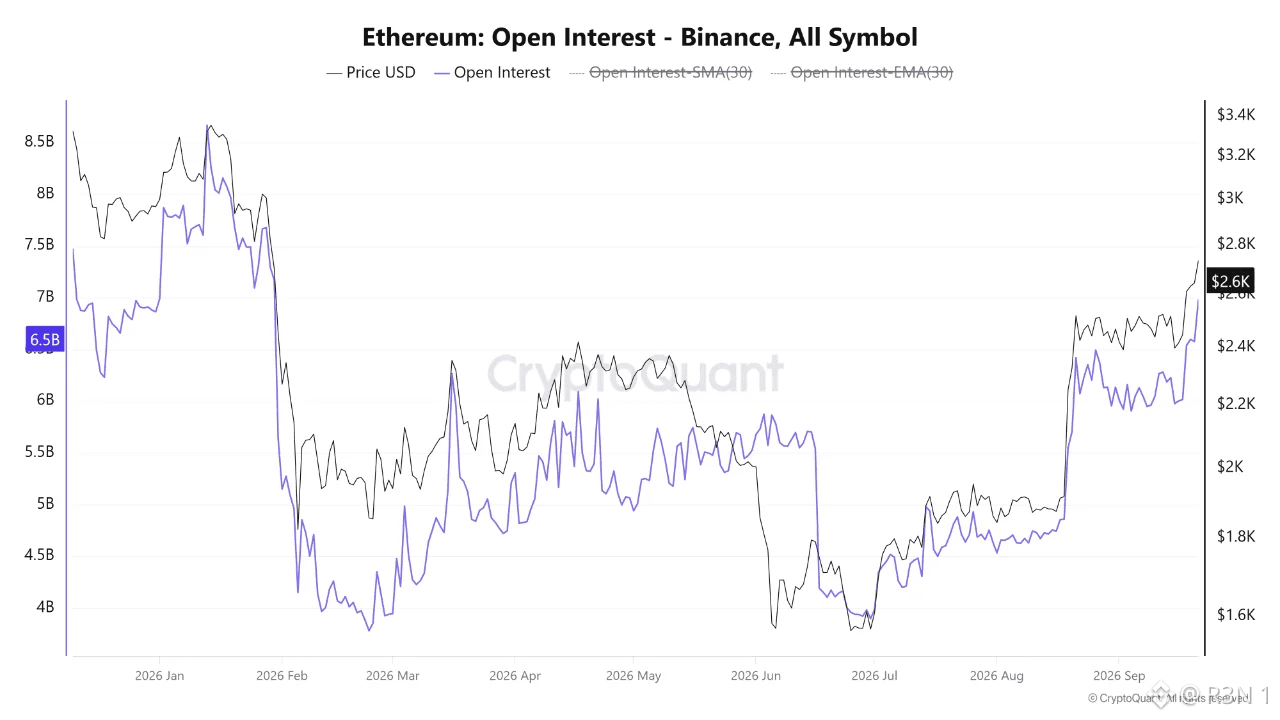
29
·
--
100 million POL 听起来是个很大的数字,直到你把它拿去对照实际的流通供应量,而机制本身还有一个细节值得重点标出。
此次销毁相当于 Polygon 的基础费用(base-fee)收集器中 1.21 亿 POL 的 83%。Sandeep Nailwal 表示,这将是无需许可的,任何人都能在其通过主网之后触发,而不仅仅是基金会。再看总供应量的话,根据 Blockscout 的数据,流通中的 107.16 亿 POL 中约为 0.93%。这是真实存在但规模不算大,也不是那种单凭数字本身就会在机制层面强迫价格移动的量。
让我觉得突出的是,这一说法同时还带着“收入”方面的声明。Nailwal 引用了 2026 年 2450 万美元的收入,高于 Arbitrum 的 841 万美元以及 NEAR 的 560 万美元,但他把这种对比归因于“我在 ChatGPT 上的分析师”,并且没有给出任何数据集或方法学名称。坦率地说,没有来源支撑的说法,不应当获得与燃烧机制同等的信心——后者已被独立确认,且早就在测试网上。
真正更关键的结构性部分,是这次销毁之后会发生什么。
这不是一次性的砍掉额度,而是建立了一套无需许可的季度机制:此后累计的基础费用会被销毁,从而让网络活动直接转化为通缩压力。Nailwal 表示,在当前方案下,POL 自 2026 年 1 月以来一直是净通缩的;这项机制则将此前据称已经在内部发生的事情制度化,并公之于众。
值得讲清楚的是,这里还处于“尚未发生”的阶段。合约已经部署在测试网中,等待安全委员会(Security Council)最终签署后才能上线主网——这是一个被确认的计划,而不是已经落地的既成事实。
开放的问题并不在于第一次销毁是否会通过——看起来非常接近确定。问题在于:这套季度机制能否在规模上产生足够可持续的经常性费用量。因为一个收集器“慢慢回填”的情况,和一个登上头条的单一数字,其含义完全不同。
$POL #Macro Insights# #Macro Insights#
100 million POL 听起来是个很大的数字,直到你把它拿去对照实际的流通供应量,而机制本身还有一个细节值得重点标出。
此次销毁相当于 Polygon 的基础费用(base-fee)收集器中 1.21 亿 POL 的 83%。Sandeep Nailwal 表示,这将是无需许可的,任何人都能在其通过主网之后触发,而不仅仅是基金会。再看总供应量的话,根据 Blockscout 的数据,流通中的 107.16 亿 POL 中约为 0.93%。这是真实存在但规模不算大,也不是那种单凭数字本身就会在机制层面强迫价格移动的量。
让我觉得突出的是,这一说法同时还带着“收入”方面的声明。Nailwal 引用了 2026 年 2450 万美元的收入,高于 Arbitrum 的 841 万美元以及 NEAR 的 560 万美元,但他把这种对比归因于“我在 ChatGPT 上的分析师”,并且没有给出任何数据集或方法学名称。坦率地说,没有来源支撑的说法,不应当获得与燃烧机制同等的信心——后者已被独立确认,且早就在测试网上。
真正更关键的结构性部分,是这次销毁之后会发生什么。
这不是一次性的砍掉额度,而是建立了一套无需许可的季度机制:此后累计的基础费用会被销毁,从而让网络活动直接转化为通缩压力。Nailwal 表示,在当前方案下,POL 自 2026 年 1 月以来一直是净通缩的;这项机制则将此前据称已经在内部发生的事情制度化,并公之于众。
值得讲清楚的是,这里还处于“尚未发生”的阶段。合约已经部署在测试网中,等待安全委员会(Security Council)最终签署后才能上线主网——这是一个被确认的计划,而不是已经落地的既成事实。
开放的问题并不在于第一次销毁是否会通过——看起来非常接近确定。问题在于:这套季度机制能否在规模上产生足够可持续的经常性费用量。因为一个收集器“慢慢回填”的情况,和一个登上头条的单一数字,其含义完全不同。
$POL #Macro Insights# #Macro Insights#
此次销毁相当于 Polygon 的基础费用(base-fee)收集器中 1.21 亿 POL 的 83%。Sandeep Nailwal 表示,这将是无需许可的,任何人都能在其通过主网之后触发,而不仅仅是基金会。再看总供应量的话,根据 Blockscout 的数据,流通中的 107.16 亿 POL 中约为 0.93%。这是真实存在但规模不算大,也不是那种单凭数字本身就会在机制层面强迫价格移动的量。
让我觉得突出的是,这一说法同时还带着“收入”方面的声明。Nailwal 引用了 2026 年 2450 万美元的收入,高于 Arbitrum 的 841 万美元以及 NEAR 的 560 万美元,但他把这种对比归因于“我在 ChatGPT 上的分析师”,并且没有给出任何数据集或方法学名称。坦率地说,没有来源支撑的说法,不应当获得与燃烧机制同等的信心——后者已被独立确认,且早就在测试网上。
真正更关键的结构性部分,是这次销毁之后会发生什么。
这不是一次性的砍掉额度,而是建立了一套无需许可的季度机制:此后累计的基础费用会被销毁,从而让网络活动直接转化为通缩压力。Nailwal 表示,在当前方案下,POL 自 2026 年 1 月以来一直是净通缩的;这项机制则将此前据称已经在内部发生的事情制度化,并公之于众。
值得讲清楚的是,这里还处于“尚未发生”的阶段。合约已经部署在测试网中,等待安全委员会(Security Council)最终签署后才能上线主网——这是一个被确认的计划,而不是已经落地的既成事实。
开放的问题并不在于第一次销毁是否会通过——看起来非常接近确定。问题在于:这套季度机制能否在规模上产生足够可持续的经常性费用量。因为一个收集器“慢慢回填”的情况,和一个登上头条的单一数字,其含义完全不同。
$POL #Macro Insights# #Macro Insights#



1
369
·
--
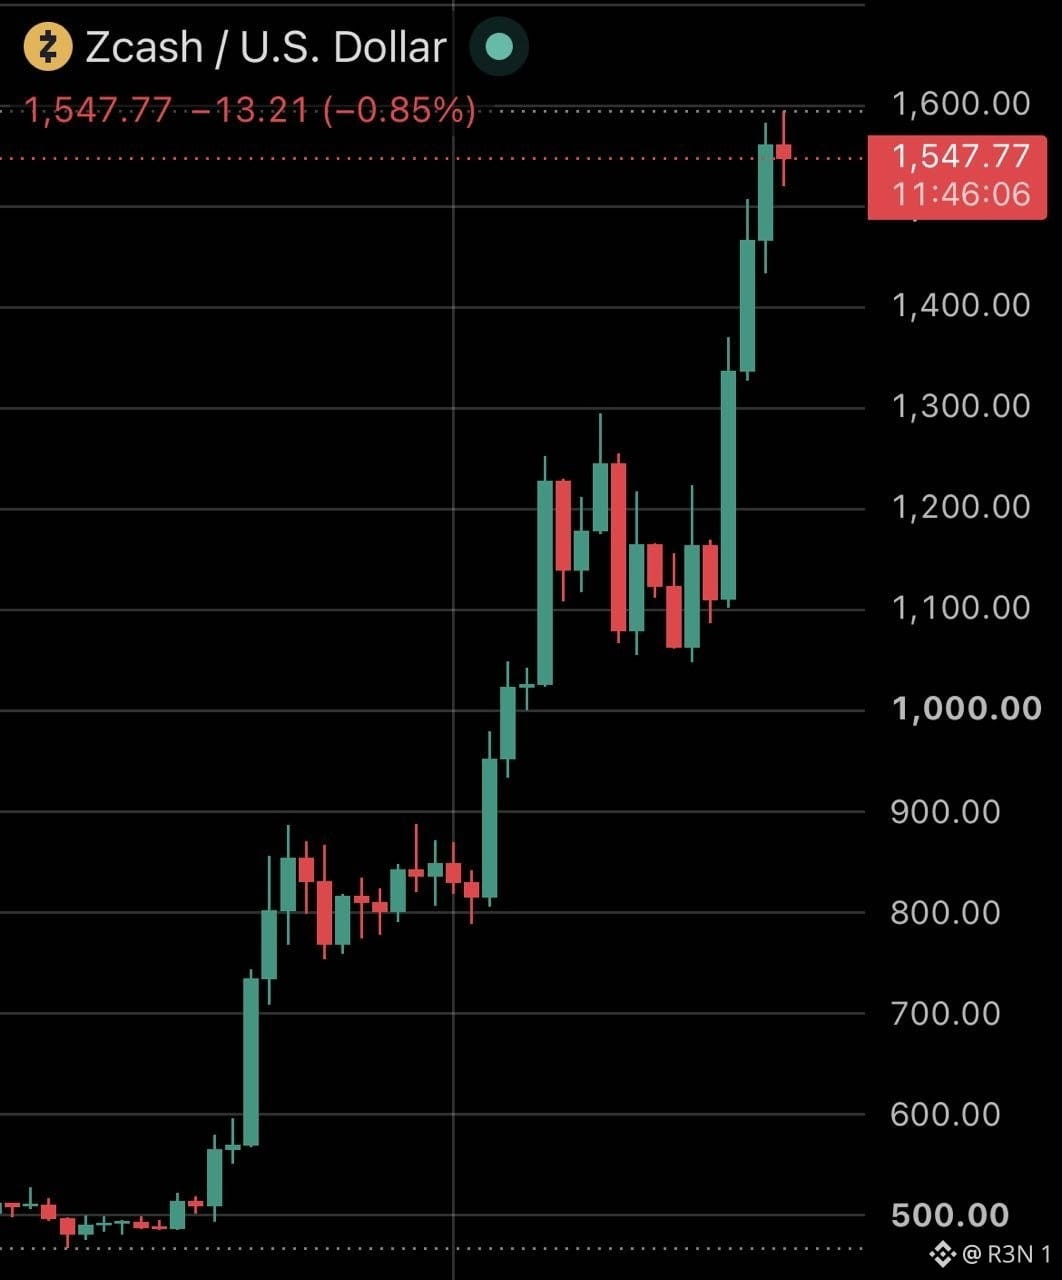
在六月抛售之后做空 ZEC 的同一位交易员,下一次尝试竟又把金额放大到原来的三倍以上才收手。真正的主线是这个,不只是今天的数字。
Garrett Jin,前 BitForex CEO,在六月重建了他的 ZEC 做空仓位,初始持有 11,780 ZEC,市值约 492 万美元;随后在 Zcash 上涨过程中不断追加,最终将规模扩大到约 40,000 ZEC。今天他通过市价单在大约 90 分钟内平掉了其中 38,000 ZEC。平仓动作本身曾短暂推动 ZEC 上涨 2.7%,从 1,490 美元拉升至 1,530 美元,并在此过程中把 Hyperliquid 的资金费率一度推高到年化超过 170%。据不同来源披露的亏损数据略有差异:Lookonchain 和 TechFlow 报为 3,544 万美元,Phemex 为 3,613 万美元。需要注意的是,不是去纠结“精确到美元的单一数字”,而是这个价差本身就说明了不确定性。
这里的背景很关键。过去一个月里 ZEC 上涨了大约 178%,仅上周 Zcash ETF 就吸金了 9,820 万美元——在该类别的 14 只产品中最多。Jin 也不是唯一被“反向碾压”的空头持仓者:据 BeInCrypto 报道,在同一时间窗口内,其他被追踪的钱包在较小规模的 ZEC 做空上也有 1,000 万到 1,200 万美元的浮亏。尽管如此,Jin 仍在现货端持有 202,078 ZEC,价值约 3.09 亿美元;该仓位预计带来 2.21 亿美元的未实现盈利。与此同时,他还单独持有 1,330 BTC 的多头仓位,价值约 1.0777 亿美元。
我坦诚的解读是:这次做空的实现亏损并不能抵消他在整体上仍然占据的巨大净多头优势;更像是投资组合中“一笔交易出了差错”,而组合整体依然深度盈利。
我在关注的是:Jin 是否会在更高的新价位重新进场做空 ZEC——考虑到他过去在遭遇亏损后就会做出类似操作——或者他是否会完全退出这个仓位。
$ZEC #BTC Price Analysis# #Macro Insights# #BNBChain#
在六月抛售之后做空 ZEC 的同一位交易员,下一次尝试竟又把金额放大到原来的三倍以上才收手。真正的主线是这个,不只是今天的数字。
Garrett Jin,前 BitForex CEO,在六月重建了他的 ZEC 做空仓位,初始持有 11,780 ZEC,市值约 492 万美元;随后在 Zcash 上涨过程中不断追加,最终将规模扩大到约 40,000 ZEC。今天他通过市价单在大约 90 分钟内平掉了其中 38,000 ZEC。平仓动作本身曾短暂推动 ZEC 上涨 2.7%,从 1,490 美元拉升至 1,530 美元,并在此过程中把 Hyperliquid 的资金费率一度推高到年化超过 170%。据不同来源披露的亏损数据略有差异:Lookonchain 和 TechFlow 报为 3,544 万美元,Phemex 为 3,613 万美元。需要注意的是,不是去纠结“精确到美元的单一数字”,而是这个价差本身就说明了不确定性。
这里的背景很关键。过去一个月里 ZEC 上涨了大约 178%,仅上周 Zcash ETF 就吸金了 9,820 万美元——在该类别的 14 只产品中最多。Jin 也不是唯一被“反向碾压”的空头持仓者:据 BeInCrypto 报道,在同一时间窗口内,其他被追踪的钱包在较小规模的 ZEC 做空上也有 1,000 万到 1,200 万美元的浮亏。尽管如此,Jin 仍在现货端持有 202,078 ZEC,价值约 3.09 亿美元;该仓位预计带来 2.21 亿美元的未实现盈利。与此同时,他还单独持有 1,330 BTC 的多头仓位,价值约 1.0777 亿美元。
我坦诚的解读是:这次做空的实现亏损并不能抵消他在整体上仍然占据的巨大净多头优势;更像是投资组合中“一笔交易出了差错”,而组合整体依然深度盈利。
我在关注的是:Jin 是否会在更高的新价位重新进场做空 ZEC——考虑到他过去在遭遇亏损后就会做出类似操作——或者他是否会完全退出这个仓位。
$ZEC #BTC Price Analysis# #Macro Insights# #BNBChain#
Garrett Jin,前 BitForex CEO,在六月重建了他的 ZEC 做空仓位,初始持有 11,780 ZEC,市值约 492 万美元;随后在 Zcash 上涨过程中不断追加,最终将规模扩大到约 40,000 ZEC。今天他通过市价单在大约 90 分钟内平掉了其中 38,000 ZEC。平仓动作本身曾短暂推动 ZEC 上涨 2.7%,从 1,490 美元拉升至 1,530 美元,并在此过程中把 Hyperliquid 的资金费率一度推高到年化超过 170%。据不同来源披露的亏损数据略有差异:Lookonchain 和 TechFlow 报为 3,544 万美元,Phemex 为 3,613 万美元。需要注意的是,不是去纠结“精确到美元的单一数字”,而是这个价差本身就说明了不确定性。
这里的背景很关键。过去一个月里 ZEC 上涨了大约 178%,仅上周 Zcash ETF 就吸金了 9,820 万美元——在该类别的 14 只产品中最多。Jin 也不是唯一被“反向碾压”的空头持仓者:据 BeInCrypto 报道,在同一时间窗口内,其他被追踪的钱包在较小规模的 ZEC 做空上也有 1,000 万到 1,200 万美元的浮亏。尽管如此,Jin 仍在现货端持有 202,078 ZEC,价值约 3.09 亿美元;该仓位预计带来 2.21 亿美元的未实现盈利。与此同时,他还单独持有 1,330 BTC 的多头仓位,价值约 1.0777 亿美元。
我坦诚的解读是:这次做空的实现亏损并不能抵消他在整体上仍然占据的巨大净多头优势;更像是投资组合中“一笔交易出了差错”,而组合整体依然深度盈利。
我在关注的是:Jin 是否会在更高的新价位重新进场做空 ZEC——考虑到他过去在遭遇亏损后就会做出类似操作——或者他是否会完全退出这个仓位。
$ZEC #BTC Price Analysis# #Macro Insights# #BNBChain#

50
·
--
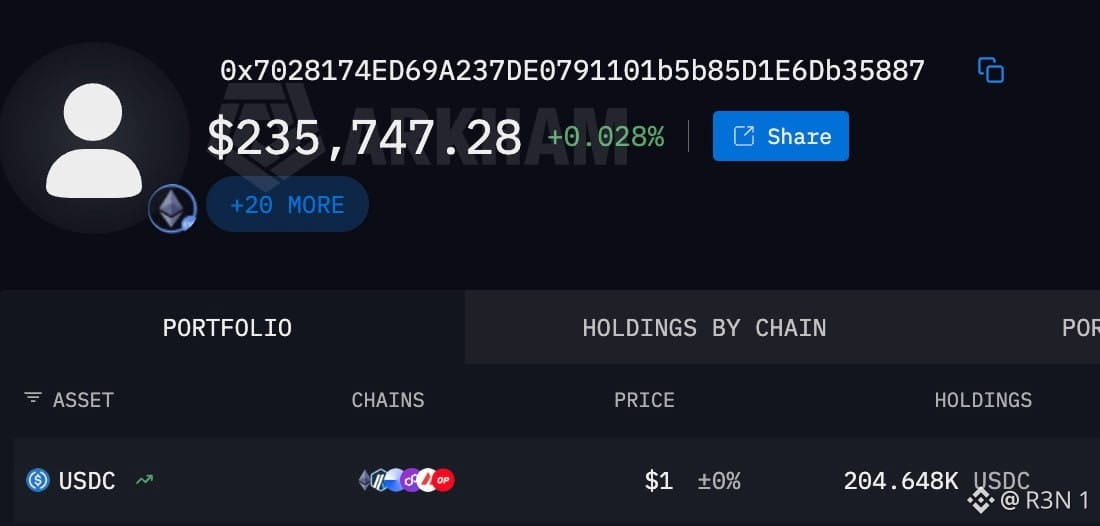
在48小时内,有数百个钱包里超过235,000美元凭空消失,但实际上没有人真正点名这次所用的恶意软件。这里真正的故事,不在于美元数字,而在于缺失的细节。
所描述的机制本身足够直白:远程访问木马(RAT)窃取凭据,并劫持正在进行的会话,从而完全绕过身份验证。攻击者利用受害者已经登录的状态“搭便车”,而不必单独窃取密码再重新登录。
这确实是一种真实且广为人知的攻击模式。缺失的则是通常会伴随这种指控出现的所有内容:没有点名的恶意软件家族,没有恶意域名,没有文件哈希,没有指挥与控制(C2)基础设施,也没有与研究结果挂钩的安全研究人员。
不过,相关活动背后确实存在链上痕迹。与这次活动相关的一组以太坊地址,早在更大范围的“恶意软件”说法传播开来两天之前,就出现在一则俄语Telegram帖子中。帖子将其描述为一个新的“抽水”(drainer)钱包,并声称类似地址每天至少能吸走20万美元。该说法同样尚未被独立验证,但就目前而言,它是与这件事相关的、最接近“硬证据”的东西。
我坦诚的看法:确实有些真实的事情正在发生,受害者可能数以百计,且有一份已被记录的钱包,并不能算作“没事”。但目前这更像是“带着标题的钱包余额”,而不是一张已经梳理清楚的恶意软件作战行动地图。把它直接称为已确认的RAT行动、并且给出已知机制,会走得比目前实际展示出来的证据更快。
在把它视为已尘埃落定之前,我希望看到:一份真正的安全报告,明确指出具体菌株/变种,并说明它是如何传播的——因为这份故事里目前仍然缺失的正是这唯一一块关键拼图。
$BTC #Altcoin Season# $ETH #BTC Price Analysis#
在48小时内,有数百个钱包里超过235,000美元凭空消失,但实际上没有人真正点名这次所用的恶意软件。这里真正的故事,不在于美元数字,而在于缺失的细节。
所描述的机制本身足够直白:远程访问木马(RAT)窃取凭据,并劫持正在进行的会话,从而完全绕过身份验证。攻击者利用受害者已经登录的状态“搭便车”,而不必单独窃取密码再重新登录。
这确实是一种真实且广为人知的攻击模式。缺失的则是通常会伴随这种指控出现的所有内容:没有点名的恶意软件家族,没有恶意域名,没有文件哈希,没有指挥与控制(C2)基础设施,也没有与研究结果挂钩的安全研究人员。
不过,相关活动背后确实存在链上痕迹。与这次活动相关的一组以太坊地址,早在更大范围的“恶意软件”说法传播开来两天之前,就出现在一则俄语Telegram帖子中。帖子将其描述为一个新的“抽水”(drainer)钱包,并声称类似地址每天至少能吸走20万美元。该说法同样尚未被独立验证,但就目前而言,它是与这件事相关的、最接近“硬证据”的东西。
我坦诚的看法:确实有些真实的事情正在发生,受害者可能数以百计,且有一份已被记录的钱包,并不能算作“没事”。但目前这更像是“带着标题的钱包余额”,而不是一张已经梳理清楚的恶意软件作战行动地图。把它直接称为已确认的RAT行动、并且给出已知机制,会走得比目前实际展示出来的证据更快。
在把它视为已尘埃落定之前,我希望看到:一份真正的安全报告,明确指出具体菌株/变种,并说明它是如何传播的——因为这份故事里目前仍然缺失的正是这唯一一块关键拼图。
$BTC #Altcoin Season# $ETH #BTC Price Analysis#
所描述的机制本身足够直白:远程访问木马(RAT)窃取凭据,并劫持正在进行的会话,从而完全绕过身份验证。攻击者利用受害者已经登录的状态“搭便车”,而不必单独窃取密码再重新登录。
这确实是一种真实且广为人知的攻击模式。缺失的则是通常会伴随这种指控出现的所有内容:没有点名的恶意软件家族,没有恶意域名,没有文件哈希,没有指挥与控制(C2)基础设施,也没有与研究结果挂钩的安全研究人员。
不过,相关活动背后确实存在链上痕迹。与这次活动相关的一组以太坊地址,早在更大范围的“恶意软件”说法传播开来两天之前,就出现在一则俄语Telegram帖子中。帖子将其描述为一个新的“抽水”(drainer)钱包,并声称类似地址每天至少能吸走20万美元。该说法同样尚未被独立验证,但就目前而言,它是与这件事相关的、最接近“硬证据”的东西。
我坦诚的看法:确实有些真实的事情正在发生,受害者可能数以百计,且有一份已被记录的钱包,并不能算作“没事”。但目前这更像是“带着标题的钱包余额”,而不是一张已经梳理清楚的恶意软件作战行动地图。把它直接称为已确认的RAT行动、并且给出已知机制,会走得比目前实际展示出来的证据更快。
在把它视为已尘埃落定之前,我希望看到:一份真正的安全报告,明确指出具体菌株/变种,并说明它是如何传播的——因为这份故事里目前仍然缺失的正是这唯一一块关键拼图。
$BTC #Altcoin Season# $ETH #BTC Price Analysis#
61
登录解锁更多内容
加入币安广场,与全球加密货币用户互动
⚡️ 获取关于加密货币的最新实用信息。
💬 受到全球最大加密货币交易平台的信赖。
👍 发现来自认证创作者的真知灼见。
邮箱/手机号码
热门话题
QNT上涨39%
14,360 次浏览
152 人讨论中
#qnt上涨39% QNT一天暴涨39%的真相,别搞错了标的
先说清楚,币安上那个95美金左右的QNT,是Quant Network的加密代币,搞区块链互操作性的,跟量子计算没半毛钱关系。
今天真正大涨39%的,是美股纳斯达克的Quantinuum,霍尼韦尔旗下的量子计算公司,代码也叫QNT。这两个完全不是一回事。Quantinuum上个月才IPO,发行价60块,现在才50左右,今天是因为政府1亿美金入股的消息拉起来的。
市场赌的是量子计算从实验室变成国家战略基建,政府真金白银入股等于给了估值底。但公司还在亏钱,营收才两千多万,别脑子一热追高。
币安那个QNT最近涨是因为跟美国清算所搞了银行代币化合作,各涨各的。$QNT
老腊肉-kevin
·2次点赞
·1.4k 次浏览
以太坊突破2700美元
806,389 次浏览
1,856 人讨论中
Bitget黑客伪造转账请求非窃取私钥
54,258 次浏览
107 人讨论中