

MemeQueen📉
127 个内容

MemeQueen📉
举报
屏蔽用户
Crypto Content Creator | Crypto streamer | I Yap about Crypto and Ai | Not a financial advice |
0 关注
3 粉丝
17 点赞
帖子
·
--
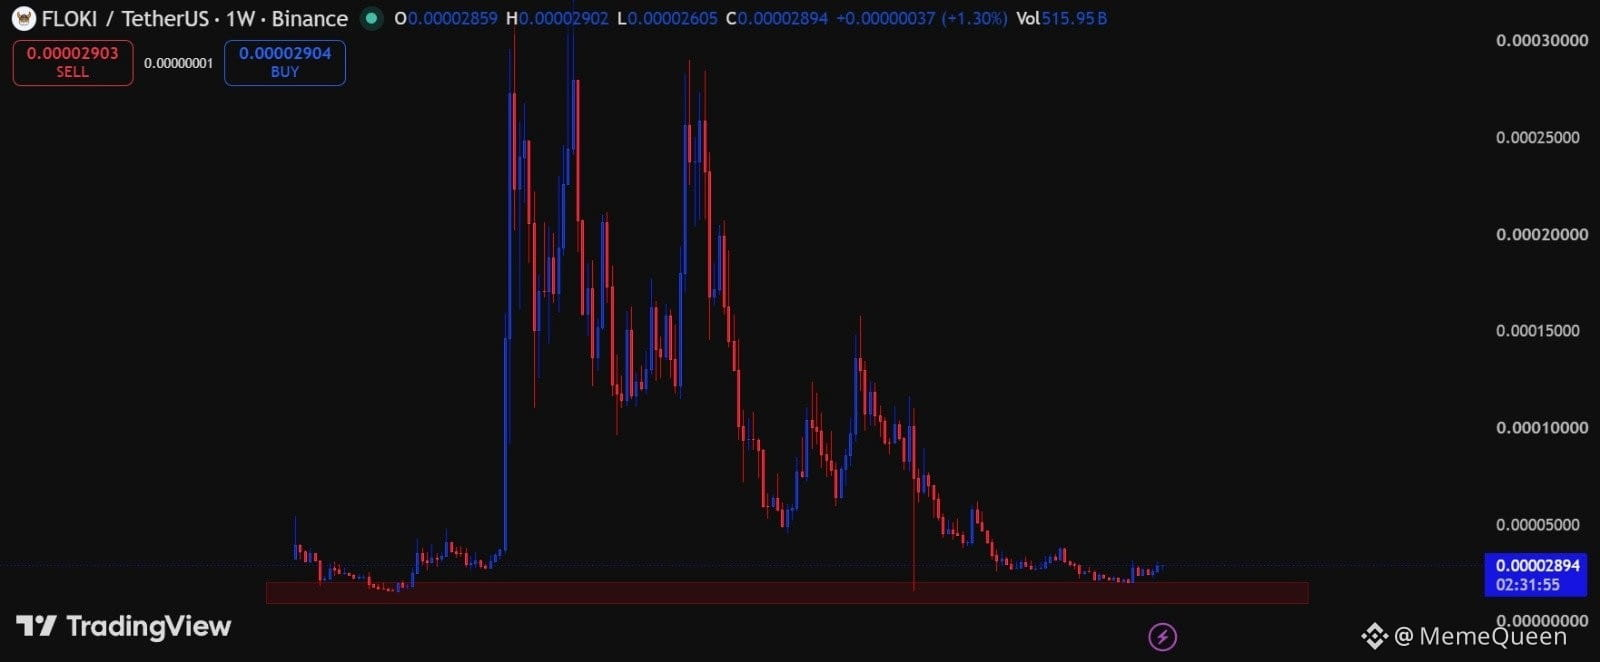
$FLOKI 在经历长时间调整后,正处于重要的周线需求区。过去几个月,价格持续下探至这一区域,如今走势终于开始趋于稳定,不再不断创出新低。只要周线支撑守住,我就看好后市。价格在这一区域维持得越久、没有跌破,当前形态就越强。如果动能回归,FLOKI 可能会令许多人感到意外。若能稳稳收复关键价位,就可能吸引新的买家,将这段平静的筑底行情转变为更大幅度的上涨。
$FLOKI 在经历长时间调整后,正处于重要的周线需求区。过去几个月,价格持续下探至这一区域,如今走势终于开始趋于稳定,不再不断创出新低。只要周线支撑守住,我就看好后市。价格在这一区域维持得越久、没有跌破,当前形态就越强。如果动能回归,FLOKI 可能会令许多人感到意外。若能稳稳收复关键价位,就可能吸引新的买家,将这段平静的筑底行情转变为更大幅度的上涨。
97
·
--
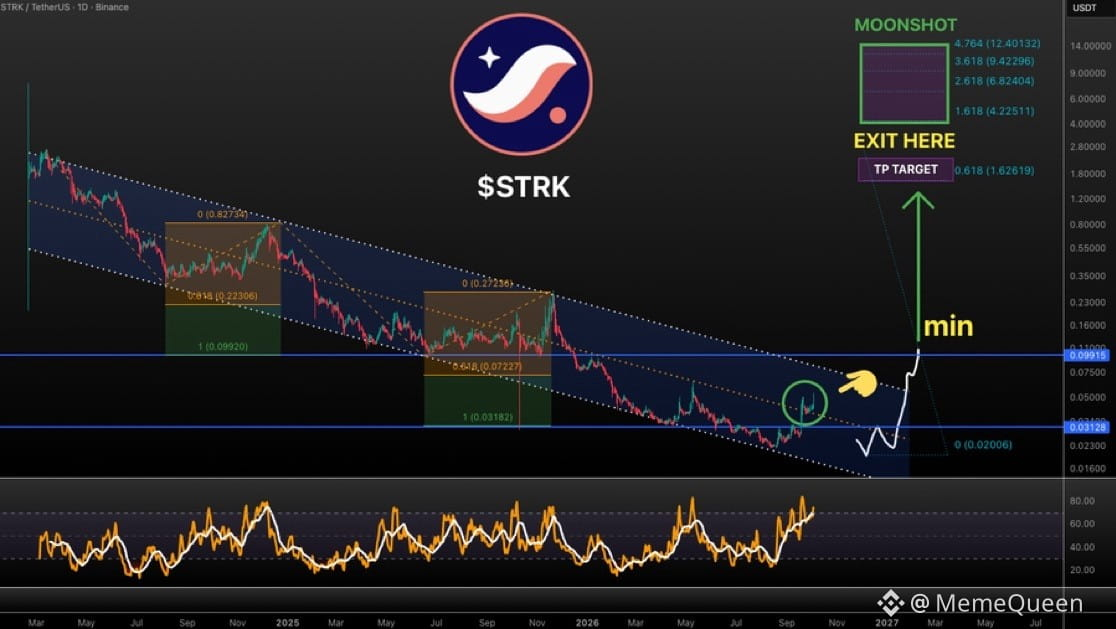
$STRK 更新!!! 我们下跌通道的中线刚刚被确认作为支撑,所以计划仍然完全如预期在轨道上!等我们到 1.6 左右时,我会在那时把这些东西卸掉 MOST(大部分)。如果你手上拿的袋子太重,而且对风险不太安心,$0.1 是你可以考虑的「降低风险」门槛。别慌,别被 FUD(恐惧、不确定与怀疑)影响!这个设置仍在如同预期的方式持续发展。 | 请继续关注
$STRK 更新!!! 我们下跌通道的中线刚刚被确认作为支撑,所以计划仍然完全如预期在轨道上!等我们到 1.6 左右时,我会在那时把这些东西卸掉 MOST(大部分)。如果你手上拿的袋子太重,而且对风险不太安心,$0.1 是你可以考虑的「降低风险」门槛。别慌,别被 FUD(恐惧、不确定与怀疑)影响!这个设置仍在如同预期的方式持续发展。 | 请继续关注
47
·
--
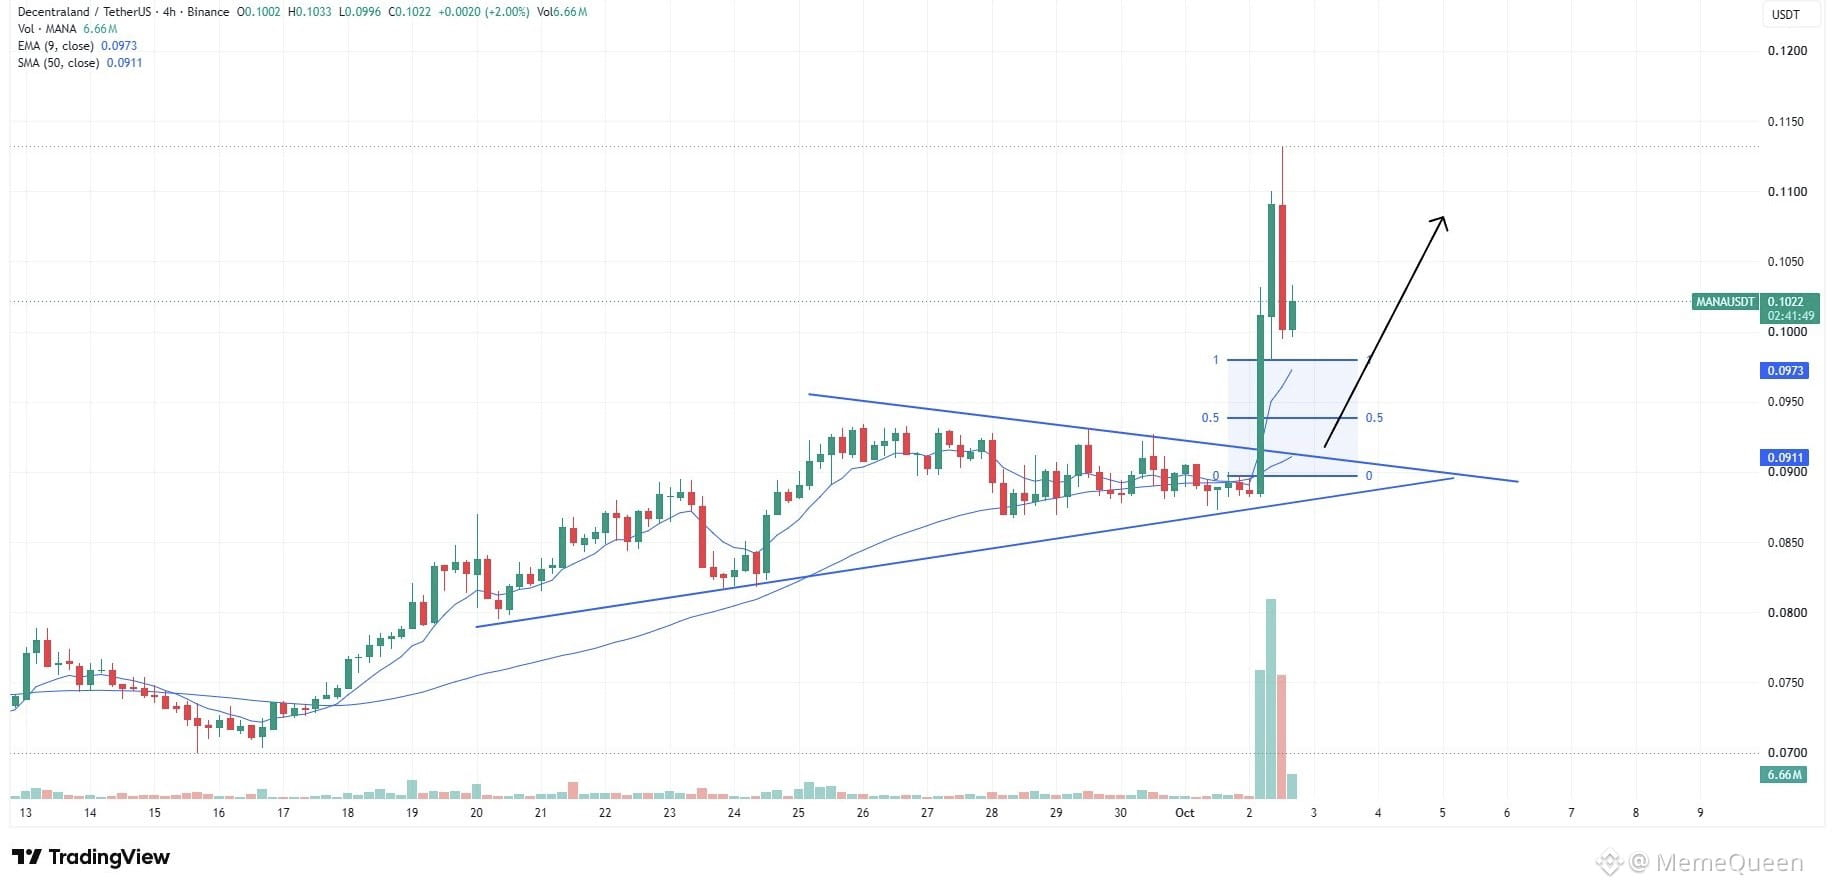
关于 #MANA 的想法:今天 $MANA 做出了一次强势动作,凭借明确的动能打破了对称三角形。此次突破看起来相当有说服力,但这次急涨也留下了一个不错的 FVG,我预计价格在下一段更高走势之前会回补。这样的回补可能给市场在冲动行情之后一点降温空间。这个 FVG 的填补也可能让价格回到并重新测试三角形突破的位置,因此这个区域值得重点关注,寻找潜在的多单机会。如果 $MANA 能在回测时守住并且买方重新介入,我会寻找继续上行,目标指向 $0.11 区域,同时先密切观察价格在 FVG 附近的反应情况。
关于 #MANA 的想法:今天 $MANA 做出了一次强势动作,凭借明确的动能打破了对称三角形。此次突破看起来相当有说服力,但这次急涨也留下了一个不错的 FVG,我预计价格在下一段更高走势之前会回补。这样的回补可能给市场在冲动行情之后一点降温空间。这个 FVG 的填补也可能让价格回到并重新测试三角形突破的位置,因此这个区域值得重点关注,寻找潜在的多单机会。如果 $MANA 能在回测时守住并且买方重新介入,我会寻找继续上行,目标指向 $0.11 区域,同时先密切观察价格在 FVG 附近的反应情况。
24
·
--
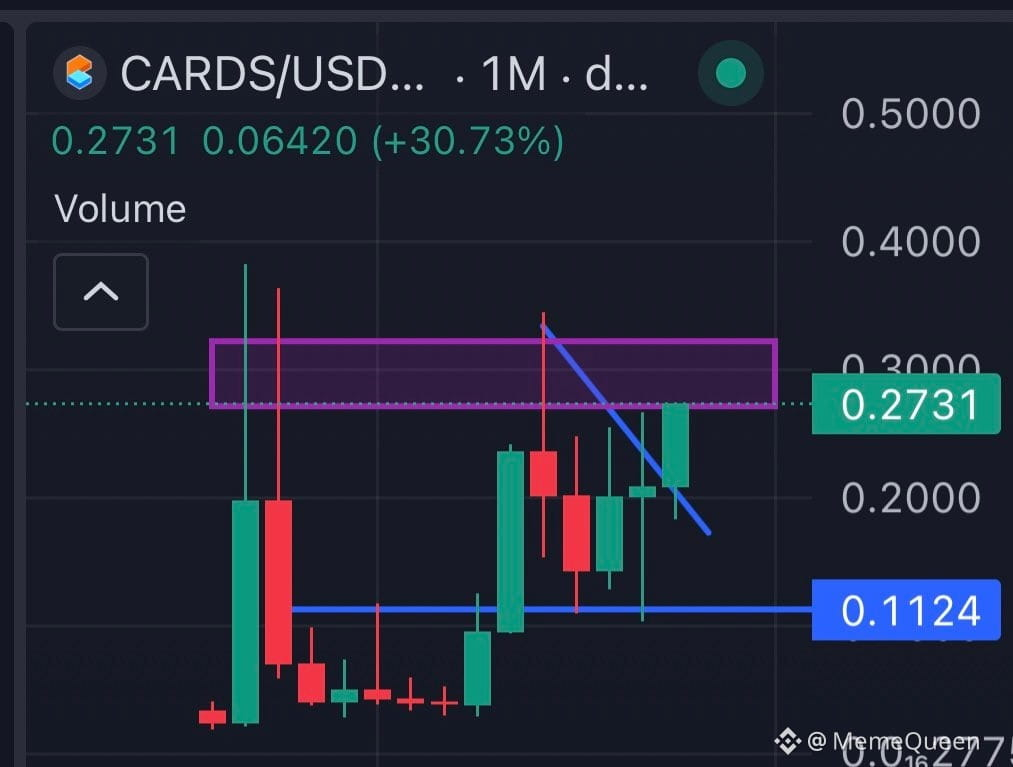
人们没有意识到的是,$CARDS 可能会成为 Solana 的“LIT”,就像 LIT 对以太坊所起的作用一样。这个周期里,这是一项最有趣的全新链上业务之一——尤其是在模因币叙事开始有点陈旧、而且变得拥挤的时候。这里更大的机会在于,$CARDS 可能扮演的角色:为链上带来更多用户、资本以及真正的活动。如果 Solana 想要把自己巩固为面向零售用户的应用链,这类项目就至关重要。随着叙事的发展,Bitget 的交易者也开始更加关注。真正的问题是,CARDS 能否把早期的关注转化为持续的采用。问题是?
人们没有意识到的是,$CARDS 可能会成为 Solana 的“LIT”,就像 LIT 对以太坊所起的作用一样。这个周期里,这是一项最有趣的全新链上业务之一——尤其是在模因币叙事开始有点陈旧、而且变得拥挤的时候。这里更大的机会在于,$CARDS 可能扮演的角色:为链上带来更多用户、资本以及真正的活动。如果 Solana 想要把自己巩固为面向零售用户的应用链,这类项目就至关重要。随着叙事的发展,Bitget 的交易者也开始更加关注。真正的问题是,CARDS 能否把早期的关注转化为持续的采用。问题是?
33
·
--
9月份新增岗位仅约29,000个,疲弱程度明显低于预期的约89,000……再加上失业率升至4.2%,已将10月美联储加息的概率压低至约17%至18%。这是根据CME FedWatch及相关市场定价得出的。$BTC 的表现也随之推动其站上$86,000,并一度逼近$87,000:随着市场对降息路径的预期缓和,加息预期降温减轻了对收益率的压力,从而改善了风险资产的整体环境。疲弱的就业数据也支持了ETF需求更为稳定的判断;此前Citi就曾在将其12个月期$BTC 目标从$82,000上调至$113,000的同时,将其$ETH 目标上调至$3,028时提到这一点。该$113,000数字是“一年期展望”而非短期押注,意味着若路径维持,大致对应从当前水平约30%的上涨空间。Citi的论点基于约50亿美元的逐步加密资金流入:顾问与经纪商缓慢提高配置水平,延续了此前到2026年较早阶段的资金流出,转而在9月底出现适度的正向流量。只要ETF持续买入、宏观面仍有支撑,且没有重新收紧的举措, 比特币就可能在12个月窗口内接近该目标;若要更快到达,则需要更强的资金流入,或收益率出现比银行目前假设更大幅度的下行。
9月份新增岗位仅约29,000个,疲弱程度明显低于预期的约89,000……再加上失业率升至4.2%,已将10月美联储加息的概率压低至约17%至18%。这是根据CME FedWatch及相关市场定价得出的。$BTC 的表现也随之推动其站上$86,000,并一度逼近$87,000:随着市场对降息路径的预期缓和,加息预期降温减轻了对收益率的压力,从而改善了风险资产的整体环境。疲弱的就业数据也支持了ETF需求更为稳定的判断;此前Citi就曾在将其12个月期$BTC 目标从$82,000上调至$113,000的同时,将其$ETH 目标上调至$3,028时提到这一点。该$113,000数字是“一年期展望”而非短期押注,意味着若路径维持,大致对应从当前水平约30%的上涨空间。Citi的论点基于约50亿美元的逐步加密资金流入:顾问与经纪商缓慢提高配置水平,延续了此前到2026年较早阶段的资金流出,转而在9月底出现适度的正向流量。只要ETF持续买入、宏观面仍有支撑,且没有重新收紧的举措, 比特币就可能在12个月窗口内接近该目标;若要更快到达,则需要更强的资金流入,或收益率出现比银行目前假设更大幅度的下行。

55
·
--
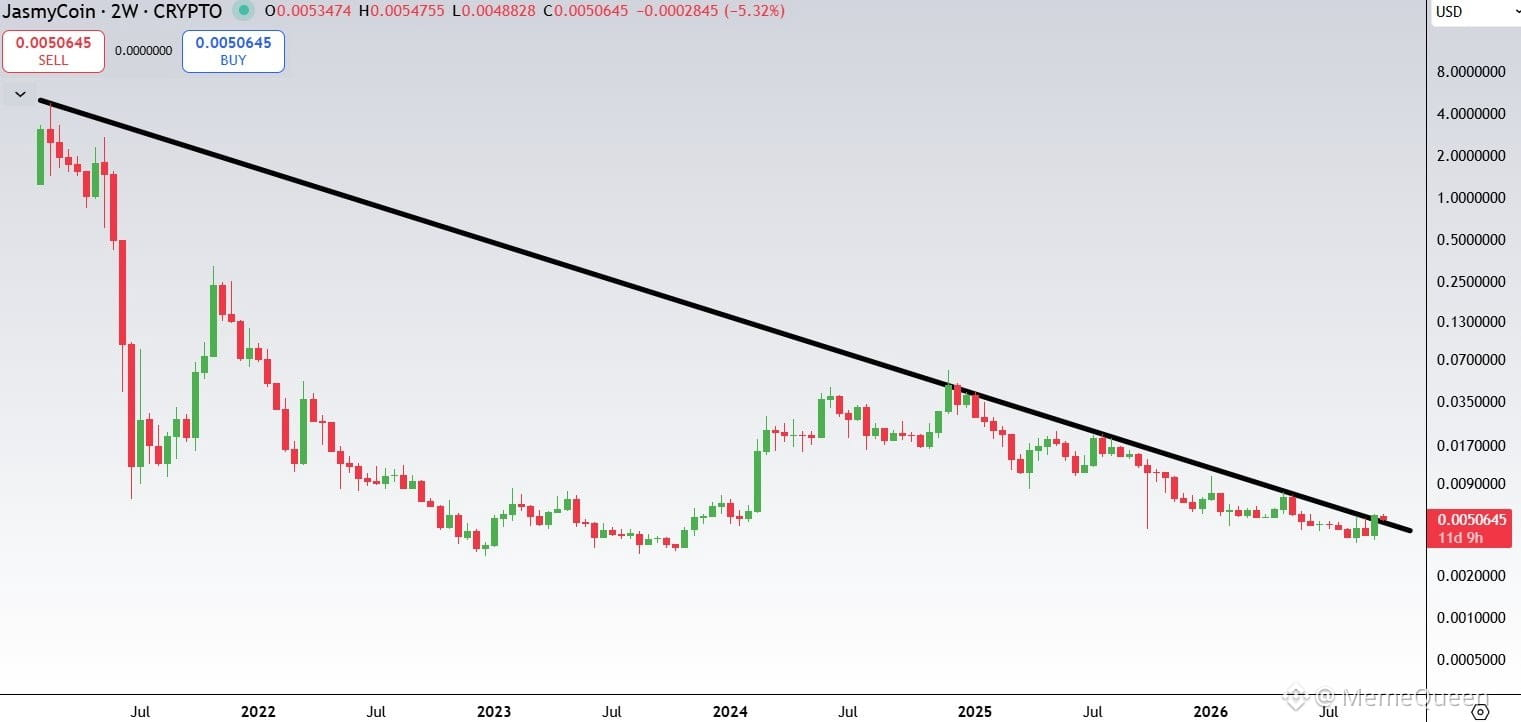
$JASMY 每周“突破”却鲜有人提及的信号 🤫 JasmyCoin 继续在周线级别中突破其下降楔形的上沿,将一个重要的技术性阻力区推到聚光灯下。 在从过去的退市事件中恢复并敲定新的平台合作之后,该生态系统持续展现出开发与增长的迹象。 像这样的周线突破并不常见,尤其是在经历了较长时间的盘整之后。 如果该突破能在周线收盘时站稳,它可能为显著的上行动能打开空间;同时,若交易量重新放大,也将进一步提供确认信号。
$JASMY 每周“突破”却鲜有人提及的信号 🤫 JasmyCoin 继续在周线级别中突破其下降楔形的上沿,将一个重要的技术性阻力区推到聚光灯下。 在从过去的退市事件中恢复并敲定新的平台合作之后,该生态系统持续展现出开发与增长的迹象。 像这样的周线突破并不常见,尤其是在经历了较长时间的盘整之后。 如果该突破能在周线收盘时站稳,它可能为显著的上行动能打开空间;同时,若交易量重新放大,也将进一步提供确认信号。
79
·
--
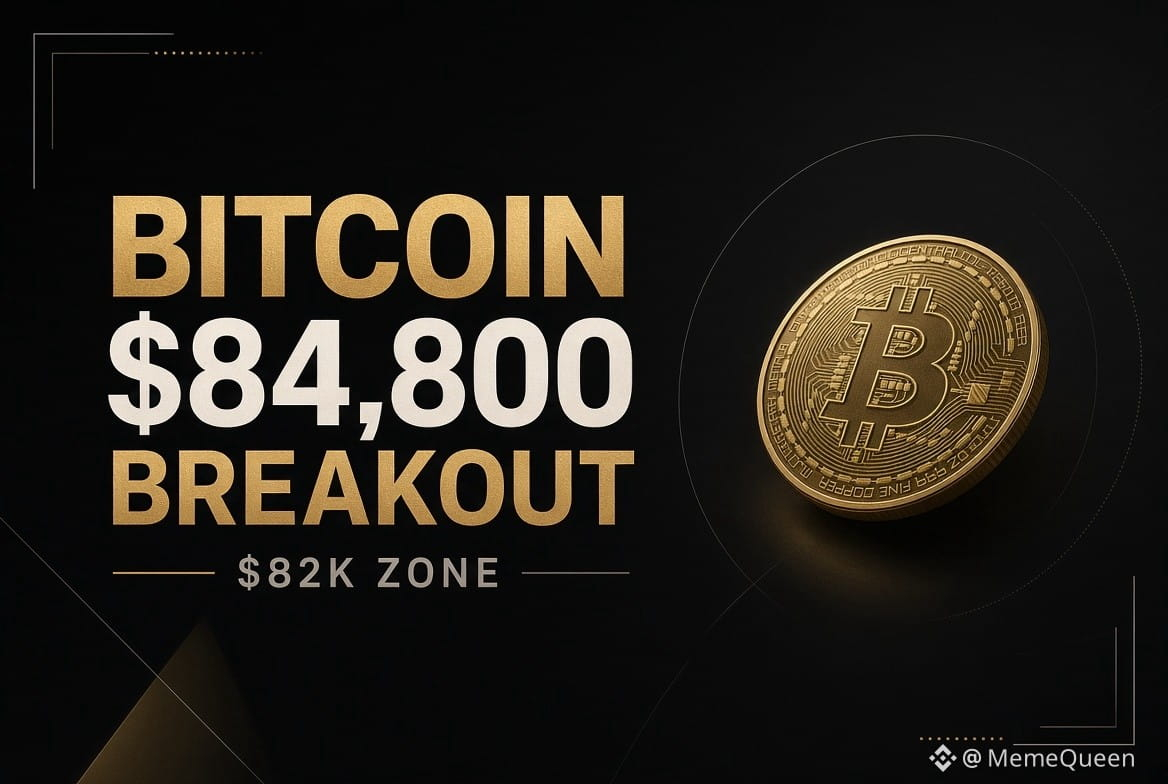
$BTC 不一定需要守住 $84K 才能维持突破的有效性。若价格回撤至 $82K,仍然符合在突破 $84.8K 之后进行正常回踩的情况,尤其是在近期低波动区间之后。关键在于买方是否会捍卫 $81.9K–$82K 这一带,并且能否迅速收复失地。守住它,那么回调只会用来“重置”过热的多头。若在日线收盘时失守,突破的脆弱性就会开始显现,而 $80.1K 将成为下一个需要关注的区域。围绕 $82K 的反应比回调本身更重要。
$BTC 不一定需要守住 $84K 才能维持突破的有效性。若价格回撤至 $82K,仍然符合在突破 $84.8K 之后进行正常回踩的情况,尤其是在近期低波动区间之后。关键在于买方是否会捍卫 $81.9K–$82K 这一带,并且能否迅速收复失地。守住它,那么回调只会用来“重置”过热的多头。若在日线收盘时失守,突破的脆弱性就会开始显现,而 $80.1K 将成为下一个需要关注的区域。围绕 $82K 的反应比回调本身更重要。
58
·
--
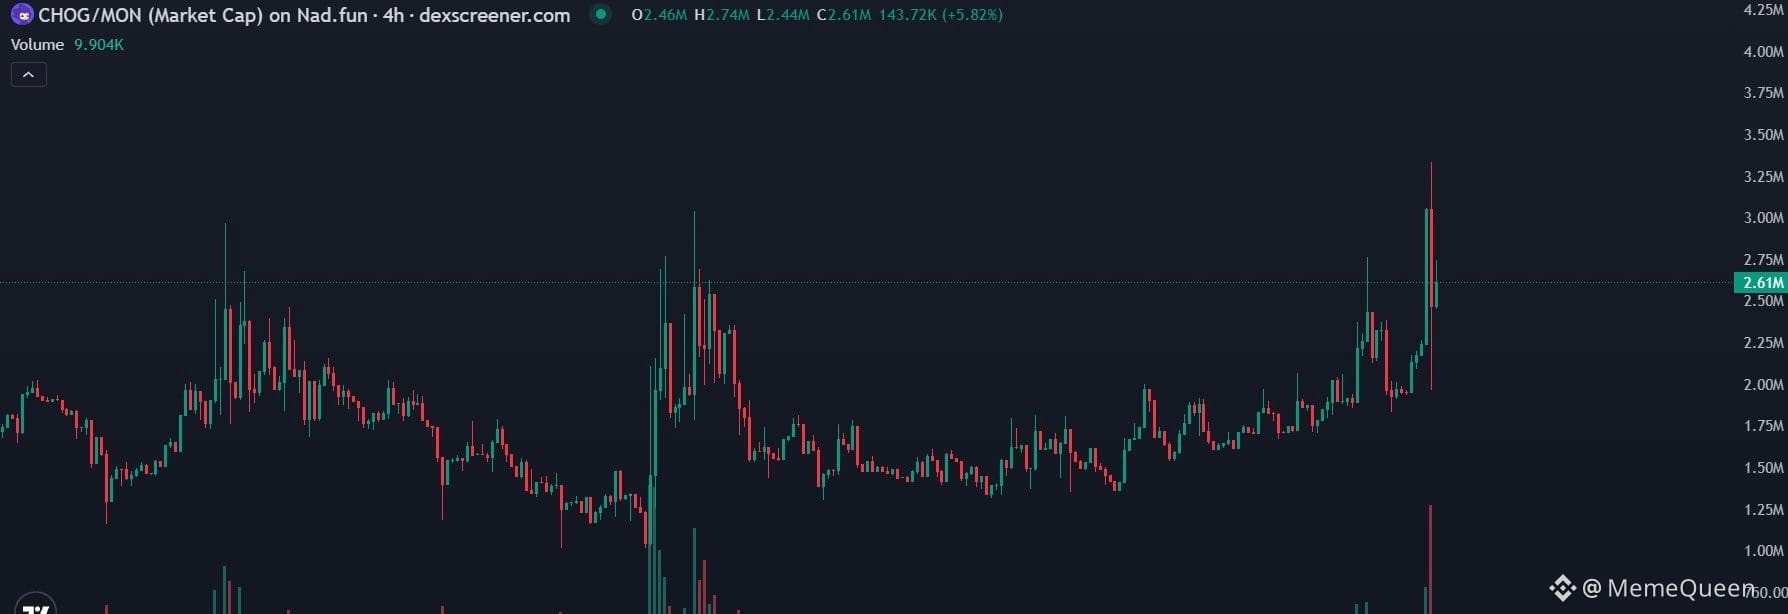
🚨 $MON 上涨24%:Monad 释放重大暗示:“隐私即将到来。”在 10 月 6 日 Open Summit 之前的预热视频引发了交易者对生态系统下一步的猜测。随着隐私在加密领域变得越来越重要,这可能不只是一次营销预告。Monad 也许正在准备披露新的隐私导向功能或基础设施升级。无论是哪种情况,市场关注点都在 10 月 6 日 Monad 计划揭示的内容上。$MON 甚至在公告发布前就已开始反应,为活动增添了期待。交易者将密切关注细节,看看隐私如何融入 Monad 的生态系统。
🚨 $MON 上涨24%:Monad 释放重大暗示:“隐私即将到来。”在 10 月 6 日 Open Summit 之前的预热视频引发了交易者对生态系统下一步的猜测。随着隐私在加密领域变得越来越重要,这可能不只是一次营销预告。Monad 也许正在准备披露新的隐私导向功能或基础设施升级。无论是哪种情况,市场关注点都在 10 月 6 日 Monad 计划揭示的内容上。$MON 甚至在公告发布前就已开始反应,为活动增添了期待。交易者将密切关注细节,看看隐私如何融入 Monad 的生态系统。
71
·
--
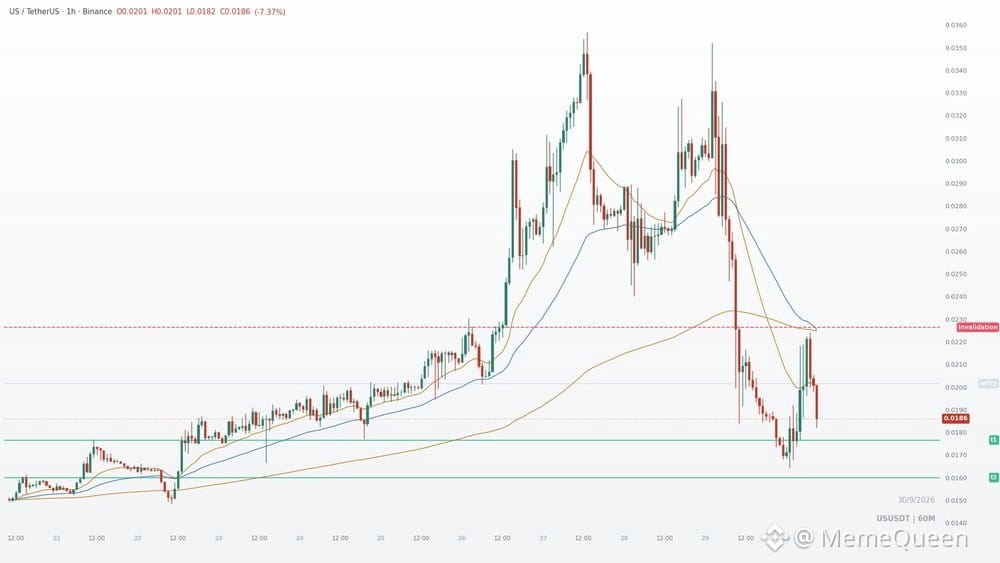
$US 正被那些不得不继续支付 0.125% 融资费用的人所“卡住”。这就是整个设置。1. 价格为 0.02014,融资费率为 0.125%,这对这一交易对来说异常。多头是拥挤的一方,他们每隔几小时就在租用那个仓位。2. 目前的建仓规模显然比这枚币在近期几次行情中承载的要大,而且它已经停止增长。仓位的大部分都已经到位。这说明更应等待入场时机,而不是追逐它,因为当我做空时,并没有新的资金流入来把价格继续推高。3. 0.64x 的成交量是问题所在。在如此薄的盘口上,这样规模的建仓意味着,退出通道比“持仓数量所暗示的”要更狭窄。4. 0.02264 是读数失效(读盘死掉)的地方,它的意义不在于价格本身,而在于这是“支付方”终于得到喘息的那个点。这里最重的数字是 0.016,而 0.01766 是更接近的那个;两者都在同一方向。风险区间从 0.02015 到 0.02264。整体形态清清楚楚,没有任何隐藏。EMA 20、50 和 200 都在价格之上,且都朝同一方向倾斜,而且这一次,均线与仓位解读是同向一致的,而不是彼此争论、唱反调。
$US 正被那些不得不继续支付 0.125% 融资费用的人所“卡住”。这就是整个设置。1. 价格为 0.02014,融资费率为 0.125%,这对这一交易对来说异常。多头是拥挤的一方,他们每隔几小时就在租用那个仓位。2. 目前的建仓规模显然比这枚币在近期几次行情中承载的要大,而且它已经停止增长。仓位的大部分都已经到位。这说明更应等待入场时机,而不是追逐它,因为当我做空时,并没有新的资金流入来把价格继续推高。3. 0.64x 的成交量是问题所在。在如此薄的盘口上,这样规模的建仓意味着,退出通道比“持仓数量所暗示的”要更狭窄。4. 0.02264 是读数失效(读盘死掉)的地方,它的意义不在于价格本身,而在于这是“支付方”终于得到喘息的那个点。这里最重的数字是 0.016,而 0.01766 是更接近的那个;两者都在同一方向。风险区间从 0.02015 到 0.02264。整体形态清清楚楚,没有任何隐藏。EMA 20、50 和 200 都在价格之上,且都朝同一方向倾斜,而且这一次,均线与仓位解读是同向一致的,而不是彼此争论、唱反调。
58
·
--
也许真正的“Uptober”行情会在10月之前就开始。如果交易者已经预期$BTC本月表现良好,他们就不必等到10月到来。有些人会提前布局,这会把原本预期中的部分涨幅提前释放。这也使得这个10月变得不同。与其去问比特币是否会重复其历史上10月的表现,我更关注市场在显而易见的季节性交易已经被拥挤之后,是否还能继续买入。$BTC在“Uptober”叙事不再新鲜之后,是否还能持续找到买家?如果可以,那么这种强势可能与日历的关系没那么大,而更取决于真实需求。
也许真正的“Uptober”行情会在10月之前就开始。如果交易者已经预期$BTC本月表现良好,他们就不必等到10月到来。有些人会提前布局,这会把原本预期中的部分涨幅提前释放。这也使得这个10月变得不同。与其去问比特币是否会重复其历史上10月的表现,我更关注市场在显而易见的季节性交易已经被拥挤之后,是否还能继续买入。$BTC在“Uptober”叙事不再新鲜之后,是否还能持续找到买家?如果可以,那么这种强势可能与日历的关系没那么大,而更取决于真实需求。

69
·
--
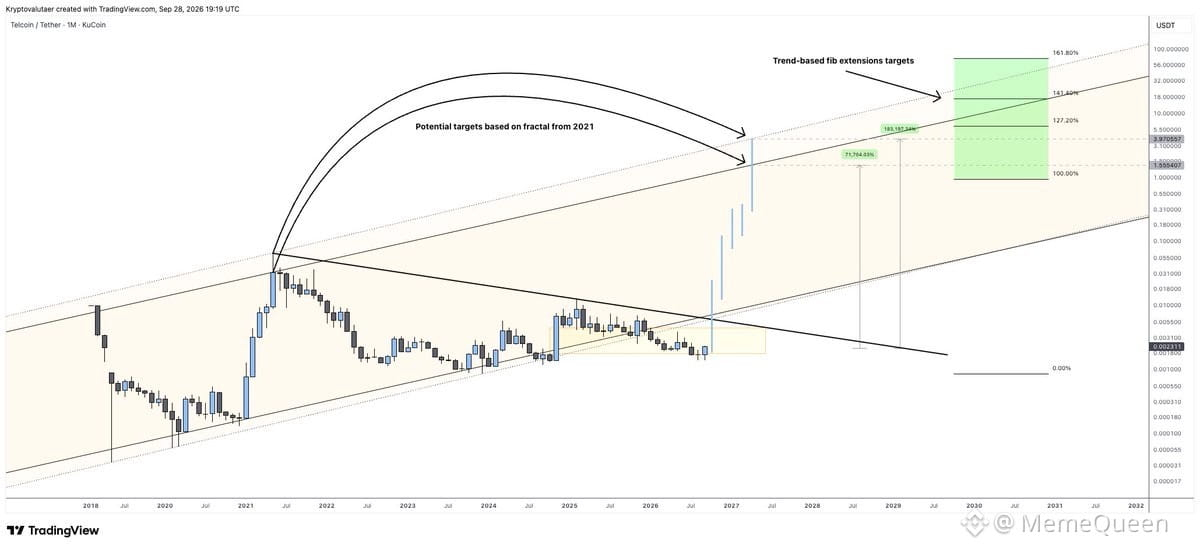
$TEL 月度图表更新 我已再次调整了 2021 年的分形目标。我并不太喜欢分形,但不妨还是把它们追踪一下。更大的问题是:这些目标有多现实。使用基于趋势的 Fib 延伸,目前的设置指向一个潜在目标区间 $1-$6,基于 100-127.20% 的延伸 🤞 关注过我的人都知道,我的主要目标仍然基于我每周的 TEL 图表,但我会继续跟踪这个月度设置,看看它的发展。就目前而言,我把它当作情景来对待,而不是预测,同时观察价格在关键价位附近的反应。
$TEL 月度图表更新 我已再次调整了 2021 年的分形目标。我并不太喜欢分形,但不妨还是把它们追踪一下。更大的问题是:这些目标有多现实。使用基于趋势的 Fib 延伸,目前的设置指向一个潜在目标区间 $1-$6,基于 100-127.20% 的延伸 🤞 关注过我的人都知道,我的主要目标仍然基于我每周的 TEL 图表,但我会继续跟踪这个月度设置,看看它的发展。就目前而言,我把它当作情景来对待,而不是预测,同时观察价格在关键价位附近的反应。
43
·
--
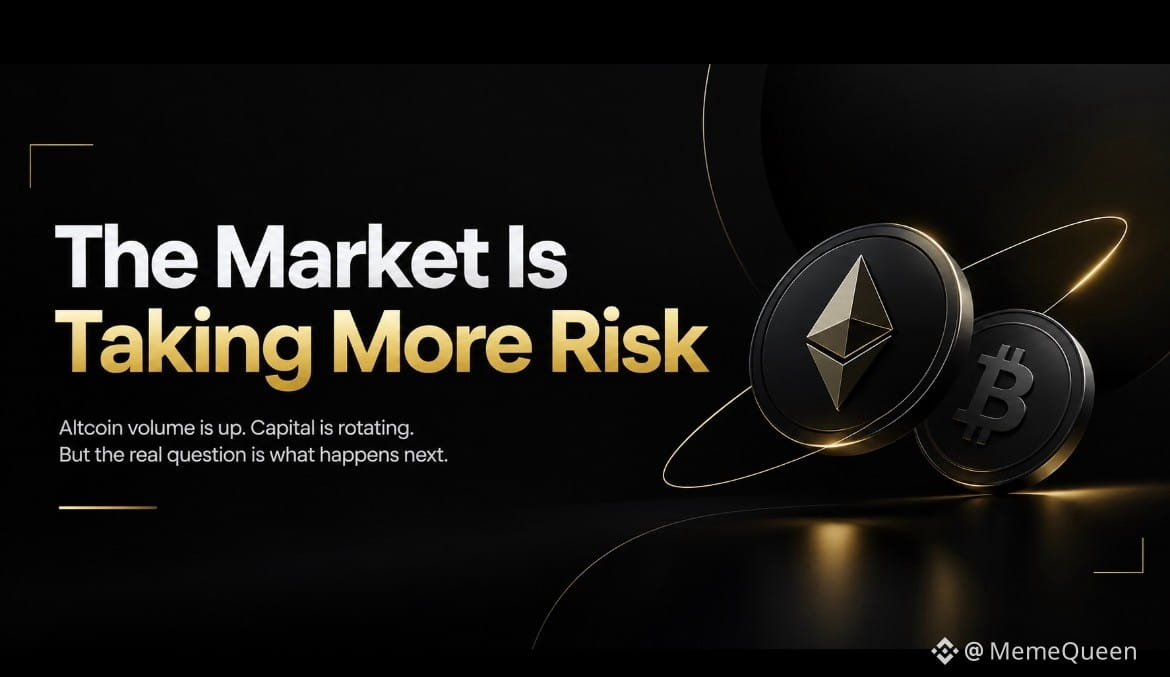
有趣的并不只是山寨币的交易量比比特币更多。更关键的是这反映了交易者的行为方式。当山寨币的交易量大致达到约4倍于$BTC时,资本显然更愿意在风险曲线上更远的位置进行配置。这可能为更广泛的市场轮动创造条件,但并不自动意味着“山寨季”已经到来。接下来真正重要的是:这种活跃能否转化为持续的需求。如果山寨币价格继续站稳、总市值持续扩张,并且在最初的放量脉冲降温后参与仍然保持广泛,那么这次行情就会显得更有意义。反之,如果在交易活动迅速降温的同时交易所的资金流入仍保持在高位,这可能意味着交易者正在利用当前的强势来降低敞口,而不是建立新的仓位。因此,与其追问4倍放量是否等于山寨季,不如观察热度褪去之后会发生什么。真正的信号可能就藏在那之后。
有趣的并不只是山寨币的交易量比比特币更多。更关键的是这反映了交易者的行为方式。当山寨币的交易量大致达到约4倍于$BTC时,资本显然更愿意在风险曲线上更远的位置进行配置。这可能为更广泛的市场轮动创造条件,但并不自动意味着“山寨季”已经到来。接下来真正重要的是:这种活跃能否转化为持续的需求。如果山寨币价格继续站稳、总市值持续扩张,并且在最初的放量脉冲降温后参与仍然保持广泛,那么这次行情就会显得更有意义。反之,如果在交易活动迅速降温的同时交易所的资金流入仍保持在高位,这可能意味着交易者正在利用当前的强势来降低敞口,而不是建立新的仓位。因此,与其追问4倍放量是否等于山寨季,不如观察热度褪去之后会发生什么。真正的信号可能就藏在那之后。
53
·
--
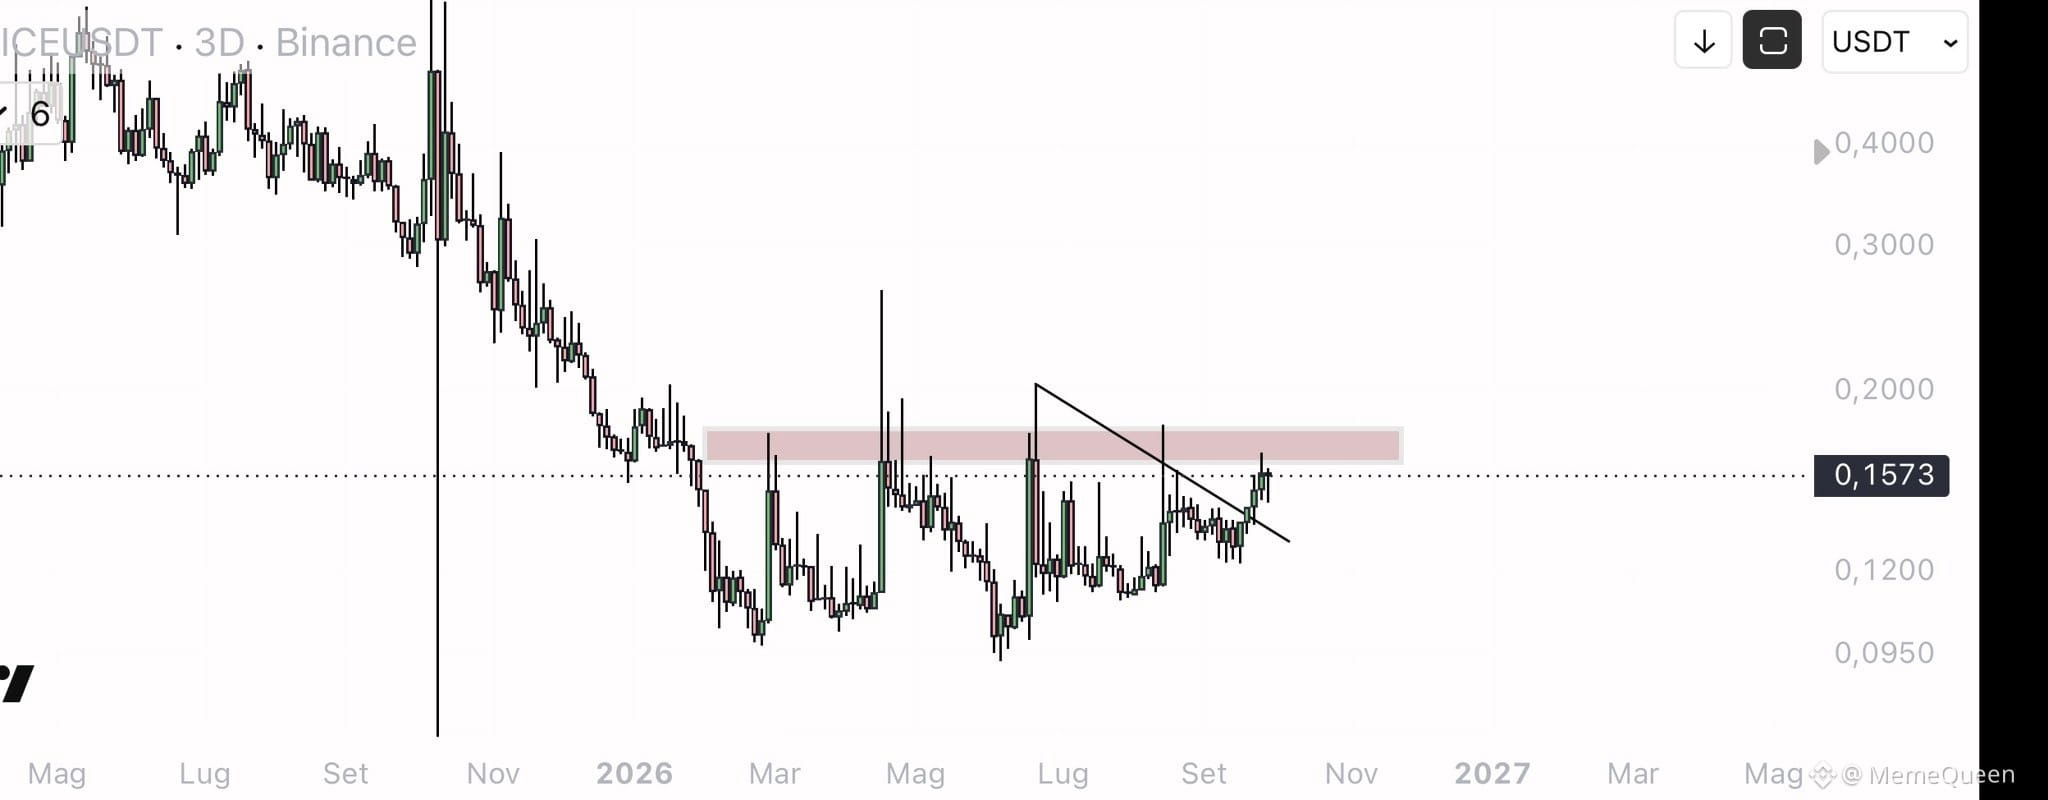
留意这里的 $ALICE ,因为如果价格最终突破并站上关键阻力区间,这套走势可能会变得很有意思。一旦确认突破,可能会打开迎来 30–50% 涨幅的空间,尤其是在成交量开始放大、买盘持续入场的情况下。尽管如此,我并不急着进场。我会在接下来的几天里继续观察图表,看看 $ALICE 是否能积累足够的动能从而顺势延续。就目前而言,它是我自选观察名单中的其中一个山寨币,我会重点关注价格在突破区域附近的反应,然后再考虑采取任何操作。关键在于看买方能否守住这次突破。
留意这里的 $ALICE ,因为如果价格最终突破并站上关键阻力区间,这套走势可能会变得很有意思。一旦确认突破,可能会打开迎来 30–50% 涨幅的空间,尤其是在成交量开始放大、买盘持续入场的情况下。尽管如此,我并不急着进场。我会在接下来的几天里继续观察图表,看看 $ALICE 是否能积累足够的动能从而顺势延续。就目前而言,它是我自选观察名单中的其中一个山寨币,我会重点关注价格在突破区域附近的反应,然后再考虑采取任何操作。关键在于看买方能否守住这次突破。
59
·
--
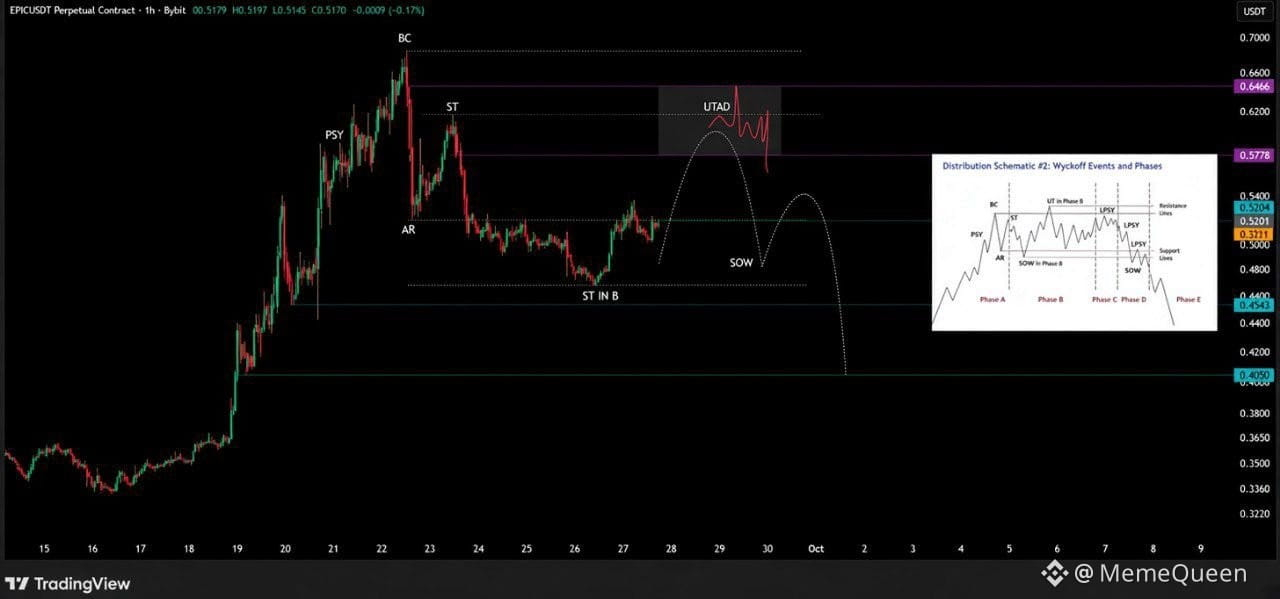
$EPIC /USDT | 1H | 🟡 基于怀科夫(Wyckoff)的设置,提示可能进入分配(Distribution)阶段,紧随近期跌破上升趋势结构之后。🟡 突出的阻力区域仍然是需要重点关注的关键区域,因为从该水平出现拒绝信号可能会打开进一步下跌的空间,并指向更低的支撑位。👀 目前,价格在该区域附近的走势将是确认卖方是否重新掌控局面的关键。
$EPIC /USDT | 1H | 🟡 基于怀科夫(Wyckoff)的设置,提示可能进入分配(Distribution)阶段,紧随近期跌破上升趋势结构之后。🟡 突出的阻力区域仍然是需要重点关注的关键区域,因为从该水平出现拒绝信号可能会打开进一步下跌的空间,并指向更低的支撑位。👀 目前,价格在该区域附近的走势将是确认卖方是否重新掌控局面的关键。
53
·
--
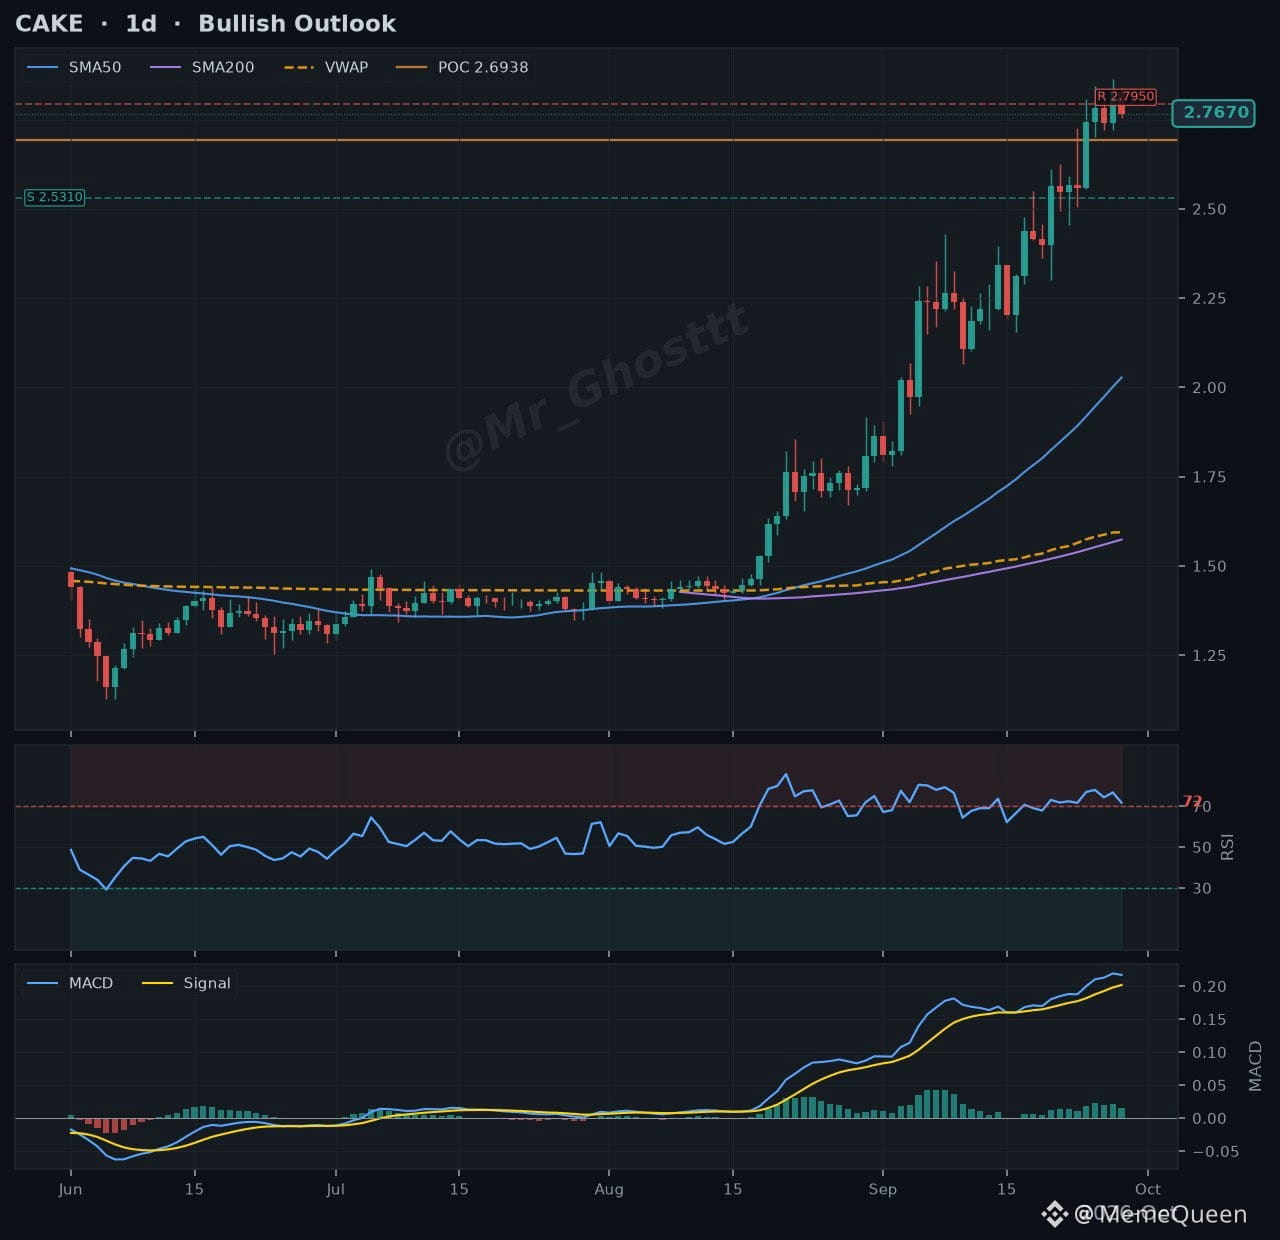
$CAKE 市场情报 | 09-28 🥞🚀(1d蜡烛)| 直播蜡烛完成 14% 市场状态:看涨 设置:延续上升趋势 | 接近阻力 信号:偏多仓位 价格:2.7650(24小时 +1.0%) 解读 这意味着什么:趋势结构偏多。价格在其移动平均线之上,且多条均线呈现同向排列。 ADX(59)很强,表明趋势方向性强。 RSI和随机指标处于超买,表示动能被拉伸。 MACD仍为正。已完成蜡烛的动能在加速,但当前直播蜡烛显示出的动能弱于已确认蜡烛。 价格正在围绕价值区控制点(Point of Control,2.6938)运行——这是可见区间内成交量最高的节点。该水平往往会吸引价格,并导致围绕其震荡。 价格比30日VWAP(2.3052)高出19.9%,因此短期趋势结构仍保持完整。 500日VWAP在2.6222,作为更长期参考;目前价格仍在其之上。 关注:在不受杠杆扭曲影响的前提下,由现货主导的买盘——这种走势往往更可持续。即使动能尚未完全启动,从结构层面来看支撑也更清晰。 价格在2.7950附近接近阻力,仅距离1.1% / 0.2 ATR。留意价格是被阻力拒绝回落,还是在成交量支持下突破并站稳。 如果回落,那么更近的下行水平是500日VWAP(2.6222)以及支撑位2.5310(1.6 ATR)。 30日VWAP(2.3052)仍是关键的短期趋势参考。 已完成蜡烛的MACD动能在加速,但当前蜡烛显示动能更弱。 若直播蜡烛持续走弱,将增加动能恶化的证据;一旦柱状图重新扩张,将削弱这一信号。 风险:偏多仓位 | 62.7%为多头账户;资金费率仍接近中性。 这是市场结构,而不是交易建议。请自行做研究。
$CAKE 市场情报 | 09-28 🥞🚀(1d蜡烛)| 直播蜡烛完成 14% 市场状态:看涨 设置:延续上升趋势 | 接近阻力 信号:偏多仓位 价格:2.7650(24小时 +1.0%) 解读 这意味着什么:趋势结构偏多。价格在其移动平均线之上,且多条均线呈现同向排列。 ADX(59)很强,表明趋势方向性强。 RSI和随机指标处于超买,表示动能被拉伸。 MACD仍为正。已完成蜡烛的动能在加速,但当前直播蜡烛显示出的动能弱于已确认蜡烛。 价格正在围绕价值区控制点(Point of Control,2.6938)运行——这是可见区间内成交量最高的节点。该水平往往会吸引价格,并导致围绕其震荡。 价格比30日VWAP(2.3052)高出19.9%,因此短期趋势结构仍保持完整。 500日VWAP在2.6222,作为更长期参考;目前价格仍在其之上。 关注:在不受杠杆扭曲影响的前提下,由现货主导的买盘——这种走势往往更可持续。即使动能尚未完全启动,从结构层面来看支撑也更清晰。 价格在2.7950附近接近阻力,仅距离1.1% / 0.2 ATR。留意价格是被阻力拒绝回落,还是在成交量支持下突破并站稳。 如果回落,那么更近的下行水平是500日VWAP(2.6222)以及支撑位2.5310(1.6 ATR)。 30日VWAP(2.3052)仍是关键的短期趋势参考。 已完成蜡烛的MACD动能在加速,但当前蜡烛显示动能更弱。 若直播蜡烛持续走弱,将增加动能恶化的证据;一旦柱状图重新扩张,将削弱这一信号。 风险:偏多仓位 | 62.7%为多头账户;资金费率仍接近中性。 这是市场结构,而不是交易建议。请自行做研究。
57
·
--
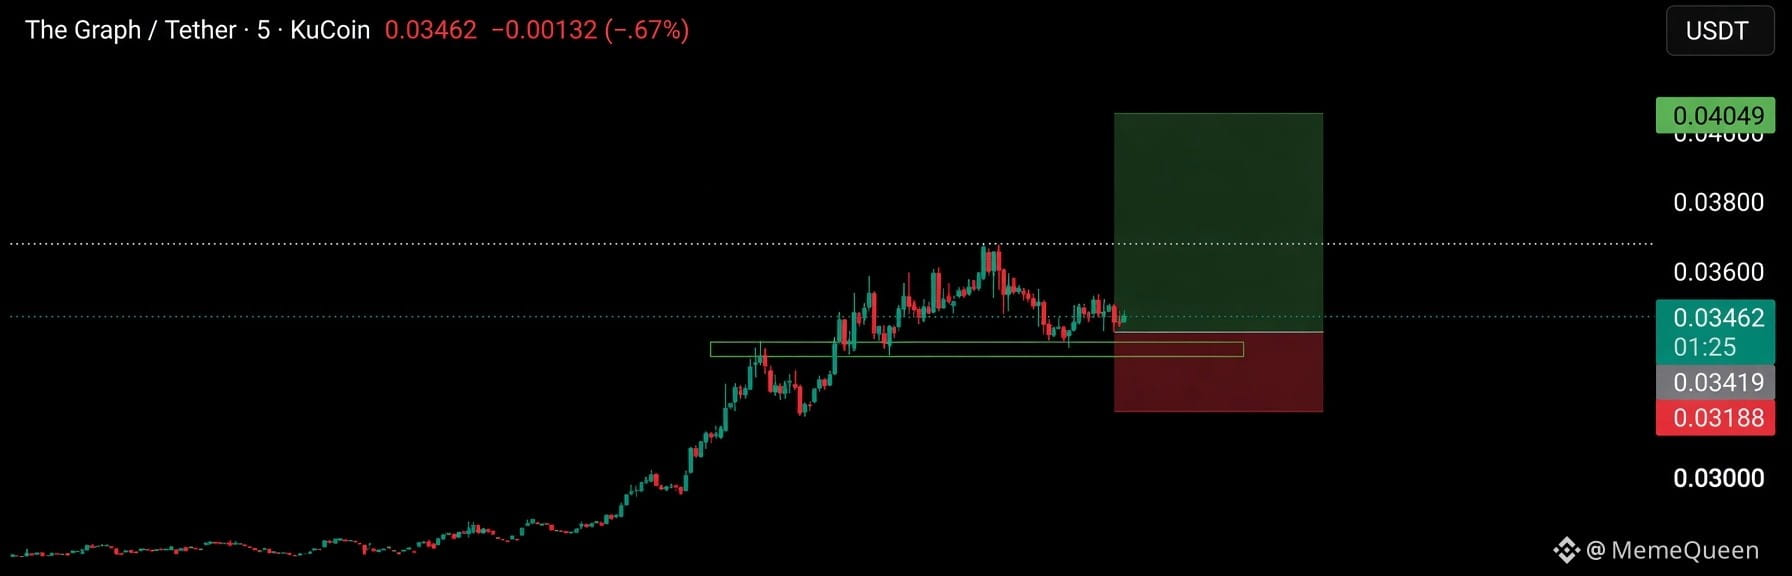
$GRT $GRT/USDT 做多杠杆:25X 入场:0.03440 - 0.033 目标:0.03550 0.03790 0.04250 止损:0.02950 如果入场区间守住,GRT 正在为潜在做多做准备。该设置在明确失效(无效)水平的同时,为多个上行目标提供空间。请谨慎管理风险;若价格远离入场区间,请避免追单。更多交易请看简介 🆓
$GRT $GRT/USDT 做多杠杆:25X 入场:0.03440 - 0.033 目标:0.03550 0.03790 0.04250 止损:0.02950 如果入场区间守住,GRT 正在为潜在做多做准备。该设置在明确失效(无效)水平的同时,为多个上行目标提供空间。请谨慎管理风险;若价格远离入场区间,请避免追单。更多交易请看简介 🆓
60
·
--
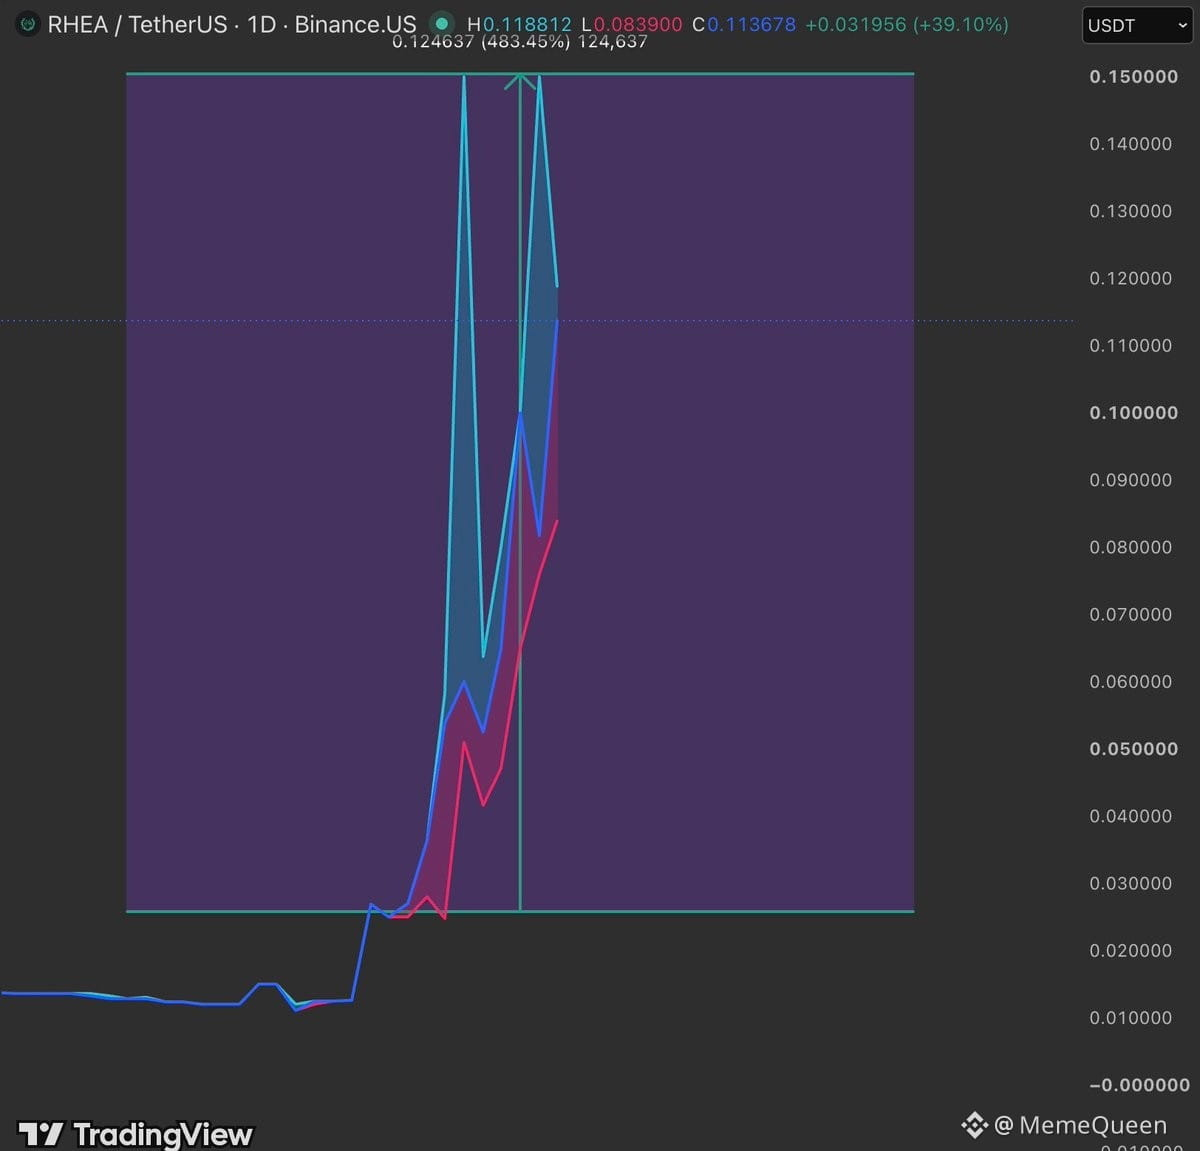
RHEA Finance $RHEA 在过去的一个月内上涨了约1070%。更有趣的是它背后的历史。该相同的 DeFi 协议在4月遭遇重大黑客攻击,导致约1800万美元损失。看到 $RHEA 在经历如此挫折后如此强劲地恢复,确实值得注意。强势反弹说明了人们重新获得了信心、流动性增强以及市场关注度提升。并不是说这种涨势会永远持续,但这次恢复本身值得密切关注。
RHEA Finance $RHEA 在过去的一个月内上涨了约1070%。更有趣的是它背后的历史。该相同的 DeFi 协议在4月遭遇重大黑客攻击,导致约1800万美元损失。看到 $RHEA 在经历如此挫折后如此强劲地恢复,确实值得注意。强势反弹说明了人们重新获得了信心、流动性增强以及市场关注度提升。并不是说这种涨势会永远持续,但这次恢复本身值得密切关注。
63
·
--
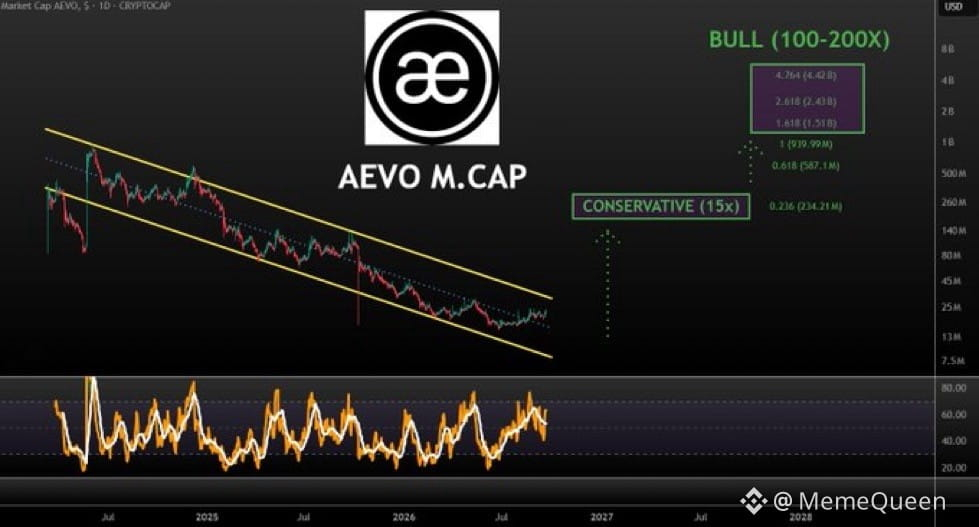
看看 $AEVO 的市值!!!这个专案从这些低点出现至少 15X 的上涨空间应该不难,特别是如果叙事和整体市场开始获得真正的强劲关注。若出现实质扩张,我可以想像 $AEVO 在下一个主要牛市阶段朝向 $2-4B 的市值迈进。🎯 现在看来是低风险/高报酬的布局,恕我直言(imho)。非理财建议!请务必自行研究(DYOR)并依照自己的风险承受度管理风险。
看看 $AEVO 的市值!!!这个专案从这些低点出现至少 15X 的上涨空间应该不难,特别是如果叙事和整体市场开始获得真正的强劲关注。若出现实质扩张,我可以想像 $AEVO 在下一个主要牛市阶段朝向 $2-4B 的市值迈进。🎯 现在看来是低风险/高报酬的布局,恕我直言(imho)。非理财建议!请务必自行研究(DYOR)并依照自己的风险承受度管理风险。
49
·
--
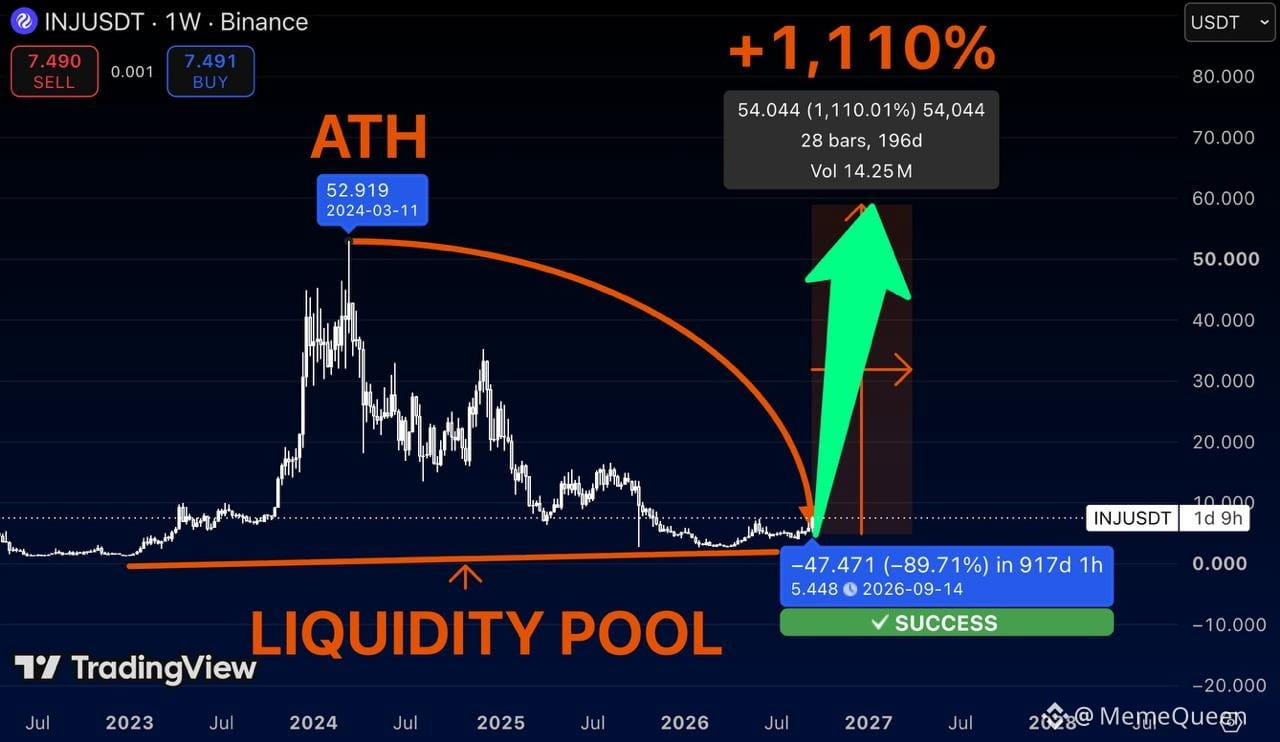
$INJ 跌幅几乎达到了相对于 ATH 的 90%。而且奇怪的是,这里正是人们开始失去兴趣的地方。 在 50 美元时,每个人都想要它。到 7.49 美元?一片沉默。 但把视角拉远:$INJ 已经回到了与 2023–2024 年间整轮扩张之前存在的同一段长期流动性区域。 这部分才是我在意的。 ATH 大约在 52.9 美元附近。从这个区域映射出来的涨幅大约是 +1,110%,这会把价格推向 60 美元附近。 会不会直线发生?当然不会。但这就是每一轮循环的讽刺: 人们在拉升时祈求更低的价格。 然后更低的价格真的到来……而没有人愿意碰它们。
$INJ 跌幅几乎达到了相对于 ATH 的 90%。而且奇怪的是,这里正是人们开始失去兴趣的地方。 在 50 美元时,每个人都想要它。到 7.49 美元?一片沉默。 但把视角拉远:$INJ 已经回到了与 2023–2024 年间整轮扩张之前存在的同一段长期流动性区域。 这部分才是我在意的。 ATH 大约在 52.9 美元附近。从这个区域映射出来的涨幅大约是 +1,110%,这会把价格推向 60 美元附近。 会不会直线发生?当然不会。但这就是每一轮循环的讽刺: 人们在拉升时祈求更低的价格。 然后更低的价格真的到来……而没有人愿意碰它们。
66
·
--
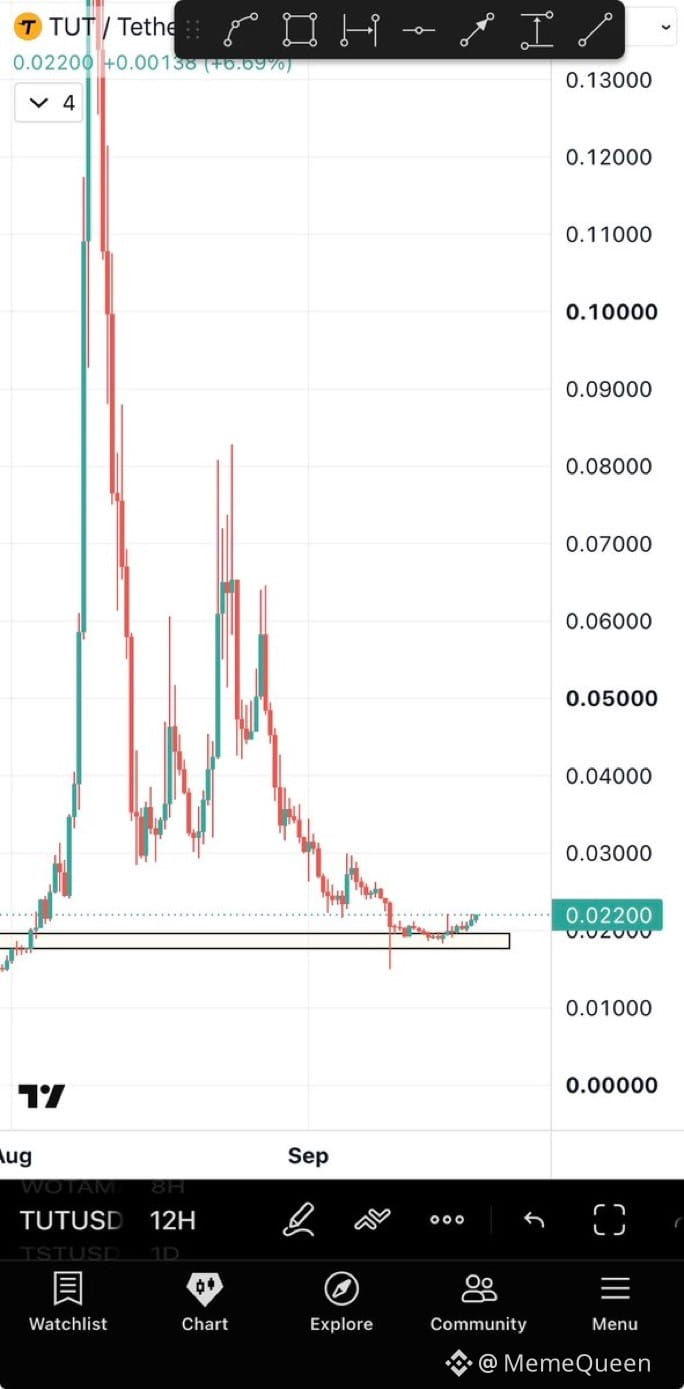
$TUT 这是我一直在密切关注的最看涨、并且随时可能爆发的图表之一。这个结构看起来非常干净,而且这个设置让我有足够的空间保持耐心,等图表逐步发展。我在这里至少看到了50%的上涨空间,如果动能和市场条件继续支持这次走势,甚至还有机会推得更高。只要从正确的入场点出发,轻松就能看到触及100%+,甚至200%。这真的是我目前雷达上最干净的图表之一。
$TUT 这是我一直在密切关注的最看涨、并且随时可能爆发的图表之一。这个结构看起来非常干净,而且这个设置让我有足够的空间保持耐心,等图表逐步发展。我在这里至少看到了50%的上涨空间,如果动能和市场条件继续支持这次走势,甚至还有机会推得更高。只要从正确的入场点出发,轻松就能看到触及100%+,甚至200%。这真的是我目前雷达上最干净的图表之一。
66
登录解锁更多内容
加入币安广场,与全球加密货币用户互动
⚡️ 获取关于加密货币的最新实用信息。
💬 受到全球最大加密货币交易平台的信赖。
👍 发现来自认证创作者的真知灼见。
邮箱/手机号码