
CryptoTraders.com
578 个内容

CryptoTraders.com
举报
屏蔽用户
Home of Top Analysts, Elite Trade Alerts, Cutting-Edge Algorithms, and Powerful Scanners — all built to give you the edge in any market. Join & Activate your 14-day free trial now to see the results yourself!
0 关注
4 粉丝
5 点赞
帖子
查看翻译
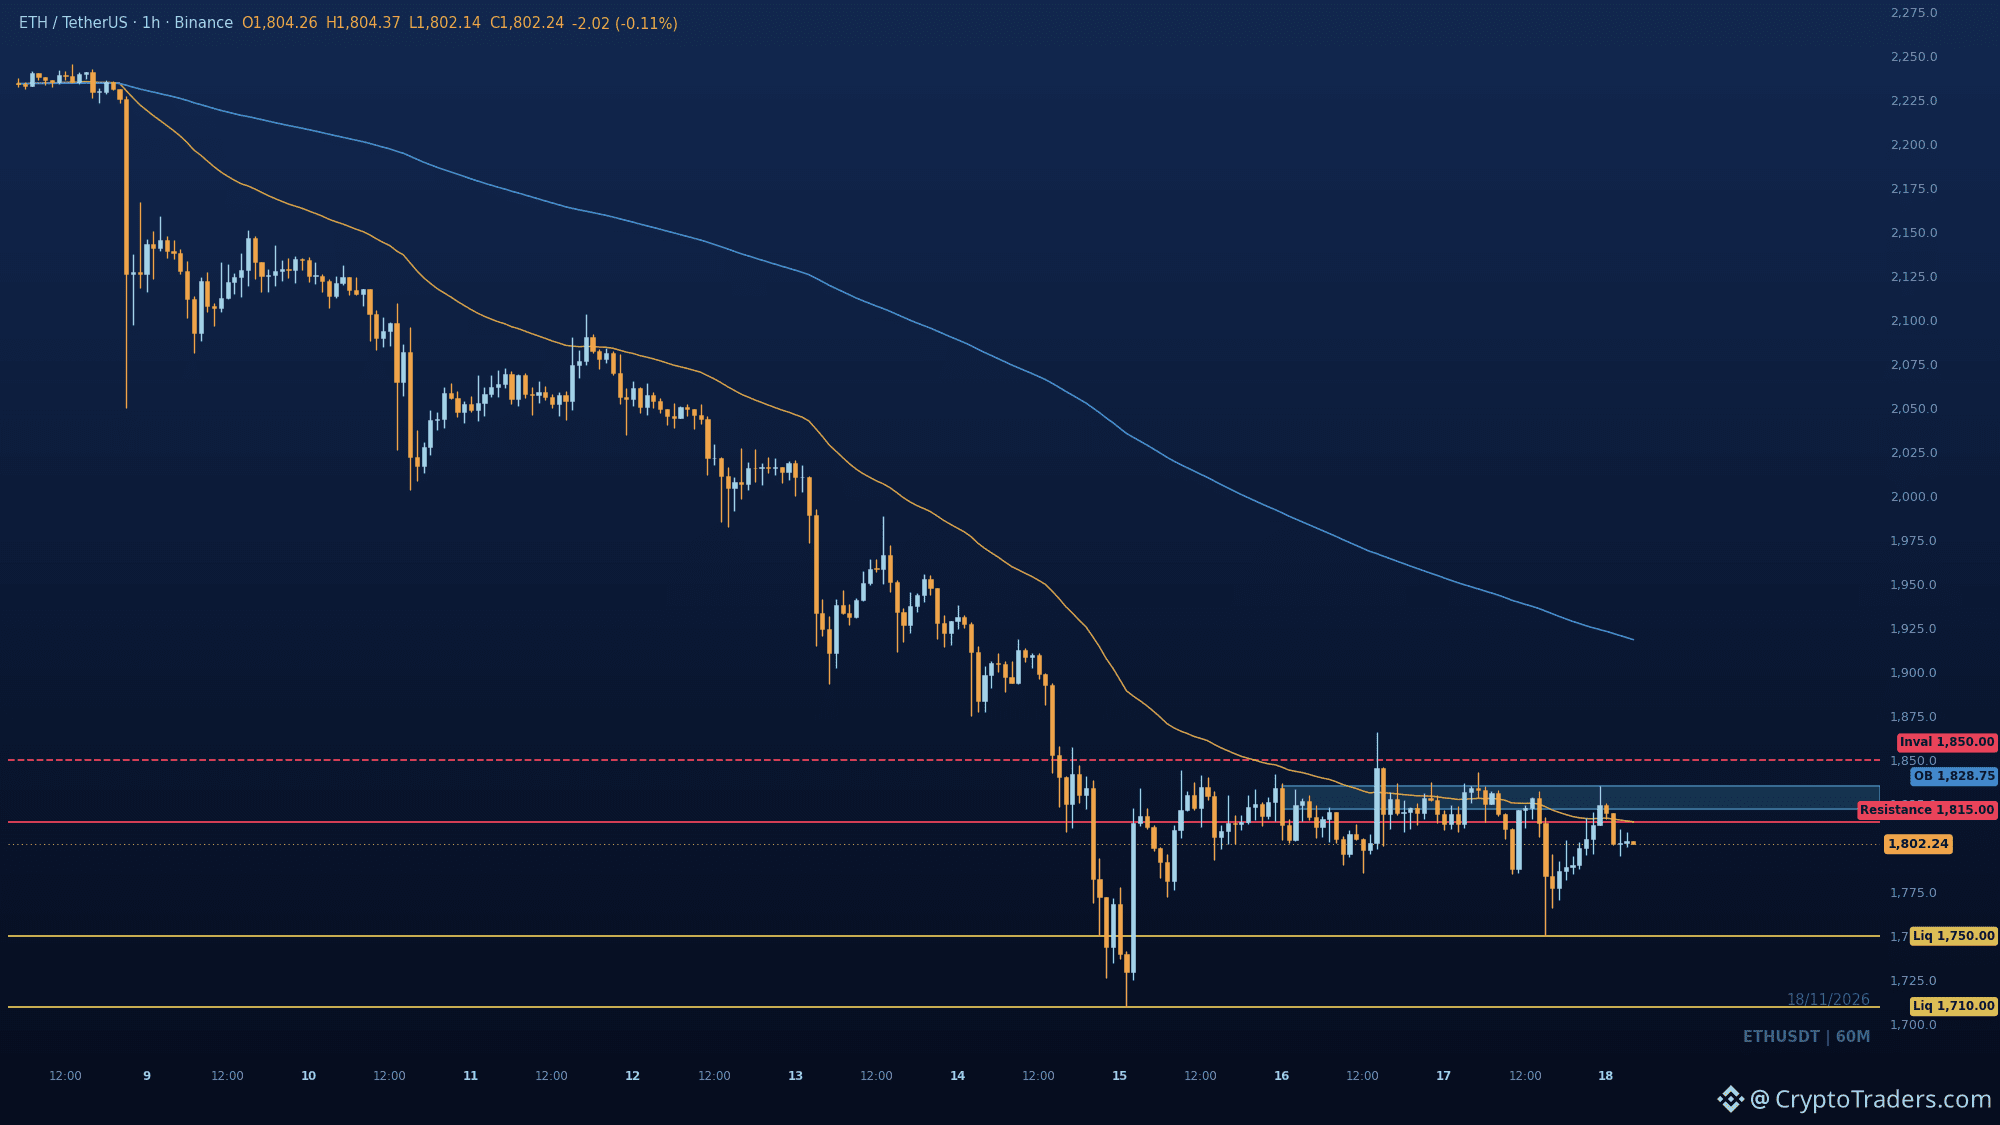
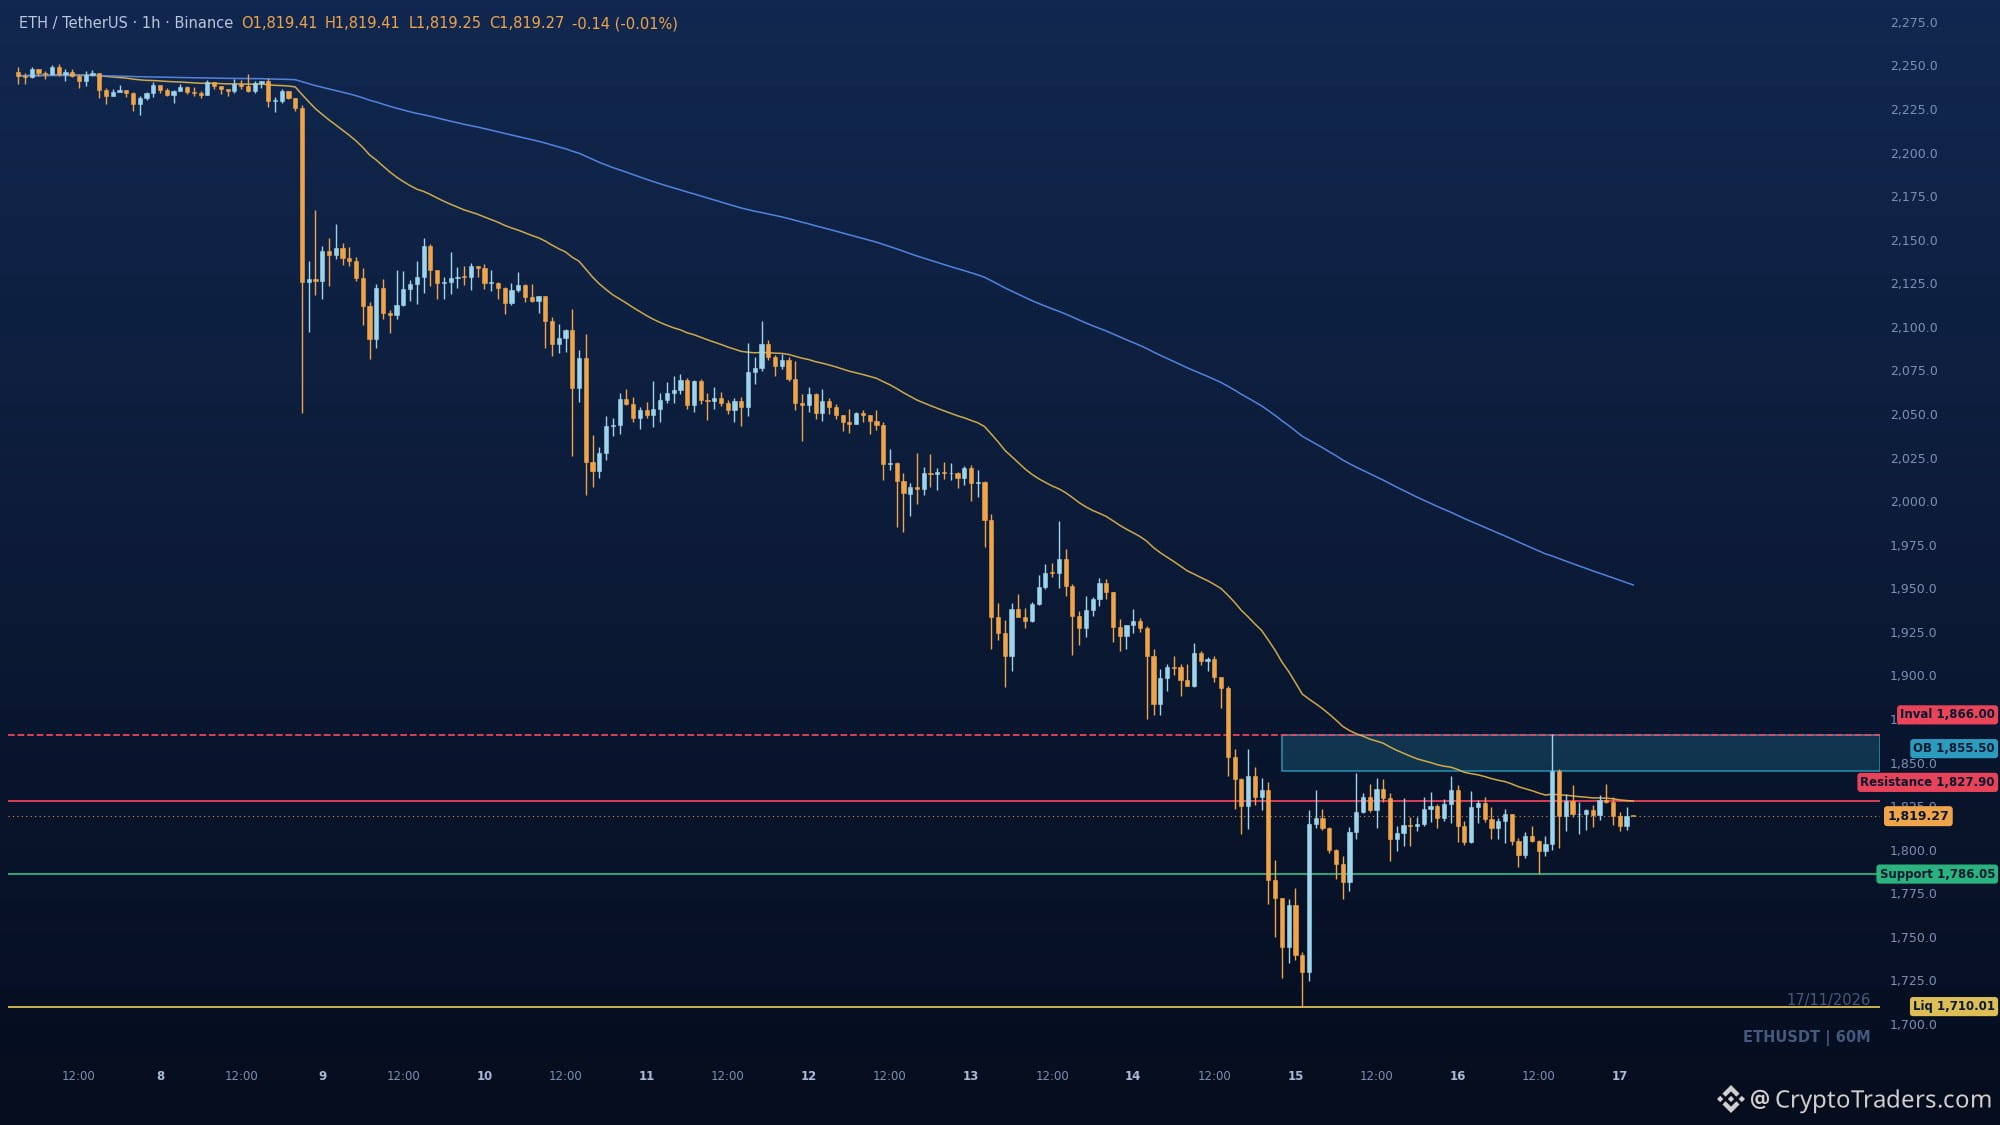
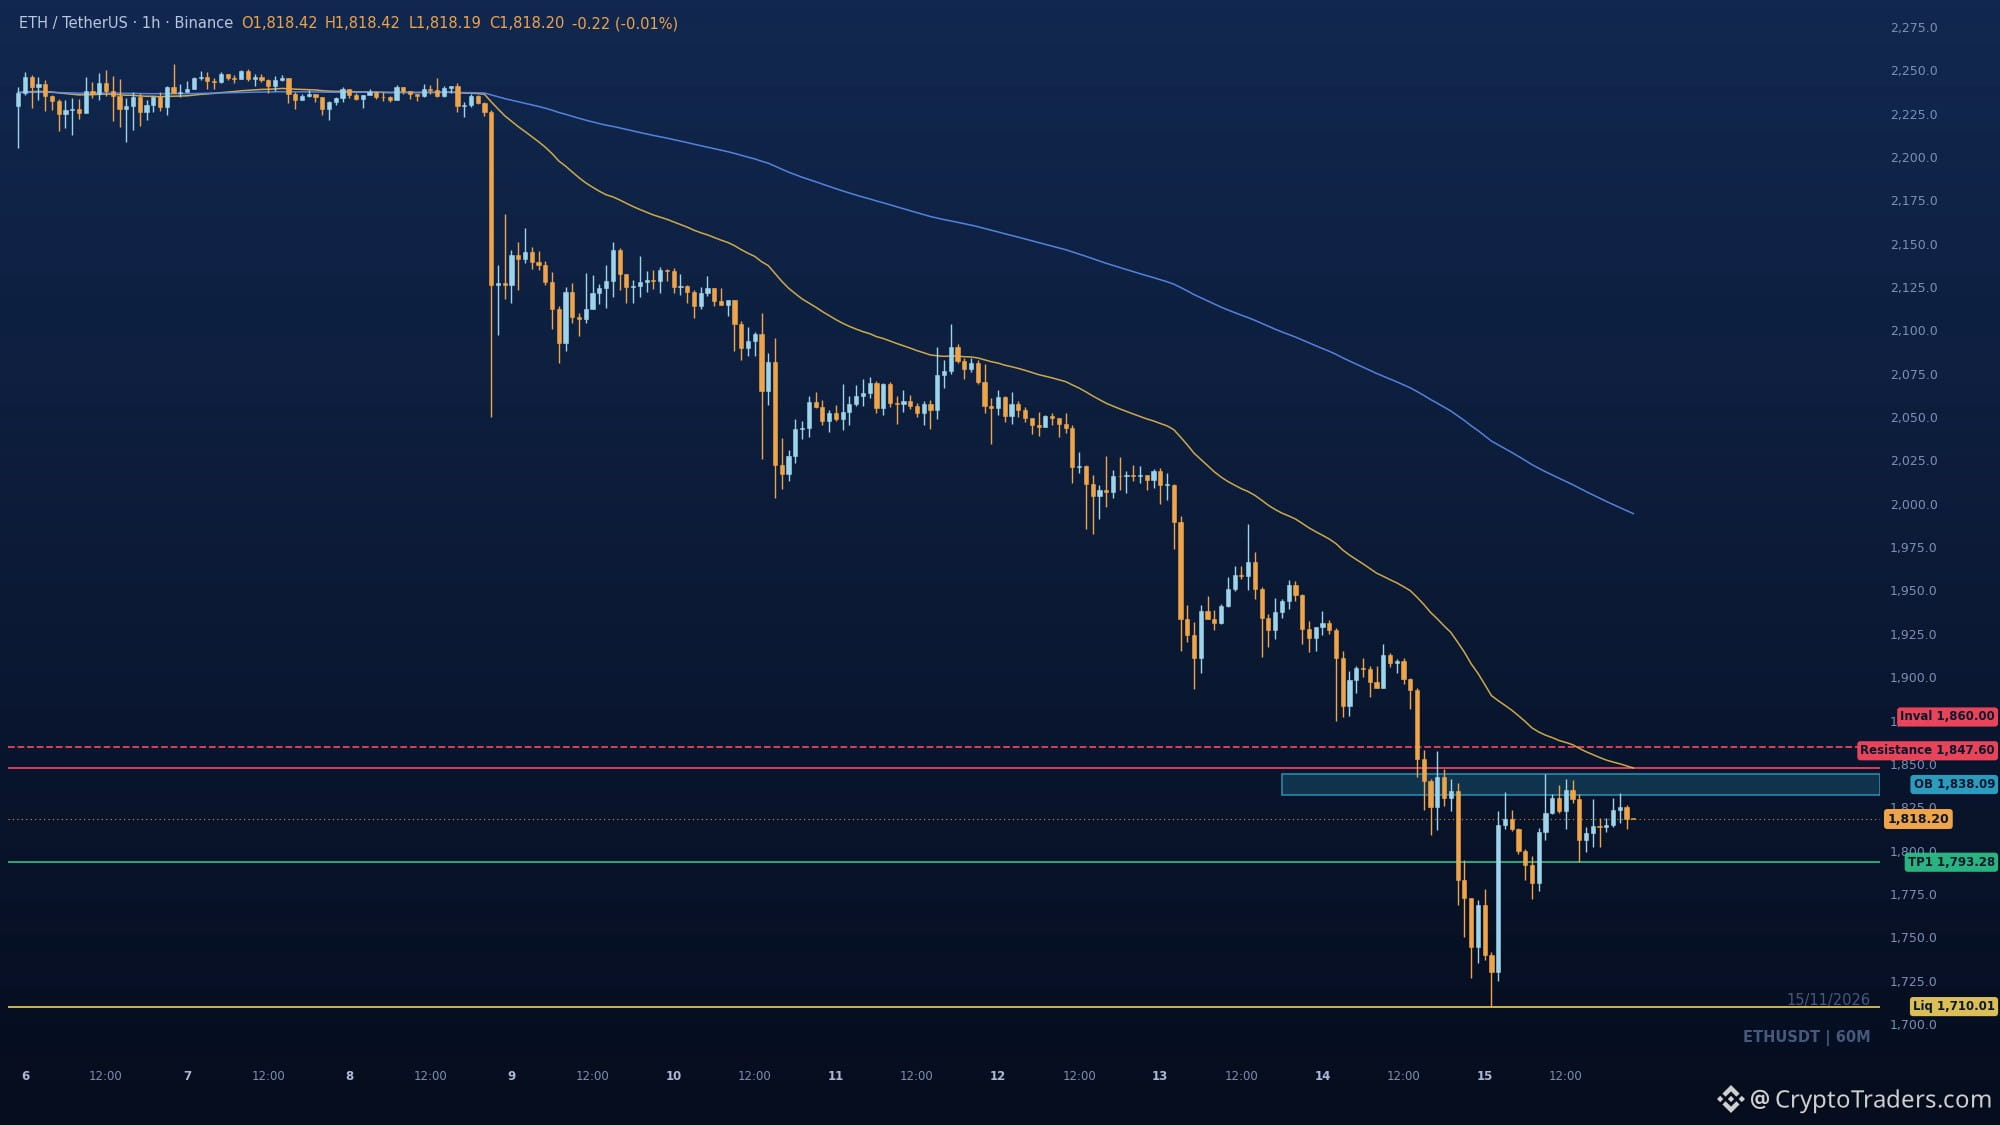
1,815. That is the number $ETH has already failed at twice this window, and it is where the 50 EMA sits right now. The chart shows stair-step distribution from 2,245 down to a 1,710 sweep, and the bounce since has been corrective at best. Every push into 1,815-1,835 has met offers, with the bearish order block at 1,822-1,835.5 marking the last up candle before each drop. Below, 1,750 sell-side is the obvious draw, with 1,710 the deeper window low. A close above 1,850 flips this read. Until then the base looks like reloading, not reversing. How many times do you let 1,815 reject before you stop trusting the bounce? More charts like this land in the group daily, my bio has the way in. #Altcoin Season#
1,815. That is the number $ETH has already failed at twice this window, and it is where the 50 EMA sits right now. The chart shows stair-step distribution from 2,245 down to a 1,710 sweep, and the bounce since has been corrective at best. Every push into 1,815-1,835 has met offers, with the bearish order block at 1,822-1,835.5 marking the last up candle before each drop. Below, 1,750 sell-side is the obvious draw, with 1,710 the deeper window low. A close above 1,850 flips this read. Until then the base looks like reloading, not reversing. How many times do you let 1,815 reject before you stop trusting the bounce? More charts like this land in the group daily, my bio has the way in. #Altcoin Season#
46
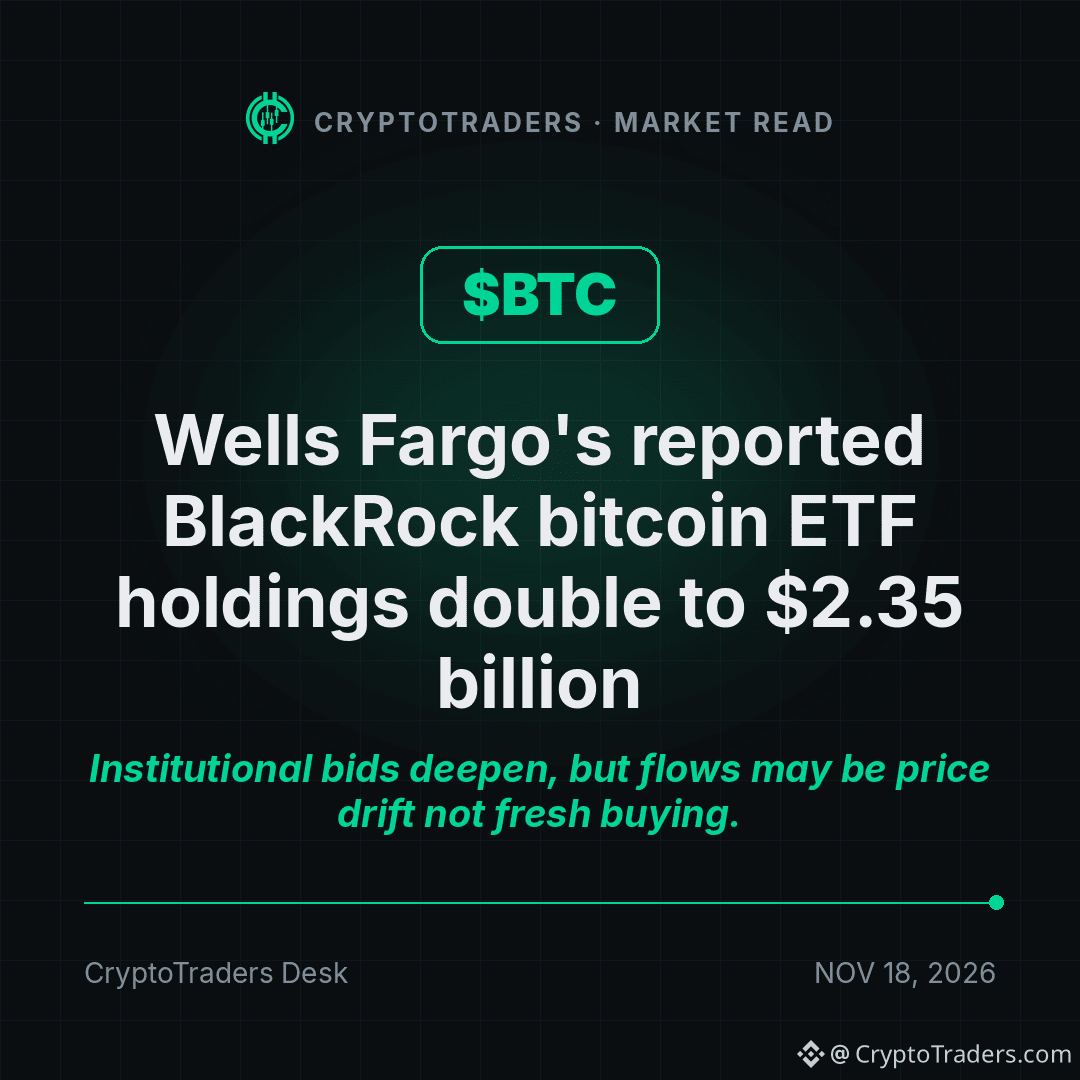
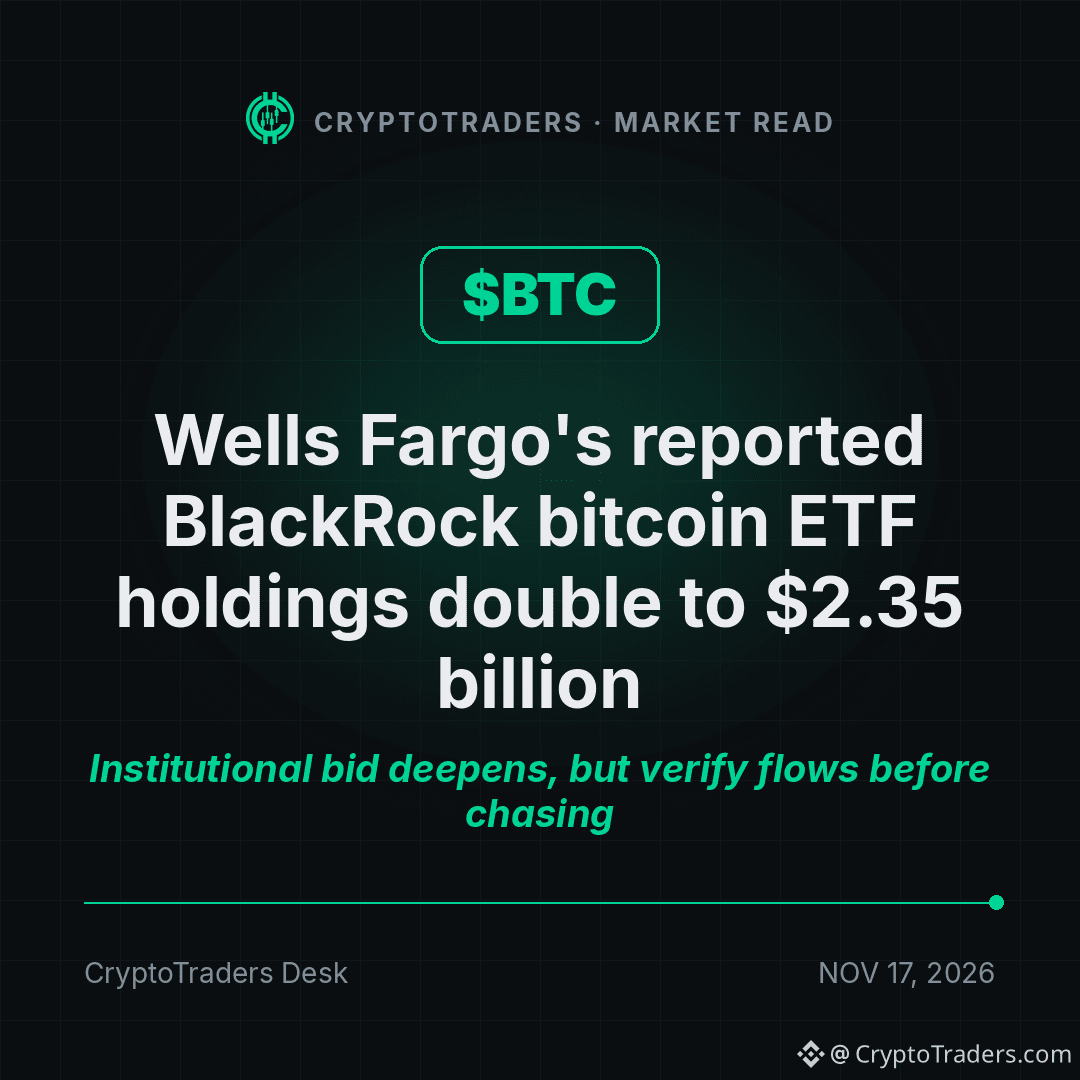
富国银行披露持有的贝莱德比特币 ETF 仓位翻倍至 23.5 亿美元,$BTC 持有者正密切关注 🏦 要点:▪ CoinDesk 报道称,富国银行持有的贝莱德比特币 ETF 仓位翻倍至 23.5 亿美元 ▪ 目前只有标题级别的报道;无法获取原文 ▪ 报告期,以及仓位变化究竟源于买入还是估值变动,均未得到核实 ▪ 持仓披露本质上反映的是过去的情况 我的看法 🟢 一家大型银行披露的 ETF 仓位大致翻倍,可以看作机构采用加密资产的又一块基石。 🔴 披露存在滞后,而且仓位翻倍既可能是价格上涨所致,也可能是新买入所致。 🟡 在核查申报文件和下一轮 ETF 资金流数据之前,新增需求的规模尚不明确。 你认为银行的 13F 类披露是真正的需求信号,还是滞后的文书记录? 这类内容几乎天天都会出现在群里,欢迎到个人简介查看更多。 #BTC 价格分析# #比特币价格预测:比特币下一步会怎么走?# #宏观洞察#
富国银行披露持有的贝莱德比特币 ETF 仓位翻倍至 23.5 亿美元,$BTC 持有者正密切关注 🏦 要点:▪ CoinDesk 报道称,富国银行持有的贝莱德比特币 ETF 仓位翻倍至 23.5 亿美元 ▪ 目前只有标题级别的报道;无法获取原文 ▪ 报告期,以及仓位变化究竟源于买入还是估值变动,均未得到核实 ▪ 持仓披露本质上反映的是过去的情况 我的看法 🟢 一家大型银行披露的 ETF 仓位大致翻倍,可以看作机构采用加密资产的又一块基石。 🔴 披露存在滞后,而且仓位翻倍既可能是价格上涨所致,也可能是新买入所致。 🟡 在核查申报文件和下一轮 ETF 资金流数据之前,新增需求的规模尚不明确。 你认为银行的 13F 类披露是真正的需求信号,还是滞后的文书记录? 这类内容几乎天天都会出现在群里,欢迎到个人简介查看更多。 #BTC 价格分析# #比特币价格预测:比特币下一步会怎么走?# #宏观洞察#
70
查看翻译
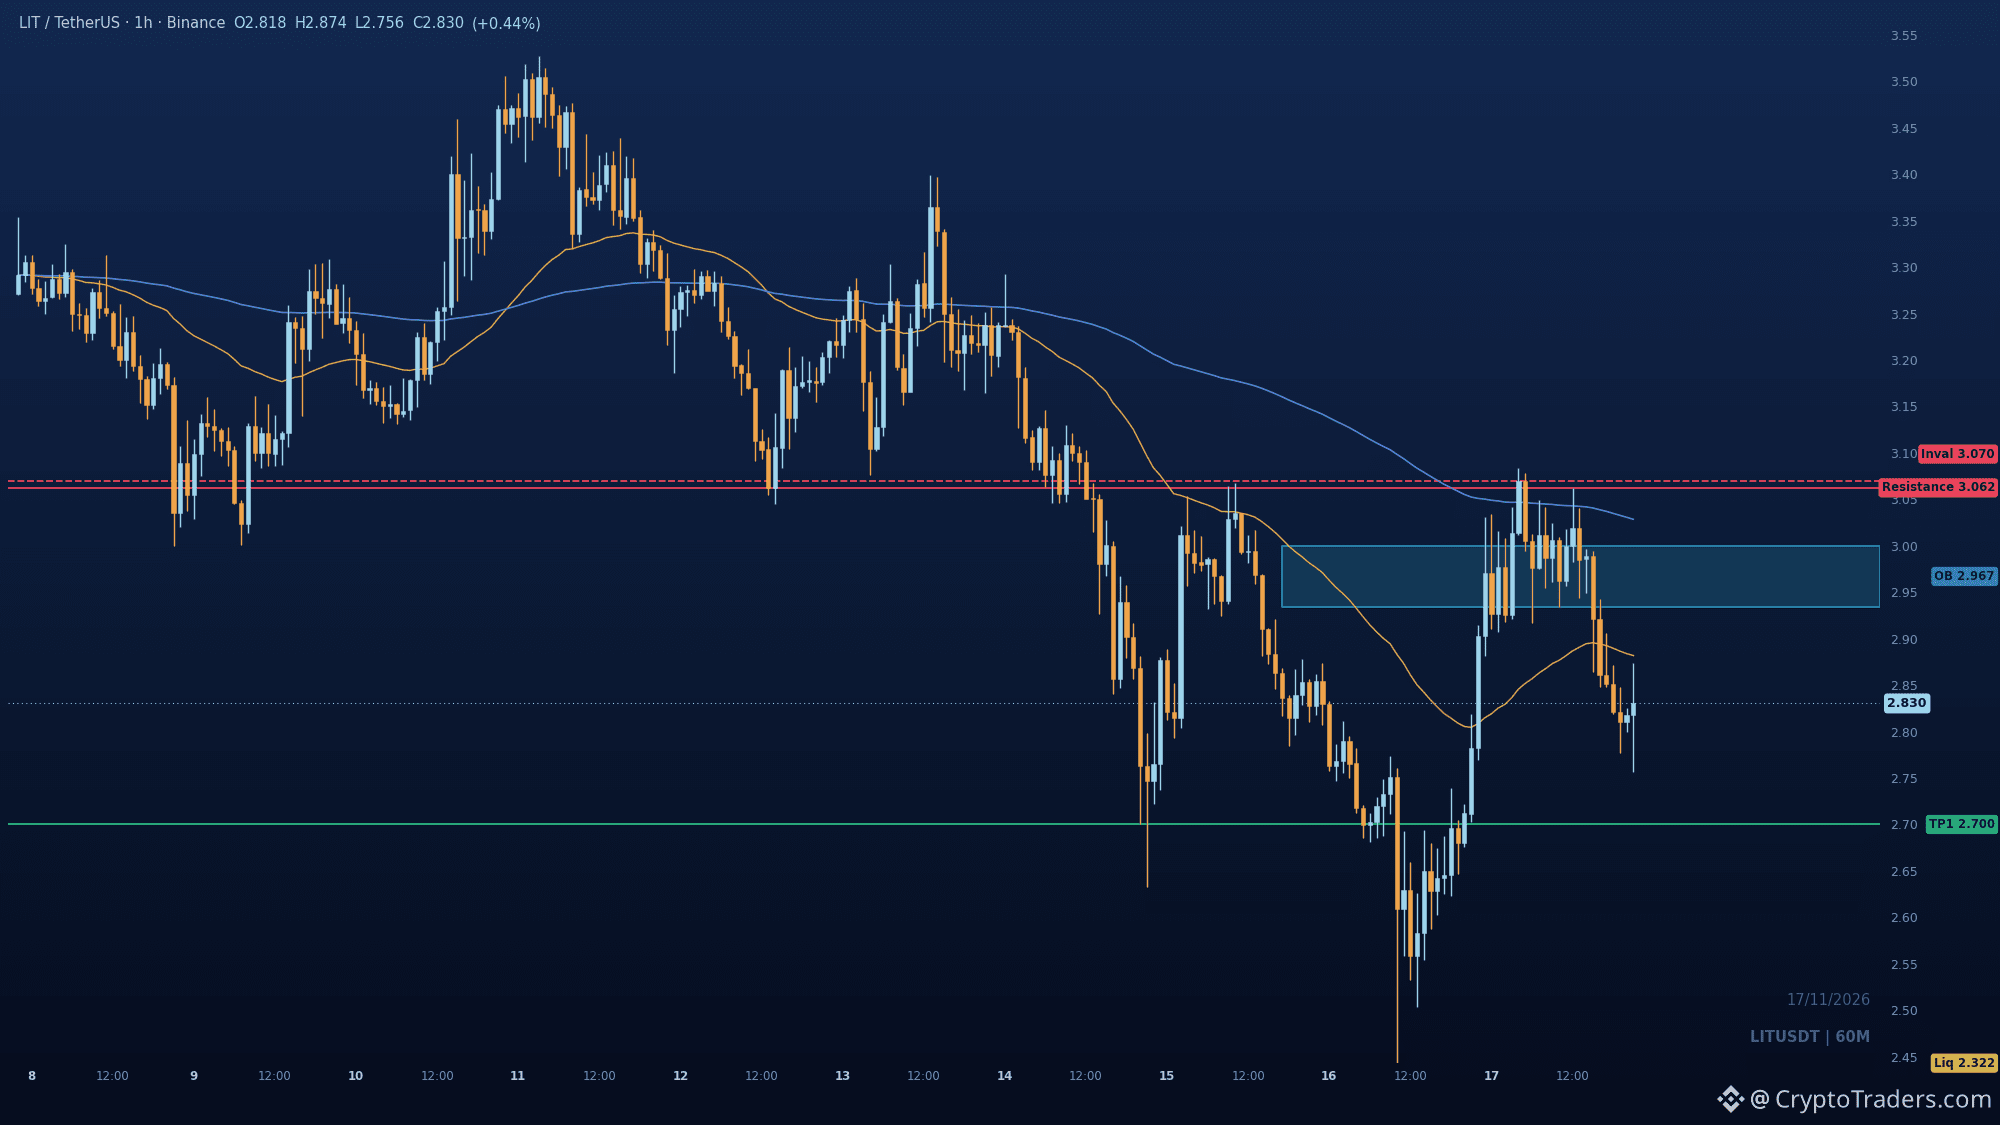
Lighter's 10.39 million USDC exploit is the week's real damage report, and $LIT holders are the ones who feel the aftershock 🧨 1⃣ **Withdrawals are back, the loss is not settled** Withdrawals and pool creation resumed after an attacker moved 10.39 million USDC through leaked trader API keys and unofficial signing code. Roughly 5 million was returned, leaving the final loss unresolved. 2⃣ **Buybacks sit downstream of fees** LIT buybacks are funded by trading fees, so any prolonged disruption to volume or confidence hits the bid directly. The price is up 5.2 percent to 0.743, which reads as relief rather than repair. 3⃣ **Institutional demand is thinning elsewhere** Strategy spent only 33.4 million on 485 BTC for November 9 to 15 while putting 206.3 million into STRC buybacks, a 59 percent weekly drop in BTC purchases. Bitmine added 7,653 ETH versus 9,587 prior and holds 6,077,745 ETH, with only about 32,255 ETH left to its stated 5 percent target. The exploit is contained, the fee engine behind LIT is what needs watching now. Do you treat a resumed withdrawal queue as a clean bill of health? Plenty more breakdowns like this land in the group each day, so swing by the bio for the rest. #Altcoin Season# #Macro Insights#
Lighter's 10.39 million USDC exploit is the week's real damage report, and $LIT holders are the ones who feel the aftershock 🧨 1⃣ **Withdrawals are back, the loss is not settled** Withdrawals and pool creation resumed after an attacker moved 10.39 million USDC through leaked trader API keys and unofficial signing code. Roughly 5 million was returned, leaving the final loss unresolved. 2⃣ **Buybacks sit downstream of fees** LIT buybacks are funded by trading fees, so any prolonged disruption to volume or confidence hits the bid directly. The price is up 5.2 percent to 0.743, which reads as relief rather than repair. 3⃣ **Institutional demand is thinning elsewhere** Strategy spent only 33.4 million on 485 BTC for November 9 to 15 while putting 206.3 million into STRC buybacks, a 59 percent weekly drop in BTC purchases. Bitmine added 7,653 ETH versus 9,587 prior and holds 6,077,745 ETH, with only about 32,255 ETH left to its stated 5 percent target. The exploit is contained, the fee engine behind LIT is what needs watching now. Do you treat a resumed withdrawal queue as a clean bill of health? Plenty more breakdowns like this land in the group each day, so swing by the bio for the rest. #Altcoin Season# #Macro Insights#
查看翻译
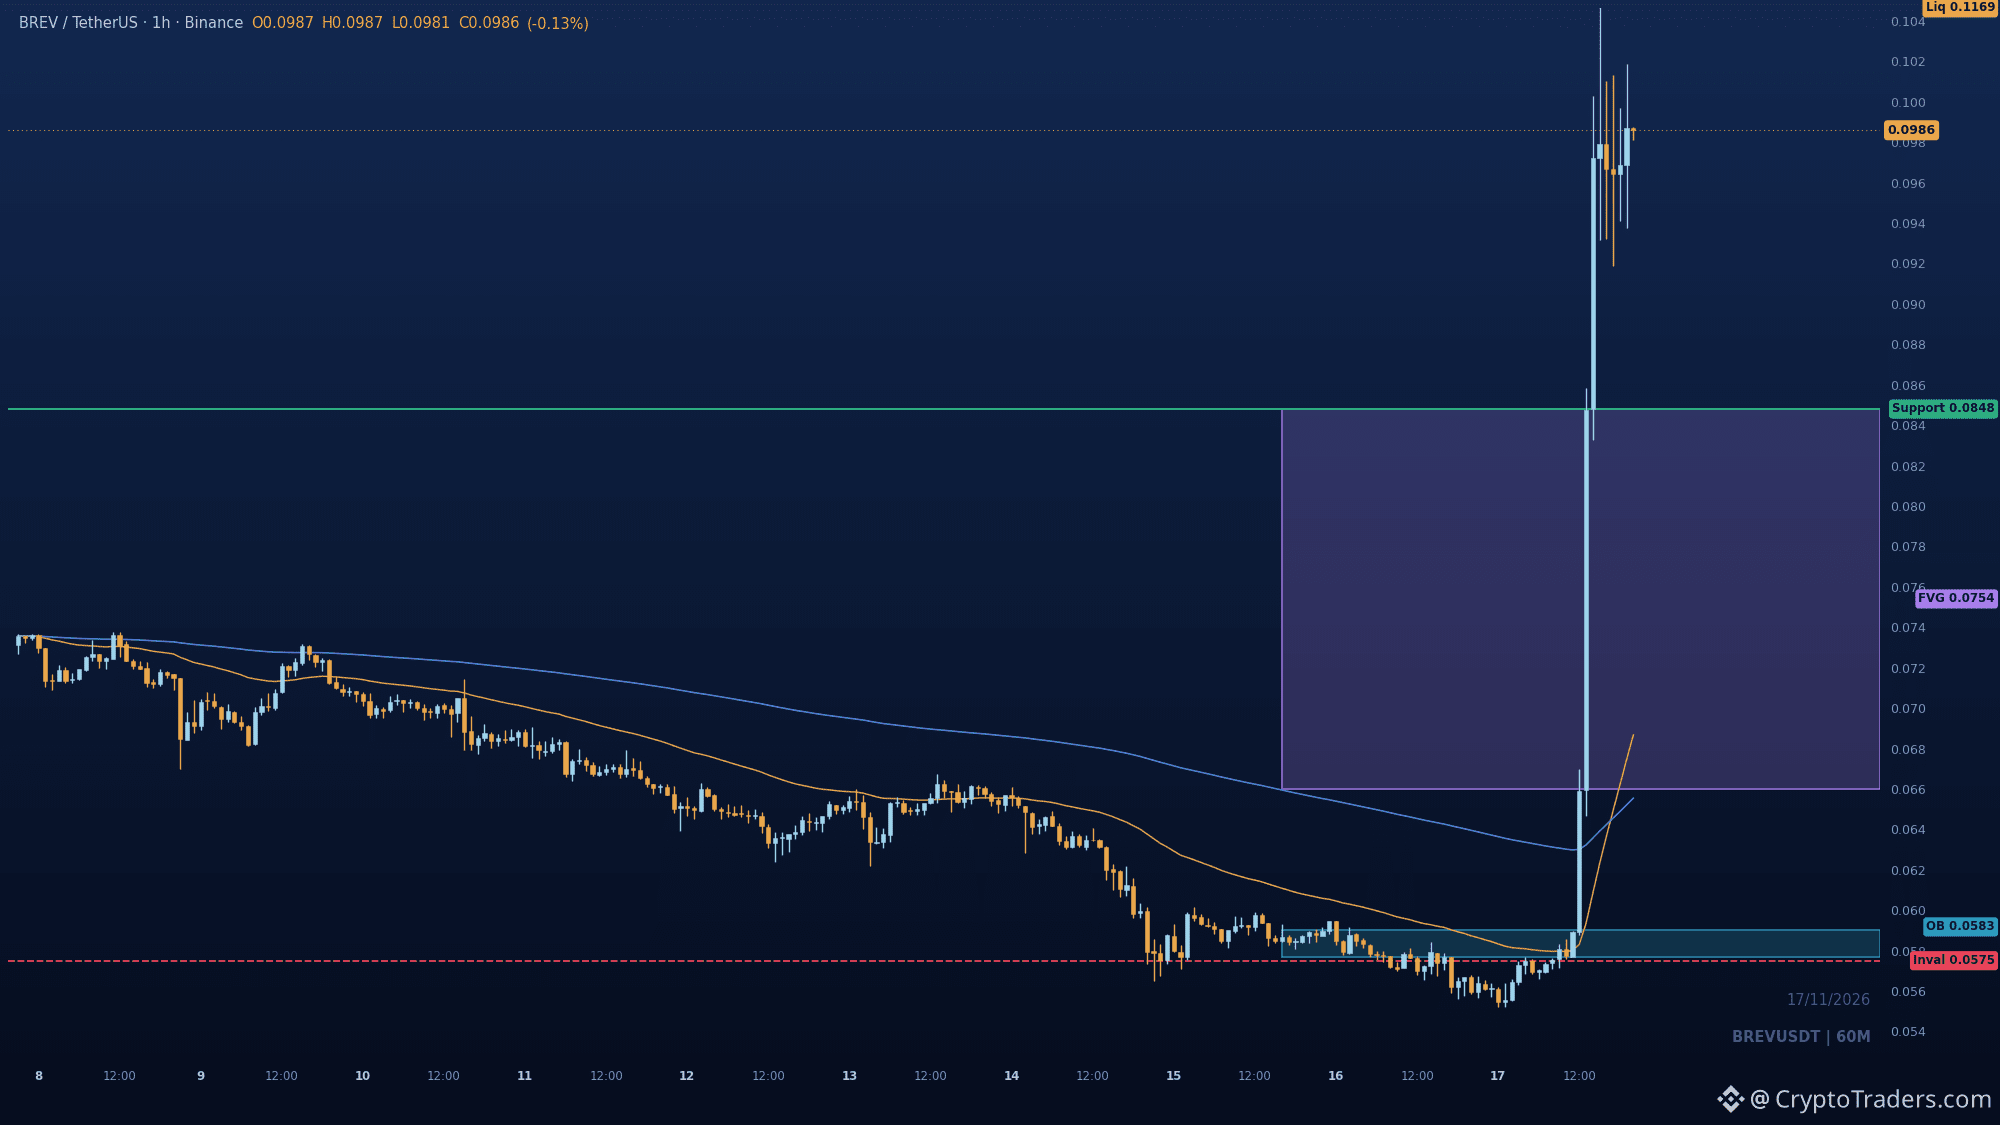
$BREV ran 79% into 0.11688 and got turned away, now sitting at 0.0986 above both EMAs while the real decision waits below. The spike left a long upper wick, and the 0.066-0.0848 imbalance under it is still unfilled. 0.0848 is the shelf to watch: hold it and the 0.11688 high comes back into play. Lose it and the 0.0660-0.0700 zone is the next place bids should show up. Below 0.0575 the whole impulse read is dead. Does this consolidate into a base here or does it need the deeper fill first? More chart reads like this land daily in the group, bio has the way in. #Altcoin Season#
$BREV ran 79% into 0.11688 and got turned away, now sitting at 0.0986 above both EMAs while the real decision waits below. The spike left a long upper wick, and the 0.066-0.0848 imbalance under it is still unfilled. 0.0848 is the shelf to watch: hold it and the 0.11688 high comes back into play. Lose it and the 0.0660-0.0700 zone is the next place bids should show up. Below 0.0575 the whole impulse read is dead. Does this consolidate into a base here or does it need the deeper fill first? More chart reads like this land daily in the group, bio has the way in. #Altcoin Season#
28
富国银行披露的贝莱德比特币 ETF 持仓翻倍至 23.5 亿美元,这是机构对 $BTC 的低调认可 📈 要点:▪ CoinDesk 报道称,富国银行持有的贝莱德比特币 ETF 份额翻倍至 23.5 亿美元 ▪ 该数据所对应的申报期尚未核实,因为无法获取原始报道 ▪ 这次增持反映的是新买入还是估值上涨,也尚未确认 ▪ BTC 目前在 64,128 美元附近交易,过去 24 小时下跌 0.7% 我的看法 🟢 一家美国大型银行披露的 ETF 敞口大致翻倍,这类采用动态正是机构投资论点的有力支撑。 🔴 持仓披露反映的是过去的情况,持仓翻倍既可能来自价格上涨,也可能来自新增买入。 🟡 在缺少申报日期或资金流数据的情况下,这条消息值得关注,但还不足以作为趋势进行定价。 你认为银行类似 13F 的披露是真实需求信号,还是滞后的快照? 这类内容每天都会发到群里,我的个人简介里有获取方式。 #BTC价格分析# #比特币价格预测:比特币下一步走势如何?# #宏观洞察#
富国银行披露的贝莱德比特币 ETF 持仓翻倍至 23.5 亿美元,这是机构对 $BTC 的低调认可 📈 要点:▪ CoinDesk 报道称,富国银行持有的贝莱德比特币 ETF 份额翻倍至 23.5 亿美元 ▪ 该数据所对应的申报期尚未核实,因为无法获取原始报道 ▪ 这次增持反映的是新买入还是估值上涨,也尚未确认 ▪ BTC 目前在 64,128 美元附近交易,过去 24 小时下跌 0.7% 我的看法 🟢 一家美国大型银行披露的 ETF 敞口大致翻倍,这类采用动态正是机构投资论点的有力支撑。 🔴 持仓披露反映的是过去的情况,持仓翻倍既可能来自价格上涨,也可能来自新增买入。 🟡 在缺少申报日期或资金流数据的情况下,这条消息值得关注,但还不足以作为趋势进行定价。 你认为银行类似 13F 的披露是真实需求信号,还是滞后的快照? 这类内容每天都会发到群里,我的个人简介里有获取方式。 #BTC价格分析# #比特币价格预测:比特币下一步走势如何?# #宏观洞察#
BTC-0.32%
BLKUS+0.32%
42
查看翻译
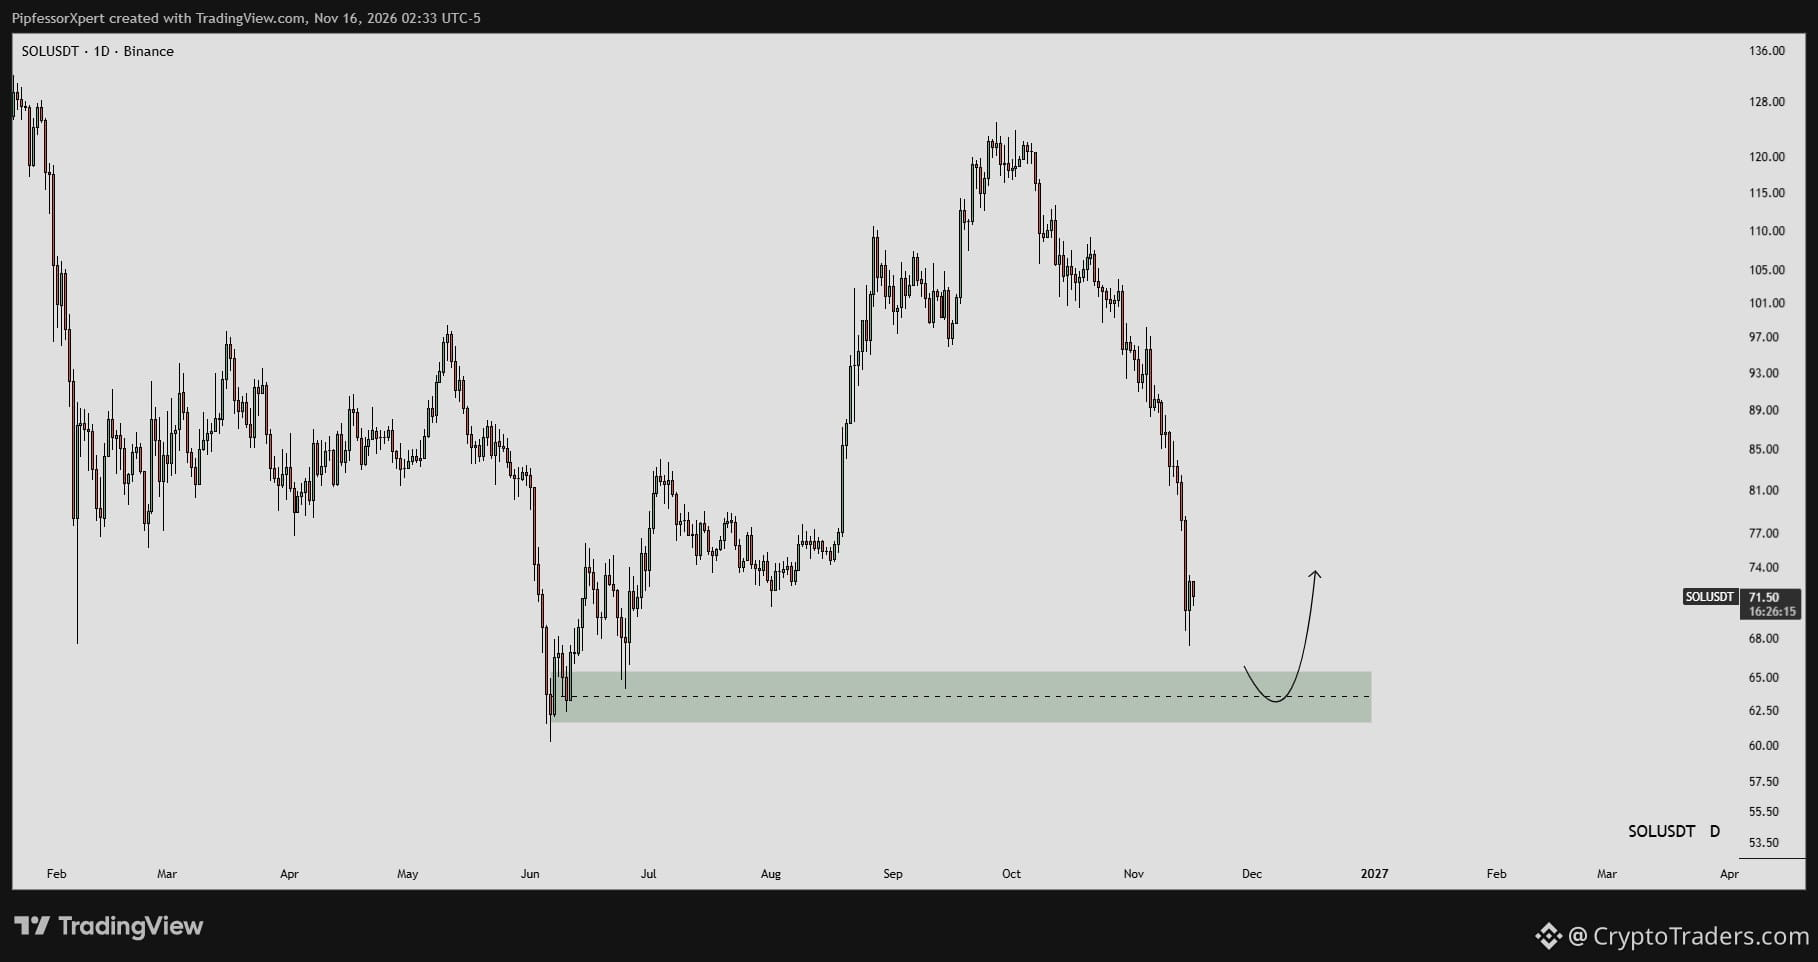
$SOL just bounced off the 62.5-65 demand zone after a sharp selloff, and now it has to prove this is more than a dead-cat hop. The zone held on the first test, which is the cleanest sign on this daily chart. 72.68 is where price sits now, so the recovery is already underway but not confirmed. A daily close back above the recent breakdown area would validate the bounce; losing 62.5 flips the whole read. Do you think this demand zone holds on a second retest, or does price come back for it? More chart reads land here every day, my bio has the details. #Altcoin Season#
$SOL just bounced off the 62.5-65 demand zone after a sharp selloff, and now it has to prove this is more than a dead-cat hop. The zone held on the first test, which is the cleanest sign on this daily chart. 72.68 is where price sits now, so the recovery is already underway but not confirmed. A daily close back above the recent breakdown area would validate the bounce; losing 62.5 flips the whole read. Do you think this demand zone holds on a second retest, or does price come back for it? More chart reads land here every day, my bio has the details. #Altcoin Season#
查看翻译
$ETH has to pick a side: the 1827.9-1837.8 supply overhead or the 1786 swing low beneath it, and the 50 EMA sits right in the middle of that standoff. The chart shows distribution from 2250 with a sequence of lower BOS, then a sweep of 1710 and a bounce that has gone nowhere. A failure here looks like a wick into the 50 EMA, a rejection candle, then a break of 1786 that turns that level into the next sell-side pool. Above it, the 1845-1866 order block is the last up candle before the drop, and a close over 1866 breaks the bearish read entirely. Where do you think the 1786 low gets swept first, this week or next? More reads like this land daily in the group, bio has the way in. #Altcoin Season#
$ETH has to pick a side: the 1827.9-1837.8 supply overhead or the 1786 swing low beneath it, and the 50 EMA sits right in the middle of that standoff. The chart shows distribution from 2250 with a sequence of lower BOS, then a sweep of 1710 and a bounce that has gone nowhere. A failure here looks like a wick into the 50 EMA, a rejection candle, then a break of 1786 that turns that level into the next sell-side pool. Above it, the 1845-1866 order block is the last up candle before the drop, and a close over 1866 breaks the bearish read entirely. Where do you think the 1786 low gets swept first, this week or next? More reads like this land daily in the group, bio has the way in. #Altcoin Season#
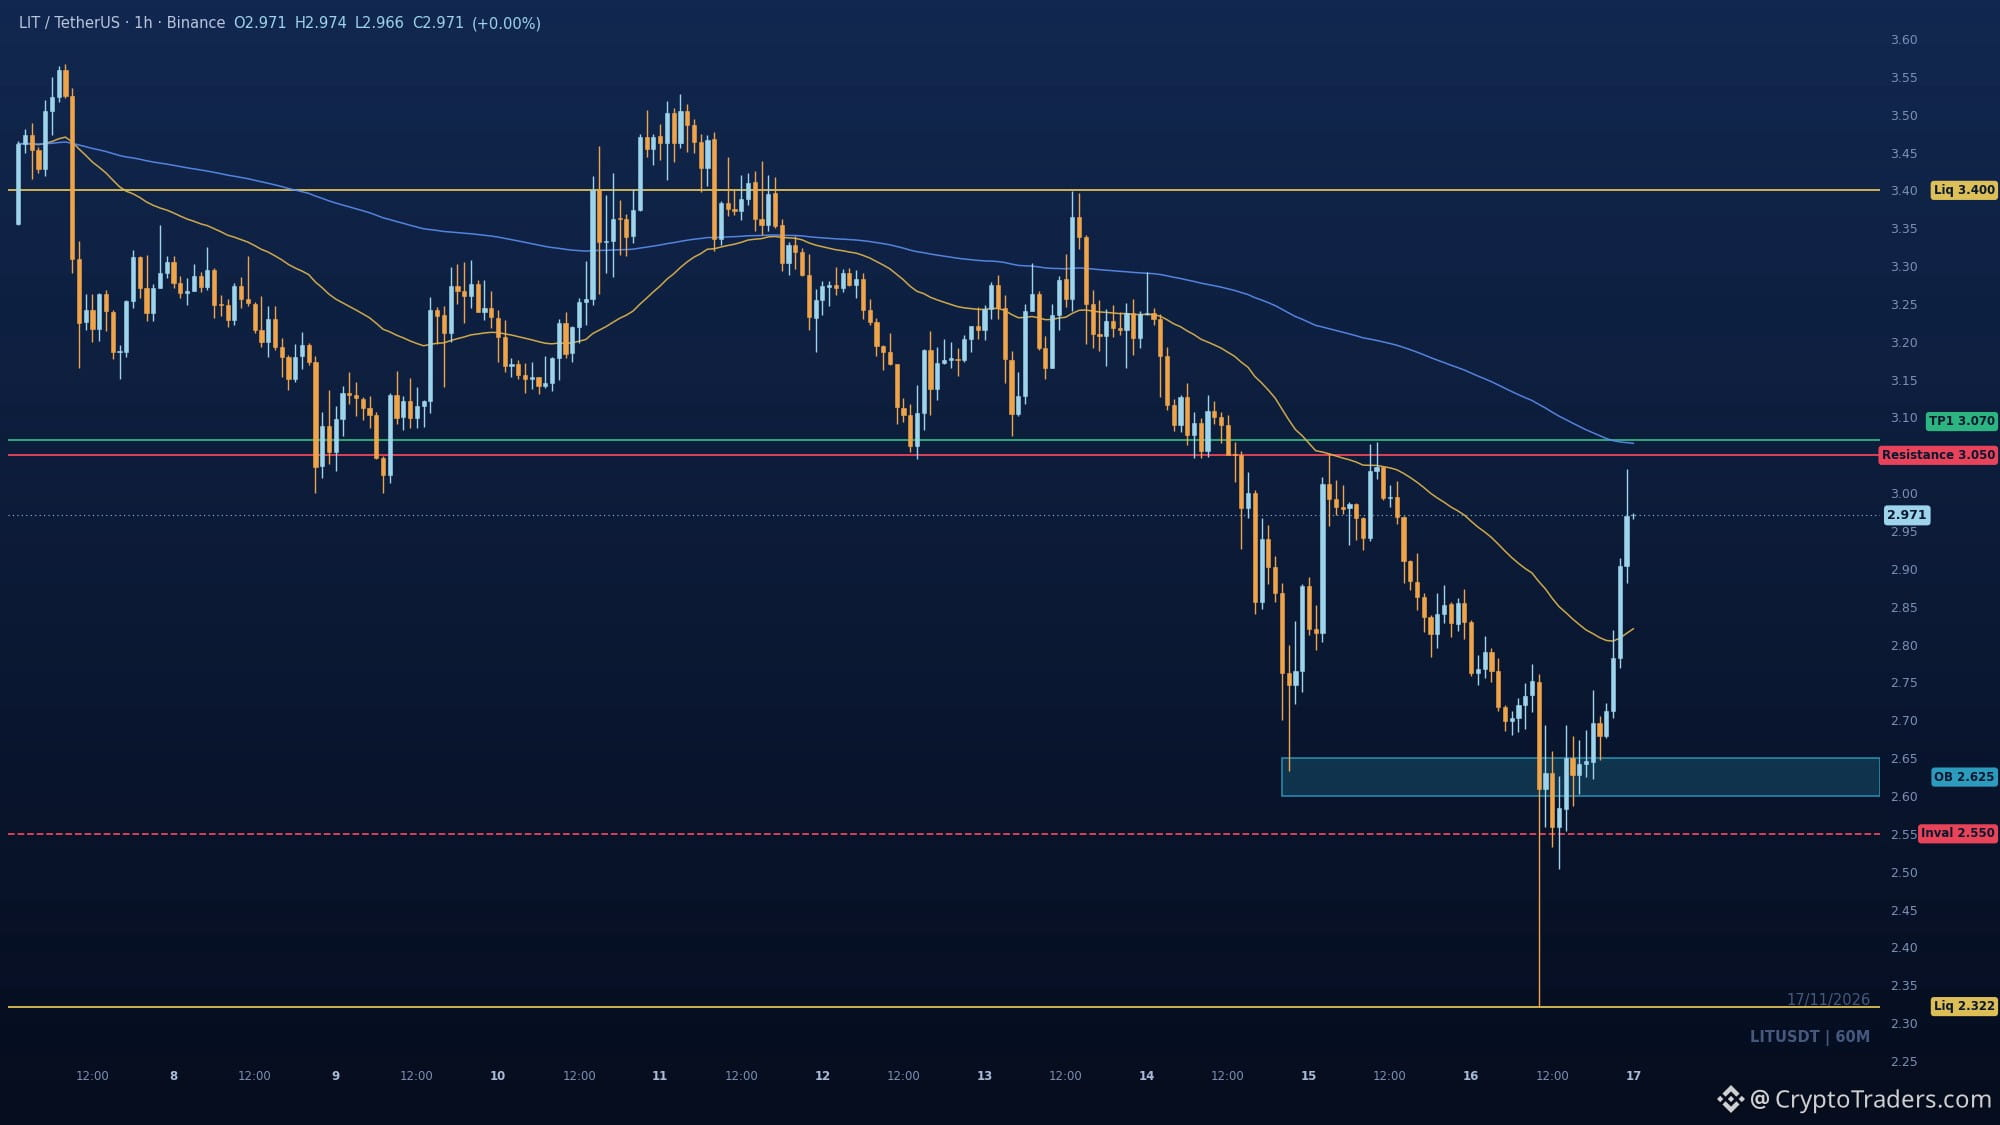
Lighter暂停提现,使$LIT回购资金流面临风险;同时有1,039万USDC流出合约 🧊 1⃣ **提现暂停** Lighter在发生一起涉及疑似外部方遭入侵的事件后,停止了提现和新建资金池。至少有1,039万USDC离开其合约;另有与做市商API密钥泄露有关的1,548万美元损失,但目前尚未得到证实。 2⃣ **回购隐忧** 长时间暂停可能会减少LIT回购活动。同样的机制未能帮助Aster:其每日手续费的99%用于自动买入,但11月15日短短15分钟内价格下跌27.2%,回购未能吸收这波跌幅。 3⃣ **流动性背景** 截至11月12日的一周内,Circle发行了108亿美元USDC,并赎回了121亿美元,净赎回额为13亿美元。Unocoin的以太坊资金流出由其通过BitGo持有的两把密钥授权,这也提醒我们托管风险不容忽视。 在交易场所冻结的情况下,价格上涨5.2%至0.743,这似乎是乐观情绪先于事实反映在价格中。 你认为暂停提现只是暂时措施,还是整个模式亮起了红灯? 每日精选内容会发在群里,欢迎到个人简介查看更多。 #山寨币季节# #宏观洞察#
Lighter暂停提现,使$LIT回购资金流面临风险;同时有1,039万USDC流出合约 🧊 1⃣ **提现暂停** Lighter在发生一起涉及疑似外部方遭入侵的事件后,停止了提现和新建资金池。至少有1,039万USDC离开其合约;另有与做市商API密钥泄露有关的1,548万美元损失,但目前尚未得到证实。 2⃣ **回购隐忧** 长时间暂停可能会减少LIT回购活动。同样的机制未能帮助Aster:其每日手续费的99%用于自动买入,但11月15日短短15分钟内价格下跌27.2%,回购未能吸收这波跌幅。 3⃣ **流动性背景** 截至11月12日的一周内,Circle发行了108亿美元USDC,并赎回了121亿美元,净赎回额为13亿美元。Unocoin的以太坊资金流出由其通过BitGo持有的两把密钥授权,这也提醒我们托管风险不容忽视。 在交易场所冻结的情况下,价格上涨5.2%至0.743,这似乎是乐观情绪先于事实反映在价格中。 你认为暂停提现只是暂时措施,还是整个模式亮起了红灯? 每日精选内容会发在群里,欢迎到个人简介查看更多。 #山寨币季节# #宏观洞察#
查看翻译
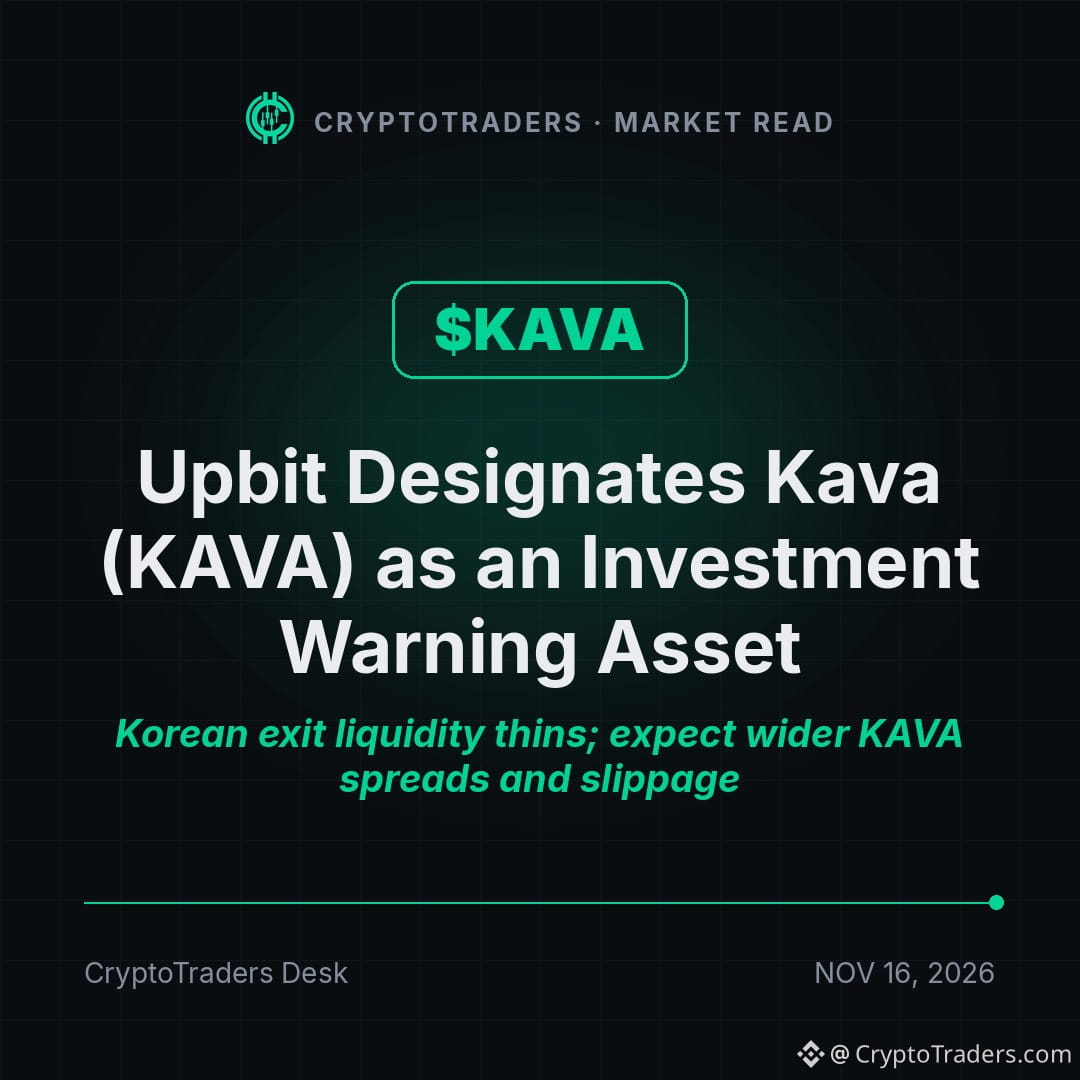
Upbit flags $KAVA as an investment warning asset after suspected security issues on the Kava chain 🚩 Highlights: ▪ Upbit designated Kava as an Investment Warning Asset on November 14 ▪ The exchange cited suspected security issues on the Kava chain ▪ Full details of the notice could not be retrieved from the page ▪ KAVA is trading at 0.02782, down 4.9% over 24 hours My Take 🔴 A Korean venue warning label hits liquidity where KAVA already trades thin, and the price reaction is showing it. 🟡 The suspected security issue is still unverified, and the notice details were not retrievable, so the scope stays unknown. 🟢 Contagion looks limited to KAVA unless the issue widens or more exchanges follow Upbit's lead. How much weight do you give exchange warning labels versus waiting for the underlying facts? I map setups like this daily in the group, and the bio shows where to find it. #Altcoin Season# #Macro Insights#
Upbit flags $KAVA as an investment warning asset after suspected security issues on the Kava chain 🚩 Highlights: ▪ Upbit designated Kava as an Investment Warning Asset on November 14 ▪ The exchange cited suspected security issues on the Kava chain ▪ Full details of the notice could not be retrieved from the page ▪ KAVA is trading at 0.02782, down 4.9% over 24 hours My Take 🔴 A Korean venue warning label hits liquidity where KAVA already trades thin, and the price reaction is showing it. 🟡 The suspected security issue is still unverified, and the notice details were not retrievable, so the scope stays unknown. 🟢 Contagion looks limited to KAVA unless the issue widens or more exchanges follow Upbit's lead. How much weight do you give exchange warning labels versus waiting for the underlying facts? I map setups like this daily in the group, and the bio shows where to find it. #Altcoin Season# #Macro Insights#
查看翻译
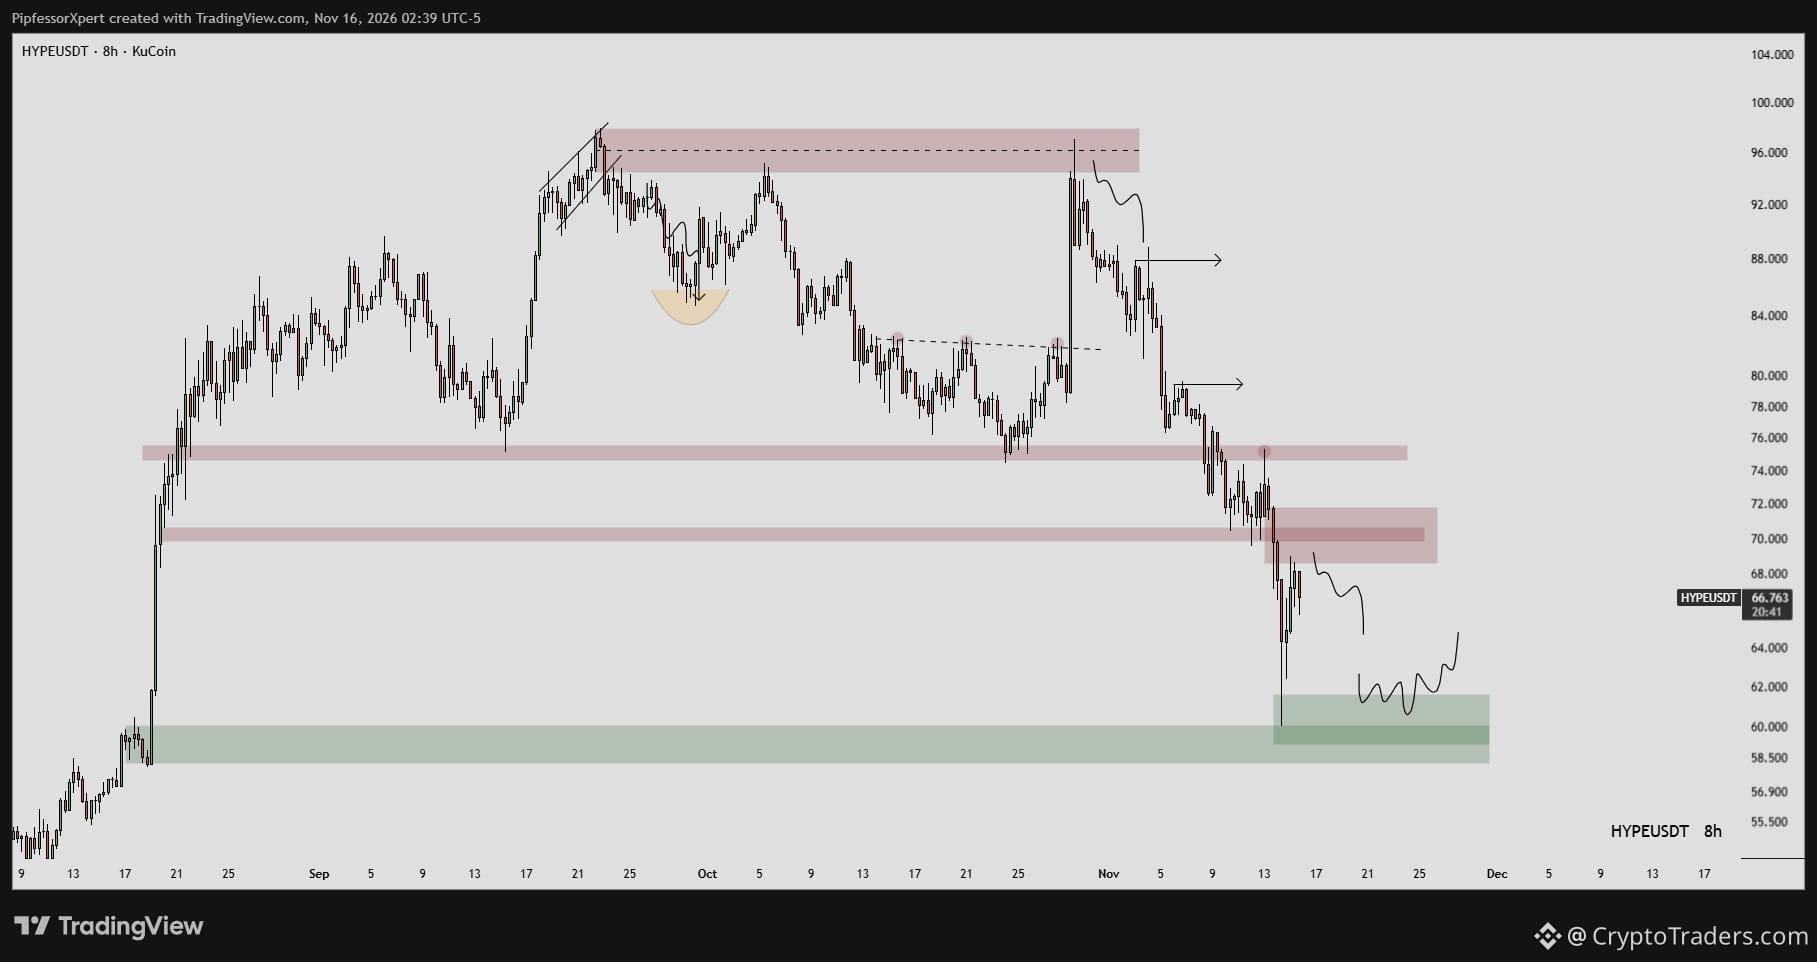
Most bounces on $HYPE die right here, and this one is starting inside the 68.5-72 supply zone it needs to clear. The 8H structure is still lower highs, so the 68.58 print sits under resistance rather than above it. Below, the demand zone at 58.5-62 is where the chart projects a retracement and a possible bounce if buyers show up. A close back above 72 would weaken the bearish read; holding under it keeps 60 in play. Are you watching the 62 line or waiting for a reclaim of 72? Several charts like this land in the group every day, details in my bio. #Altcoin Season#
Most bounces on $HYPE die right here, and this one is starting inside the 68.5-72 supply zone it needs to clear. The 8H structure is still lower highs, so the 68.58 print sits under resistance rather than above it. Below, the demand zone at 58.5-62 is where the chart projects a retracement and a possible bounce if buyers show up. A close back above 72 would weaken the bearish read; holding under it keeps 60 in play. Are you watching the 62 line or waiting for a reclaim of 72? Several charts like this land in the group every day, details in my bio. #Altcoin Season#
查看翻译
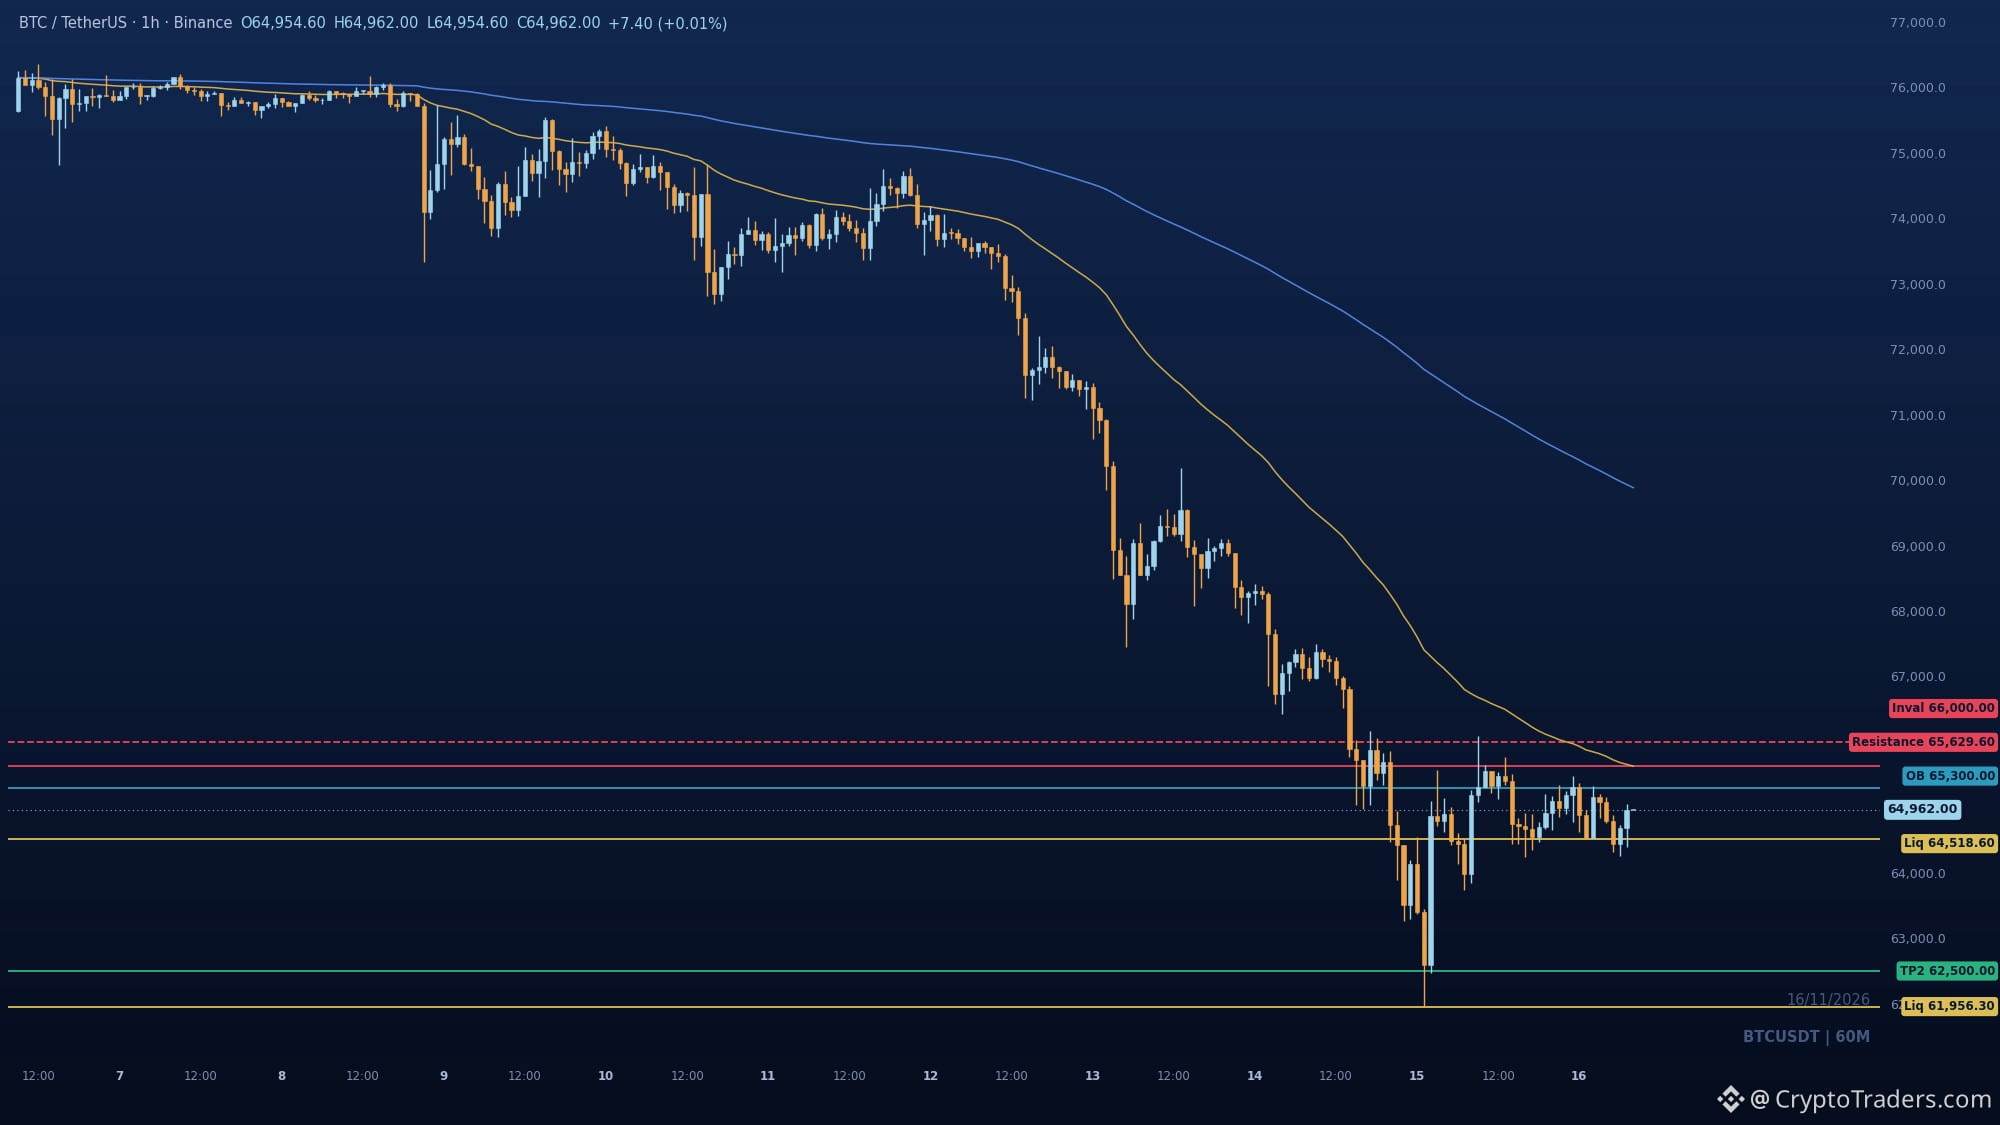
$BTC made the watchlist because the bounce has a clock on it: stalled under the 65,630 EMA50, this is where the 65,300-65,475 order block gets its say. Structure is still a run of lower highs with a sweep at 61,956, and price is sitting in discount under both EMAs. The draw underneath is the 64,519 sell-side pool, then the 62,000 low and a possible retest of 61,956. Reclaiming 66,000 kills the idea and puts the range back in play. How long do you give this bounce before the lows get tested again? More reads like this land daily in the group, bio has the way in. #BTC Price Analysis# #Bitcoin Price Prediction: What is Bitcoins next move?#
$BTC made the watchlist because the bounce has a clock on it: stalled under the 65,630 EMA50, this is where the 65,300-65,475 order block gets its say. Structure is still a run of lower highs with a sweep at 61,956, and price is sitting in discount under both EMAs. The draw underneath is the 64,519 sell-side pool, then the 62,000 low and a possible retest of 61,956. Reclaiming 66,000 kills the idea and puts the range back in play. How long do you give this bounce before the lows get tested again? More reads like this land daily in the group, bio has the way in. #BTC Price Analysis# #Bitcoin Price Prediction: What is Bitcoins next move?#
26
查看翻译
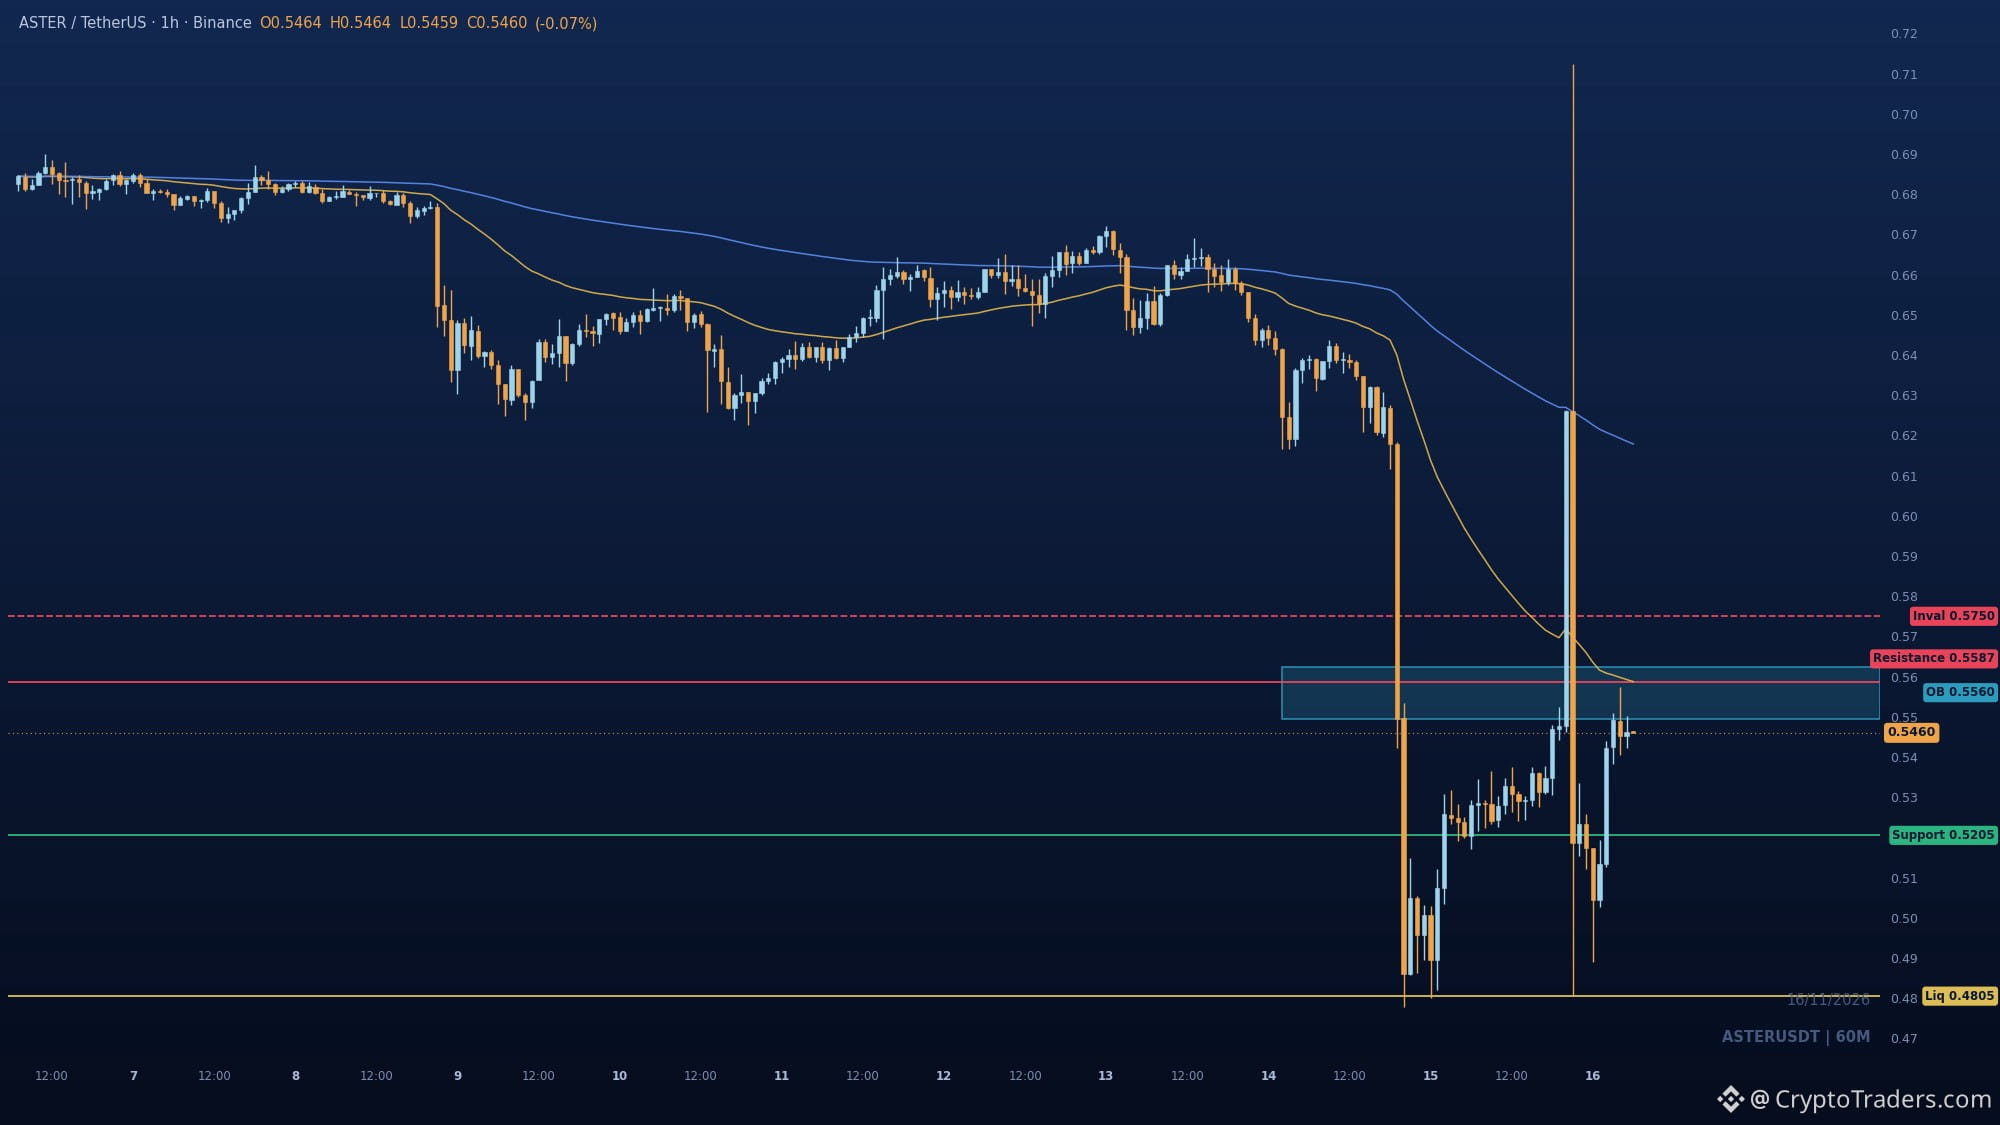
$ASTER is pinned between the 0.5495-0.5625 order block overhead and the 0.5205 base below, and the chart makes me lean toward the lower one. The bounce off the 0.4805 sweep is corrective, not impulsive: price is still in discount under both the EMA50 and EMA200 after a CHoCH and BOS lower. That 0.5495-0.5625 shelf is the last up candle before the drop, so offers from the broken 0.64-0.66 range should meet the first real test there. Reclaim 0.575 and the bearish read is wrong. Until then, a rejection toward 0.521 and a retest of 0.4805 is the cleaner sequence. Where do you see the first rejection happening, 0.556 or higher? More charts like this land daily in the group, bio shows the way in. #Altcoin Season#
$ASTER is pinned between the 0.5495-0.5625 order block overhead and the 0.5205 base below, and the chart makes me lean toward the lower one. The bounce off the 0.4805 sweep is corrective, not impulsive: price is still in discount under both the EMA50 and EMA200 after a CHoCH and BOS lower. That 0.5495-0.5625 shelf is the last up candle before the drop, so offers from the broken 0.64-0.66 range should meet the first real test there. Reclaim 0.575 and the bearish read is wrong. Until then, a rejection toward 0.521 and a retest of 0.4805 is the cleaner sequence. Where do you see the first rejection happening, 0.556 or higher? More charts like this land daily in the group, bio shows the way in. #Altcoin Season#
40
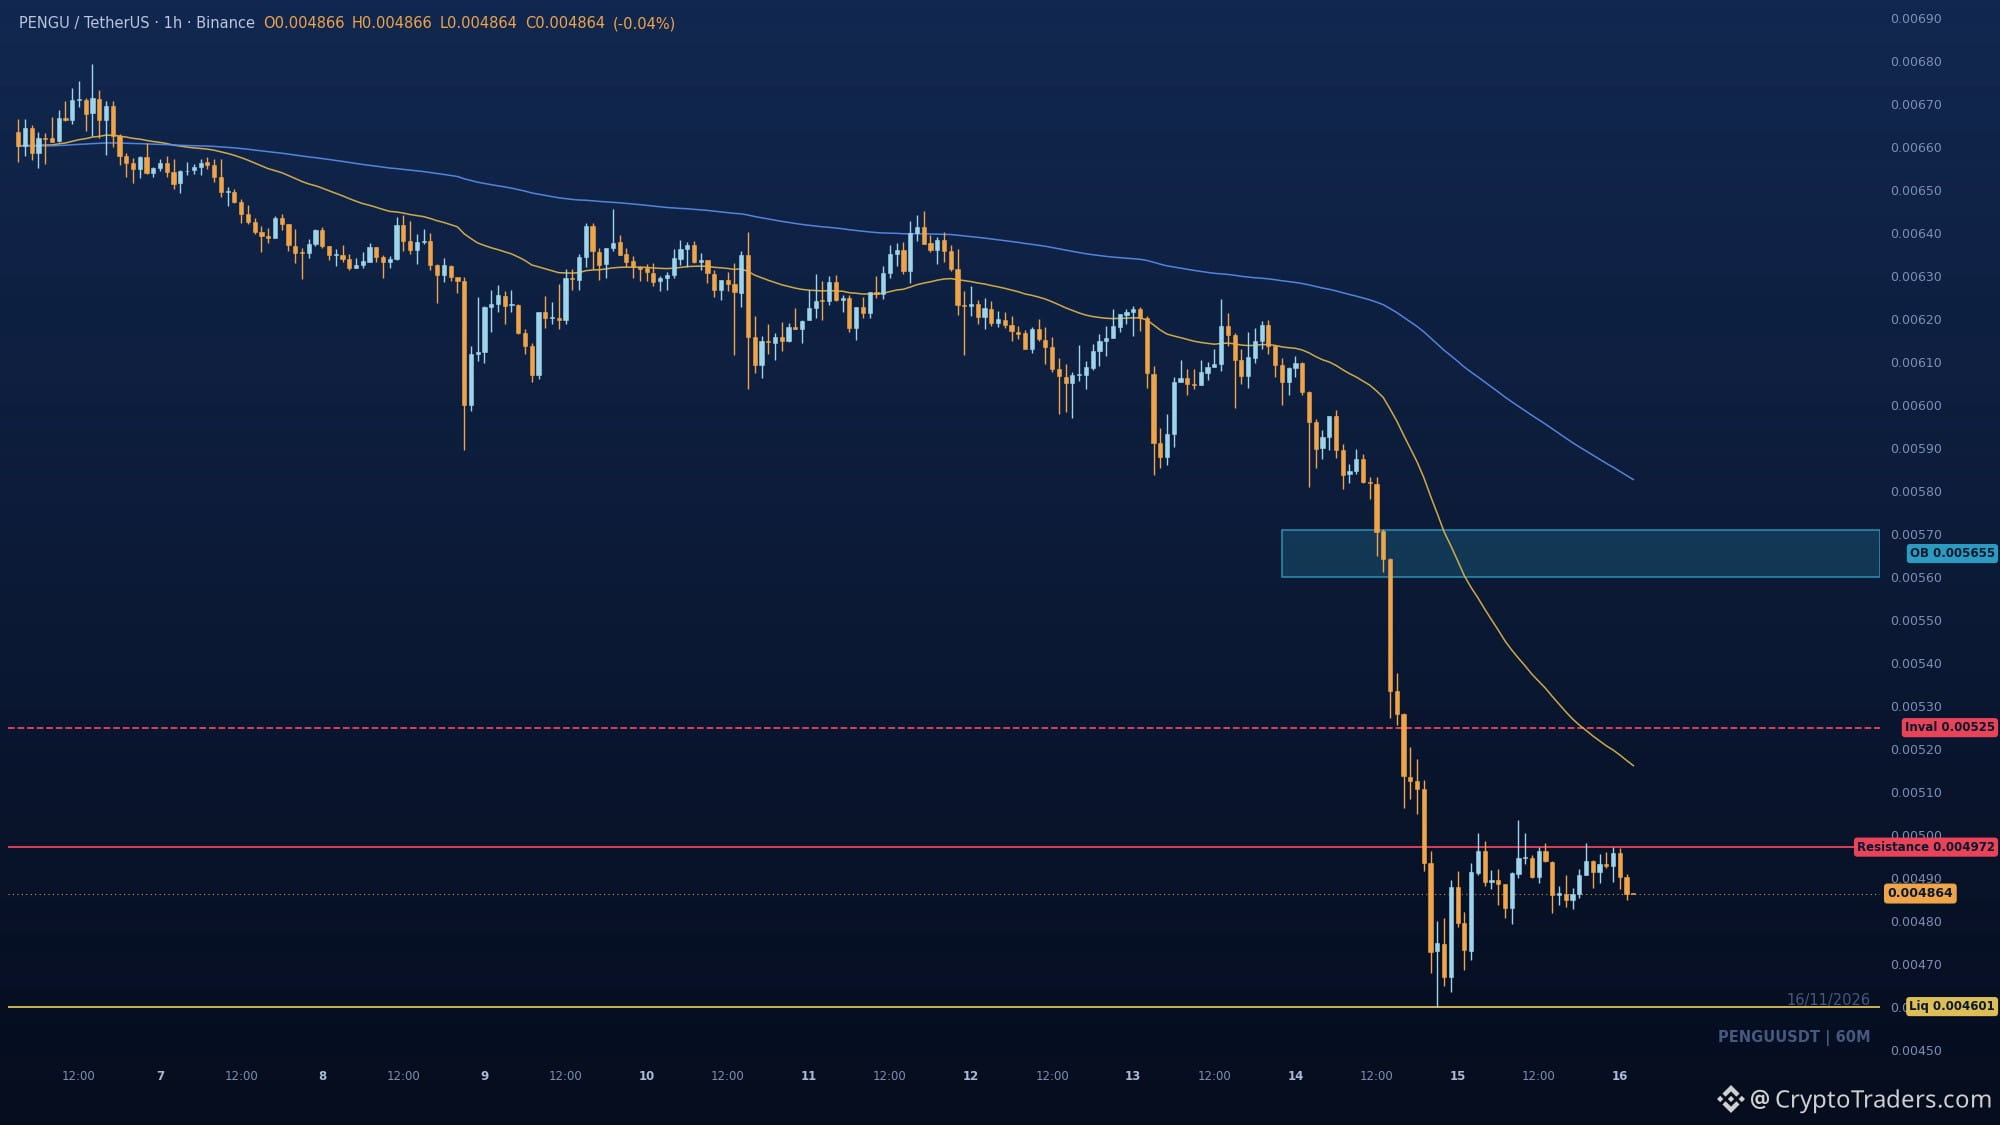
$PENGU 的绿K棒不是反转,而是破位结构中的反弹。0.0058 支撑位已经随著 BOS 失守,价格仍被压在两条 EMA 下方,位于 0.004869。预期价格会推升至 0.00497,扫掉买方停损,接著遭到拒绝并回落至已被扫过的 0.00460 低点附近。若失守 0.00460,卖方行情就会延续。重新站回 0.00525 才能真正扭转走势。你会关注 0.00460 能否守住或跌破吗?更多类似的分析每天都会发布在群组里,加入方式请看个人简介。#山寨币季节#
$PENGU 的绿K棒不是反转,而是破位结构中的反弹。0.0058 支撑位已经随著 BOS 失守,价格仍被压在两条 EMA 下方,位于 0.004869。预期价格会推升至 0.00497,扫掉买方停损,接著遭到拒绝并回落至已被扫过的 0.00460 低点附近。若失守 0.00460,卖方行情就会延续。重新站回 0.00525 才能真正扭转走势。你会关注 0.00460 能否守住或跌破吗?更多类似的分析每天都会发布在群组里,加入方式请看个人简介。#山寨币季节#
53
查看翻译
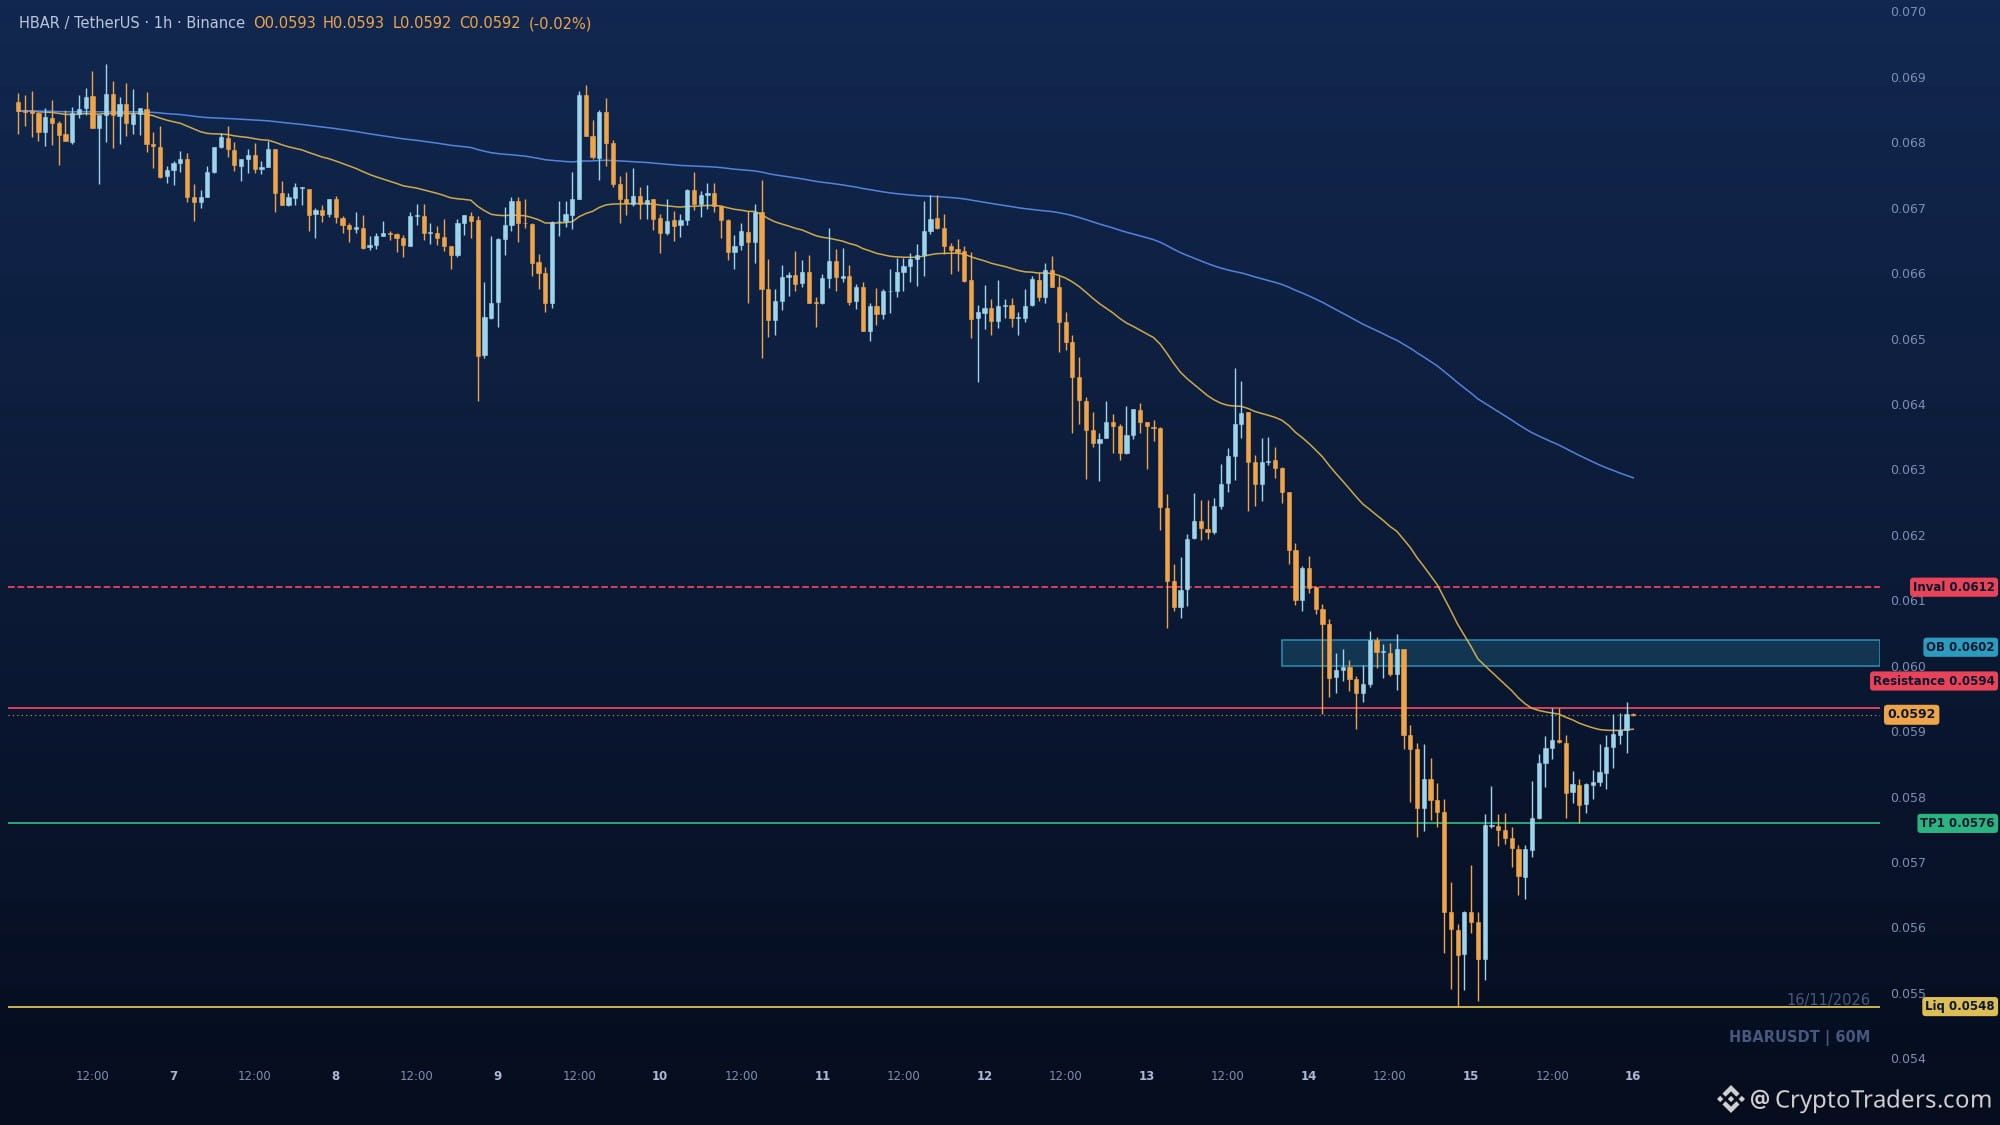
Can $HBAR hold above the 0.0594 swing high, or is this bounce just a retrace into supply? Price swept sell-side liquidity down at 0.05479 and has retraced in the discount of the range, now testing the 50 EMA near 0.0590. The 200 EMA still caps the structure with lower highs and lower lows, so the bounce reads as a pullback, not a reversal. First real test is the 0.0594-0.0604 bearish order block. A rejection there sets up a rotation through 0.0576 toward the 0.0548 low. I would only flip constructive on a clean reclaim of 0.0612, which invalidates the bearish read. What would you need to see before trusting this bounce? More reads like this land in the group every day, check the bio. #Altcoin Season#
Can $HBAR hold above the 0.0594 swing high, or is this bounce just a retrace into supply? Price swept sell-side liquidity down at 0.05479 and has retraced in the discount of the range, now testing the 50 EMA near 0.0590. The 200 EMA still caps the structure with lower highs and lower lows, so the bounce reads as a pullback, not a reversal. First real test is the 0.0594-0.0604 bearish order block. A rejection there sets up a rotation through 0.0576 toward the 0.0548 low. I would only flip constructive on a clean reclaim of 0.0612, which invalidates the bearish read. What would you need to see before trusting this bounce? More reads like this land in the group every day, check the bio. #Altcoin Season#
59
以太币 ETF 终于中止连续六个交易日、总额 5.944 亿美元的资金流出,迎来区区 230 万美元的流入;此时 $ETH 报 1,818 美元,上涨 2.8% 🧐 1⃣ **ETF 资金流出才是关键** 美国以太币 ETF 在 11 月 13 日仅吸引 230 万美元流入,此前已连续六个交易日遭到赎回,总额达 5.944 亿美元;11 月至今的净资金流仍为负 7.641 亿美元。单日转正,无法扭转整个月的资金流出。 2⃣ **托管风险再度浮现** BitGo 表示,经其检视,Unocoin 自行持有的两把密钥授权了以太坊资金转出;其中一个钱包在 11 月 9 日至 11 日期间,向同一收款方转帐 98 次。收款方身分与损失总额仍不明,这再次提醒我们,密钥管理是风险核心。 3⃣ **整体杠杆正在降温** 在多头部位遭清算 13.1 亿美元后,比特币期货未平仓合约在 24 小时内下滑 5.45%,按价格调整后,曝险约减少 2.9%。11 月 9 日至 13 日期间,现货 BTC ETF 资金流出 10.7 亿美元,因此机构需求看起来仍然疲软。 资金流在边际上趋于稳定,但尚未反转。 230 万美元的流入,会改变你对以太币 ETF 需求的看法吗? 我每天都会在群组里整理这类资金流向,个人简介里有加入方式。 #山寨币季# #宏观观点#
以太币 ETF 终于中止连续六个交易日、总额 5.944 亿美元的资金流出,迎来区区 230 万美元的流入;此时 $ETH 报 1,818 美元,上涨 2.8% 🧐 1⃣ **ETF 资金流出才是关键** 美国以太币 ETF 在 11 月 13 日仅吸引 230 万美元流入,此前已连续六个交易日遭到赎回,总额达 5.944 亿美元;11 月至今的净资金流仍为负 7.641 亿美元。单日转正,无法扭转整个月的资金流出。 2⃣ **托管风险再度浮现** BitGo 表示,经其检视,Unocoin 自行持有的两把密钥授权了以太坊资金转出;其中一个钱包在 11 月 9 日至 11 日期间,向同一收款方转帐 98 次。收款方身分与损失总额仍不明,这再次提醒我们,密钥管理是风险核心。 3⃣ **整体杠杆正在降温** 在多头部位遭清算 13.1 亿美元后,比特币期货未平仓合约在 24 小时内下滑 5.45%,按价格调整后,曝险约减少 2.9%。11 月 9 日至 13 日期间,现货 BTC ETF 资金流出 10.7 亿美元,因此机构需求看起来仍然疲软。 资金流在边际上趋于稳定,但尚未反转。 230 万美元的流入,会改变你对以太币 ETF 需求的看法吗? 我每天都会在群组里整理这类资金流向,个人简介里有加入方式。 #山寨币季# #宏观观点#
查看翻译
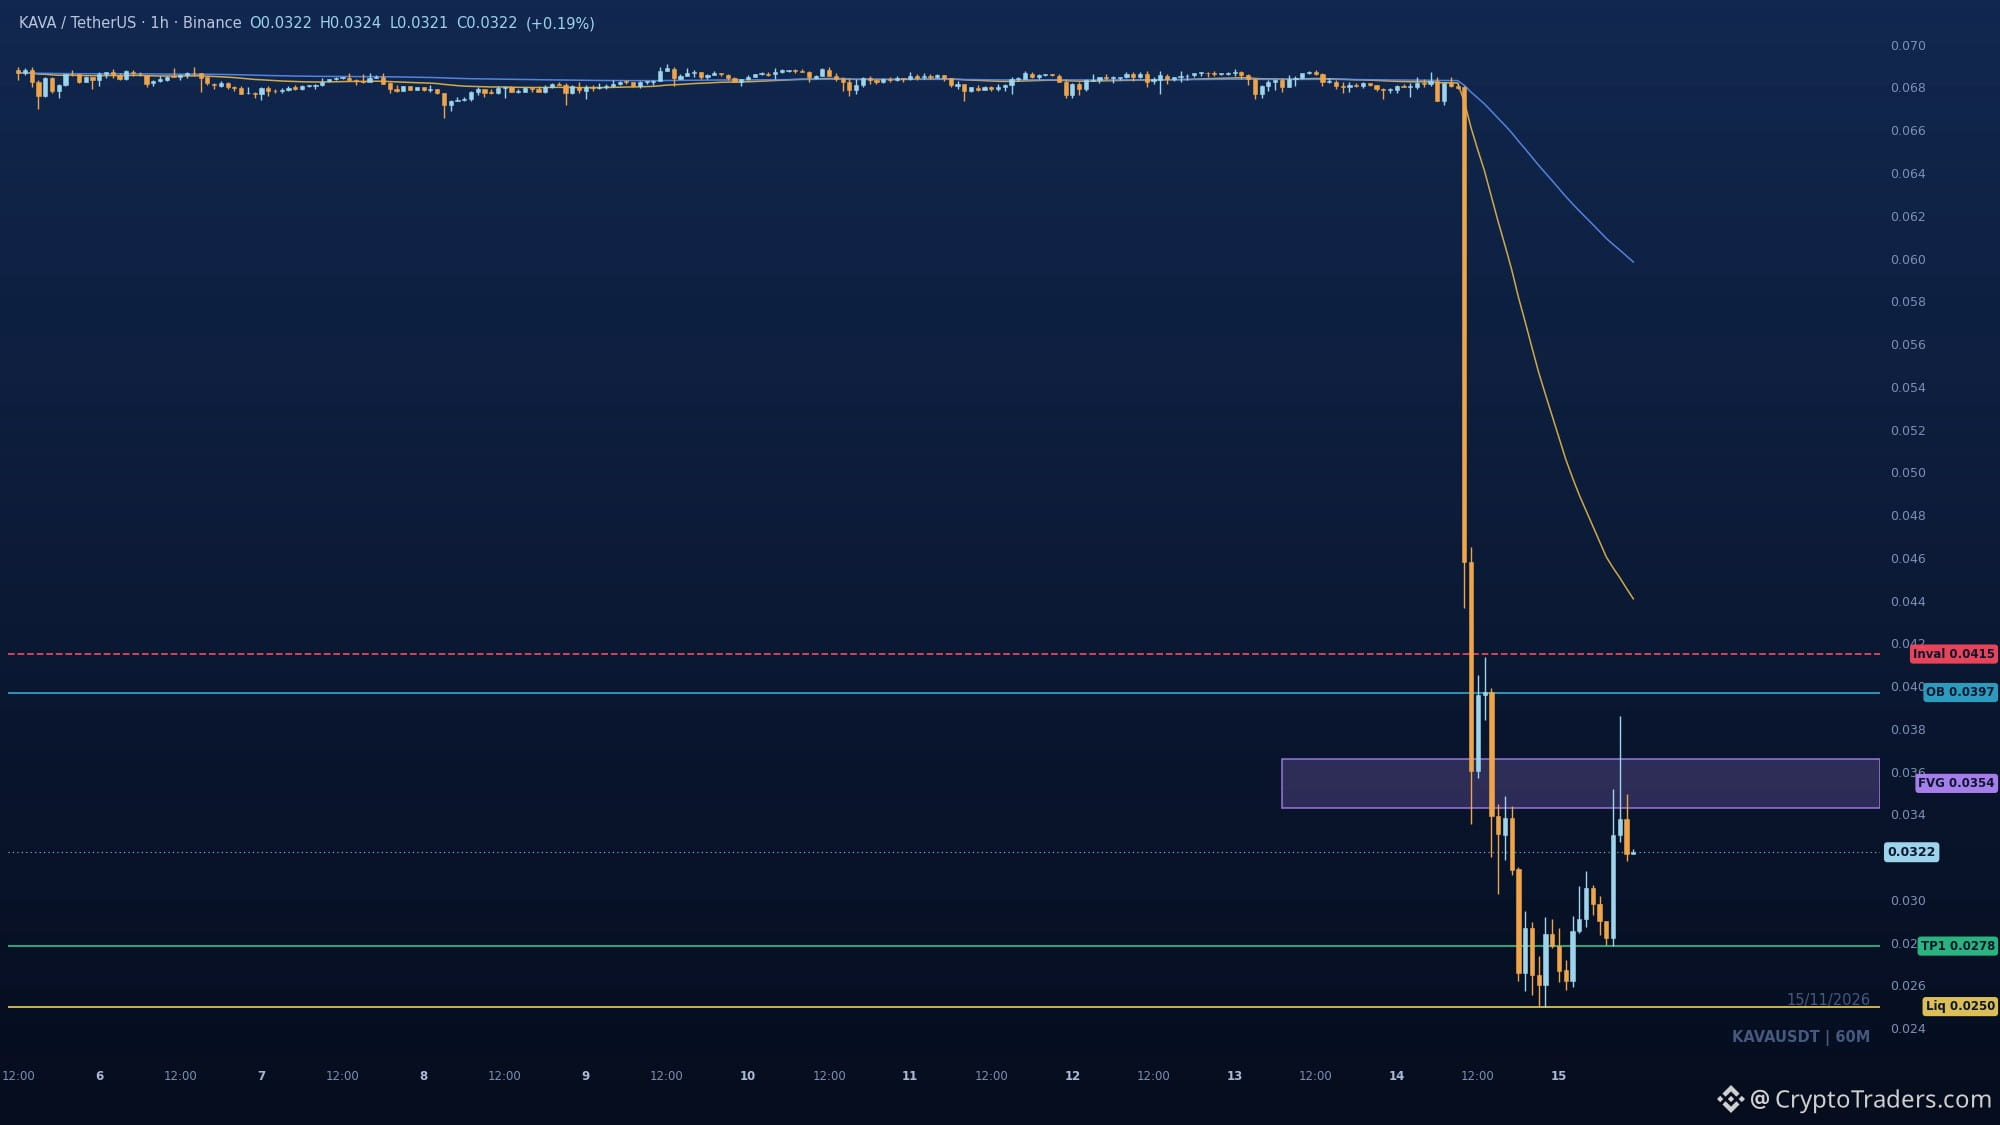
$KAVA just lost a long accumulation range in one vertical candle and is now bouncing at 0.0325, well under both EMAs. The 0.0343-0.0366 imbalance is the first test. A retrace that stalls there keeps the door open to the 0.02501 sell-side pool. Reclaim 0.0403 and the bearish order block stops mattering. Above 0.0415 this read is wrong. So which comes first: a fill of that gap, or a sweep of the window low? More chart reads like this land daily in the group, bio has the way in. #Altcoin Season#
$KAVA just lost a long accumulation range in one vertical candle and is now bouncing at 0.0325, well under both EMAs. The 0.0343-0.0366 imbalance is the first test. A retrace that stalls there keeps the door open to the 0.02501 sell-side pool. Reclaim 0.0403 and the bearish order block stops mattering. Above 0.0415 this read is wrong. So which comes first: a fill of that gap, or a sweep of the window low? More chart reads like this land daily in the group, bio has the way in. #Altcoin Season#
27
查看翻译
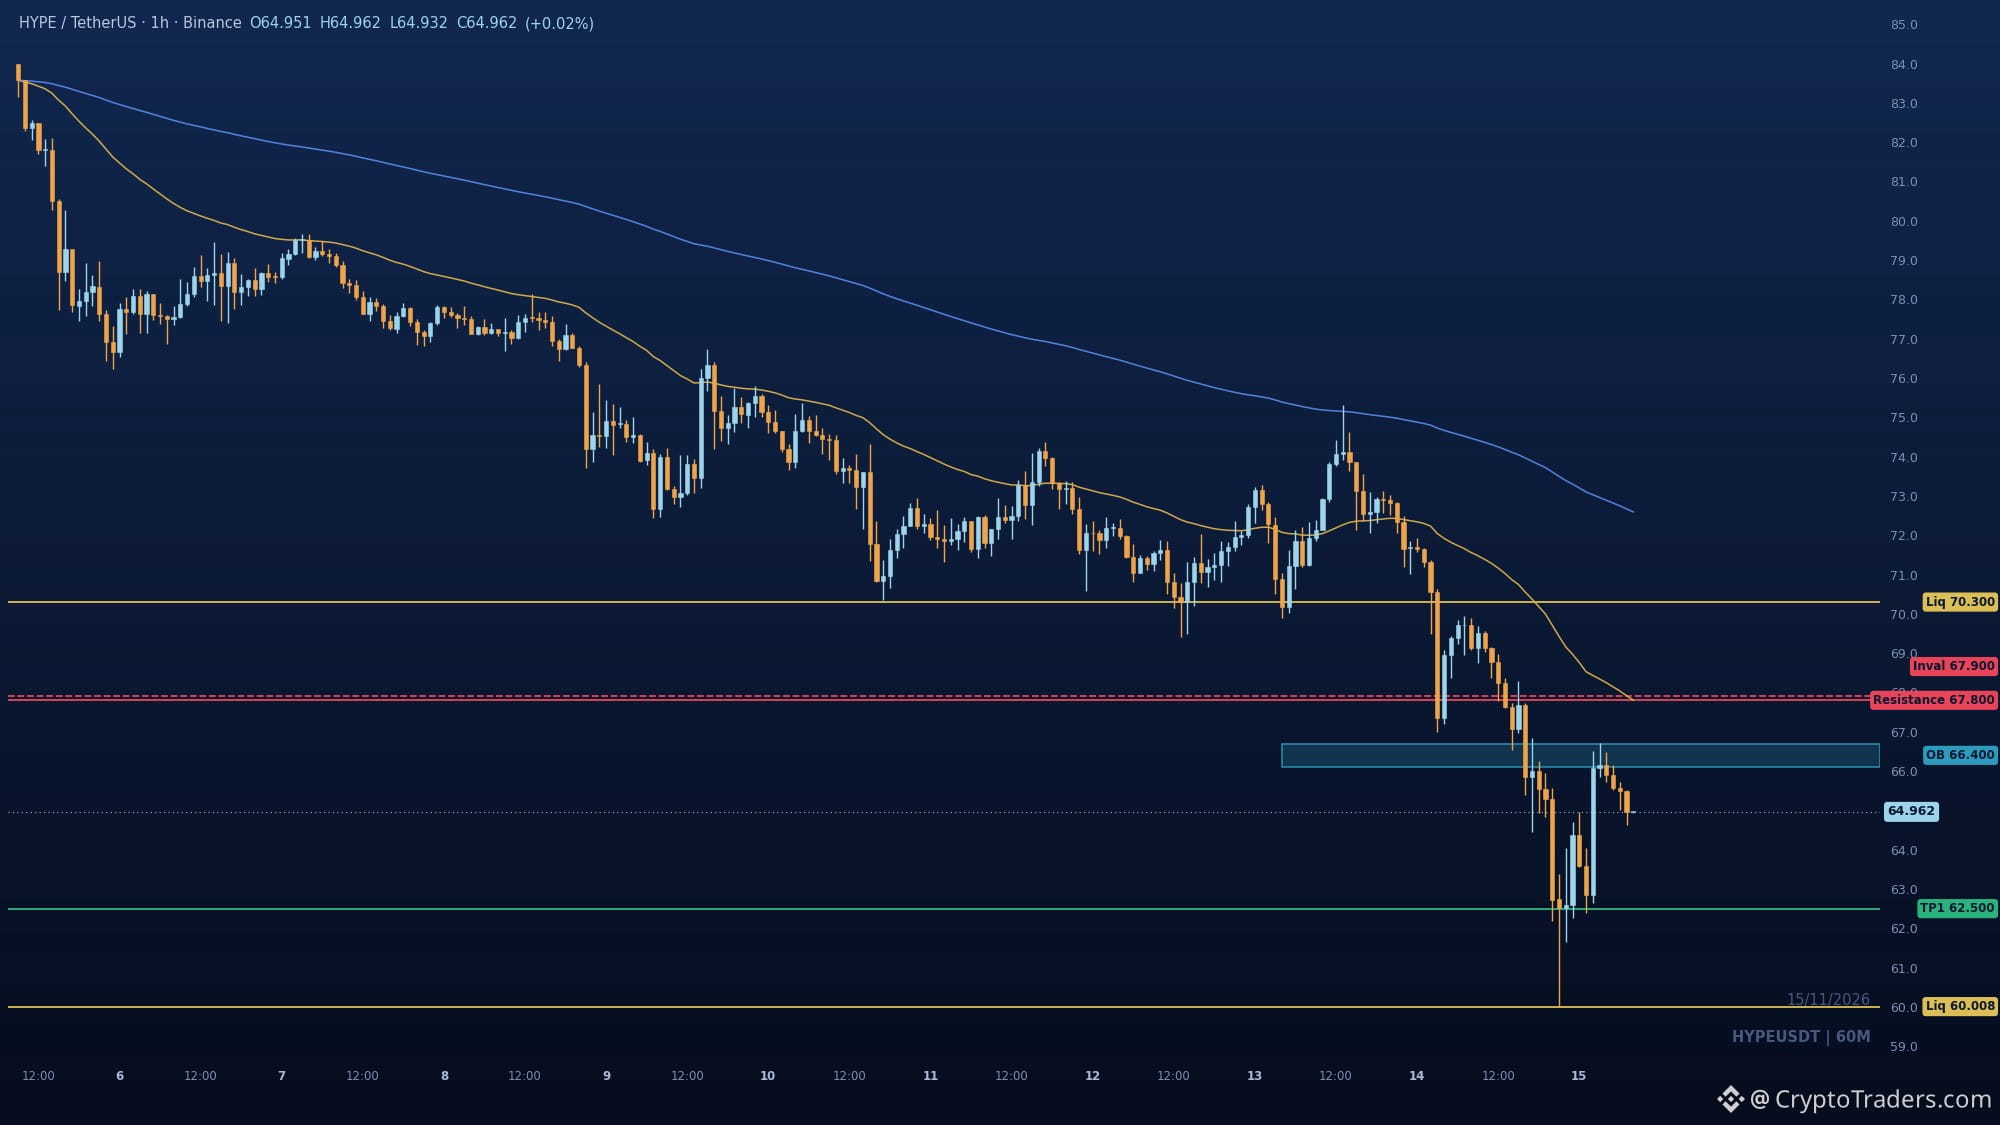
66.7. That is the whole story on $HYPE right now, and the bounce is already failing under it. Lower highs keep stacking beneath both EMAs since the 83.98 top, and the sell-off to 60.008 broke structure with a clean BOS. The 66.1-66.7 order block is where the last up candle died, with the EMA50 sitting just above at 67.8 as the line that flips this read. What I need to see: a close above 67.9 to believe the bulls, or a rejection at 66.7 that sends price back to retest 60.008 for the bears. Do you think 60.008 gets swept again before the week is out? More charts like this land in the group daily, bio has the way in. #Altcoin Season#
66.7. That is the whole story on $HYPE right now, and the bounce is already failing under it. Lower highs keep stacking beneath both EMAs since the 83.98 top, and the sell-off to 60.008 broke structure with a clean BOS. The 66.1-66.7 order block is where the last up candle died, with the EMA50 sitting just above at 67.8 as the line that flips this read. What I need to see: a close above 67.9 to believe the bulls, or a rejection at 66.7 that sends price back to retest 60.008 for the bears. Do you think 60.008 gets swept again before the week is out? More charts like this land in the group daily, bio has the way in. #Altcoin Season#
27
查看翻译
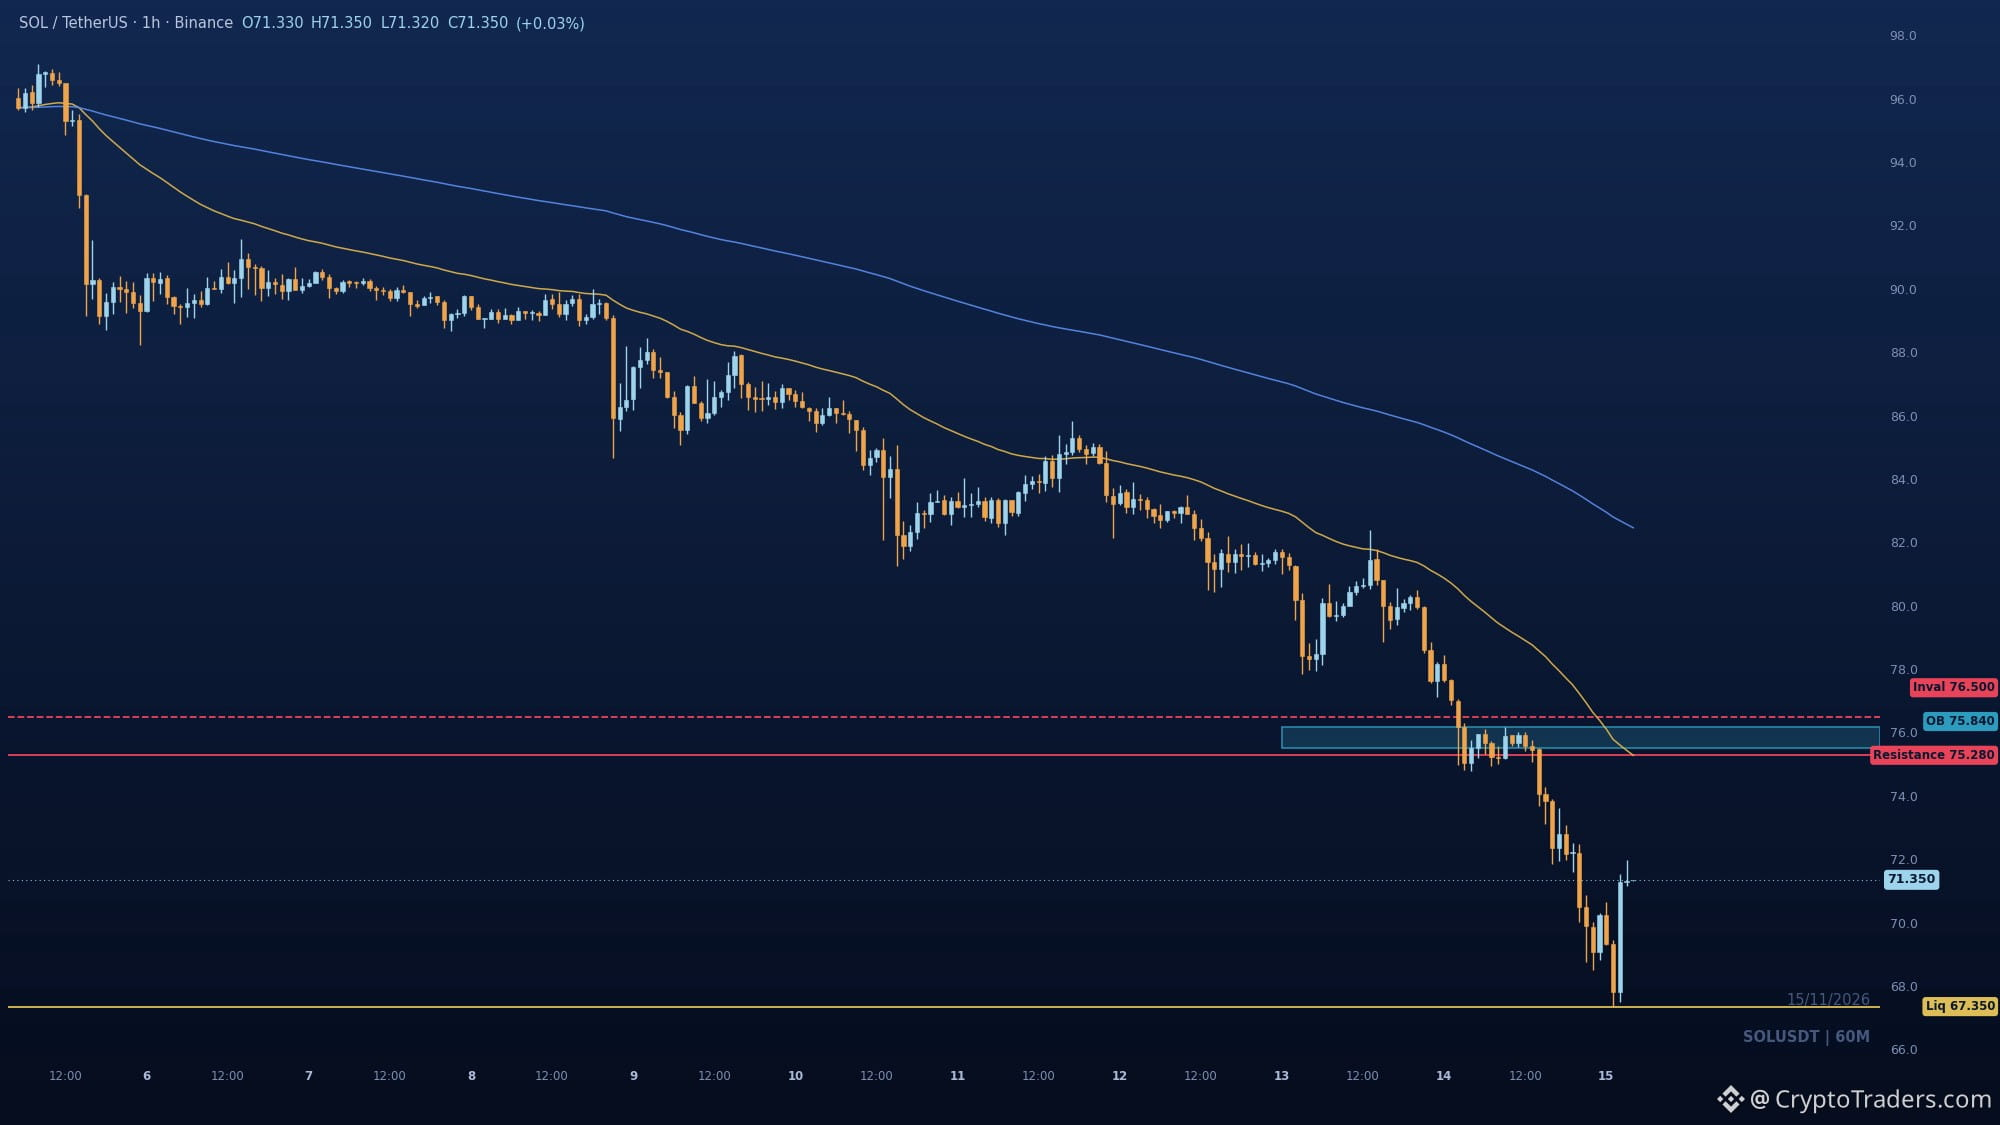
$SOL just swept the 67.35 sell-side low and the bounce off it is already stalling under the old 75-76 shelf. The chart is stair-steps down from 97, with every consolidation breaking lower and price still under both the EMA50 and EMA200. The 75.5 to 76.18 bearish order block lines up with the EMA50 at 75.28, so that is where the corrective retrace should get turned back. A reclaim of 76.5 would flip the read, but until then I expect a retest of 67.35 and continuation lower if it gives way. Where are you watching this bounce top out? More reads like this land daily in the group, my bio has the way in. #Altcoin Season#
$SOL just swept the 67.35 sell-side low and the bounce off it is already stalling under the old 75-76 shelf. The chart is stair-steps down from 97, with every consolidation breaking lower and price still under both the EMA50 and EMA200. The 75.5 to 76.18 bearish order block lines up with the EMA50 at 75.28, so that is where the corrective retrace should get turned back. A reclaim of 76.5 would flip the read, but until then I expect a retest of 67.35 and continuation lower if it gives way. Where are you watching this bounce top out? More reads like this land daily in the group, my bio has the way in. #Altcoin Season#
47
查看翻译
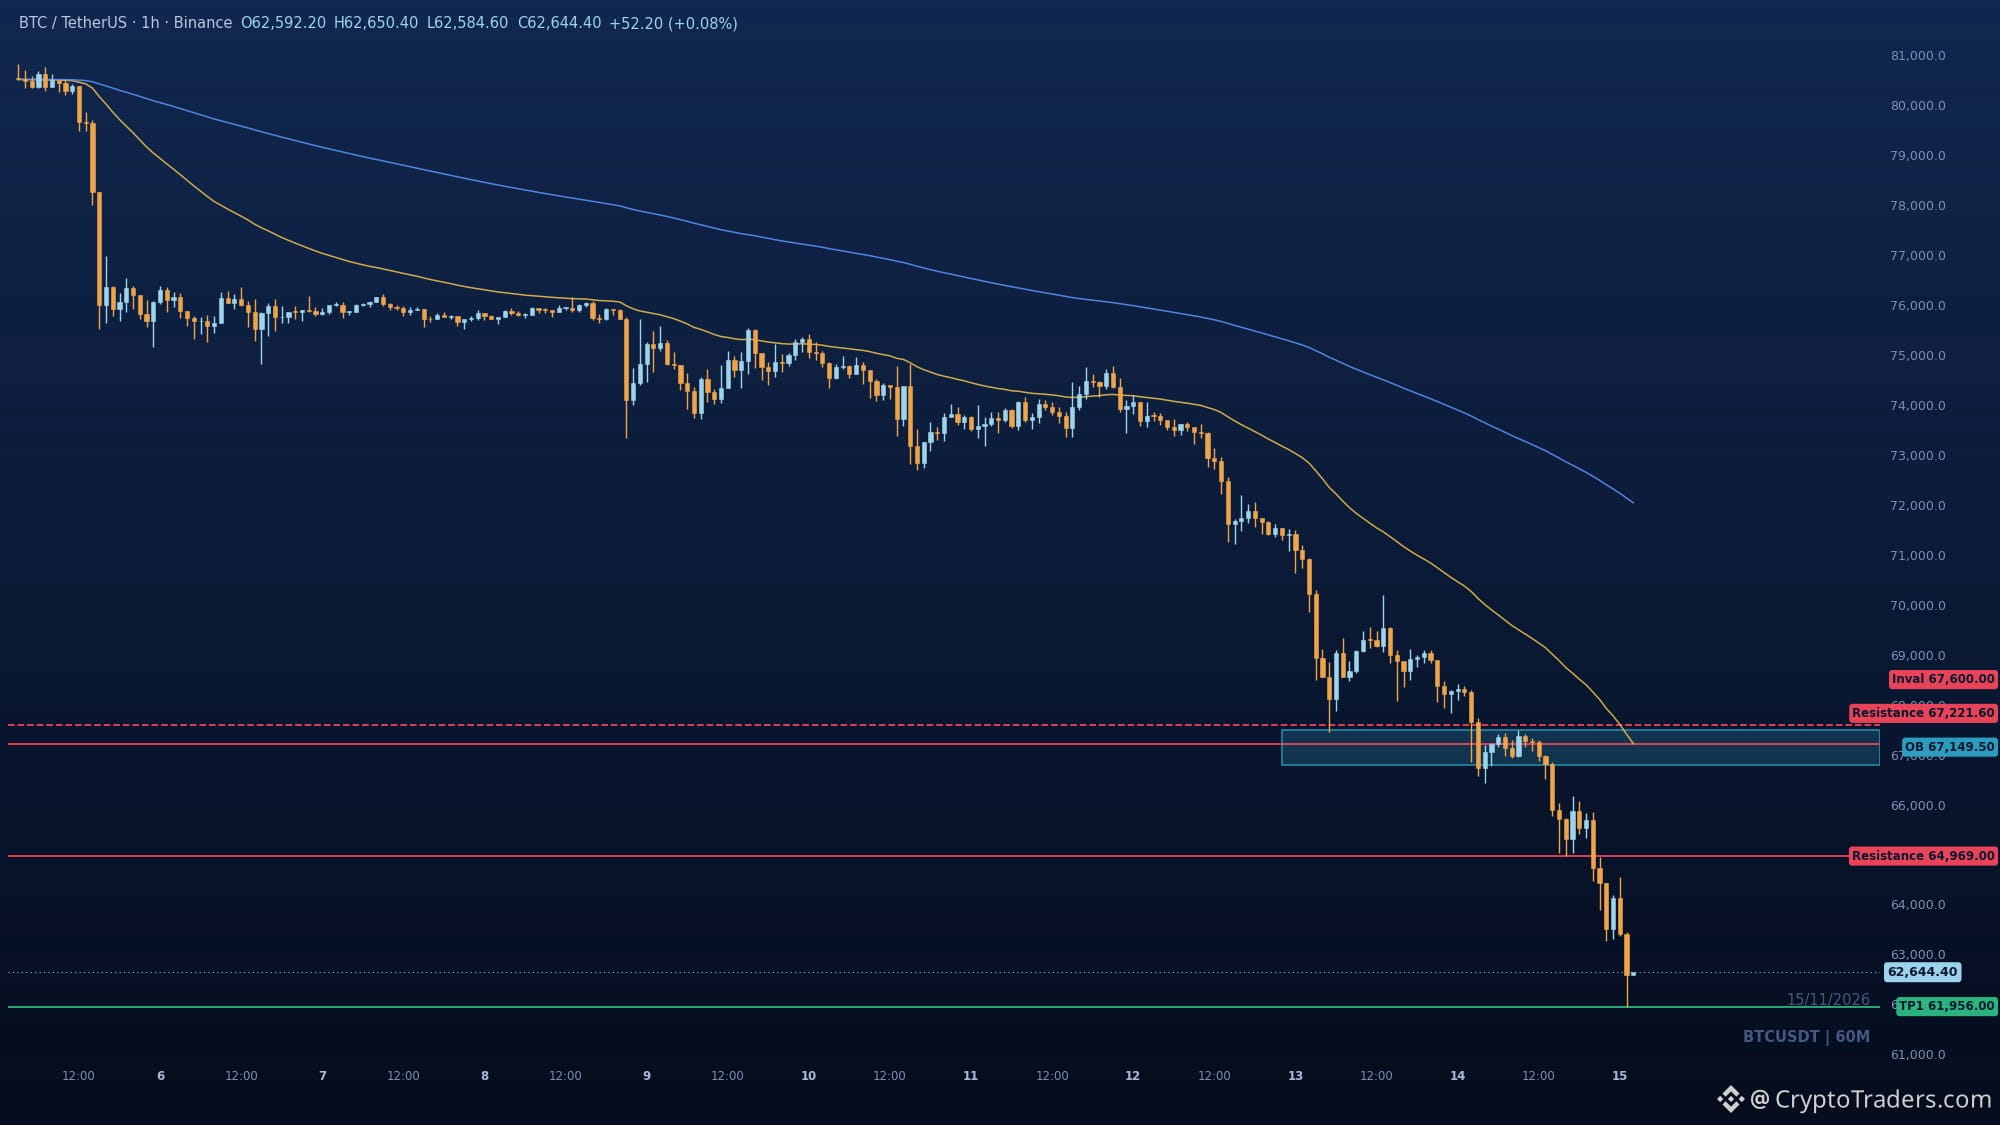
Everyone is calling this $BTC drop a capitulation wick, but the chart shows a clean break of the 64,969 swing low with price pinned under both EMAs. Each rally since 80.8k stalled at the 50 EMA and printed a lower high, so the stair-step down is intact. The zone that matters now is 64,969 to 67,499, where the broken low meets the bearish order block and the EMA50 at 67,221. A rejection there keeps 61,956 in play; a close above 67,600 would be the first crack in the structure. Where do you think the bounce dies, at 64,969 or up into the block? More reads like this land daily in the group, bio has the details. #BTC Price Analysis# #Bitcoin Price Prediction: What is Bitcoins next move?#
Everyone is calling this $BTC drop a capitulation wick, but the chart shows a clean break of the 64,969 swing low with price pinned under both EMAs. Each rally since 80.8k stalled at the 50 EMA and printed a lower high, so the stair-step down is intact. The zone that matters now is 64,969 to 67,499, where the broken low meets the bearish order block and the EMA50 at 67,221. A rejection there keeps 61,956 in play; a close above 67,600 would be the first crack in the structure. Where do you think the bounce dies, at 64,969 or up into the block? More reads like this land daily in the group, bio has the details. #BTC Price Analysis# #Bitcoin Price Prediction: What is Bitcoins next move?#
59
查看翻译
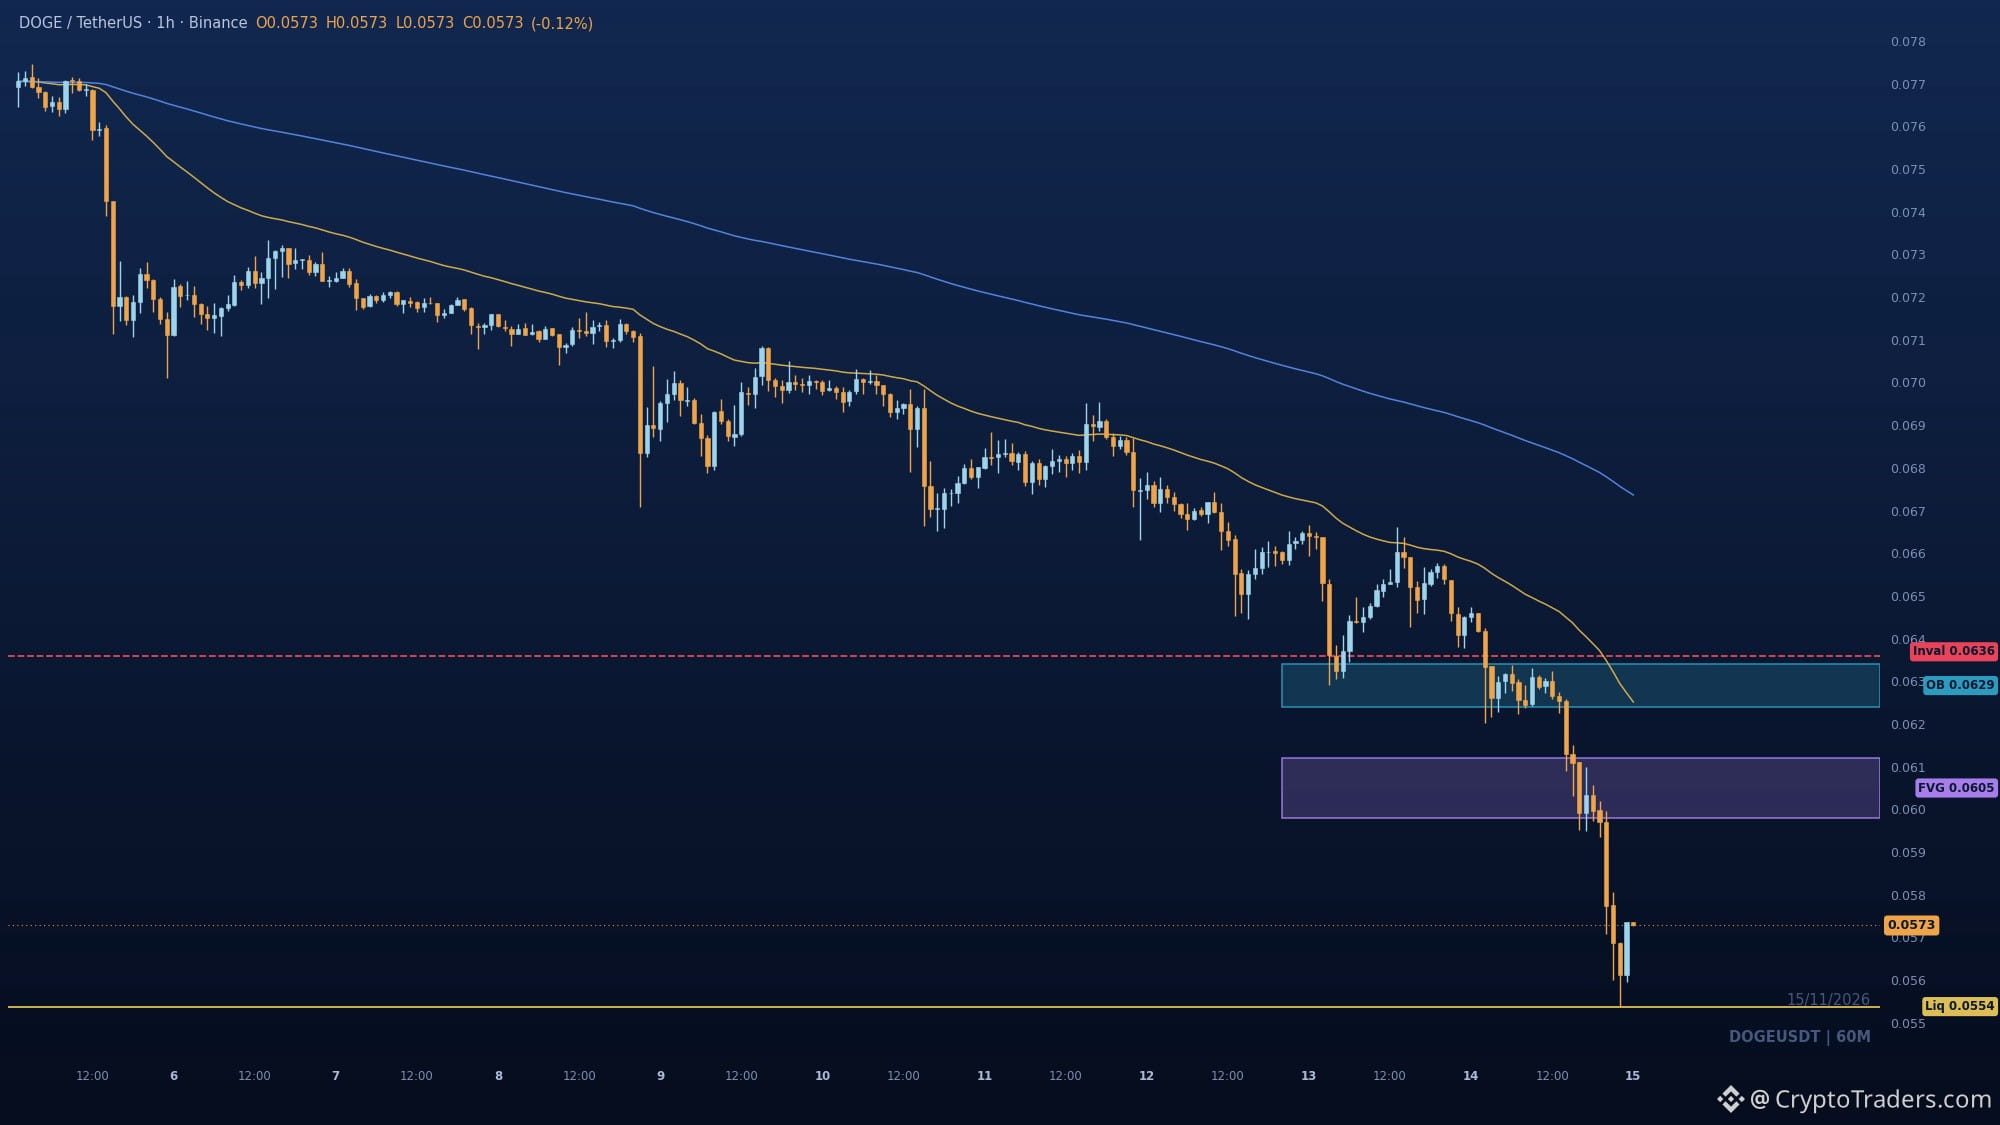
$DOGE earned a watchlist spot because the 0.0622 break finally gave this downtrend a clean lower low, and now the chart is asking whether the 0.0554 wick was the flush or just the first stop. Structure is a stack of BOS lower, price pinned well under both EMAs after an 11.2% session. The 0.0598 to 0.0612 imbalance is the first test: a bounce that stalls there keeps sellers in charge toward 0.05538. Reclaim 0.0636 and the bearish order block at 0.0624 to 0.0634 stops being a wall. Which do you see first, the 0.0554 retest or a push back through 0.06? More reads like this land daily in the group, bio has the way in. #Altcoin Season#
$DOGE earned a watchlist spot because the 0.0622 break finally gave this downtrend a clean lower low, and now the chart is asking whether the 0.0554 wick was the flush or just the first stop. Structure is a stack of BOS lower, price pinned well under both EMAs after an 11.2% session. The 0.0598 to 0.0612 imbalance is the first test: a bounce that stalls there keeps sellers in charge toward 0.05538. Reclaim 0.0636 and the bearish order block at 0.0624 to 0.0634 stops being a wall. Which do you see first, the 0.0554 retest or a push back through 0.06? More reads like this land daily in the group, bio has the way in. #Altcoin Season#
64
登录解锁更多内容
加入币安广场,与全球加密货币用户互动
⚡️ 获取关于加密货币的最新实用信息。
💬 受到全球最大加密货币交易平台的信赖。
👍 发现来自认证创作者的真知灼见。
邮箱/手机号码