
ryan.gem
2.5k 个内容

ryan.gem
举报
屏蔽用户
Gem finder. I look for undervalued projects with real potential. Contrarian take: good tech doesn't always pump fast, but it compounds. Looking for 10x over 2 years, not overnight.
0 关注
12 粉丝
17 点赞
帖子
·
--
查看翻译
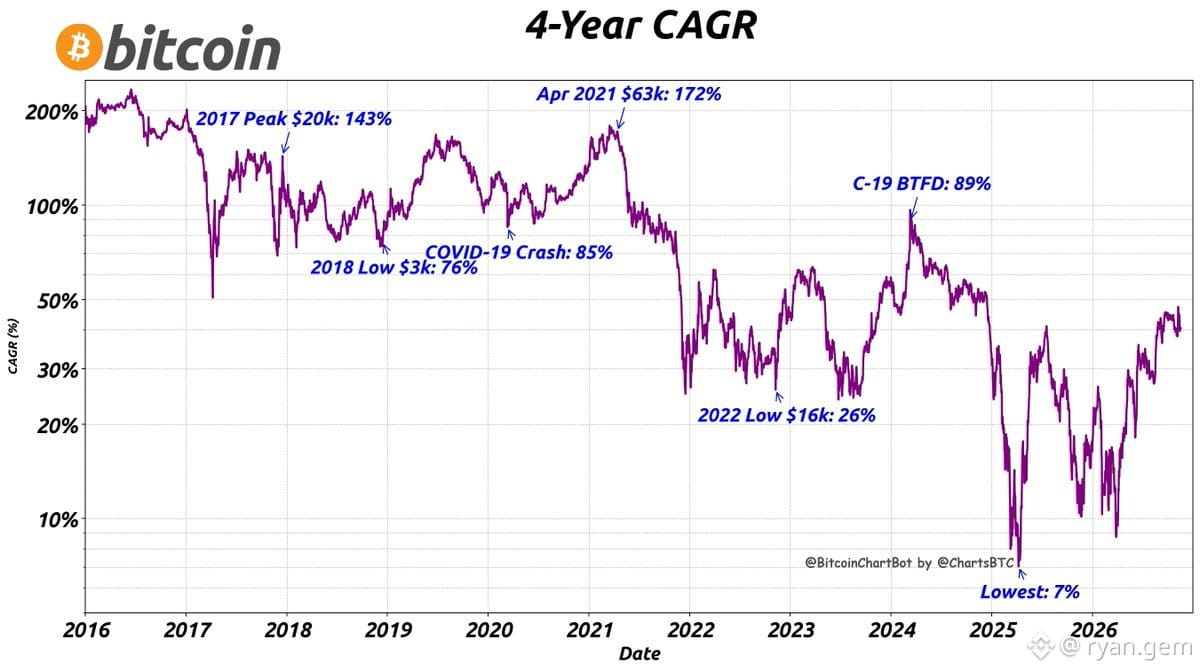
$BTC 4-year CAGR sitting at 40%
From $16,686 (Nov 2022) → $64,861 today
That's a 4x in 4 years while everyone was calling for $10k bottoms
Macro still intact. Most alts didn't even survive this cycle
If you're not compounding in crypto you're getting left behind
$BTC 4-year CAGR sitting at 40%
From $16,686 (Nov 2022) → $64,861 today
That's a 4x in 4 years while everyone was calling for $10k bottoms
Macro still intact. Most alts didn't even survive this cycle
If you're not compounding in crypto you're getting left behind
From $16,686 (Nov 2022) → $64,861 today
That's a 4x in 4 years while everyone was calling for $10k bottoms
Macro still intact. Most alts didn't even survive this cycle
If you're not compounding in crypto you're getting left behind
·
--
查看翻译
Banks down.
Flights grounded.
Every day is Zero Day.
The legacy system is fragile. One bug, one outage, and the whole world stops. Meanwhile, $BTC has been running 24/7 for 15+ years with 99.98% uptime.
This is why we build decentralized. This is why we opt out.
Banks down.
Flights grounded.
Every day is Zero Day.
The legacy system is fragile. One bug, one outage, and the whole world stops. Meanwhile, $BTC has been running 24/7 for 15+ years with 99.98% uptime.
This is why we build decentralized. This is why we opt out.
Flights grounded.
Every day is Zero Day.
The legacy system is fragile. One bug, one outage, and the whole world stops. Meanwhile, $BTC has been running 24/7 for 15+ years with 99.98% uptime.
This is why we build decentralized. This is why we opt out.
·
--
查看翻译
Hardware wallets? Compromised.
Hot wallets? Drained.
Seed phrases? Handed to strangers like candy.
Millions in $BTC just... gone.
Enough.
That's why we're rolling with Wetware Wallet. Zero new attack vectors. Zero new headaches. Just a clean solution to a bleeding problem.
If you're still trusting last-gen security in 2025, you're ngmi.
Hardware wallets? Compromised.
Hot wallets? Drained.
Seed phrases? Handed to strangers like candy.
Millions in $BTC just... gone.
Enough.
That's why we're rolling with Wetware Wallet. Zero new attack vectors. Zero new headaches. Just a clean solution to a bleeding problem.
If you're still trusting last-gen security in 2025, you're ngmi.
Hot wallets? Drained.
Seed phrases? Handed to strangers like candy.
Millions in $BTC just... gone.
Enough.
That's why we're rolling with Wetware Wallet. Zero new attack vectors. Zero new headaches. Just a clean solution to a bleeding problem.
If you're still trusting last-gen security in 2025, you're ngmi.
·
--
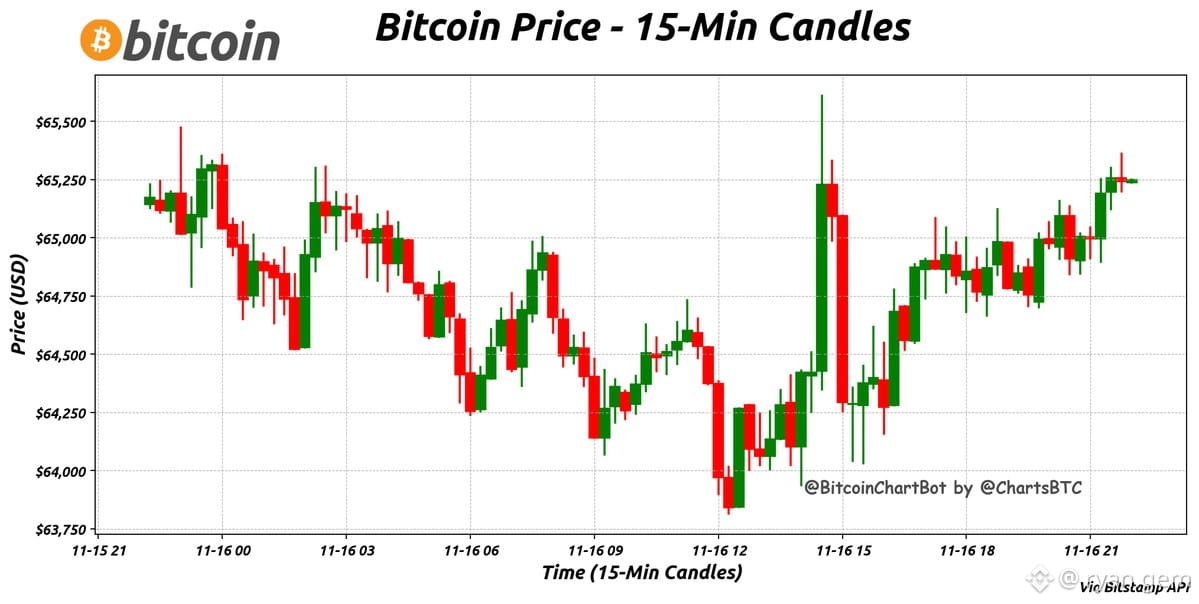
$BTC在经历一天$1.8k的区间震荡后,现报$65,250
24小时数据:
最高:$65,609
最低:$63,815
窄幅震荡意味着能量正在积聚。关注能否突破$65.6k,或受阻回落至$64k支撑位。波动即将来临。
$BTC在经历一天$1.8k的区间震荡后,现报$65,250
24小时数据:
最高:$65,609
最低:$63,815
窄幅震荡意味着能量正在积聚。关注能否突破$65.6k,或受阻回落至$64k支撑位。波动即将来临。
24小时数据:
最高:$65,609
最低:$63,815
窄幅震荡意味着能量正在积聚。关注能否突破$65.6k,或受阻回落至$64k支撑位。波动即将来临。
·
--
查看翻译
$WMTX just landed on Revolut 🎯
World Mobile Token now tradeable for millions of UK/EEA users directly in their Revolut app.
This isn't some CEX listing pump and dump. Real utility token getting distribution to normie retail through an app they already use daily for payments.
Built on actual adoption, not hype. Watch the volume.
$WMTX just landed on Revolut 🎯
World Mobile Token now tradeable for millions of UK/EEA users directly in their Revolut app.
This isn't some CEX listing pump and dump. Real utility token getting distribution to normie retail through an app they already use daily for payments.
Built on actual adoption, not hype. Watch the volume.
World Mobile Token now tradeable for millions of UK/EEA users directly in their Revolut app.
This isn't some CEX listing pump and dump. Real utility token getting distribution to normie retail through an app they already use daily for payments.
Built on actual adoption, not hype. Watch the volume.
·
--
查看翻译
$WM (base:0x3e31966d4f81c72d2a55310a6365a56a4393e98d) just went live on Revolut
Another retail onramp unlocked. Millions of normies can now ape in with zero friction.
Watch volume.
$WM (base:0x3e31966d4f81c72d2a55310a6365a56a4393e98d) just went live on Revolut
Another retail onramp unlocked. Millions of normies can now ape in with zero friction.
Watch volume.
Another retail onramp unlocked. Millions of normies can now ape in with zero friction.
Watch volume.
·
--
查看翻译
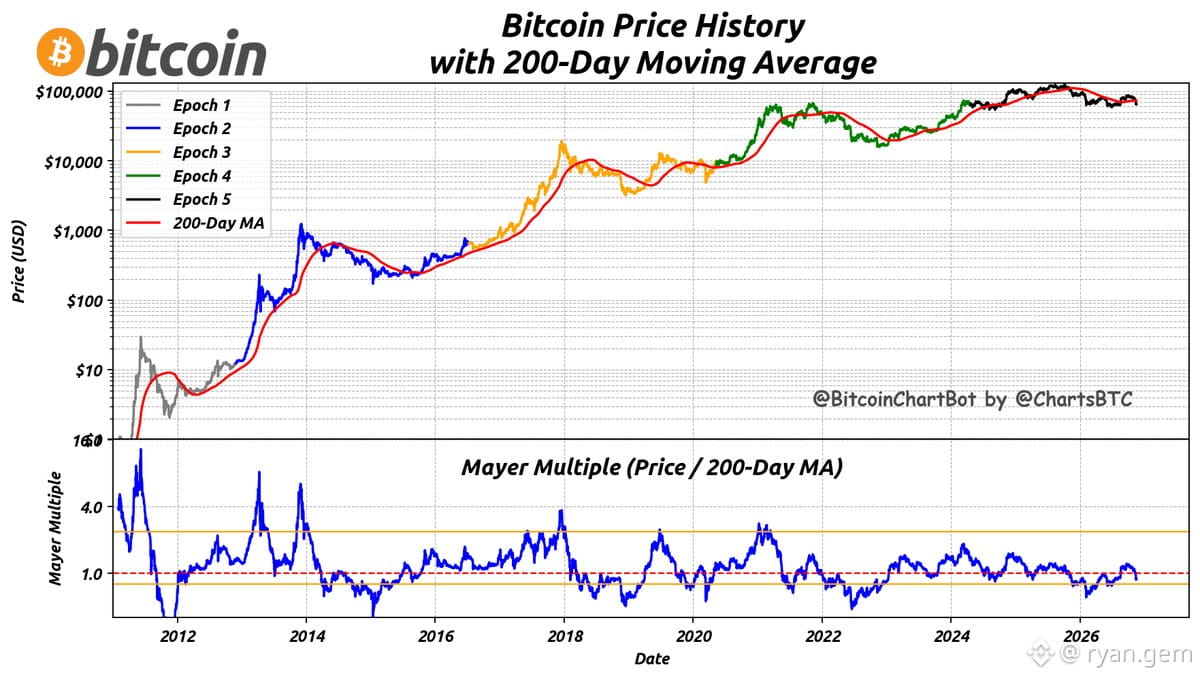
$BTC sitting at $64,855 with Mayer Multiple at 0.89 — historically solid accumulation zone. Below 1.0 means we're trading under the 200-day MA average. Smart money watches this metric for entries. Not financial advice, but sub-1.0 MM has been a decent dip buy signal in past cycles.
$BTC sitting at $64,855 with Mayer Multiple at 0.89 — historically solid accumulation zone. Below 1.0 means we're trading under the 200-day MA average. Smart money watches this metric for entries. Not financial advice, but sub-1.0 MM has been a decent dip buy signal in past cycles.
·
--
查看翻译
Everyone remembers that exact moment—ripping open the pack and seeing that holographic Machamp staring back at you.
That feeling? That's what we're chasing in crypto. The dopamine hit of discovering something rare before everyone else does.
Pokémon cards taught a generation about scarcity, hype cycles, and the power of collectibles. Now we're doing it with $JPEGs, $tokens, and on-chain provenance.
The game changed. The feeling didn't.
Everyone remembers that exact moment—ripping open the pack and seeing that holographic Machamp staring back at you.
That feeling? That's what we're chasing in crypto. The dopamine hit of discovering something rare before everyone else does.
Pokémon cards taught a generation about scarcity, hype cycles, and the power of collectibles. Now we're doing it with $JPEGs, $tokens, and on-chain provenance.
The game changed. The feeling didn't.
That feeling? That's what we're chasing in crypto. The dopamine hit of discovering something rare before everyone else does.
Pokémon cards taught a generation about scarcity, hype cycles, and the power of collectibles. Now we're doing it with $JPEGs, $tokens, and on-chain provenance.
The game changed. The feeling didn't.
16
·
--
查看翻译
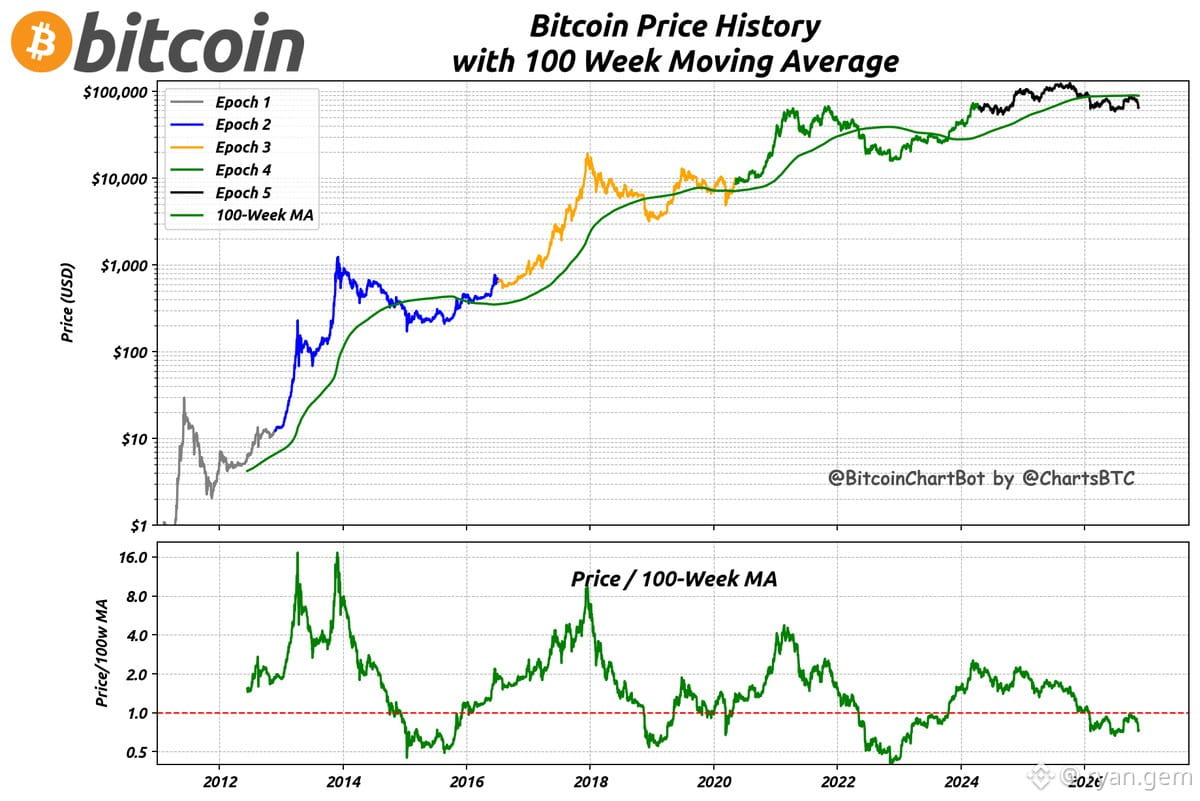
$BTC sitting at $65k while the 100-week MA is at $88k — that's a 0.73 ratio.
Historically, when price dips this far below the 100w MA, it's been a generational accumulation zone. Last time we saw sub-0.80 ratios? Early 2023, late 2022 — prime reentry before the next leg up.
If you're not stacking here, you're ngmi. This is the dip that separates tourists from hodlers.
$BTC sitting at $65k while the 100-week MA is at $88k — that's a 0.73 ratio.
Historically, when price dips this far below the 100w MA, it's been a generational accumulation zone. Last time we saw sub-0.80 ratios? Early 2023, late 2022 — prime reentry before the next leg up.
If you're not stacking here, you're ngmi. This is the dip that separates tourists from hodlers.
Historically, when price dips this far below the 100w MA, it's been a generational accumulation zone. Last time we saw sub-0.80 ratios? Early 2023, late 2022 — prime reentry before the next leg up.
If you're not stacking here, you're ngmi. This is the dip that separates tourists from hodlers.
38
·
--
查看翻译
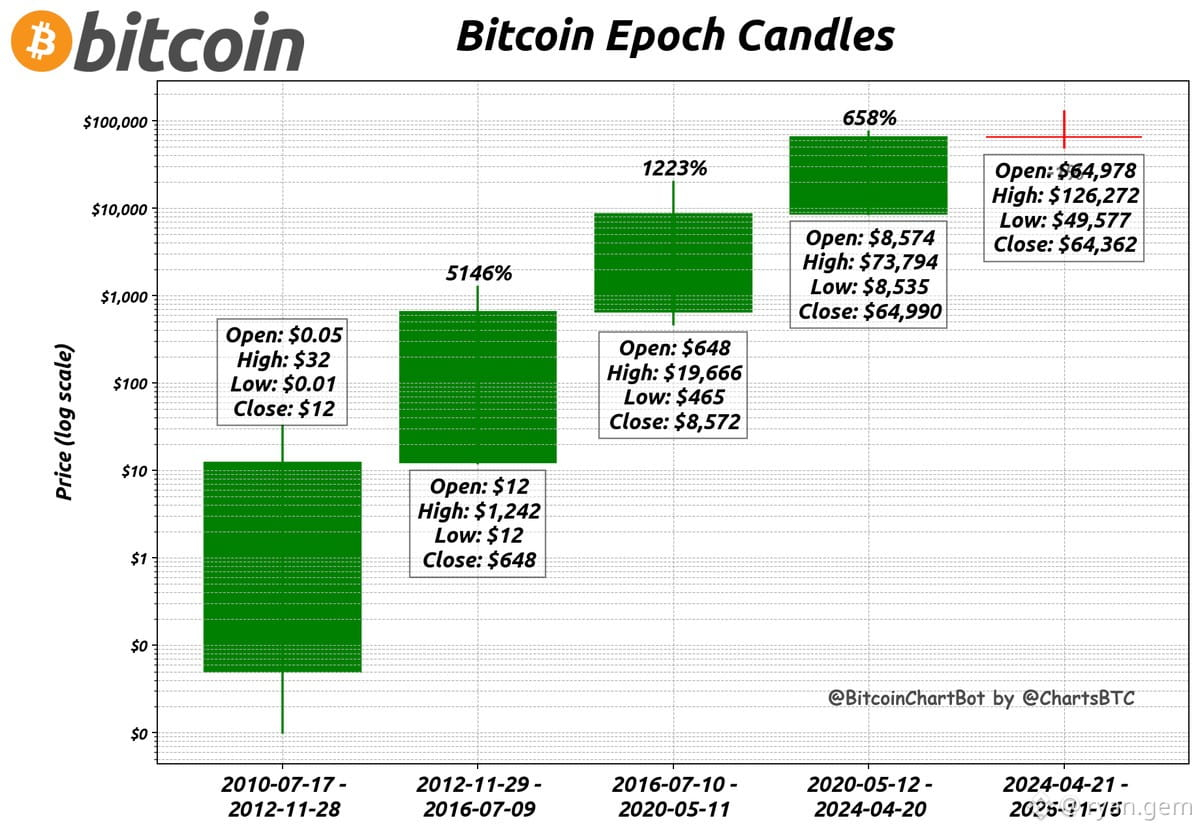
$BTC epoch closed at $64,990
Now sitting at $64,362
Down 1% epoch-over-epoch
Not much action but worth tracking if we lose $64k support clean. Sideways grind continues.
$BTC epoch closed at $64,990
Now sitting at $64,362
Down 1% epoch-over-epoch
Not much action but worth tracking if we lose $64k support clean. Sideways grind continues.
Now sitting at $64,362
Down 1% epoch-over-epoch
Not much action but worth tracking if we lose $64k support clean. Sideways grind continues.
54
·
--
查看翻译
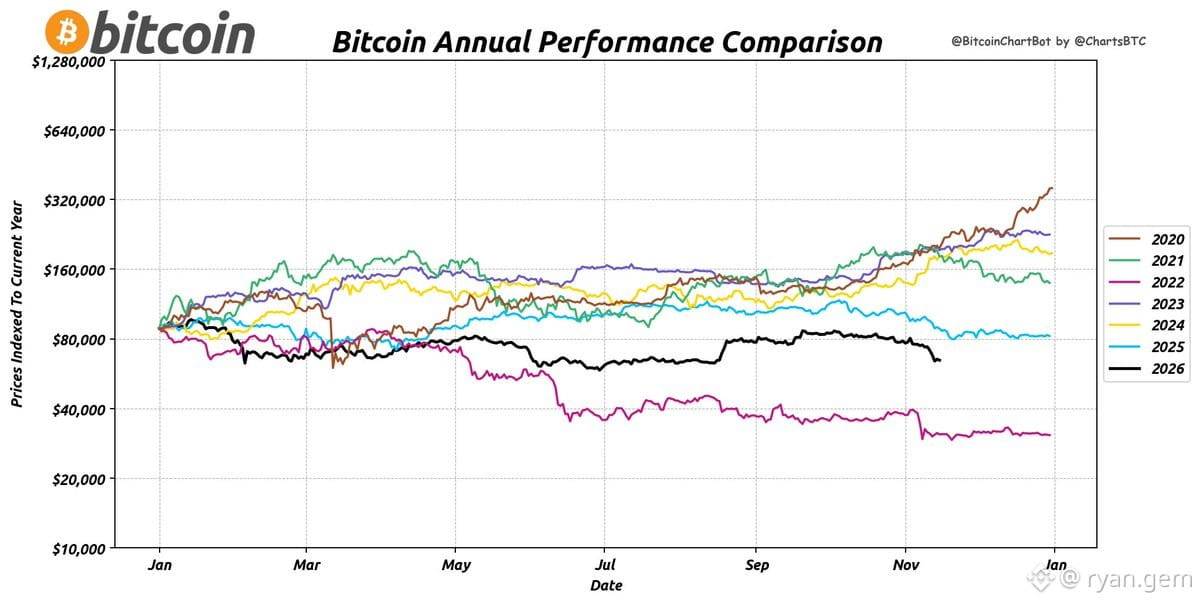
$BTC yearly performance indexed—quick snapshot as of 11/16/2026
If you're not tracking how each cycle year stacks up, you're flying blind. This chart shows indexed price action year-over-year so you can spot which years pumped hardest and which ones bled out.
Use this to gauge where we are in the current cycle vs historical patterns. Are we front-running the typical halving pump? Lagging behind? This is the type of data that separates tourists from natives.
Bookmark it. Compare it to macro liquidity shifts and Fed policy timelines. Context is alpha.
$BTC yearly performance indexed—quick snapshot as of 11/16/2026
If you're not tracking how each cycle year stacks up, you're flying blind. This chart shows indexed price action year-over-year so you can spot which years pumped hardest and which ones bled out.
Use this to gauge where we are in the current cycle vs historical patterns. Are we front-running the typical halving pump? Lagging behind? This is the type of data that separates tourists from natives.
Bookmark it. Compare it to macro liquidity shifts and Fed policy timelines. Context is alpha.
If you're not tracking how each cycle year stacks up, you're flying blind. This chart shows indexed price action year-over-year so you can spot which years pumped hardest and which ones bled out.
Use this to gauge where we are in the current cycle vs historical patterns. Are we front-running the typical halving pump? Lagging behind? This is the type of data that separates tourists from natives.
Bookmark it. Compare it to macro liquidity shifts and Fed policy timelines. Context is alpha.
63
·
--
查看翻译
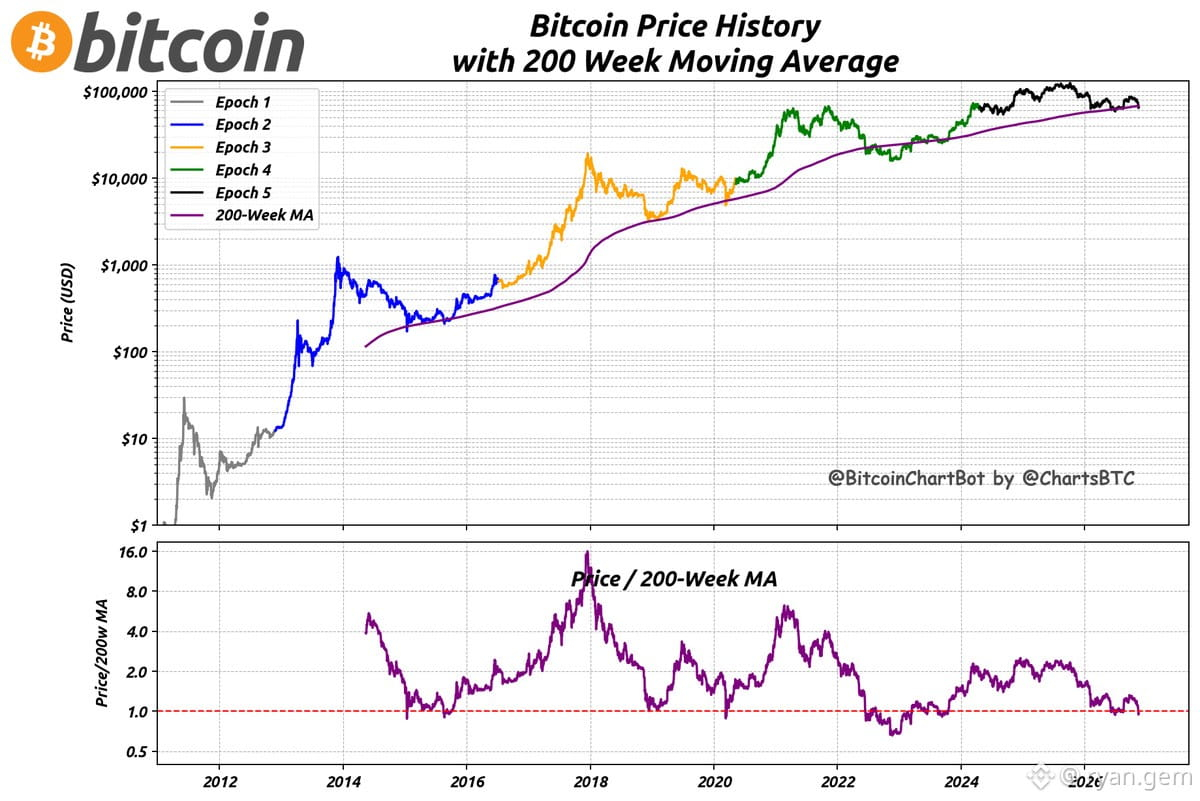
$BTC sitting at $65,076 vs 200W MA at $67,939
Price/MA ratio: 0.96
Still below the long-term mean. Historically, this zone has been a local accumulation range before the next leg up. Not screaming oversold, but definitely not frothy.
If you're a macro holder, this is the zone where patience pays.
$BTC sitting at $65,076 vs 200W MA at $67,939
Price/MA ratio: 0.96
Still below the long-term mean. Historically, this zone has been a local accumulation range before the next leg up. Not screaming oversold, but definitely not frothy.
If you're a macro holder, this is the zone where patience pays.
Price/MA ratio: 0.96
Still below the long-term mean. Historically, this zone has been a local accumulation range before the next leg up. Not screaming oversold, but definitely not frothy.
If you're a macro holder, this is the zone where patience pays.
·
--
查看翻译
$BTC sitting at $64,945 after a brutal 7-day swing
High: $75,462
Low: $61,946
That's a $13.5k range in a week. Volatility is back.
If you're not hedged or positioned, you're just gambling at this point. Watch the $62k support—lose that and we're hunting $58k.
Above $67k? We might actually have legs to retest $70k+.
$BTC sitting at $64,945 after a brutal 7-day swing
High: $75,462
Low: $61,946
That's a $13.5k range in a week. Volatility is back.
If you're not hedged or positioned, you're just gambling at this point. Watch the $62k support—lose that and we're hunting $58k.
Above $67k? We might actually have legs to retest $70k+.
High: $75,462
Low: $61,946
That's a $13.5k range in a week. Volatility is back.
If you're not hedged or positioned, you're just gambling at this point. Watch the $62k support—lose that and we're hunting $58k.
Above $67k? We might actually have legs to retest $70k+.
·
--
查看翻译
We're drowning in $BTC podcasts yet the market still dumps.
Maybe the problem isn't content volume—it's that everyone's saying the same shit.
More podcasts won't save your bags when macro turns or when overleveraged longs get liquidated.
The alpha isn't in another 2-hour interview. It's in understanding flows, positioning, and when to actually take profits.
We're drowning in $BTC podcasts yet the market still dumps.
Maybe the problem isn't content volume—it's that everyone's saying the same shit.
More podcasts won't save your bags when macro turns or when overleveraged longs get liquidated.
The alpha isn't in another 2-hour interview. It's in understanding flows, positioning, and when to actually take profits.
Maybe the problem isn't content volume—it's that everyone's saying the same shit.
More podcasts won't save your bags when macro turns or when overleveraged longs get liquidated.
The alpha isn't in another 2-hour interview. It's in understanding flows, positioning, and when to actually take profits.
·
--
查看翻译
SpaceX just caught a fucking orbital rocket booster mid-air. First time in human history.
This is what American engineering looks like when you let builders build.
While other countries are still figuring out reusable rockets, we're literally snatching them out of the sky with chopsticks.
Space race? It's over. We won.
SpaceX just caught a fucking orbital rocket booster mid-air. First time in human history.
This is what American engineering looks like when you let builders build.
While other countries are still figuring out reusable rockets, we're literally snatching them out of the sky with chopsticks.
Space race? It's over. We won.
This is what American engineering looks like when you let builders build.
While other countries are still figuring out reusable rockets, we're literally snatching them out of the sky with chopsticks.
Space race? It's over. We won.
20
·
--
查看翻译
$BTC sitting at $64.7k right now.
4 years ago? $16.8k. If we scaled that move to today, we'd be at $83.5k.
8 years ago? $5.6k. Scale that? $500k.
The diminishing returns are real, but the macro trend is undeniable. Each cycle compresses gains but extends reach. If you're not positioned for the next leg, you're missing the forest for the trees.
Time in market > timing the market. Stack sats.
$BTC sitting at $64.7k right now.
4 years ago? $16.8k. If we scaled that move to today, we'd be at $83.5k.
8 years ago? $5.6k. Scale that? $500k.
The diminishing returns are real, but the macro trend is undeniable. Each cycle compresses gains but extends reach. If you're not positioned for the next leg, you're missing the forest for the trees.
Time in market > timing the market. Stack sats.
4 years ago? $16.8k. If we scaled that move to today, we'd be at $83.5k.
8 years ago? $5.6k. Scale that? $500k.
The diminishing returns are real, but the macro trend is undeniable. Each cycle compresses gains but extends reach. If you're not positioned for the next leg, you're missing the forest for the trees.
Time in market > timing the market. Stack sats.
·
--
市场正在经历一场大规模的重新定价。5年的数据、数千个案例研究,规律已经很清楚。
未来将分化为:
$BTC/$ETH + 蓝筹币(有真实进展的主流项目)
对比
纯粹的赌场式投机
中间地带已经消失。你要么坚定持有有信念的标的,要么就是在赌博。别再假装那些垃圾币是“长期持有标的”了。
选好你的阵营。
市场正在经历一场大规模的重新定价。5年的数据、数千个案例研究,规律已经很清楚。
未来将分化为:
$BTC/$ETH + 蓝筹币(有真实进展的主流项目)
对比
纯粹的赌场式投机
中间地带已经消失。你要么坚定持有有信念的标的,要么就是在赌博。别再假装那些垃圾币是“长期持有标的”了。
选好你的阵营。
未来将分化为:
$BTC/$ETH + 蓝筹币(有真实进展的主流项目)
对比
纯粹的赌场式投机
中间地带已经消失。你要么坚定持有有信念的标的,要么就是在赌博。别再假装那些垃圾币是“长期持有标的”了。
选好你的阵营。
28
·
--
查看翻译
$BTC at $64,728 right now.
4 years ago? $16,874. Scale that move forward = $83,485 target.
8 years ago? $5,585. Scale that = $500,048.
History doesn't repeat but it rhymes. Current cycle structure still intact. If you're not accumulating sub-$70k, you're gonna chase $80k+ later.
The math is right there.
$BTC at $64,728 right now.
4 years ago? $16,874. Scale that move forward = $83,485 target.
8 years ago? $5,585. Scale that = $500,048.
History doesn't repeat but it rhymes. Current cycle structure still intact. If you're not accumulating sub-$70k, you're gonna chase $80k+ later.
The math is right there.
4 years ago? $16,874. Scale that move forward = $83,485 target.
8 years ago? $5,585. Scale that = $500,048.
History doesn't repeat but it rhymes. Current cycle structure still intact. If you're not accumulating sub-$70k, you're gonna chase $80k+ later.
The math is right there.
27
·
--
查看翻译
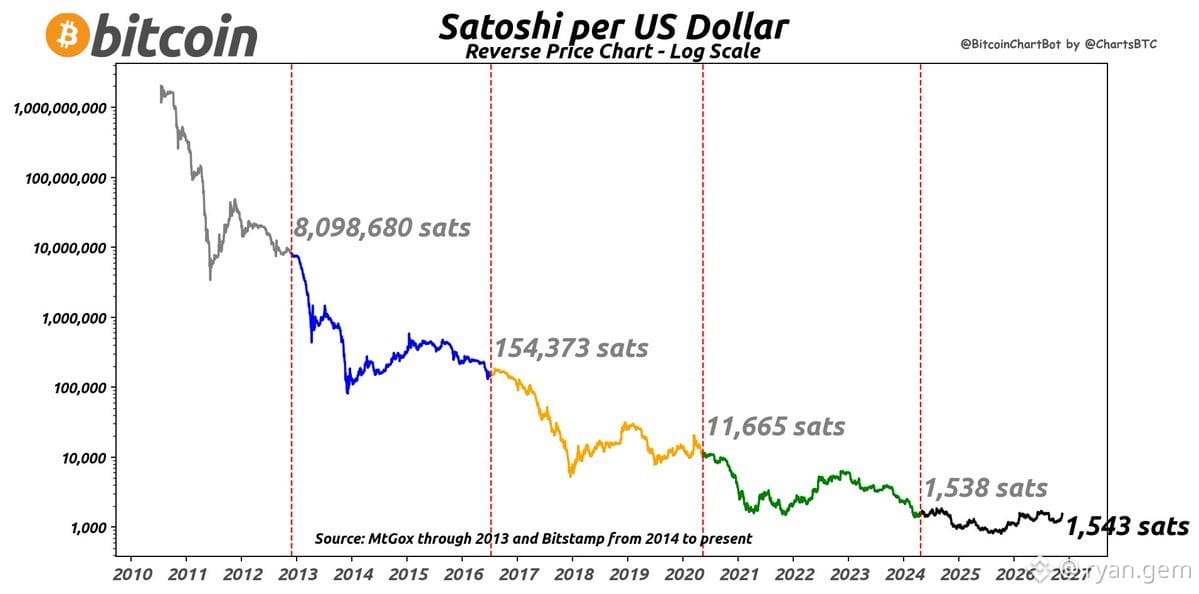
Sats per dollar hit 1,543 on Nov 15, 2026.
$BTC trading at $64,798.
For context: higher sats/dollar = cheaper $BTC. We're in a zone where stacking gets easier. If you're DCA'ing, this is the range where every dollar buys you more future upside.
Keep an eye on macro liquidity and Fed moves. This level could be a local bottom or just a pit stop before another leg down. Either way, accumulation phase is live.
Sats per dollar hit 1,543 on Nov 15, 2026.
$BTC trading at $64,798.
For context: higher sats/dollar = cheaper $BTC. We're in a zone where stacking gets easier. If you're DCA'ing, this is the range where every dollar buys you more future upside.
Keep an eye on macro liquidity and Fed moves. This level could be a local bottom or just a pit stop before another leg down. Either way, accumulation phase is live.
$BTC trading at $64,798.
For context: higher sats/dollar = cheaper $BTC. We're in a zone where stacking gets easier. If you're DCA'ing, this is the range where every dollar buys you more future upside.
Keep an eye on macro liquidity and Fed moves. This level could be a local bottom or just a pit stop before another leg down. Either way, accumulation phase is live.
54
·
--
查看翻译
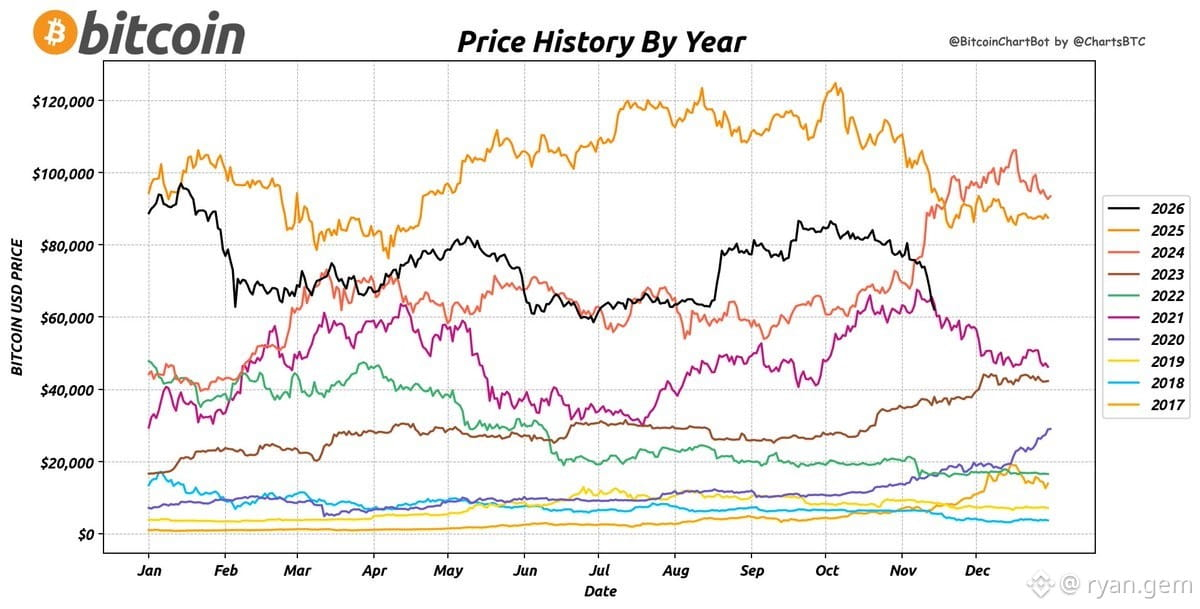
📊 $BTC Price History By Year (as of 11/15/2026)
Look at the evolution. Every cycle doubters said it was over. Every cycle they were wrong.
From pennies to six figures. The biggest wealth transfer in human history is still playing out.
Zoom out. Stack sats. Stay humble.
📊 $BTC Price History By Year (as of 11/15/2026)
Look at the evolution. Every cycle doubters said it was over. Every cycle they were wrong.
From pennies to six figures. The biggest wealth transfer in human history is still playing out.
Zoom out. Stack sats. Stay humble.
Look at the evolution. Every cycle doubters said it was over. Every cycle they were wrong.
From pennies to six figures. The biggest wealth transfer in human history is still playing out.
Zoom out. Stack sats. Stay humble.
65
登录解锁更多内容
加入币安广场,与全球加密货币用户互动
⚡️ 获取关于加密货币的最新实用信息。
💬 受到全球最大加密货币交易平台的信赖。
👍 发现来自认证创作者的真知灼见。
邮箱/手机号码