

HKTM BRO KHAN
95 Bài đăng

HKTM BRO KHAN
Báo cáo
Chặn người dùng
Giao dịch mở
Trader tần suất thấp
2 tháng
50 Đang theo dõi
8 Người theo dõi
11 Đã thích
Bài đăng
Danh mục đầu tư
Tất cả
Trích dẫn
$BTC
{spot}(BTCUSDT)
nhập requests
import matplotlib.pyplot as plt
import numpy as np
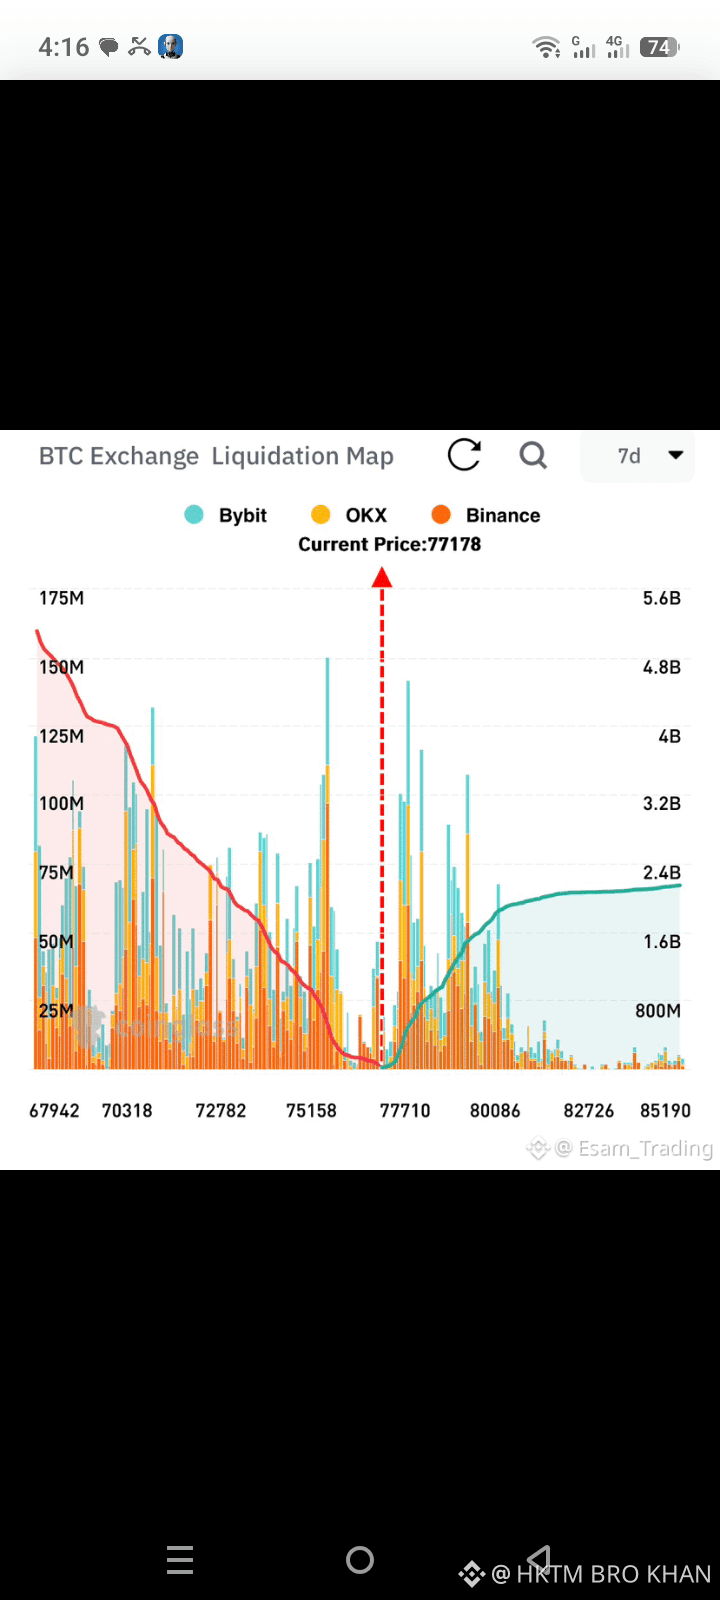
# 1. Lấy dữ liệu thanh lý từ CoinGlass API
def get_liquidation_data(symbol="BTC"):
url = "https://open-api.coinglass.com/api/futures/liquidation/chart"
headers = {"coinglass-api-key": "YOUR_API_KEY"} # Dán API key của bạn vào đây
params = {
"symbol": symbol,
"exchange": "all",
"timeType": "7d" # Dữ liệu 7 ngày như ảnh chụp màn hình của bạn
}
response = requests.get(url, headers=headers, params=params)
data = response.json()
return data['data']
# 2. Vẽ biểu đồ nhiệt thanh lý
def plot_liquidation_map(data):
prices = data['priceList'] # Các mức giá
long_liq = data['longList'] # Giá trị thanh lý Long
short_liq = data['shortList'] # Giá trị thanh lý Short
current_price = data['currentPrice']
plt.figure(figsize=(14,7))
# Vẽ thanh lý Short - Khu vực màu đỏ ở bên trái
plt.bar(prices, short_liq, color='red', alpha=0.5, label='Short Liquidations')
# Vẽ thanh lý Long - Khu vực màu xanh lá ở bên phải
plt.bar(prices, long_liq, color='green', alpha=0.5, label='Long Liquidations')
# Đường giá hiện tại
plt.axvline(x=current_price, color='red', linestyle='--', linewidth=2, label=f'Current Price: ${current_price}')
plt.title("BTC Exchange Liquidation Heatmap", fontsize=16, fontweight='bold')
plt.xlabel("BTC Price (USD)")
plt.ylabel("Liquidation Amount (USD)")
plt.legend()
plt.grid(axis='y', alpha=0.3)
plt.show()
# 3. Cách chạy
if __name__ == "__main__":
print("Đang lấy dữ liệu thanh lý BTC...")
data = get_liquidation_data("BTC")
plot_liquidation_map(data)
$BTC
nhập requests
import matplotlib.pyplot as plt
import numpy as np
# 1. Lấy dữ liệu thanh lý từ CoinGlass API
def get_liquidation_data(symbol="BTC"):
url = "https://open-api.coinglass.com/api/futures/liquidation/chart"
headers = {"coinglass-api-key": "YOUR_API_KEY"} # Dán API key của bạn vào đây
params = {
"symbol": symbol,
"exchange": "all",
"timeType": "7d" # Dữ liệu 7 ngày như ảnh chụp màn hình của bạn
}
response = requests.get(url, headers=headers, params=params)
data = response.json()
return data['data']
# 2. Vẽ biểu đồ nhiệt thanh lý
def plot_liquidation_map(data):
prices = data['priceList'] # Các mức giá
long_liq = data['longList'] # Giá trị thanh lý Long
short_liq = data['shortList'] # Giá trị thanh lý Short
current_price = data['currentPrice']
plt.figure(figsize=(14,7))
# Vẽ thanh lý Short - Khu vực màu đỏ ở bên trái
plt.bar(prices, short_liq, color='red', alpha=0.5, label='Short Liquidations')
# Vẽ thanh lý Long - Khu vực màu xanh lá ở bên phải
plt.bar(prices, long_liq, color='green', alpha=0.5, label='Long Liquidations')
# Đường giá hiện tại
plt.axvline(x=current_price, color='red', linestyle='--', linewidth=2, label=f'Current Price: ${current_price}')
plt.title("BTC Exchange Liquidation Heatmap", fontsize=16, fontweight='bold')
plt.xlabel("BTC Price (USD)")
plt.ylabel("Liquidation Amount (USD)")
plt.legend()
plt.grid(axis='y', alpha=0.3)
plt.show()
# 3. Cách chạy
if __name__ == "__main__":
print("Đang lấy dữ liệu thanh lý BTC...")
data = get_liquidation_data("BTC")
plot_liquidation_map(data)
nhập requests
import matplotlib.pyplot as plt
import numpy as np
# 1. Lấy dữ liệu thanh lý từ CoinGlass API
def get_liquidation_data(symbol="BTC"):
url = "https://open-api.coinglass.com/api/futures/liquidation/chart"
headers = {"coinglass-api-key": "YOUR_API_KEY"} # Dán API key của bạn vào đây
params = {
"symbol": symbol,
"exchange": "all",
"timeType": "7d" # Dữ liệu 7 ngày như ảnh chụp màn hình của bạn
}
response = requests.get(url, headers=headers, params=params)
data = response.json()
return data['data']
# 2. Vẽ biểu đồ nhiệt thanh lý
def plot_liquidation_map(data):
prices = data['priceList'] # Các mức giá
long_liq = data['longList'] # Giá trị thanh lý Long
short_liq = data['shortList'] # Giá trị thanh lý Short
current_price = data['currentPrice']
plt.figure(figsize=(14,7))
# Vẽ thanh lý Short - Khu vực màu đỏ ở bên trái
plt.bar(prices, short_liq, color='red', alpha=0.5, label='Short Liquidations')
# Vẽ thanh lý Long - Khu vực màu xanh lá ở bên phải
plt.bar(prices, long_liq, color='green', alpha=0.5, label='Long Liquidations')
# Đường giá hiện tại
plt.axvline(x=current_price, color='red', linestyle='--', linewidth=2, label=f'Current Price: ${current_price}')
plt.title("BTC Exchange Liquidation Heatmap", fontsize=16, fontweight='bold')
plt.xlabel("BTC Price (USD)")
plt.ylabel("Liquidation Amount (USD)")
plt.legend()
plt.grid(axis='y', alpha=0.3)
plt.show()
# 3. Cách chạy
if __name__ == "__main__":
print("Đang lấy dữ liệu thanh lý BTC...")
data = get_liquidation_data("BTC")
plot_liquidation_map(data)
86
$BTC
{spot}(BTCUSDT)
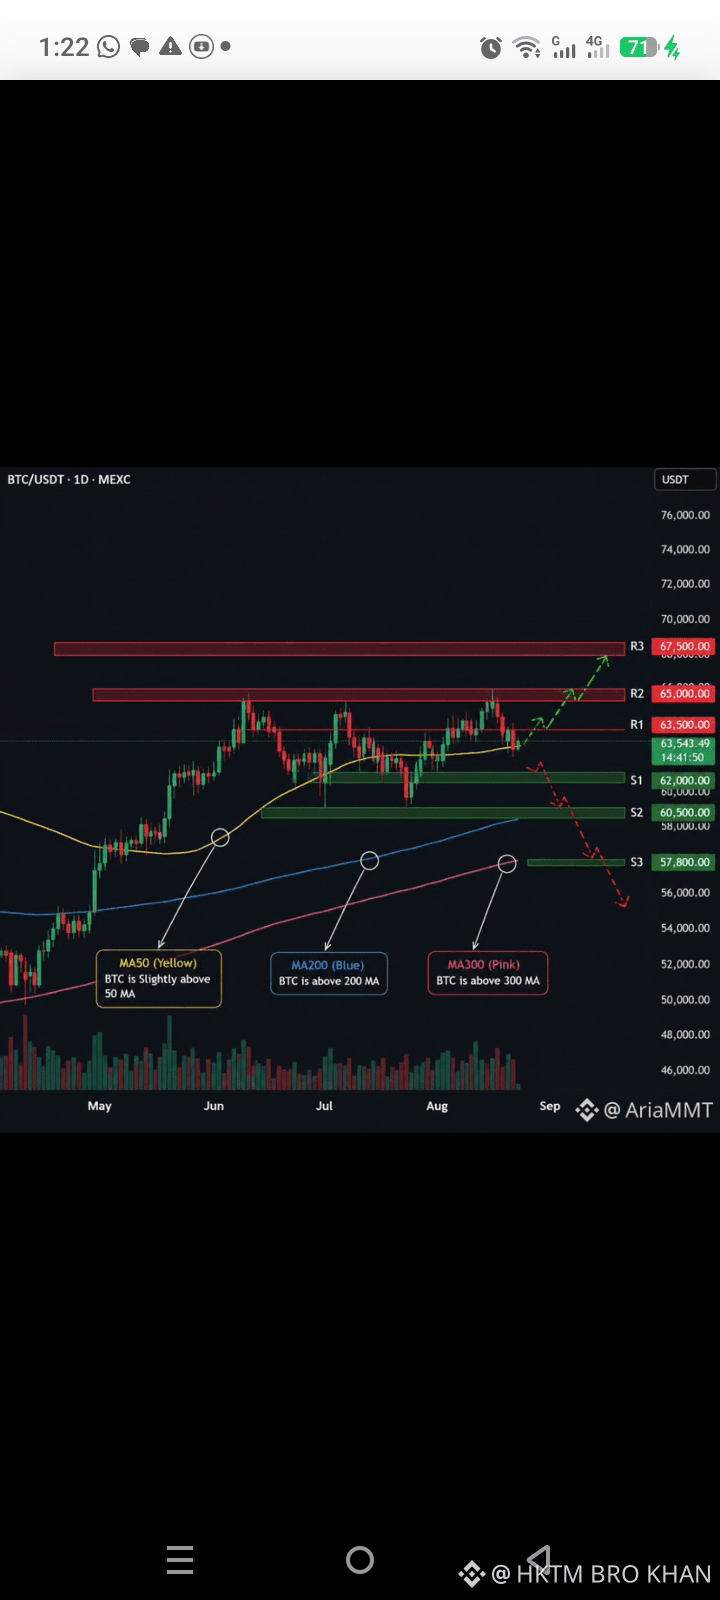
Cập nhật biểu đồ BTC hàng ngày 📊
Giá: $63,543 | Nằm trên MA50, MA200, MA300 ✅
Các mục tiêu tiếp theo:
R1: $63,500
R2: $65,000
R3: $67,500 🚀
Nếu chúng ta vượt R2, mục tiêu tiếp theo sẽ là $67.5K.
Hỗ trợ đang giữ vững ở mức $62K.
Bạn đặt mục tiêu BTC tháng này là gì? 👇
#BTC #Crypto #USStorageStocksExtendLosses
$BTC
Cập nhật biểu đồ BTC hàng ngày 📊
Giá: $63,543 | Nằm trên MA50, MA200, MA300 ✅
Các mục tiêu tiếp theo:
R1: $63,500
R2: $65,000
R3: $67,500 🚀
Nếu chúng ta vượt R2, mục tiêu tiếp theo sẽ là $67.5K.
Hỗ trợ đang giữ vững ở mức $62K.
Bạn đặt mục tiêu BTC tháng này là gì? 👇
#BTC #Crypto #USStorageStocksExtendLosses
Cập nhật biểu đồ BTC hàng ngày 📊
Giá: $63,543 | Nằm trên MA50, MA200, MA300 ✅
Các mục tiêu tiếp theo:
R1: $63,500
R2: $65,000
R3: $67,500 🚀
Nếu chúng ta vượt R2, mục tiêu tiếp theo sẽ là $67.5K.
Hỗ trợ đang giữ vững ở mức $62K.
Bạn đặt mục tiêu BTC tháng này là gì? 👇
#BTC #Crypto #USStorageStocksExtendLosses
38
$ETH
{spot}(ETHUSDT)
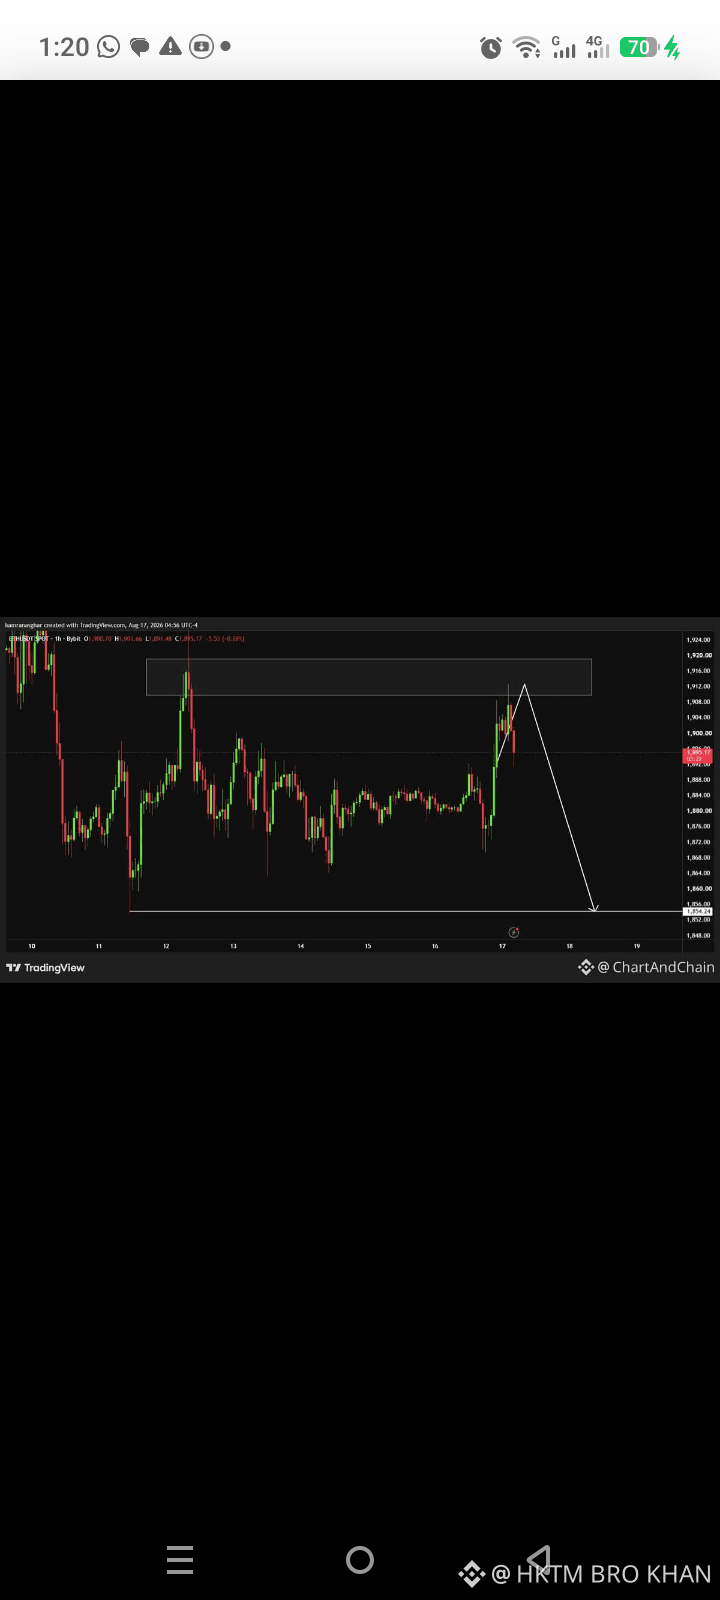
ETH bị từ chối tại vùng kháng cự 2.120 USD ❌
Giao dịch theo biên độ trong nhiều ngày, giờ đang chờ khả năng phá vỡ.
Nếu chúng ta mất mốc này, mục tiêu tiếp theo là khu vực 1.800 USD.
Hỗ trợ quan trọng có giữ được hay sắp xảy ra phá vỡ?
Không phải lời khuyên tài chính. DYOR 👇
#BTC #Crypto #TradingView
$ETH
ETH bị từ chối tại vùng kháng cự 2.120 USD ❌
Giao dịch theo biên độ trong nhiều ngày, giờ đang chờ khả năng phá vỡ.
Nếu chúng ta mất mốc này, mục tiêu tiếp theo là khu vực 1.800 USD.
Hỗ trợ quan trọng có giữ được hay sắp xảy ra phá vỡ?
Không phải lời khuyên tài chính. DYOR 👇
#BTC #Crypto #TradingView
ETH bị từ chối tại vùng kháng cự 2.120 USD ❌
Giao dịch theo biên độ trong nhiều ngày, giờ đang chờ khả năng phá vỡ.
Nếu chúng ta mất mốc này, mục tiêu tiếp theo là khu vực 1.800 USD.
Hỗ trợ quan trọng có giữ được hay sắp xảy ra phá vỡ?
Không phải lời khuyên tài chính. DYOR 👇
#BTC #Crypto #TradingView
49
$BTC
{future}(BTCUSDT)
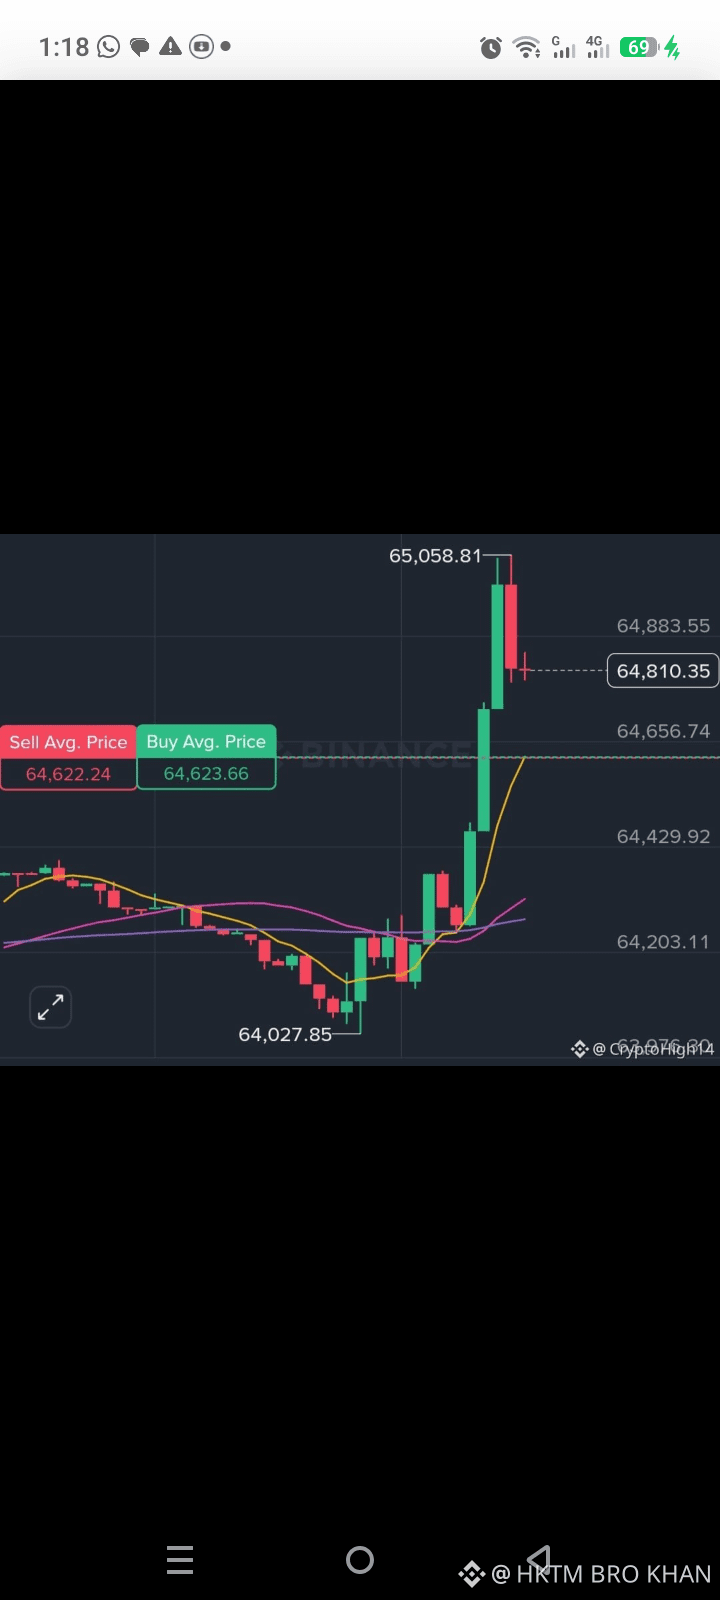
Bơm BTC mạnh! 📈
Thấp: $64,027.85
Cao: $65,058.81
Hiện tại: $64,810.35
Mua TB: $64,623.66 | Bán TB: $64,622.24
Có vẻ như đang có một pha bứt phá mạnh. Mục tiêu tiếp theo 65,5K?
Bạn nghĩ sao 👇
#BTC #Crypto #Trading
$BTC
Bơm BTC mạnh! 📈
Thấp: $64,027.85
Cao: $65,058.81
Hiện tại: $64,810.35
Mua TB: $64,623.66 | Bán TB: $64,622.24
Có vẻ như đang có một pha bứt phá mạnh. Mục tiêu tiếp theo 65,5K?
Bạn nghĩ sao 👇
#BTC #Crypto #Trading
Bơm BTC mạnh! 📈
Thấp: $64,027.85
Cao: $65,058.81
Hiện tại: $64,810.35
Mua TB: $64,623.66 | Bán TB: $64,622.24
Có vẻ như đang có một pha bứt phá mạnh. Mục tiêu tiếp theo 65,5K?
Bạn nghĩ sao 👇
#BTC #Crypto #Trading
78
·
--
Tăng giá
$ETH ETH đang xanh, Samsung & Apple đang đỏ 📉📈
Hôm nay ai đang thắng? Bầu chọn ngay 👇
#ETH🔥🔥🔥🔥🔥🔥
{spot}(ETHUSDT)
$SAMSUNGEM ETH đang xanh, Samsung & Apple đang đỏ 📉📈
Hôm nay ai đang thắng? Bầu chọn ngay 👇
#ETH #AAPL #SAMSUNGEMUSDT
{future}(SAMSUNGEMUSDT)
$AAPL.US ETH đang xanh, Samsung & Apple đang đỏ 📉📈
Hôm nay ai đang thắng? Bầu chọn ngay 👇
#AAPL
{stock_us}(AAPL.US)
$ETH ETH đang xanh, Samsung & Apple đang đỏ 📉📈
Hôm nay ai đang thắng? Bầu chọn ngay 👇
#ETH🔥🔥🔥🔥🔥🔥
$SAMSUNGEM ETH đang xanh, Samsung & Apple đang đỏ 📉📈
Hôm nay ai đang thắng? Bầu chọn ngay 👇
#ETH #AAPL #SAMSUNGEMUSDT
$AAPL.US ETH đang xanh, Samsung & Apple đang đỏ 📉📈
Hôm nay ai đang thắng? Bầu chọn ngay 👇
#AAPL
Hôm nay ai đang thắng? Bầu chọn ngay 👇
#ETH🔥🔥🔥🔥🔥🔥
$SAMSUNGEM ETH đang xanh, Samsung & Apple đang đỏ 📉📈
Hôm nay ai đang thắng? Bầu chọn ngay 👇
#ETH #AAPL #SAMSUNGEMUSDT
$AAPL.US ETH đang xanh, Samsung & Apple đang đỏ 📉📈
Hôm nay ai đang thắng? Bầu chọn ngay 👇
#AAPL
ETH
50%
Apple
0%
Samsung
50%
2 phiếu bầu • Cuộc bỏ phiếu đã kết thúc
592
$BTC
{spot}(BTCUSDT)
$ETH
{spot}(ETHUSDT)
$USDT ..................................................... CRYPTO không có liên kết, vui lòng theo dõi tôi lần tiếp theo VOTE bình luận tôi
$BTC
$ETH
$USDT ..................................................... CRYPTO không có liên kết, vui lòng theo dõi tôi lần tiếp theo VOTE bình luận tôi
$ETH
$USDT ..................................................... CRYPTO không có liên kết, vui lòng theo dõi tôi lần tiếp theo VOTE bình luận tôi
BTC VOTE
67%
ETH VOTE
33%
USDT VOTE
0%
CRYPTO VOTE
0%
3 phiếu bầu • Cuộc bỏ phiếu đã kết thúc
1
74
$ETH
{future}(ETHUSDT)
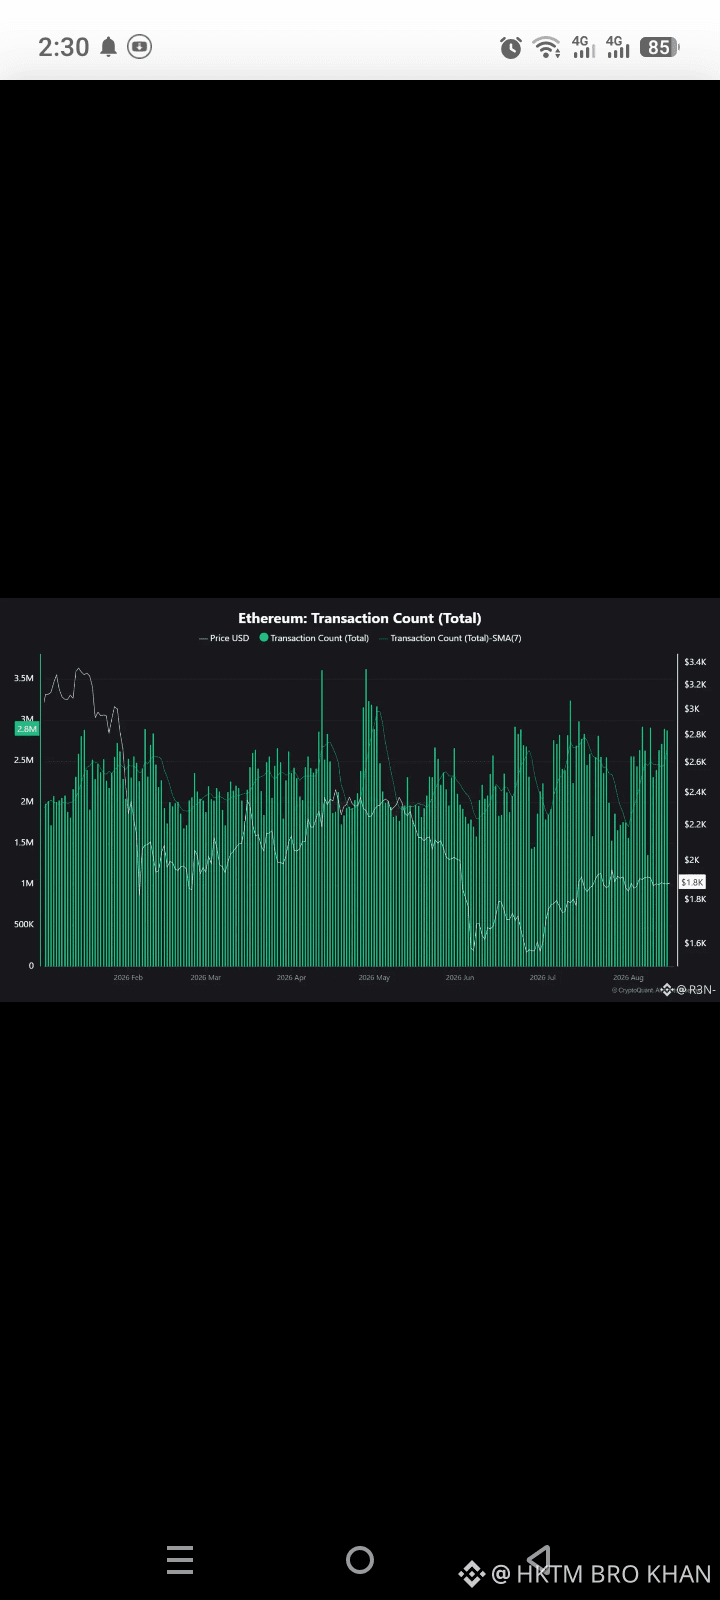
🚨 $ETH KI CÂU CHUYỆN THẬT
Năm này, ETH từ mức $3.4K đã giảm xuống $1.8K.
Nhưng mức sử dụng mạng không hề giảm.
Hãy xem so sánh giữa Tháng 1 và Tháng 8:
- Giá: giảm ~50%
- Giao dịch: từ 2M tăng lên 2.8M - 3M mỗi ngày
Giá thì đi xuống, hoạt động thì đi lên. Đây chính là sự phân kỳ.
Điều thú vị nhất là vào tháng 6.
Khi đó giá chạm đáy ở mức $1.6K và số giao dịch cũng thấp nhất.
Chỉ một lần duy nhất cả hai cùng rơi xuống.
Sau đó thì sao?
Giá hiện vẫn đang ở dưới,
nhưng mạng thì không hề ngừng hoạt động.
Người ta gọi đó là “Strong Fundamentals” (Nền tảng vững mạnh)
Bạn nghĩ sao? Giá sẽ bắt kịp mức sử dụng khi nào? 👇
#Ethereum #Crypto #ETHETFsApproved
$ETH
🚨 $ETH KI CÂU CHUYỆN THẬT
Năm này, ETH từ mức $3.4K đã giảm xuống $1.8K.
Nhưng mức sử dụng mạng không hề giảm.
Hãy xem so sánh giữa Tháng 1 và Tháng 8:
- Giá: giảm ~50%
- Giao dịch: từ 2M tăng lên 2.8M - 3M mỗi ngày
Giá thì đi xuống, hoạt động thì đi lên. Đây chính là sự phân kỳ.
Điều thú vị nhất là vào tháng 6.
Khi đó giá chạm đáy ở mức $1.6K và số giao dịch cũng thấp nhất.
Chỉ một lần duy nhất cả hai cùng rơi xuống.
Sau đó thì sao?
Giá hiện vẫn đang ở dưới,
nhưng mạng thì không hề ngừng hoạt động.
Người ta gọi đó là “Strong Fundamentals” (Nền tảng vững mạnh)
Bạn nghĩ sao? Giá sẽ bắt kịp mức sử dụng khi nào? 👇
#Ethereum #Crypto #ETHETFsApproved
🚨 $ETH KI CÂU CHUYỆN THẬT
Năm này, ETH từ mức $3.4K đã giảm xuống $1.8K.
Nhưng mức sử dụng mạng không hề giảm.
Hãy xem so sánh giữa Tháng 1 và Tháng 8:
- Giá: giảm ~50%
- Giao dịch: từ 2M tăng lên 2.8M - 3M mỗi ngày
Giá thì đi xuống, hoạt động thì đi lên. Đây chính là sự phân kỳ.
Điều thú vị nhất là vào tháng 6.
Khi đó giá chạm đáy ở mức $1.6K và số giao dịch cũng thấp nhất.
Chỉ một lần duy nhất cả hai cùng rơi xuống.
Sau đó thì sao?
Giá hiện vẫn đang ở dưới,
nhưng mạng thì không hề ngừng hoạt động.
Người ta gọi đó là “Strong Fundamentals” (Nền tảng vững mạnh)
Bạn nghĩ sao? Giá sẽ bắt kịp mức sử dụng khi nào? 👇
#Ethereum #Crypto #ETHETFsApproved
37
$AKE
{future}(AKEUSDT)
MKTM BRO KHAN
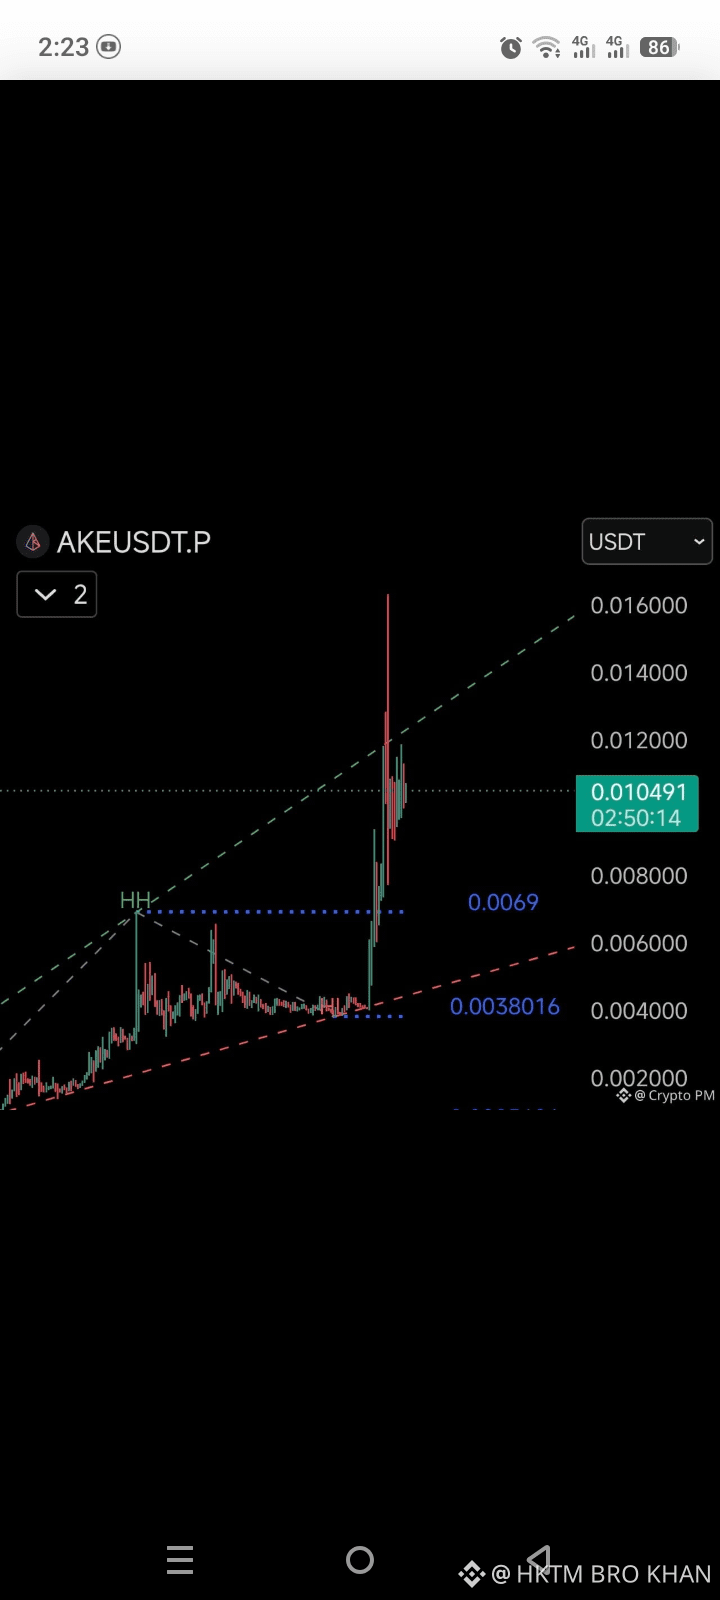
Trên biểu đồ của tôi, $AKE ka SHORT SETUP hoàn toàn rõ ràng.
Tôi đã đặt lệnh short ở mức 0.017 trước đó,
nhưng bị lệch mất một chút.
Không sao.
📌 MẸO ENTRY:
Nếu bạn cũng muốn lấy setup này thì:
- Dùng DCA
- Giữ quản lý rủi ro thật chặt chẽ
- Thiết lập sẵn Stop Loss + Take Profit
⚠️ MỨC ĐIỂM CHÍNH: 0.025
Nếu $AKE quay lại đi lên và phá vỡ 0.025
= Tất cả những người vào SHORT sẽ bị thanh lý
= Giá có thể còn tăng mạnh lên trên
Nhưng nếu giá từ đây rơi xuống dưới
= TARGET đầu tiên = 0.0038
🚨 CẢNH BÁO RỦI RO:
Hãy quản lý rủi ro của bạn và chỉ đầu tư số tiền
mà bạn có thể chịu được mức lỗ.
Chúc may mắn cho tất cả mọi người! 🙏
$AKE
MKTM BRO KHAN
Trên biểu đồ của tôi, $AKE ka SHORT SETUP hoàn toàn rõ ràng.
Tôi đã đặt lệnh short ở mức 0.017 trước đó,
nhưng bị lệch mất một chút.
Không sao.
📌 MẸO ENTRY:
Nếu bạn cũng muốn lấy setup này thì:
- Dùng DCA
- Giữ quản lý rủi ro thật chặt chẽ
- Thiết lập sẵn Stop Loss + Take Profit
⚠️ MỨC ĐIỂM CHÍNH: 0.025
Nếu $AKE quay lại đi lên và phá vỡ 0.025
= Tất cả những người vào SHORT sẽ bị thanh lý
= Giá có thể còn tăng mạnh lên trên
Nhưng nếu giá từ đây rơi xuống dưới
= TARGET đầu tiên = 0.0038
🚨 CẢNH BÁO RỦI RO:
Hãy quản lý rủi ro của bạn và chỉ đầu tư số tiền
mà bạn có thể chịu được mức lỗ.
Chúc may mắn cho tất cả mọi người! 🙏
MKTM BRO KHAN
Trên biểu đồ của tôi, $AKE ka SHORT SETUP hoàn toàn rõ ràng.
Tôi đã đặt lệnh short ở mức 0.017 trước đó,
nhưng bị lệch mất một chút.
Không sao.
📌 MẸO ENTRY:
Nếu bạn cũng muốn lấy setup này thì:
- Dùng DCA
- Giữ quản lý rủi ro thật chặt chẽ
- Thiết lập sẵn Stop Loss + Take Profit
⚠️ MỨC ĐIỂM CHÍNH: 0.025
Nếu $AKE quay lại đi lên và phá vỡ 0.025
= Tất cả những người vào SHORT sẽ bị thanh lý
= Giá có thể còn tăng mạnh lên trên
Nhưng nếu giá từ đây rơi xuống dưới
= TARGET đầu tiên = 0.0038
🚨 CẢNH BÁO RỦI RO:
Hãy quản lý rủi ro của bạn và chỉ đầu tư số tiền
mà bạn có thể chịu được mức lỗ.
Chúc may mắn cho tất cả mọi người! 🙏
61
·
--
Tăng giá
$ETH
{spot}(ETHUSDT)
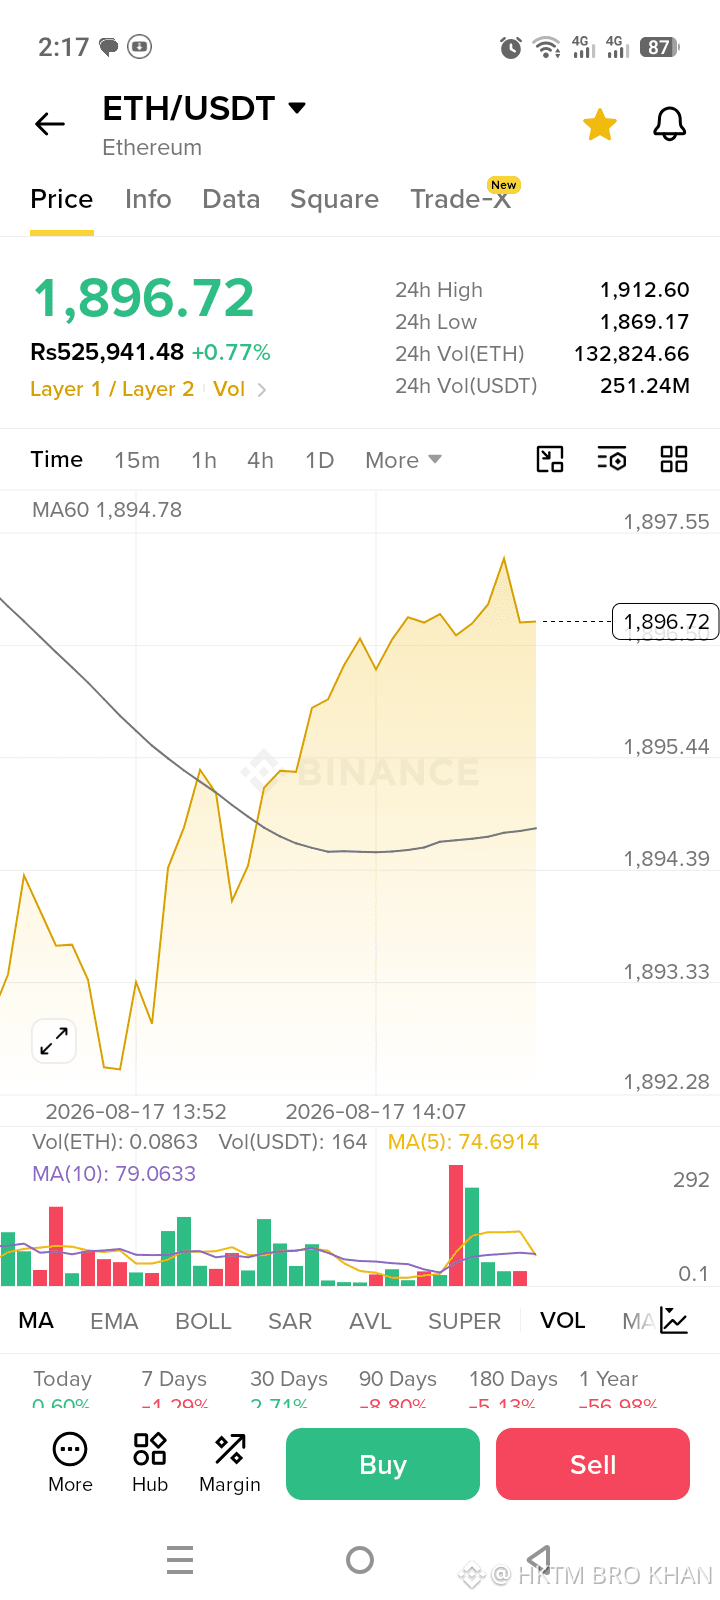
🚨 CẢNH BÁO ETH 🚨
Ethereum hiện tại ở $1,896 🔥
Trong 24 giờ tới +0.77% pump
PKR: Rs. 525,941
Liệu nó có phá mốc $2000 không? 🤔
Bình luận ngay 👇
#ETH #Ethereum #CryptoPakistan #BİNANCE 🤑🤑🤑🤑🤑🤑🤑🤑🤑🤑🤑🤑🤑🤑🤑🤑🤑🤑🤑🤑🤑🤑🤑🤑🤑🤑🤑
$ETH
🚨 CẢNH BÁO ETH 🚨
Ethereum hiện tại ở $1,896 🔥
Trong 24 giờ tới +0.77% pump
PKR: Rs. 525,941
Liệu nó có phá mốc $2000 không? 🤔
Bình luận ngay 👇
#ETH #Ethereum #CryptoPakistan #BİNANCE 🤑🤑🤑🤑🤑🤑🤑🤑🤑🤑🤑🤑🤑🤑🤑🤑🤑🤑🤑🤑🤑🤑🤑🤑🤑🤑🤑
🚨 CẢNH BÁO ETH 🚨
Ethereum hiện tại ở $1,896 🔥
Trong 24 giờ tới +0.77% pump
PKR: Rs. 525,941
Liệu nó có phá mốc $2000 không? 🤔
Bình luận ngay 👇
#ETH #Ethereum #CryptoPakistan #BİNANCE 🤑🤑🤑🤑🤑🤑🤑🤑🤑🤑🤑🤑🤑🤑🤑🤑🤑🤑🤑🤑🤑🤑🤑🤑🤑🤑🤑
62
$WLD
{spot}(WLDUSDT)
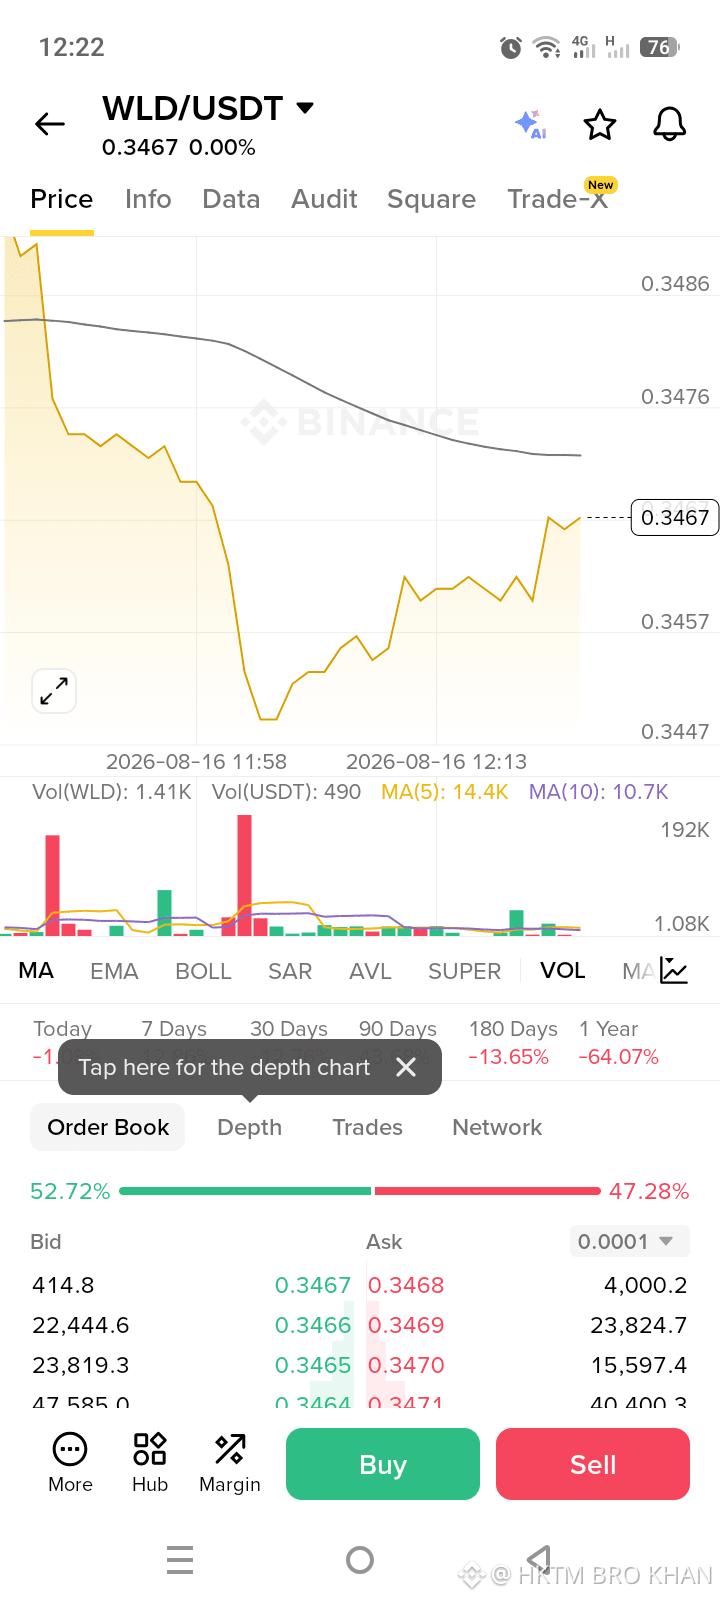
WLD/USDT Cập nhật 🔥
Giá: $0.3467
Mức thấp hôm nay: $0.3447
Phục hồi: +0.6% trong 15 phút qua
Nhìn biểu đồ thì có vẻ như WLD đã nắm được hỗ trợ.
Liệu WLD có lần nữa vượt qua $0.35 không?
Bạn nghĩ sao? Mua / Bán / Giữ 👇
#WLD #Worldcoin #Binance #CryptoPakistan
$WLD
WLD/USDT Cập nhật 🔥
Giá: $0.3467
Mức thấp hôm nay: $0.3447
Phục hồi: +0.6% trong 15 phút qua
Nhìn biểu đồ thì có vẻ như WLD đã nắm được hỗ trợ.
Liệu WLD có lần nữa vượt qua $0.35 không?
Bạn nghĩ sao? Mua / Bán / Giữ 👇
#WLD #Worldcoin #Binance #CryptoPakistan
WLD/USDT Cập nhật 🔥
Giá: $0.3467
Mức thấp hôm nay: $0.3447
Phục hồi: +0.6% trong 15 phút qua
Nhìn biểu đồ thì có vẻ như WLD đã nắm được hỗ trợ.
Liệu WLD có lần nữa vượt qua $0.35 không?
Bạn nghĩ sao? Mua / Bán / Giữ 👇
#WLD #Worldcoin #Binance #CryptoPakistan
82
$TUT
{spot}(TUTUSDT)
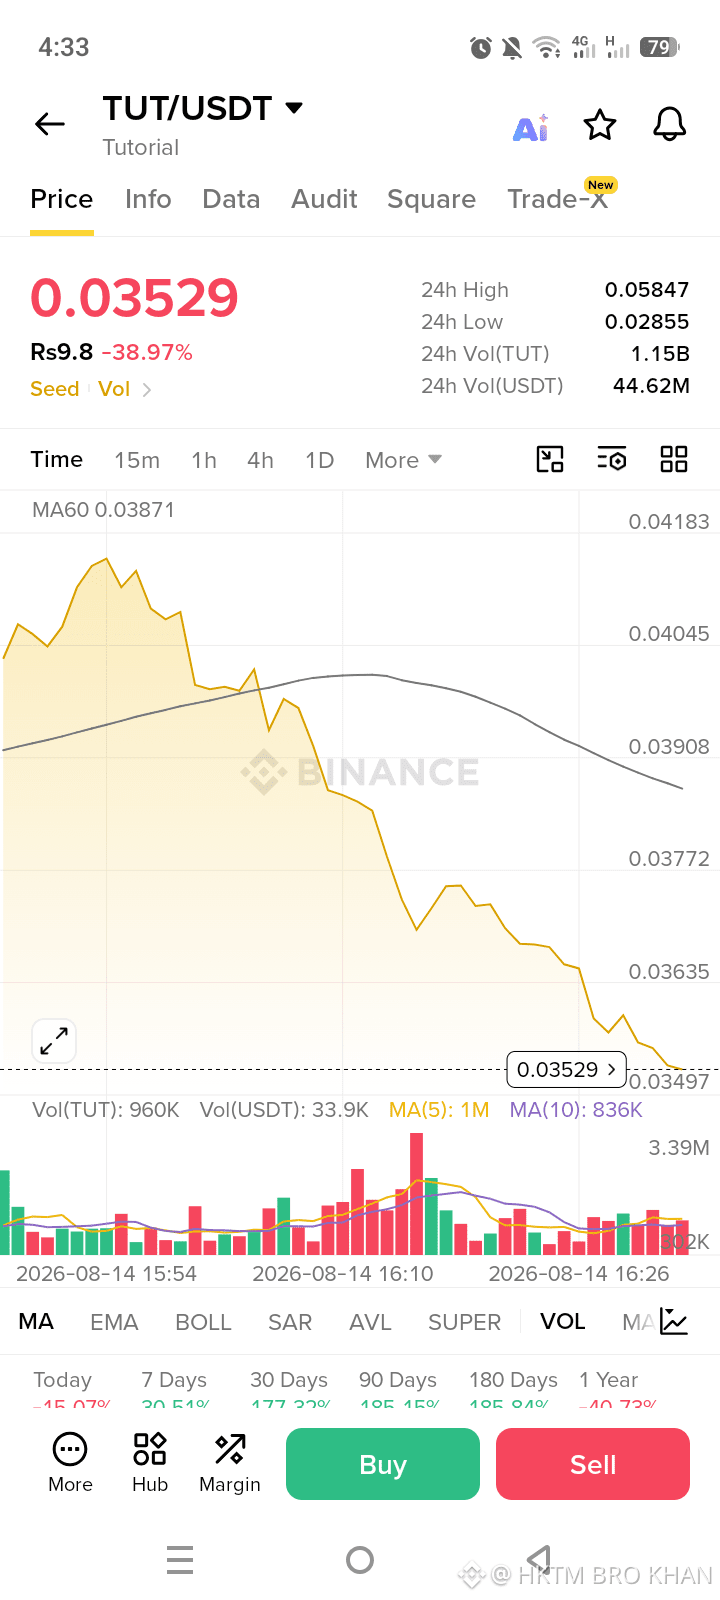
TUT/USDT aaj -38% dump 😱
Giá hiện tại là $0.035
Nó sẽ bơm từ đây hay còn rơi nữa? 🤔
Biểu đồ đang đi xuống... Rủi ro rất cao!
Lưu ý: Đây không phải là lời khuyên tài chính. Hãy tự nghiên cứu của bạn ⚠️
#Crypto #TUT #Binance #Trading #Pakistan
$TUT
TUT/USDT aaj -38% dump 😱
Giá hiện tại là $0.035
Nó sẽ bơm từ đây hay còn rơi nữa? 🤔
Biểu đồ đang đi xuống... Rủi ro rất cao!
Lưu ý: Đây không phải là lời khuyên tài chính. Hãy tự nghiên cứu của bạn ⚠️
#Crypto #TUT #Binance #Trading #Pakistan
TUT/USDT aaj -38% dump 😱
Giá hiện tại là $0.035
Nó sẽ bơm từ đây hay còn rơi nữa? 🤔
Biểu đồ đang đi xuống... Rủi ro rất cao!
Lưu ý: Đây không phải là lời khuyên tài chính. Hãy tự nghiên cứu của bạn ⚠️
#Crypto #TUT #Binance #Trading #Pakistan
72
$BTC
{spot}(BTCUSDT)
---
**🚀 Cơ hội giao dịch BTC/USDT! 🚀**
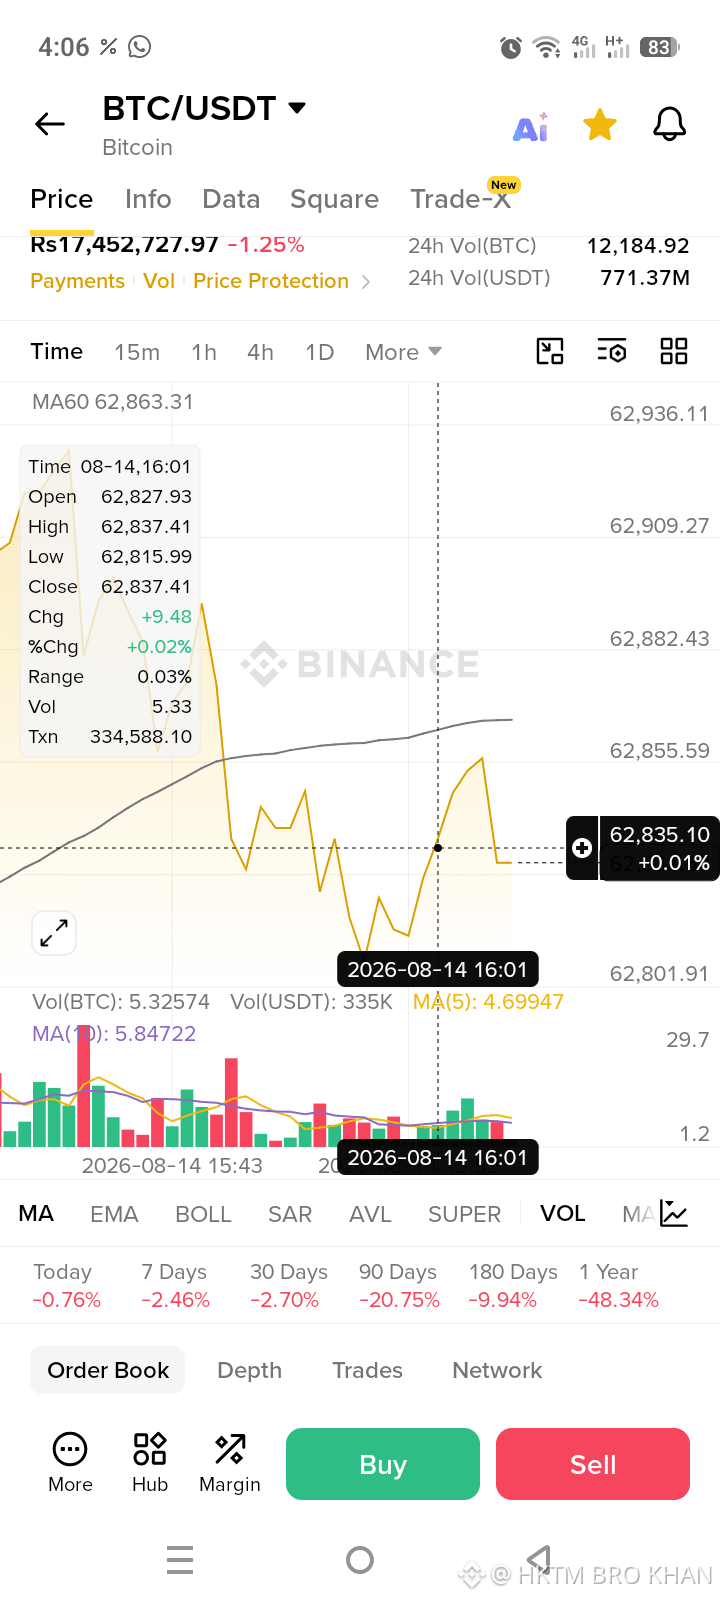
👀 Giá hiện tại: 29,500 USDT
📈 Mục tiêu: 30,500 USDT
🔽 Cắt lỗ: 28,800 USDT
**Thiết lập giao dịch:**
1. Vào lệnh quanh 29,400 USDT
2. Theo dõi chặt chẽ xu hướng thị trường
3. Điều chỉnh mức cắt lỗ khi cần
**Tuyên bố từ chối trách nhiệm:** Giao dịch tiền mã hóa có rủi ro. Vui lòng tự nghiên cứu trước khi thực hiện bất kỳ giao dịch nào.
$BTC
---
**🚀 Cơ hội giao dịch BTC/USDT! 🚀**
👀 Giá hiện tại: 29,500 USDT
📈 Mục tiêu: 30,500 USDT
🔽 Cắt lỗ: 28,800 USDT
**Thiết lập giao dịch:**
1. Vào lệnh quanh 29,400 USDT
2. Theo dõi chặt chẽ xu hướng thị trường
3. Điều chỉnh mức cắt lỗ khi cần
**Tuyên bố từ chối trách nhiệm:** Giao dịch tiền mã hóa có rủi ro. Vui lòng tự nghiên cứu trước khi thực hiện bất kỳ giao dịch nào.
---
**🚀 Cơ hội giao dịch BTC/USDT! 🚀**
👀 Giá hiện tại: 29,500 USDT
📈 Mục tiêu: 30,500 USDT
🔽 Cắt lỗ: 28,800 USDT
**Thiết lập giao dịch:**
1. Vào lệnh quanh 29,400 USDT
2. Theo dõi chặt chẽ xu hướng thị trường
3. Điều chỉnh mức cắt lỗ khi cần
**Tuyên bố từ chối trách nhiệm:** Giao dịch tiền mã hóa có rủi ro. Vui lòng tự nghiên cứu trước khi thực hiện bất kỳ giao dịch nào.
1
84
#SpaceXRisesNearly12%Intraday bbybbybniugd😙😘😌😗😙🥳😁🥳🥲😁🥳😘😁🥳
#SpaceXRisesNearly12%Intraday bbybbybniugd😙😘😌😗😙🥳😁🥳🥲😁🥳😘😁🥳
8
$HOME
{spot}(HOMEUSDT)
$HOME import time
import pandas as pd
import ta
from binance.client import Client
# HOME/USDT Bot
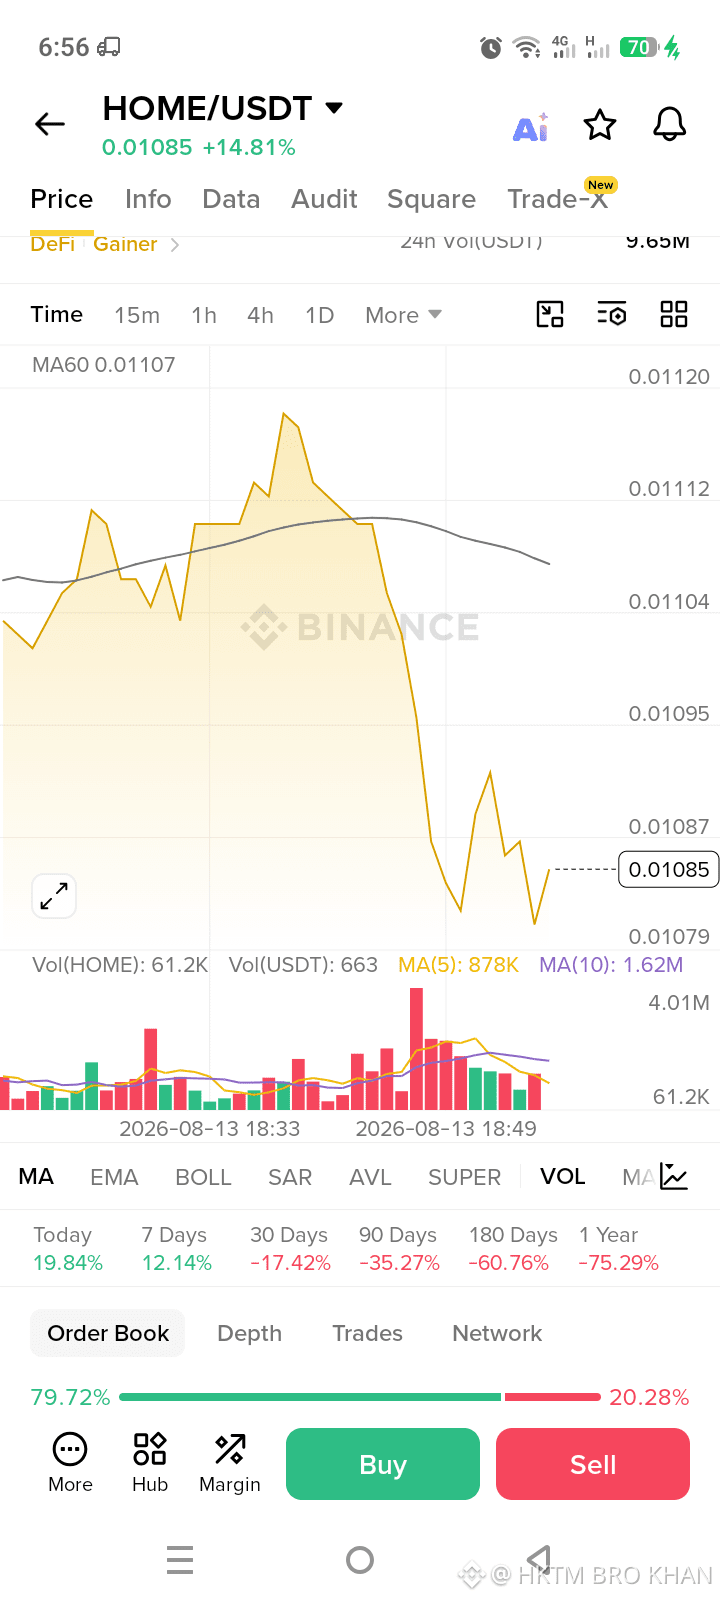
# Giá: 0.01085 (+14.81%)
# Hôm nay: +19.84% | Vol: 9.65M#HomeOwnership #SpaceXRisesNearly12%Intraday #USJulyCPI&PPIDueThisWeek #SpaceXRisesNearly12%Intraday #SpaceXRisesNearly12%Intraday
$HOME
$HOME import time
import pandas as pd
import ta
from binance.client import Client
# HOME/USDT Bot
# Giá: 0.01085 (+14.81%)
# Hôm nay: +19.84% | Vol: 9.65M#HomeOwnership #SpaceXRisesNearly12%Intraday #USJulyCPI&PPIDueThisWeek #SpaceXRisesNearly12%Intraday #SpaceXRisesNearly12%Intraday
$HOME import time
import pandas as pd
import ta
from binance.client import Client
# HOME/USDT Bot
# Giá: 0.01085 (+14.81%)
# Hôm nay: +19.84% | Vol: 9.65M#HomeOwnership #SpaceXRisesNearly12%Intraday #USJulyCPI&PPIDueThisWeek #SpaceXRisesNearly12%Intraday #SpaceXRisesNearly12%Intraday
10
$BANK
{spot}(BANKUSDT)
$BANK import time
import pandas as pd
import ta
from binance.client import Client
# 1. Khóa API...
# 2. Tăng trưởng BANK/USDT
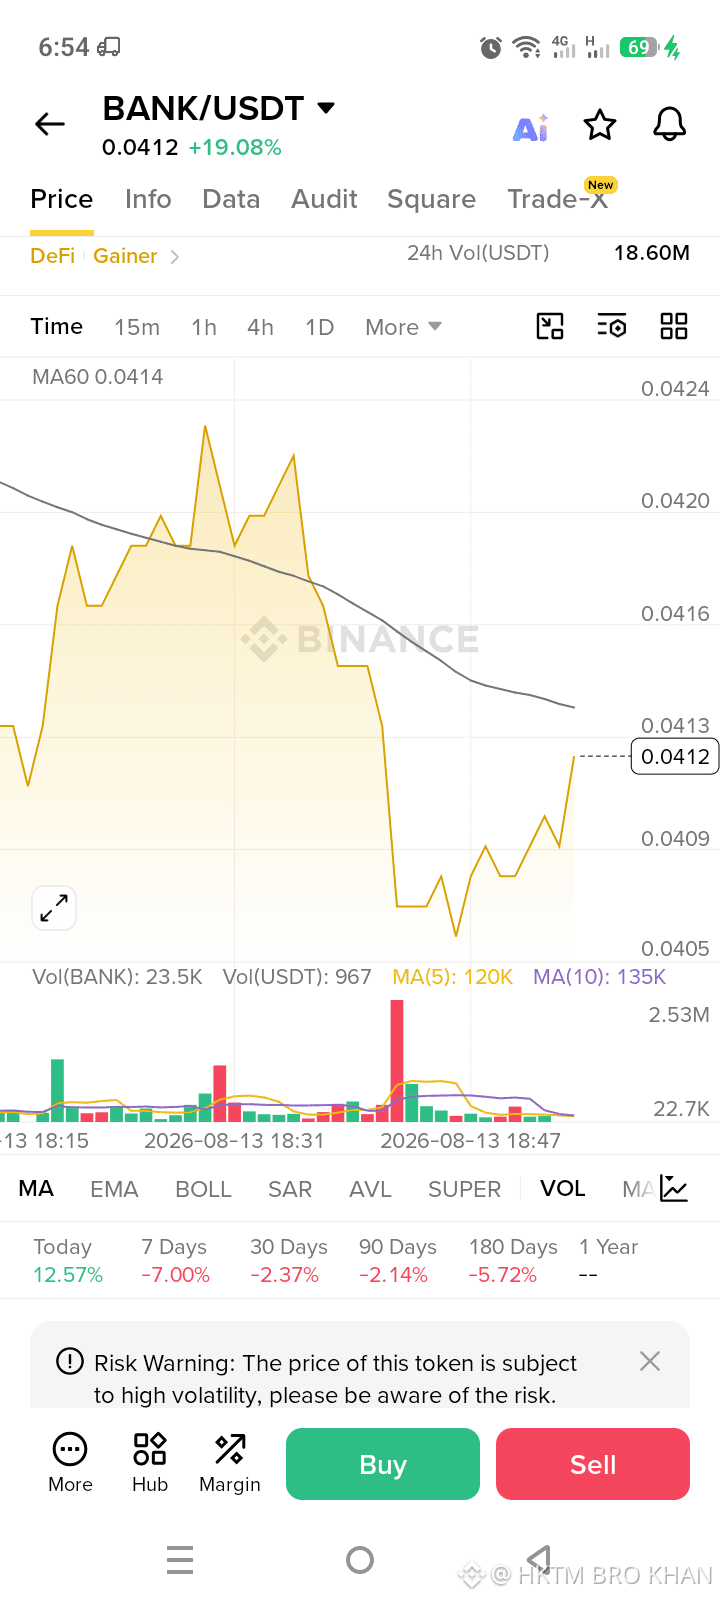
# Giá: 0.0412 (+19.08%)
# Khối lượng: 18.60M USDT
$BANK
$BANK import time
import pandas as pd
import ta
from binance.client import Client
# 1. Khóa API...
# 2. Tăng trưởng BANK/USDT
# Giá: 0.0412 (+19.08%)
# Khối lượng: 18.60M USDT
$BANK import time
import pandas as pd
import ta
from binance.client import Client
# 1. Khóa API...
# 2. Tăng trưởng BANK/USDT
# Giá: 0.0412 (+19.08%)
# Khối lượng: 18.60M USDT
88
$TRX
{spot}(TRXUSDT)
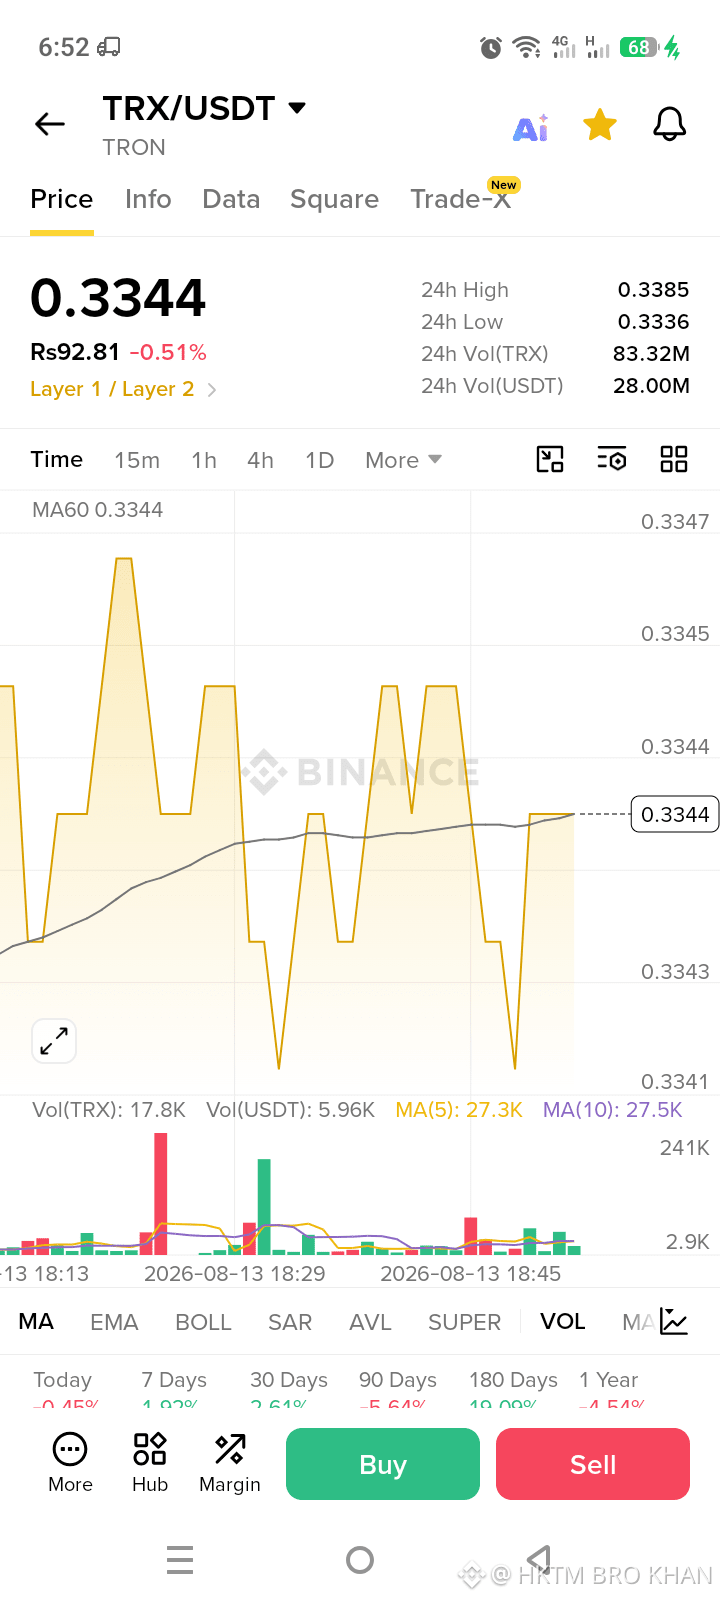
$TRX / USDT ⚡ CẬP NHẬT TRON
Giá: $0.3344 (-0.51%)
Cao nhất 24H: $0.3385
Thấp nhất 24H: $0.3336
Khối lượng 24H: 28.00M USDT
TRX bây giờ MA60 $0.3344 ở đây.
Khoảng: $0.3336 - $0.3385
Kế hoạch: Mua ở $0.3330
$TRX
$TRX / USDT ⚡ CẬP NHẬT TRON
Giá: $0.3344 (-0.51%)
Cao nhất 24H: $0.3385
Thấp nhất 24H: $0.3336
Khối lượng 24H: 28.00M USDT
TRX bây giờ MA60 $0.3344 ở đây.
Khoảng: $0.3336 - $0.3385
Kế hoạch: Mua ở $0.3330
$TRX / USDT ⚡ CẬP NHẬT TRON
Giá: $0.3344 (-0.51%)
Cao nhất 24H: $0.3385
Thấp nhất 24H: $0.3336
Khối lượng 24H: 28.00M USDT
TRX bây giờ MA60 $0.3344 ở đây.
Khoảng: $0.3336 - $0.3385
Kế hoạch: Mua ở $0.3330
13
$BNB
{future}(BNBUSDT)
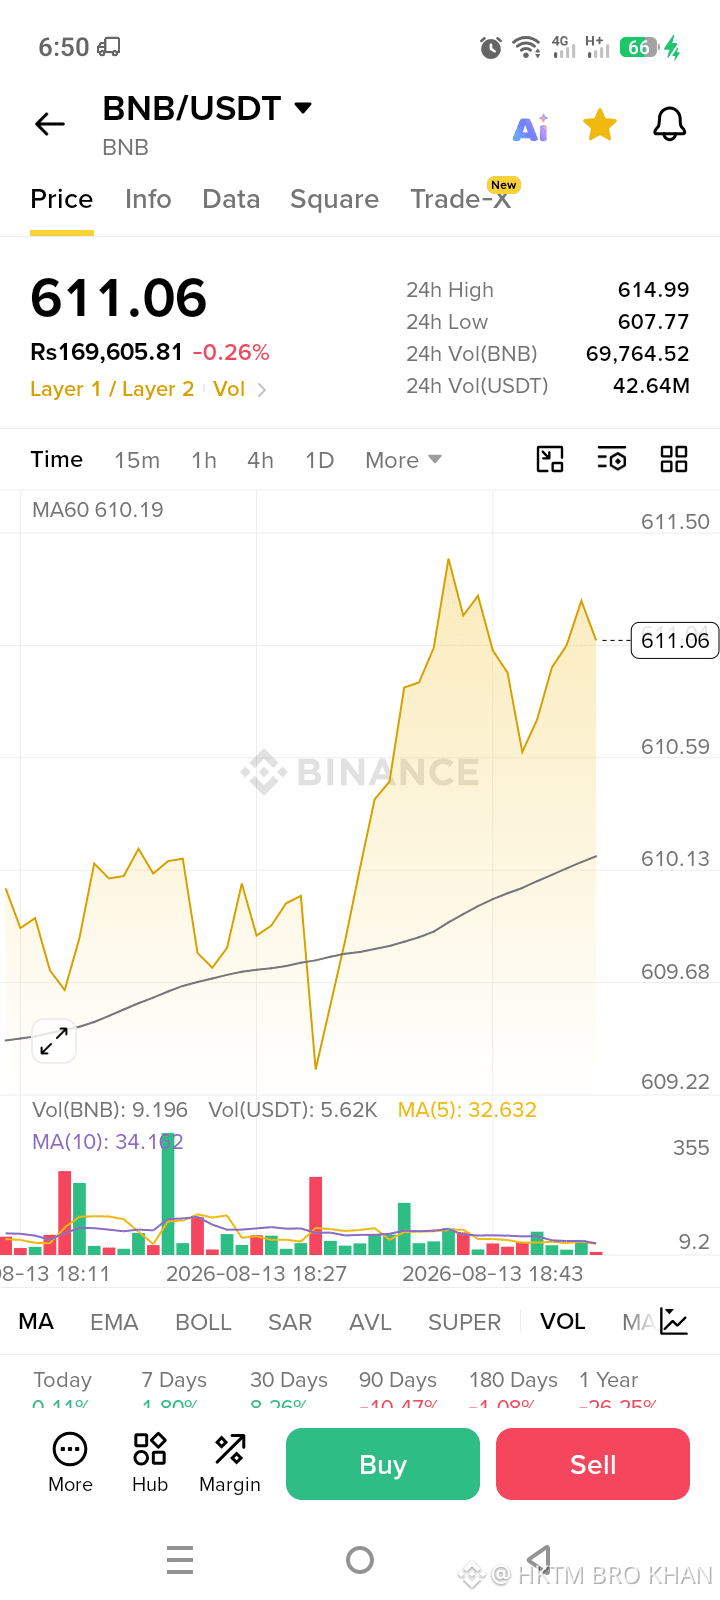
$BNB nhập thời gian
nhập pandas as pd
nhập ta
from binance.client import Client
# 1. Khóa API...
# 2. Theo dõi giá BNB/USDT
#BankOfRussiaToLimitRetailCryptoFromSep1
$BNB
$BNB nhập thời gian
nhập pandas as pd
nhập ta
from binance.client import Client
# 1. Khóa API...
# 2. Theo dõi giá BNB/USDT
#BankOfRussiaToLimitRetailCryptoFromSep1
$BNB nhập thời gian
nhập pandas as pd
nhập ta
from binance.client import Client
# 1. Khóa API...
# 2. Theo dõi giá BNB/USDT
#BankOfRussiaToLimitRetailCryptoFromSep1
18
$ZEC
{spot}(ZECUSDT)
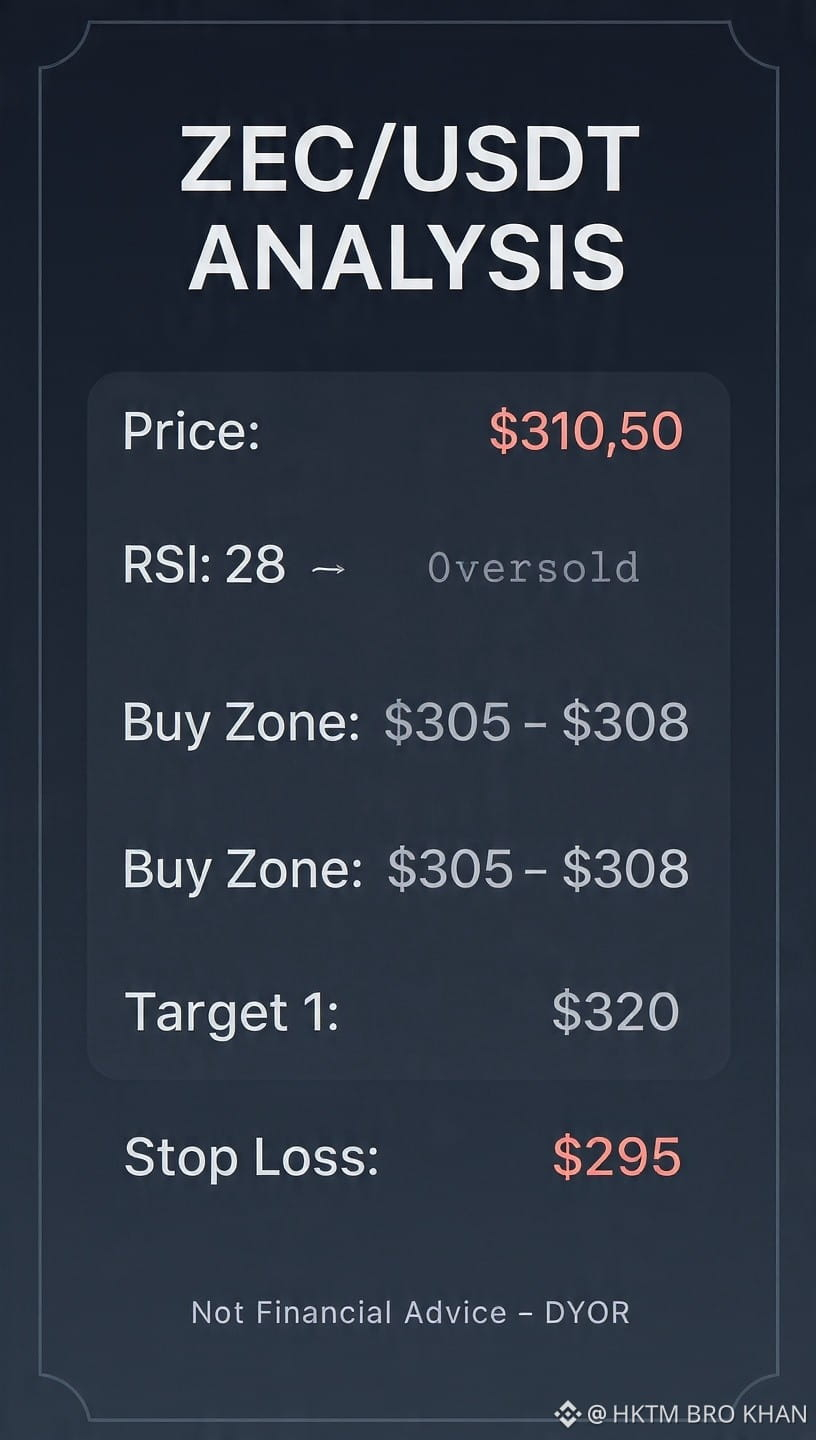
🔥 CẬP NHẬT NHANH ZEC/USDT 🔥
Giá hiện tại: $310.50
RSI: 28 → Vùng quá bán
Tín hiệu: Thiết lập khả năng bật lại
📍 Vùng vào lệnh: $305 - $308
🎯 Mục tiêu 1: $320
🎯 Mục tiêu 2: $330
🛑 Cắt lỗ: $295
Rủi ro: 1-2% hạ thấp/mua dần cho lần sau. Crypto biến động mạnh đấy.
#ZEC #ZECUSDT #Crypto #Binance #TradingSignal
$ZEC
🔥 CẬP NHẬT NHANH ZEC/USDT 🔥
Giá hiện tại: $310.50
RSI: 28 → Vùng quá bán
Tín hiệu: Thiết lập khả năng bật lại
📍 Vùng vào lệnh: $305 - $308
🎯 Mục tiêu 1: $320
🎯 Mục tiêu 2: $330
🛑 Cắt lỗ: $295
Rủi ro: 1-2% hạ thấp/mua dần cho lần sau. Crypto biến động mạnh đấy.
#ZEC #ZECUSDT #Crypto #Binance #TradingSignal
🔥 CẬP NHẬT NHANH ZEC/USDT 🔥
Giá hiện tại: $310.50
RSI: 28 → Vùng quá bán
Tín hiệu: Thiết lập khả năng bật lại
📍 Vùng vào lệnh: $305 - $308
🎯 Mục tiêu 1: $320
🎯 Mục tiêu 2: $330
🛑 Cắt lỗ: $295
Rủi ro: 1-2% hạ thấp/mua dần cho lần sau. Crypto biến động mạnh đấy.
#ZEC #ZECUSDT #Crypto #Binance #TradingSignal
108
$SAMSUNGEM
{future}(SAMSUNGEMUSDT)
nhập thời gian
nhập pandas dưới dạng pd
nhập ta
from binance.client import Client
# 1. Khóa API dalo
api_key = "TUMHARA_API_KEY"
api_secret = "TUMHARA_API_SECRET"
client = Client(api_key, api_secret)
symbol = "SAMSUNGUSDT"
quantity = 0.1 # 0.1 SAMSUNG = ~16 USDT
def get_data():
klines = client.get_klines(symbol=symbol, interval=Client.KLINE_INTERVAL_1HOUR, limit=50)
df = pd.DataFrame(klines, columns=['time','open','high','low','close','vol','c1','c2','c3','c4','c5','c6'])
df['close'] = df['close'].astype(float)
rsi = ta.momentum.RSIIndicator(df['close']).rsi().iloc[-1]
price = df['close'].iloc[-1]
return float(price), float(rsi)
while True:
price, rsi = get_data()
print(f"Giá SAMSUNG: {price} USDT | RSI: {rsi}")
# 2. Logic: Thấy rẻ thì mua, thấy đắt thì bán
if rsi < 35:
print("Tín hiệu Mua - Giá Thấp")
# order = client.order_market_buy(symbol=symbol, quantity=quantity)
elif rsi > 65:
print("Tín hiệu Bán - Giá Cao")
# order = client.order_market_sell(symbol=symbol, quantity=quantity)
time.sleep(3600) # 1 giờ sau sẽ kiểm tra
$SAMSUNGEM
nhập thời gian
nhập pandas dưới dạng pd
nhập ta
from binance.client import Client
# 1. Khóa API dalo
api_key = "TUMHARA_API_KEY"
api_secret = "TUMHARA_API_SECRET"
client = Client(api_key, api_secret)
symbol = "SAMSUNGUSDT"
quantity = 0.1 # 0.1 SAMSUNG = ~16 USDT
def get_data():
klines = client.get_klines(symbol=symbol, interval=Client.KLINE_INTERVAL_1HOUR, limit=50)
df = pd.DataFrame(klines, columns=['time','open','high','low','close','vol','c1','c2','c3','c4','c5','c6'])
df['close'] = df['close'].astype(float)
rsi = ta.momentum.RSIIndicator(df['close']).rsi().iloc[-1]
price = df['close'].iloc[-1]
return float(price), float(rsi)
while True:
price, rsi = get_data()
print(f"Giá SAMSUNG: {price} USDT | RSI: {rsi}")
# 2. Logic: Thấy rẻ thì mua, thấy đắt thì bán
if rsi < 35:
print("Tín hiệu Mua - Giá Thấp")
# order = client.order_market_buy(symbol=symbol, quantity=quantity)
elif rsi > 65:
print("Tín hiệu Bán - Giá Cao")
# order = client.order_market_sell(symbol=symbol, quantity=quantity)
time.sleep(3600) # 1 giờ sau sẽ kiểm tra
nhập thời gian
nhập pandas dưới dạng pd
nhập ta
from binance.client import Client
# 1. Khóa API dalo
api_key = "TUMHARA_API_KEY"
api_secret = "TUMHARA_API_SECRET"
client = Client(api_key, api_secret)
symbol = "SAMSUNGUSDT"
quantity = 0.1 # 0.1 SAMSUNG = ~16 USDT
def get_data():
klines = client.get_klines(symbol=symbol, interval=Client.KLINE_INTERVAL_1HOUR, limit=50)
df = pd.DataFrame(klines, columns=['time','open','high','low','close','vol','c1','c2','c3','c4','c5','c6'])
df['close'] = df['close'].astype(float)
rsi = ta.momentum.RSIIndicator(df['close']).rsi().iloc[-1]
price = df['close'].iloc[-1]
return float(price), float(rsi)
while True:
price, rsi = get_data()
print(f"Giá SAMSUNG: {price} USDT | RSI: {rsi}")
# 2. Logic: Thấy rẻ thì mua, thấy đắt thì bán
if rsi < 35:
print("Tín hiệu Mua - Giá Thấp")
# order = client.order_market_buy(symbol=symbol, quantity=quantity)
elif rsi > 65:
print("Tín hiệu Bán - Giá Cao")
# order = client.order_market_sell(symbol=symbol, quantity=quantity)
time.sleep(3600) # 1 giờ sau sẽ kiểm tra
39
Đăng nhập để khám phá thêm nội dung
Tham gia cùng người dùng tiền mã hóa toàn cầu trên Binance Square
⚡️ Nhận thông tin mới nhất và hữu ích về tiền mã hóa.
💬 Được tin cậy bởi sàn giao dịch tiền mã hóa lớn nhất thế giới.
👍 Khám phá những thông tin chuyên sâu thực tế từ những nhà sáng tạo đã xác minh.
Email / Số điện thoại