

Qaiser Mehmood Sheikh
6 Bài đăng

Qaiser Mehmood Sheikh
Báo cáo
Chặn người dùng
Giao dịch mở
2.2 tháng
2 Đang theo dõi
0 Người theo dõi
0 Đã thích
Bài đăng
Danh mục đầu tư
#dusk $DUSK @Dusk_Foundation
Trọng tâm cốt lõi của @Dusk_Foundation là xây dựng một lớp thực thi tài chính mạnh mẽ, kết hợp liền mạch giữa tuân thủ chuẩn doanh nghiệp với quyền riêng tư dựa trên zero-knowledge. Bằng cách cho phép các smart contract bảo mật, $DUSK cung cấp nền tảng hạ tầng thiết yếu cho các tài sản tài chính được quản lý và các giao dịch thanh toán an toàn trên chuỗi. Một bước nhảy vọt lớn cho tài chính coi trọng quyền riêng tư! #dusk
#dusk $DUSK @Dusk
Trọng tâm cốt lõi của @Dusk là xây dựng một lớp thực thi tài chính mạnh mẽ, kết hợp liền mạch giữa tuân thủ chuẩn doanh nghiệp với quyền riêng tư dựa trên zero-knowledge. Bằng cách cho phép các smart contract bảo mật, $DUSK cung cấp nền tảng hạ tầng thiết yếu cho các tài sản tài chính được quản lý và các giao dịch thanh toán an toàn trên chuỗi. Một bước nhảy vọt lớn cho tài chính coi trọng quyền riêng tư! #dusk
Trọng tâm cốt lõi của @Dusk là xây dựng một lớp thực thi tài chính mạnh mẽ, kết hợp liền mạch giữa tuân thủ chuẩn doanh nghiệp với quyền riêng tư dựa trên zero-knowledge. Bằng cách cho phép các smart contract bảo mật, $DUSK cung cấp nền tảng hạ tầng thiết yếu cho các tài sản tài chính được quản lý và các giao dịch thanh toán an toàn trên chuỗi. Một bước nhảy vọt lớn cho tài chính coi trọng quyền riêng tư! #dusk
63

Bài viết
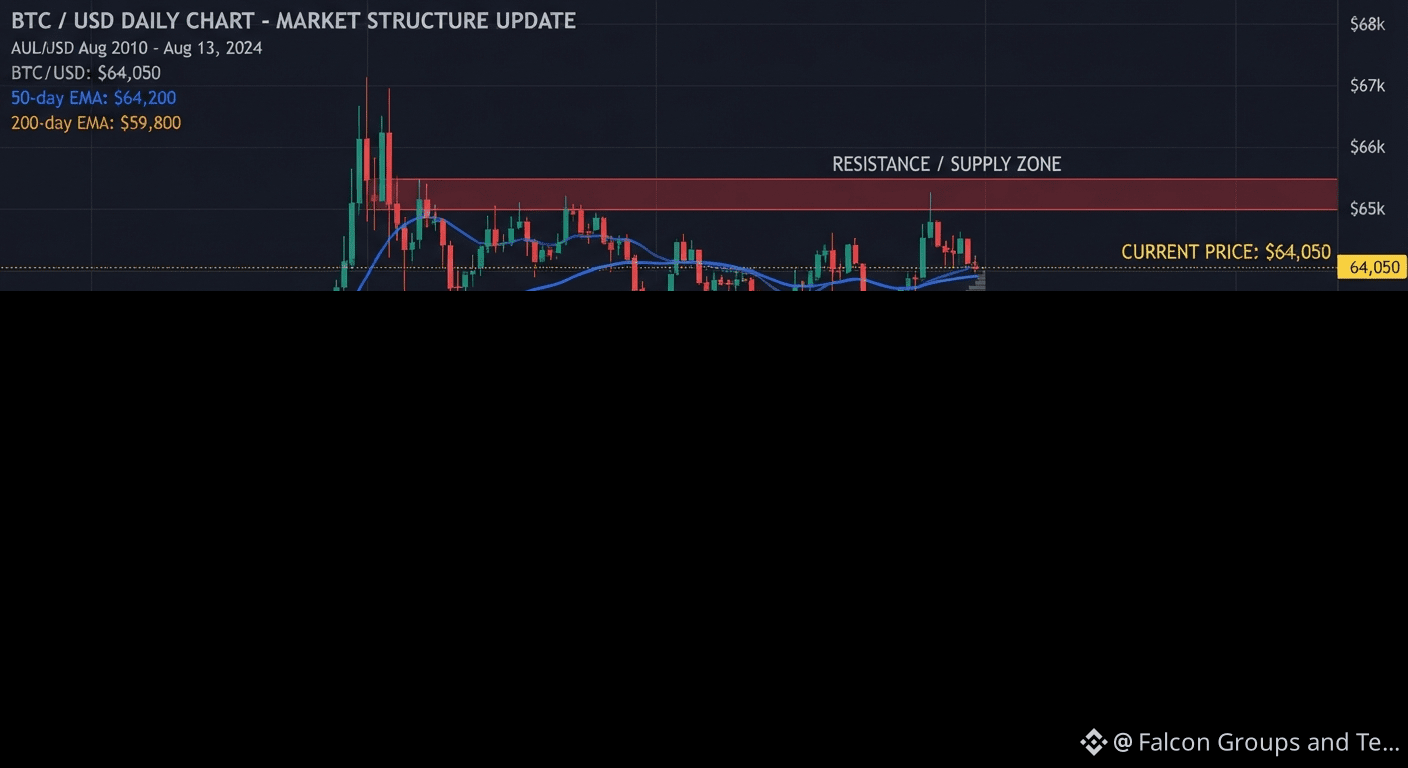
Cái Bẫy Cuối Tuần: Liệu $BTC sắp bứt phá hay sẽ “dụ” chúng ta đi ngược? 📉 📈Này anh em cộng đồng Binance Square! Khi chúng ta bước vào cuối tuần, biến động đang co hẹp trên toàn thị trường, và $BITCOIN đang nằm ngay tại một điểm quyết định lớn gần mức 64,050 USD.
Thanh khoản đang chậm lại, và điều đó thường có nghĩa là: sắp có một cú biến động mạnh. Đây là cách tôi đang nắm bắt cấu trúc thị trường hiện tại:
Kịch bản cho phe Bò: Nếu phe bò có thể bảo vệ vùng hỗ trợ 63,500 – 64,000 USD và đẩy một cây nến khối lượng lớn vượt qua 65,000 USD, thì chúng ta đang hướng tới một đợt tăng nhanh lên vùng kháng cự 66,700 – 67,500 USD.
Rủi ro cho phe Gấu: Nếu mất vùng hỗ trợ sàn ngay lập tức, có thể giá sẽ quét xuống về các đáy của khung vĩ mô gần mức 62,500 USD.
Cái Bẫy Cuối Tuần: Liệu $BTC sắp bứt phá hay sẽ “dụ” chúng ta đi ngược? 📉 📈
Này anh em cộng đồng Binance Square! Khi chúng ta bước vào cuối tuần, biến động đang co hẹp trên toàn thị trường, và $BITCOIN đang nằm ngay tại một điểm quyết định lớn gần mức 64,050 USD.
Thanh khoản đang chậm lại, và điều đó thường có nghĩa là: sắp có một cú biến động mạnh. Đây là cách tôi đang nắm bắt cấu trúc thị trường hiện tại:
Kịch bản cho phe Bò: Nếu phe bò có thể bảo vệ vùng hỗ trợ 63,500 – 64,000 USD và đẩy một cây nến khối lượng lớn vượt qua 65,000 USD, thì chúng ta đang hướng tới một đợt tăng nhanh lên vùng kháng cự 66,700 – 67,500 USD.
Rủi ro cho phe Gấu: Nếu mất vùng hỗ trợ sàn ngay lập tức, có thể giá sẽ quét xuống về các đáy của khung vĩ mô gần mức 62,500 USD.
Thanh khoản đang chậm lại, và điều đó thường có nghĩa là: sắp có một cú biến động mạnh. Đây là cách tôi đang nắm bắt cấu trúc thị trường hiện tại:
Kịch bản cho phe Bò: Nếu phe bò có thể bảo vệ vùng hỗ trợ 63,500 – 64,000 USD và đẩy một cây nến khối lượng lớn vượt qua 65,000 USD, thì chúng ta đang hướng tới một đợt tăng nhanh lên vùng kháng cự 66,700 – 67,500 USD.
Rủi ro cho phe Gấu: Nếu mất vùng hỗ trợ sàn ngay lập tức, có thể giá sẽ quét xuống về các đáy của khung vĩ mô gần mức 62,500 USD.
99
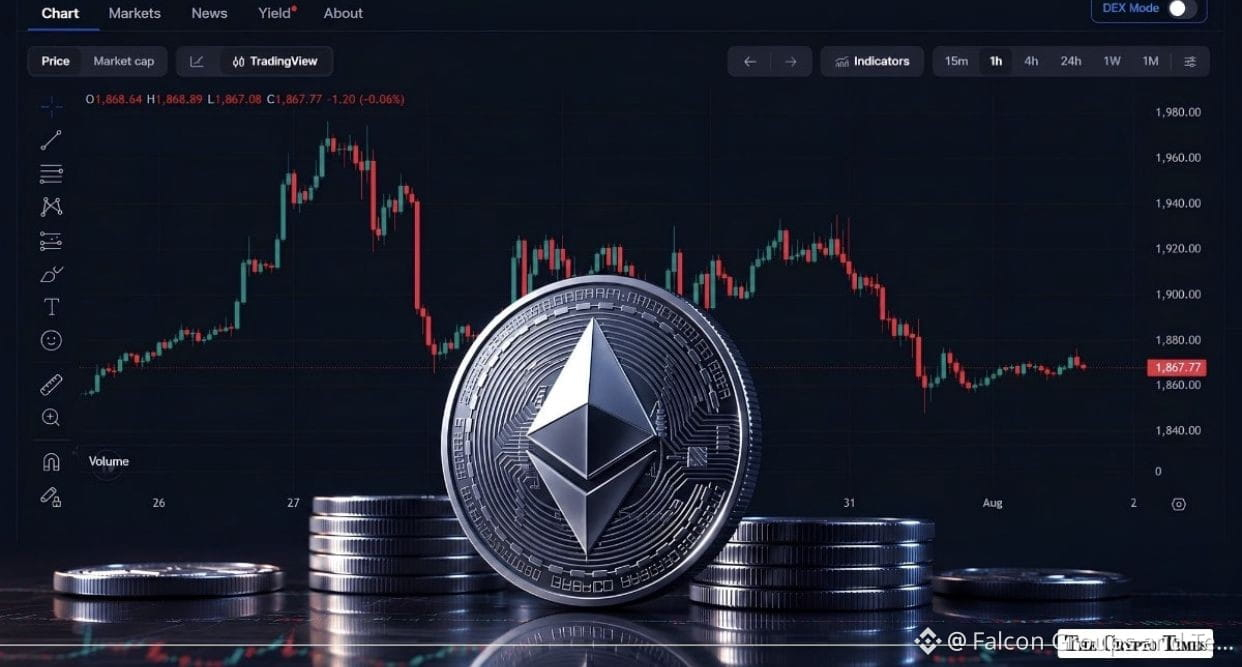
Phân tích thị trường Ethereum $ETH
* Giá hiện tại: ~$1,890 – $1,900
* Bối cảnh thị trường: $ETH đang cố gắng phục hồi ổn định sau khi kiểm tra vùng hỗ trợ gần $1,850, di chuyển song song với biến động của toàn thị trường crypto khi nhà giao dịch tiêu hóa các cập nhật vĩ mô và dữ liệu lạm phát của Mỹ.
Các mốc kỹ thuật quan trọng
| Loại mức | Tầm giá | Ý nghĩa |
|---|---|---|
| Hỗ trợ ngay lập tức | $1,850 – $1,865 | Sự hội tụ của đường EMA 20 ngày và 50 ngày; đóng vai trò là “sàn an toàn” quan trọng cho các nhịp giảm ngắn hạn. |
| Điểm xoay / Cản phá (Breakout) | $1,895 – $1,920 | Điểm ngoặt trong ngắn hạn, khớp với EMA 100 ngày ($1,922). Việc chiếm lại vùng này là thiết yếu để tạo đà tăng. |
| Nguồn cung / Kháng cự chính | $1,960 – $2,000 | Vùng kháng cự trên cao khá nặng. Nếu có xác nhận đóng cửa theo ngày vượt qua mức này sẽ mở đường hướng tới các mục tiêu trung hạn cao hơn ($2,170+). |
Khi nào là thời điểm tốt nhất để giao dịch?
Thời điểm vào lệnh đúng phụ thuộc vào việc bạn ưu tiên giao dịch trong vùng an toàn hay chờ xác nhận bứt phá:
* Thời điểm tốt nhất để vào lệnh MUA (Bật lên từ hỗ trợ):
Hãy tìm cơ hội khi giá kiểm tra và bảo vệ thành công vùng hỗ trợ $1,850 – $1,865 với khối lượng bán giảm dần. Mua gần hỗ trợ trong khi đặt dừng lỗ chặt dưới $1,830 sẽ mang lại tỷ lệ rủi ro/ lợi nhuận thuận lợi.
* Thời điểm tốt nhất cho Momentum / Breakout:
Tránh đuổi theo giá nằm giữa biên. Thay vào đó, hãy chờ một phiên đóng cửa theo ngày với khối lượng cao vượt lên vùng kháng cự $1,920 – $1,960. Vào lệnh sau khi được xác nhận sẽ giảm rủi ro gặp phải cú “giả phá” hoặc bị đẩy ngược về đáy của vùng dao động.
* Cảnh báo quản lý rủi ro:
Với tâm lý thị trường chung đang nghiêng về thận trọng và xu hướng khối lượng mùa hè vẫn đi ngang, hãy tránh dùng đòn bẩy cao. Chia nhỏ lệnh và duy trì dừng lỗ nghiêm ngặt để phòng ngừa biến động do yếu tố vĩ mô.
#ETH #EthereumMarket $ETH
{spot}(ETHUSDT)
Phân tích thị trường Ethereum $ETH
* Giá hiện tại: ~$1,890 – $1,900
* Bối cảnh thị trường: $ETH đang cố gắng phục hồi ổn định sau khi kiểm tra vùng hỗ trợ gần $1,850, di chuyển song song với biến động của toàn thị trường crypto khi nhà giao dịch tiêu hóa các cập nhật vĩ mô và dữ liệu lạm phát của Mỹ.
Các mốc kỹ thuật quan trọng
| Loại mức | Tầm giá | Ý nghĩa |
|---|---|---|
| Hỗ trợ ngay lập tức | $1,850 – $1,865 | Sự hội tụ của đường EMA 20 ngày và 50 ngày; đóng vai trò là “sàn an toàn” quan trọng cho các nhịp giảm ngắn hạn. |
| Điểm xoay / Cản phá (Breakout) | $1,895 – $1,920 | Điểm ngoặt trong ngắn hạn, khớp với EMA 100 ngày ($1,922). Việc chiếm lại vùng này là thiết yếu để tạo đà tăng. |
| Nguồn cung / Kháng cự chính | $1,960 – $2,000 | Vùng kháng cự trên cao khá nặng. Nếu có xác nhận đóng cửa theo ngày vượt qua mức này sẽ mở đường hướng tới các mục tiêu trung hạn cao hơn ($2,170+). |
Khi nào là thời điểm tốt nhất để giao dịch?
Thời điểm vào lệnh đúng phụ thuộc vào việc bạn ưu tiên giao dịch trong vùng an toàn hay chờ xác nhận bứt phá:
* Thời điểm tốt nhất để vào lệnh MUA (Bật lên từ hỗ trợ):
Hãy tìm cơ hội khi giá kiểm tra và bảo vệ thành công vùng hỗ trợ $1,850 – $1,865 với khối lượng bán giảm dần. Mua gần hỗ trợ trong khi đặt dừng lỗ chặt dưới $1,830 sẽ mang lại tỷ lệ rủi ro/ lợi nhuận thuận lợi.
* Thời điểm tốt nhất cho Momentum / Breakout:
Tránh đuổi theo giá nằm giữa biên. Thay vào đó, hãy chờ một phiên đóng cửa theo ngày với khối lượng cao vượt lên vùng kháng cự $1,920 – $1,960. Vào lệnh sau khi được xác nhận sẽ giảm rủi ro gặp phải cú “giả phá” hoặc bị đẩy ngược về đáy của vùng dao động.
* Cảnh báo quản lý rủi ro:
Với tâm lý thị trường chung đang nghiêng về thận trọng và xu hướng khối lượng mùa hè vẫn đi ngang, hãy tránh dùng đòn bẩy cao. Chia nhỏ lệnh và duy trì dừng lỗ nghiêm ngặt để phòng ngừa biến động do yếu tố vĩ mô.
#ETH #EthereumMarket $ETH
* Giá hiện tại: ~$1,890 – $1,900
* Bối cảnh thị trường: $ETH đang cố gắng phục hồi ổn định sau khi kiểm tra vùng hỗ trợ gần $1,850, di chuyển song song với biến động của toàn thị trường crypto khi nhà giao dịch tiêu hóa các cập nhật vĩ mô và dữ liệu lạm phát của Mỹ.
Các mốc kỹ thuật quan trọng
| Loại mức | Tầm giá | Ý nghĩa |
|---|---|---|
| Hỗ trợ ngay lập tức | $1,850 – $1,865 | Sự hội tụ của đường EMA 20 ngày và 50 ngày; đóng vai trò là “sàn an toàn” quan trọng cho các nhịp giảm ngắn hạn. |
| Điểm xoay / Cản phá (Breakout) | $1,895 – $1,920 | Điểm ngoặt trong ngắn hạn, khớp với EMA 100 ngày ($1,922). Việc chiếm lại vùng này là thiết yếu để tạo đà tăng. |
| Nguồn cung / Kháng cự chính | $1,960 – $2,000 | Vùng kháng cự trên cao khá nặng. Nếu có xác nhận đóng cửa theo ngày vượt qua mức này sẽ mở đường hướng tới các mục tiêu trung hạn cao hơn ($2,170+). |
Khi nào là thời điểm tốt nhất để giao dịch?
Thời điểm vào lệnh đúng phụ thuộc vào việc bạn ưu tiên giao dịch trong vùng an toàn hay chờ xác nhận bứt phá:
* Thời điểm tốt nhất để vào lệnh MUA (Bật lên từ hỗ trợ):
Hãy tìm cơ hội khi giá kiểm tra và bảo vệ thành công vùng hỗ trợ $1,850 – $1,865 với khối lượng bán giảm dần. Mua gần hỗ trợ trong khi đặt dừng lỗ chặt dưới $1,830 sẽ mang lại tỷ lệ rủi ro/ lợi nhuận thuận lợi.
* Thời điểm tốt nhất cho Momentum / Breakout:
Tránh đuổi theo giá nằm giữa biên. Thay vào đó, hãy chờ một phiên đóng cửa theo ngày với khối lượng cao vượt lên vùng kháng cự $1,920 – $1,960. Vào lệnh sau khi được xác nhận sẽ giảm rủi ro gặp phải cú “giả phá” hoặc bị đẩy ngược về đáy của vùng dao động.
* Cảnh báo quản lý rủi ro:
Với tâm lý thị trường chung đang nghiêng về thận trọng và xu hướng khối lượng mùa hè vẫn đi ngang, hãy tránh dùng đòn bẩy cao. Chia nhỏ lệnh và duy trì dừng lỗ nghiêm ngặt để phòng ngừa biến động do yếu tố vĩ mô.
#ETH #EthereumMarket $ETH
80
Bài viết
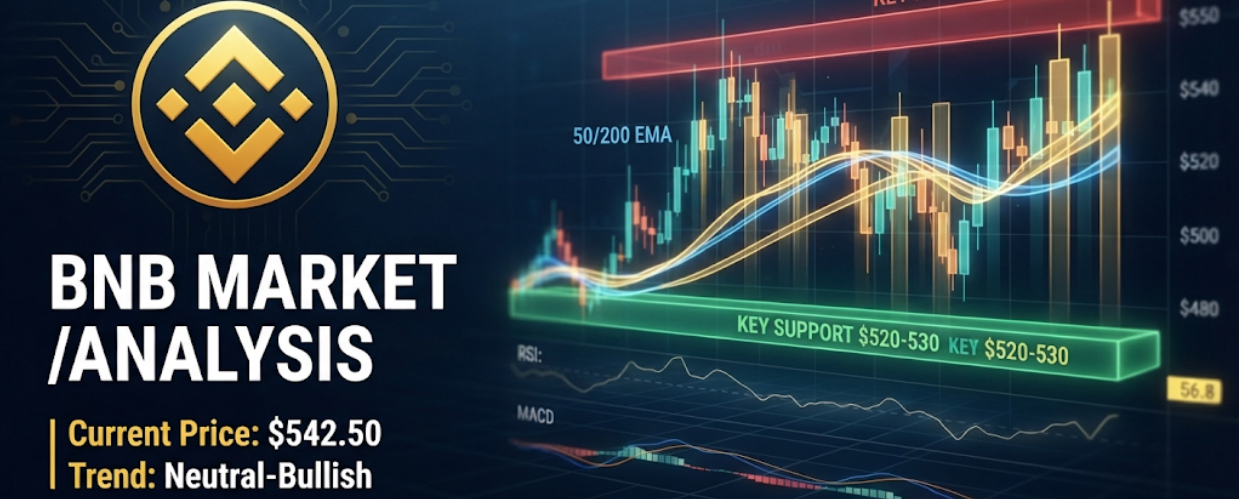
Phân Tích Kỹ Thuật Chi Tiết BNB / USDGiá thị trường hiện tại: ~$BNB 542.50
Chỉ báo Kỹ thuật: EMA 50 ngày: $530.00 (Đang đóng vai trò là hỗ trợ động ngay lập tức)
EMA 200 ngày:
$498.00 (Cơ sở cấu trúc dài hạn)
RSI (Chỉ số Sức mạnh Tương đối): 56.8 (Động lượng trung tính đến tăng, đang hướng lên nhưng chưa bị quá mua)
MACD:
Sự hội tụ tăng nhẹ đang hình thành trên biểu đồ ngày sau các lần kiểm tra hỗ trợ gần đây.
Các Vùng Kỹ Thuật Quan Trọng
Loại Vùng
Khoảng Giá
Phân Tích & Ý Nghĩa
Vùng Cung / Kháng Cự
$555.00 - $565.00
Khối thanh khoản lớn. Các nỗ lực tăng giá trước đó đã gặp lực bán mạnh nghiêm trọng tại đây. Cần có một phiên đóng cửa trên $565 để có đột phá lớn.
Phân Tích Kỹ Thuật Chi Tiết BNB / USD
Giá thị trường hiện tại: ~$BNB 542.50
Chỉ báo Kỹ thuật: EMA 50 ngày: $530.00 (Đang đóng vai trò là hỗ trợ động ngay lập tức)
EMA 200 ngày:
$498.00 (Cơ sở cấu trúc dài hạn)
RSI (Chỉ số Sức mạnh Tương đối): 56.8 (Động lượng trung tính đến tăng, đang hướng lên nhưng chưa bị quá mua)
MACD:
Sự hội tụ tăng nhẹ đang hình thành trên biểu đồ ngày sau các lần kiểm tra hỗ trợ gần đây.
Các Vùng Kỹ Thuật Quan Trọng
Loại Vùng
Khoảng Giá
Phân Tích & Ý Nghĩa
Vùng Cung / Kháng Cự
$555.00 - $565.00
Khối thanh khoản lớn. Các nỗ lực tăng giá trước đó đã gặp lực bán mạnh nghiêm trọng tại đây. Cần có một phiên đóng cửa trên $565 để có đột phá lớn.
Chỉ báo Kỹ thuật: EMA 50 ngày: $530.00 (Đang đóng vai trò là hỗ trợ động ngay lập tức)
EMA 200 ngày:
$498.00 (Cơ sở cấu trúc dài hạn)
RSI (Chỉ số Sức mạnh Tương đối): 56.8 (Động lượng trung tính đến tăng, đang hướng lên nhưng chưa bị quá mua)
MACD:
Sự hội tụ tăng nhẹ đang hình thành trên biểu đồ ngày sau các lần kiểm tra hỗ trợ gần đây.
Các Vùng Kỹ Thuật Quan Trọng
Loại Vùng
Khoảng Giá
Phân Tích & Ý Nghĩa
Vùng Cung / Kháng Cự
$555.00 - $565.00
Khối thanh khoản lớn. Các nỗ lực tăng giá trước đó đã gặp lực bán mạnh nghiêm trọng tại đây. Cần có một phiên đóng cửa trên $565 để có đột phá lớn.
86
Phân tích giao dịch Bitcoin $BTC
* Giá hiện tại: ~ $63.800 – $64.000
* Bối cảnh thị trường: $BTC đang tích lũy trong một biên độ hẹp từ $62.500 đến $65.000, phản ứng sát với dữ liệu lạm phát Mỹ gần đây (CPI) và chờ các chất xúc tác vĩ mô sắp tới.
Các mốc kỹ thuật quan trọng
| Loại mức | Vùng giá / Biên độ | Ý nghĩa |
|---|---|---|
| Hỗ trợ ngay lập tức | $62.500 – $63.500 | Vùng cầu then chốt giữ vững các đáy cao hơn trong ngắn hạn; nếu thủng có thể trượt về $61.300. |
| Điểm xoay / Khu vực phá vỡ | $64.000 – $64.500 | Điểm uốn ngắn hạn; tương tác với đường EMA 50 ngày ($64.583). |
| Kháng cự ngay lập tức | $64.900 – $65.300 | Vùng cung/ thanh khoản dày. Bị từ chối tại đây có thể kéo dài trạng thái đi ngang. |
| Mục tiêu tăng / Phá vỡ | $66.700 – $67.500 | Đóng cửa ngày (daily close) được xác nhận trên vùng kháng cự sẽ hướng đến việc kiểm định EMA 100 ngày và các đỉnh yếu cục bộ. |
Các kịch bản giao dịch
* Thiết lập tiếp diễn tăng (Long):
* Kích hoạt: Tìm nến đóng mạnh khung 1H–4H trên $65.000 có kèm khối lượng, hoặc một lần retest sạch và sự bảo vệ của khối hỗ trợ $63.800 – $64.200.
* Mục tiêu: $65.500, sau đó $66.750.
* Quản lý rủi ro: Dừng lỗ được quản lý chặt chẽ dưới $63.500.
* Thiết lập giảm / Từ chối biên độ (Short):
* Kích hoạt: Bị từ chối và đà suy yếu quanh vùng cung $64.900 – $65.300.
* Mục tiêu: Quay trở lại đáy biên độ tại $62.500.
* Quản lý rủi ro: Dừng lỗ đặt trên $65.600.
* Vô hiệu hóa: Nếu có một nến đóng ngày với khối lượng cao dưới $62.000 sẽ vô hiệu cấu trúc phục hồi ngắn hạn hiện tại, làm lộ ra hỗ trợ vĩ mô sâu hơn.
#BTC #Market_Update
{spot}(BTCUSDT)
Phân tích giao dịch Bitcoin $BTC
* Giá hiện tại: ~ $63.800 – $64.000
* Bối cảnh thị trường: $BTC đang tích lũy trong một biên độ hẹp từ $62.500 đến $65.000, phản ứng sát với dữ liệu lạm phát Mỹ gần đây (CPI) và chờ các chất xúc tác vĩ mô sắp tới.
Các mốc kỹ thuật quan trọng
| Loại mức | Vùng giá / Biên độ | Ý nghĩa |
|---|---|---|
| Hỗ trợ ngay lập tức | $62.500 – $63.500 | Vùng cầu then chốt giữ vững các đáy cao hơn trong ngắn hạn; nếu thủng có thể trượt về $61.300. |
| Điểm xoay / Khu vực phá vỡ | $64.000 – $64.500 | Điểm uốn ngắn hạn; tương tác với đường EMA 50 ngày ($64.583). |
| Kháng cự ngay lập tức | $64.900 – $65.300 | Vùng cung/ thanh khoản dày. Bị từ chối tại đây có thể kéo dài trạng thái đi ngang. |
| Mục tiêu tăng / Phá vỡ | $66.700 – $67.500 | Đóng cửa ngày (daily close) được xác nhận trên vùng kháng cự sẽ hướng đến việc kiểm định EMA 100 ngày và các đỉnh yếu cục bộ. |
Các kịch bản giao dịch
* Thiết lập tiếp diễn tăng (Long):
* Kích hoạt: Tìm nến đóng mạnh khung 1H–4H trên $65.000 có kèm khối lượng, hoặc một lần retest sạch và sự bảo vệ của khối hỗ trợ $63.800 – $64.200.
* Mục tiêu: $65.500, sau đó $66.750.
* Quản lý rủi ro: Dừng lỗ được quản lý chặt chẽ dưới $63.500.
* Thiết lập giảm / Từ chối biên độ (Short):
* Kích hoạt: Bị từ chối và đà suy yếu quanh vùng cung $64.900 – $65.300.
* Mục tiêu: Quay trở lại đáy biên độ tại $62.500.
* Quản lý rủi ro: Dừng lỗ đặt trên $65.600.
* Vô hiệu hóa: Nếu có một nến đóng ngày với khối lượng cao dưới $62.000 sẽ vô hiệu cấu trúc phục hồi ngắn hạn hiện tại, làm lộ ra hỗ trợ vĩ mô sâu hơn.
#BTC #Market_Update
* Giá hiện tại: ~ $63.800 – $64.000
* Bối cảnh thị trường: $BTC đang tích lũy trong một biên độ hẹp từ $62.500 đến $65.000, phản ứng sát với dữ liệu lạm phát Mỹ gần đây (CPI) và chờ các chất xúc tác vĩ mô sắp tới.
Các mốc kỹ thuật quan trọng
| Loại mức | Vùng giá / Biên độ | Ý nghĩa |
|---|---|---|
| Hỗ trợ ngay lập tức | $62.500 – $63.500 | Vùng cầu then chốt giữ vững các đáy cao hơn trong ngắn hạn; nếu thủng có thể trượt về $61.300. |
| Điểm xoay / Khu vực phá vỡ | $64.000 – $64.500 | Điểm uốn ngắn hạn; tương tác với đường EMA 50 ngày ($64.583). |
| Kháng cự ngay lập tức | $64.900 – $65.300 | Vùng cung/ thanh khoản dày. Bị từ chối tại đây có thể kéo dài trạng thái đi ngang. |
| Mục tiêu tăng / Phá vỡ | $66.700 – $67.500 | Đóng cửa ngày (daily close) được xác nhận trên vùng kháng cự sẽ hướng đến việc kiểm định EMA 100 ngày và các đỉnh yếu cục bộ. |
Các kịch bản giao dịch
* Thiết lập tiếp diễn tăng (Long):
* Kích hoạt: Tìm nến đóng mạnh khung 1H–4H trên $65.000 có kèm khối lượng, hoặc một lần retest sạch và sự bảo vệ của khối hỗ trợ $63.800 – $64.200.
* Mục tiêu: $65.500, sau đó $66.750.
* Quản lý rủi ro: Dừng lỗ được quản lý chặt chẽ dưới $63.500.
* Thiết lập giảm / Từ chối biên độ (Short):
* Kích hoạt: Bị từ chối và đà suy yếu quanh vùng cung $64.900 – $65.300.
* Mục tiêu: Quay trở lại đáy biên độ tại $62.500.
* Quản lý rủi ro: Dừng lỗ đặt trên $65.600.
* Vô hiệu hóa: Nếu có một nến đóng ngày với khối lượng cao dưới $62.000 sẽ vô hiệu cấu trúc phục hồi ngắn hạn hiện tại, làm lộ ra hỗ trợ vĩ mô sâu hơn.
#BTC #Market_Update
75
Đăng nhập để khám phá thêm nội dung
Tham gia cùng người dùng tiền mã hóa toàn cầu trên Binance Square
⚡️ Nhận thông tin mới nhất và hữu ích về tiền mã hóa.
💬 Được tin cậy bởi sàn giao dịch tiền mã hóa lớn nhất thế giới.
👍 Khám phá những thông tin chuyên sâu thực tế từ những nhà sáng tạo đã xác minh.
Email / Số điện thoại
Chủ đề thịnh hành
TheoDõiFOMC
106,588 lượt xem
630 đang thảo luận
#TheoDõiFOMC $BTC $ETH
FOMC không chỉ là một cuộc họp về lãi suất.
Đây là nơi mà hướng đi của “tiền lớn” có thể bắt đầu thay đổi.
Một câu nói từ Fed có thể trở thành tín hiệu cho thị trường.
Lãi suất có thể không đổi, nhưng kỳ vọng của nhà đầu tư có thể thay đổi trước.
Với Bitcoin, câu hỏi thực sự không phải lúc nào cũng là:
“Fed sẽ tăng hay cắt giảm lãi suất?”
Mà là:
“Fed muốn thị trường tin điều gì?”
Trong crypto, giá thường biến động trước cả tin tức.
Vì vậy, trước mỗi kỳ FOMC, đừng chỉ nhìn vào biểu đồ.
Hãy theo dõi kỳ vọng, thanh khoản và tâm lý thị trường.
🌊 Thị trường không chỉ phản ứng với những gì Fed làm.
Mà nó phản ứng với những gì thị trường tin rằng Fed sẽ làm.
#FOMC #Bitcoin #Crypto #Fed #BinanceSquare
Cristore-trading
·1 lượt thích
·104 lượt xem
TinFed
88,698 lượt xem
432 đang thảo luận
NvidiaApproves$150BBuyback
794 lượt xem
23 đang thảo luận