
Aminul islam 1
13 Bài đăng

Aminul islam 1
Báo cáo
Chặn người dùng
Giao dịch mở
3 tháng
0 Đang theo dõi
0 Người theo dõi
1 Đã thích
Bài đăng
Danh mục đầu tư
Tất cả
Video
·
--
Tăng giá
Xem bản dịch
BTC Technical Analysis
$BTC
{future}(BTCUSDT)
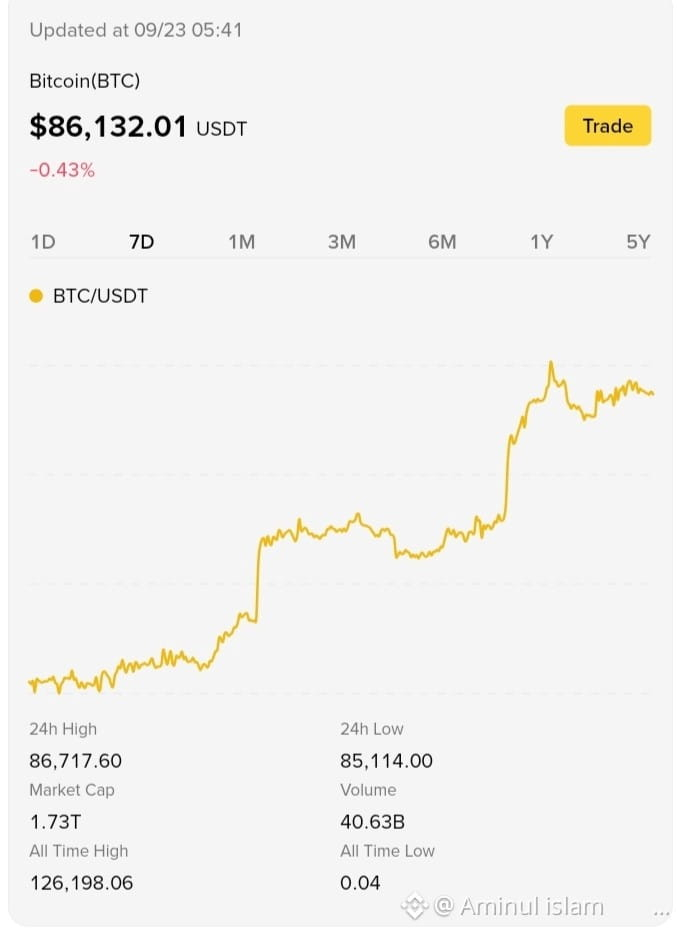
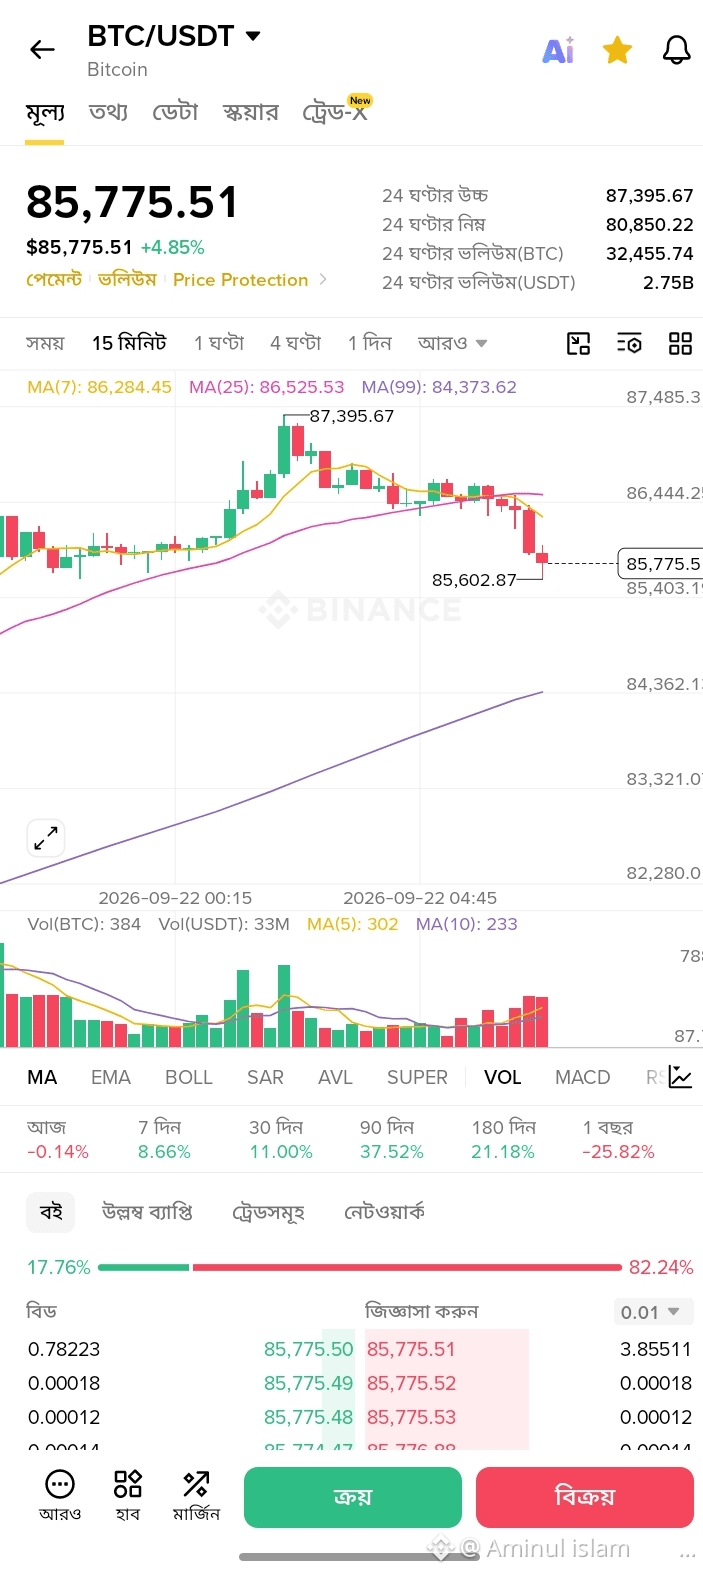
🚨 I can’t reliably predict whether BTC will rise or fall next. The current technical picture is mixed: the higher-timeframe trend remains strong, but short-term momentum has cooled and the market looks stretched.
Current market structure
BTC Spot price: $86,121.44
24-hour change: -0.34%
7-day change: +12.52%
30-day change: +11.62%
90-day change: +42.94%
The strong 7-day and 30-day gains show that buyers have recently controlled the broader trend. However, the small negative 24-hour move suggests short-term consolidation or profit-taking is present.
1-hour technical view
RSI: 54.37 — neutral zone; neither strongly overbought nor oversold.
EMA 7: $86,234.70
EMA 25: $85,897.86
SAR: $85,728.53
SuperTrend: $84,843.03
Bollinger Band range: $85,285.86–$86,803.84
MACD DIF: -102.91, with no confirmed cross shown.
On the 1-hour chart, BTC is slightly below its short EMA but remains above the EMA 25, SAR, and SuperTrend. This indicates short-term momentum is uncertain rather than decisively bearish.
Daily technical view
Daily RSI: 75.48 — elevated/overbought territory.
EMA 7: $81,142.29
EMA 25: $78,105.33
EMA 99: $72,234.21
Daily MACD: bullish cross
Daily SuperTrend: $76,252.54
Daily SAR: $75,633.99
Daily Bollinger upper band: $83,951.64
The daily chart remains structurally bullish: price is above the major moving averages, SuperTrend, and SAR, while MACD has a bullish cross. The main caution is the high daily RSI and price being above the daily upper Bollinger Band, which indicates the rally is extended and volatility or pullback risk is elevated.
Important chart zones
Near-term resistance: approximately $86,800–$87,400, based on the 1-hour upper Bollinger Band and recent 4-hour highs.
Near-term support: approximately $85,300–$85,700, based on the 1-hour lower Bollinger Band, SAR, and recent 4-hour trading range.
Deeper trend support: around $84,843 on the 1-hour SuperTrend.
Broader daily support: around $81,142, near the daily EMA 7.#AIStocksWhatNext #BTC
$BTC
BTC Technical Analysis
$BTC
🚨 I can’t reliably predict whether BTC will rise or fall next. The current technical picture is mixed: the higher-timeframe trend remains strong, but short-term momentum has cooled and the market looks stretched.
Current market structure
BTC Spot price: $86,121.44
24-hour change: -0.34%
7-day change: +12.52%
30-day change: +11.62%
90-day change: +42.94%
The strong 7-day and 30-day gains show that buyers have recently controlled the broader trend. However, the small negative 24-hour move suggests short-term consolidation or profit-taking is present.
1-hour technical view
RSI: 54.37 — neutral zone; neither strongly overbought nor oversold.
EMA 7: $86,234.70
EMA 25: $85,897.86
SAR: $85,728.53
SuperTrend: $84,843.03
Bollinger Band range: $85,285.86–$86,803.84
MACD DIF: -102.91, with no confirmed cross shown.
On the 1-hour chart, BTC is slightly below its short EMA but remains above the EMA 25, SAR, and SuperTrend. This indicates short-term momentum is uncertain rather than decisively bearish.
Daily technical view
Daily RSI: 75.48 — elevated/overbought territory.
EMA 7: $81,142.29
EMA 25: $78,105.33
EMA 99: $72,234.21
Daily MACD: bullish cross
Daily SuperTrend: $76,252.54
Daily SAR: $75,633.99
Daily Bollinger upper band: $83,951.64
The daily chart remains structurally bullish: price is above the major moving averages, SuperTrend, and SAR, while MACD has a bullish cross. The main caution is the high daily RSI and price being above the daily upper Bollinger Band, which indicates the rally is extended and volatility or pullback risk is elevated.
Important chart zones
Near-term resistance: approximately $86,800–$87,400, based on the 1-hour upper Bollinger Band and recent 4-hour highs.
Near-term support: approximately $85,300–$85,700, based on the 1-hour lower Bollinger Band, SAR, and recent 4-hour trading range.
Deeper trend support: around $84,843 on the 1-hour SuperTrend.
Broader daily support: around $81,142, near the daily EMA 7.#AIStocksWhatNext #BTC
$BTC
$BTC
🚨 I can’t reliably predict whether BTC will rise or fall next. The current technical picture is mixed: the higher-timeframe trend remains strong, but short-term momentum has cooled and the market looks stretched.
Current market structure
BTC Spot price: $86,121.44
24-hour change: -0.34%
7-day change: +12.52%
30-day change: +11.62%
90-day change: +42.94%
The strong 7-day and 30-day gains show that buyers have recently controlled the broader trend. However, the small negative 24-hour move suggests short-term consolidation or profit-taking is present.
1-hour technical view
RSI: 54.37 — neutral zone; neither strongly overbought nor oversold.
EMA 7: $86,234.70
EMA 25: $85,897.86
SAR: $85,728.53
SuperTrend: $84,843.03
Bollinger Band range: $85,285.86–$86,803.84
MACD DIF: -102.91, with no confirmed cross shown.
On the 1-hour chart, BTC is slightly below its short EMA but remains above the EMA 25, SAR, and SuperTrend. This indicates short-term momentum is uncertain rather than decisively bearish.
Daily technical view
Daily RSI: 75.48 — elevated/overbought territory.
EMA 7: $81,142.29
EMA 25: $78,105.33
EMA 99: $72,234.21
Daily MACD: bullish cross
Daily SuperTrend: $76,252.54
Daily SAR: $75,633.99
Daily Bollinger upper band: $83,951.64
The daily chart remains structurally bullish: price is above the major moving averages, SuperTrend, and SAR, while MACD has a bullish cross. The main caution is the high daily RSI and price being above the daily upper Bollinger Band, which indicates the rally is extended and volatility or pullback risk is elevated.
Important chart zones
Near-term resistance: approximately $86,800–$87,400, based on the 1-hour upper Bollinger Band and recent 4-hour highs.
Near-term support: approximately $85,300–$85,700, based on the 1-hour lower Bollinger Band, SAR, and recent 4-hour trading range.
Deeper trend support: around $84,843 on the 1-hour SuperTrend.
Broader daily support: around $81,142, near the daily EMA 7.#AIStocksWhatNext #BTC
$BTC
20
·
--
Tăng giá
Xem bản dịch
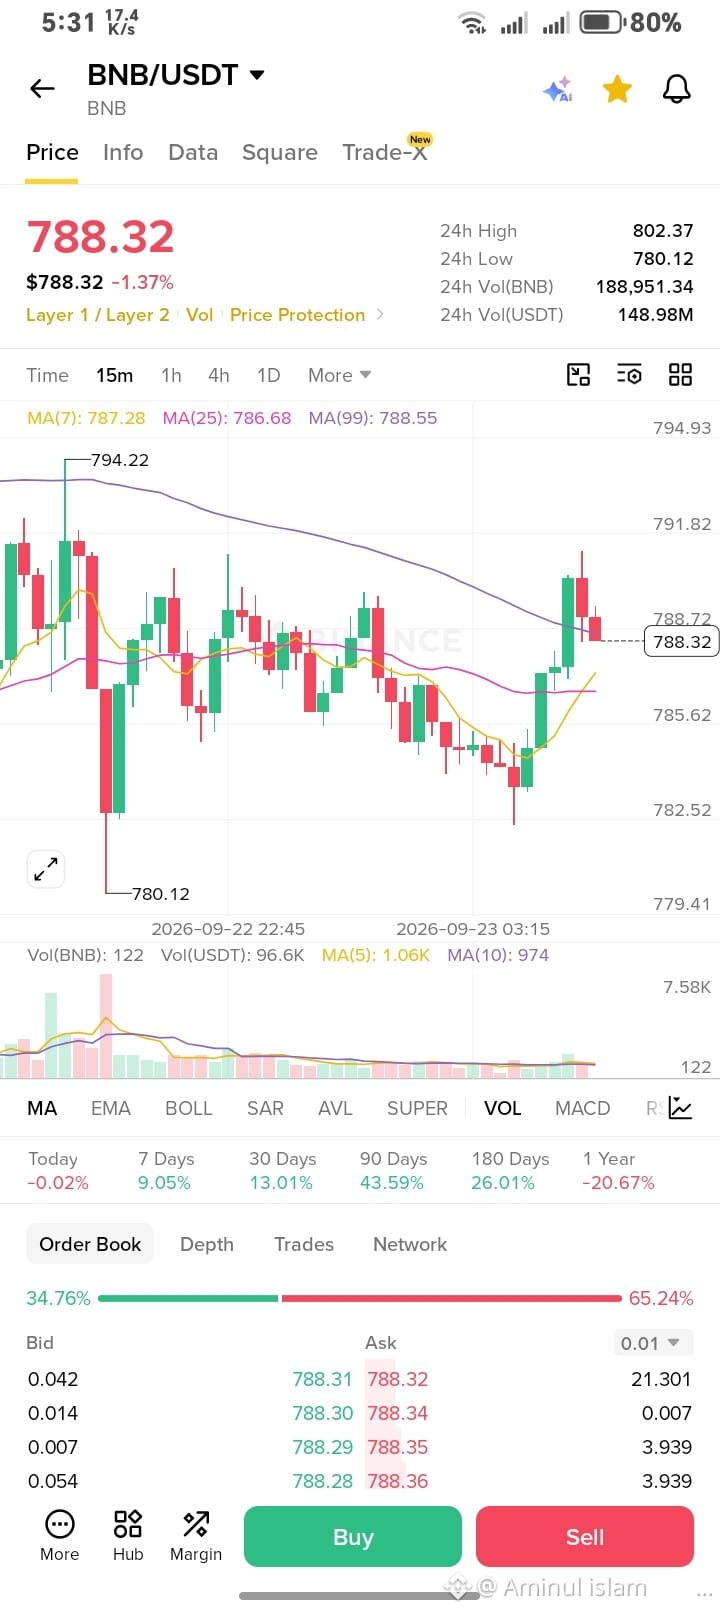
🚨 $BNB Get AI-powered crypto insights on “1H technical analysis of BNB” in the Binance app: https://app.binance.com/uni-qr/token-ai-report?token=BNB&symbol=BNBUSDT&product=spot&reportAt=1790118000000"eToken=USDT&utm_term=BNB&ref=1256144542&utm_source=Brm8cLnPPfw7BoYTCqg55k&utm_medium=spot_insight®isterChannel=trading_insigh
{future}(BNBUSDT)
🚨 $BNB Get AI-powered crypto insights on “1H technical analysis of BNB” in the Binance app: https://app.binance.com/uni-qr/token-ai-report?token=BNB&symbol=BNBUSDT&product=spot&reportAt=1790118000000"eToken=USDT&utm_term=BNB&ref=1256144542&utm_source=Brm8cLnPPfw7BoYTCqg55k&utm_medium=spot_insight®isterChannel=trading_insigh
5
·
--
Tăng giá
Xem bản dịch
$FET
{future}(FETUSDT)
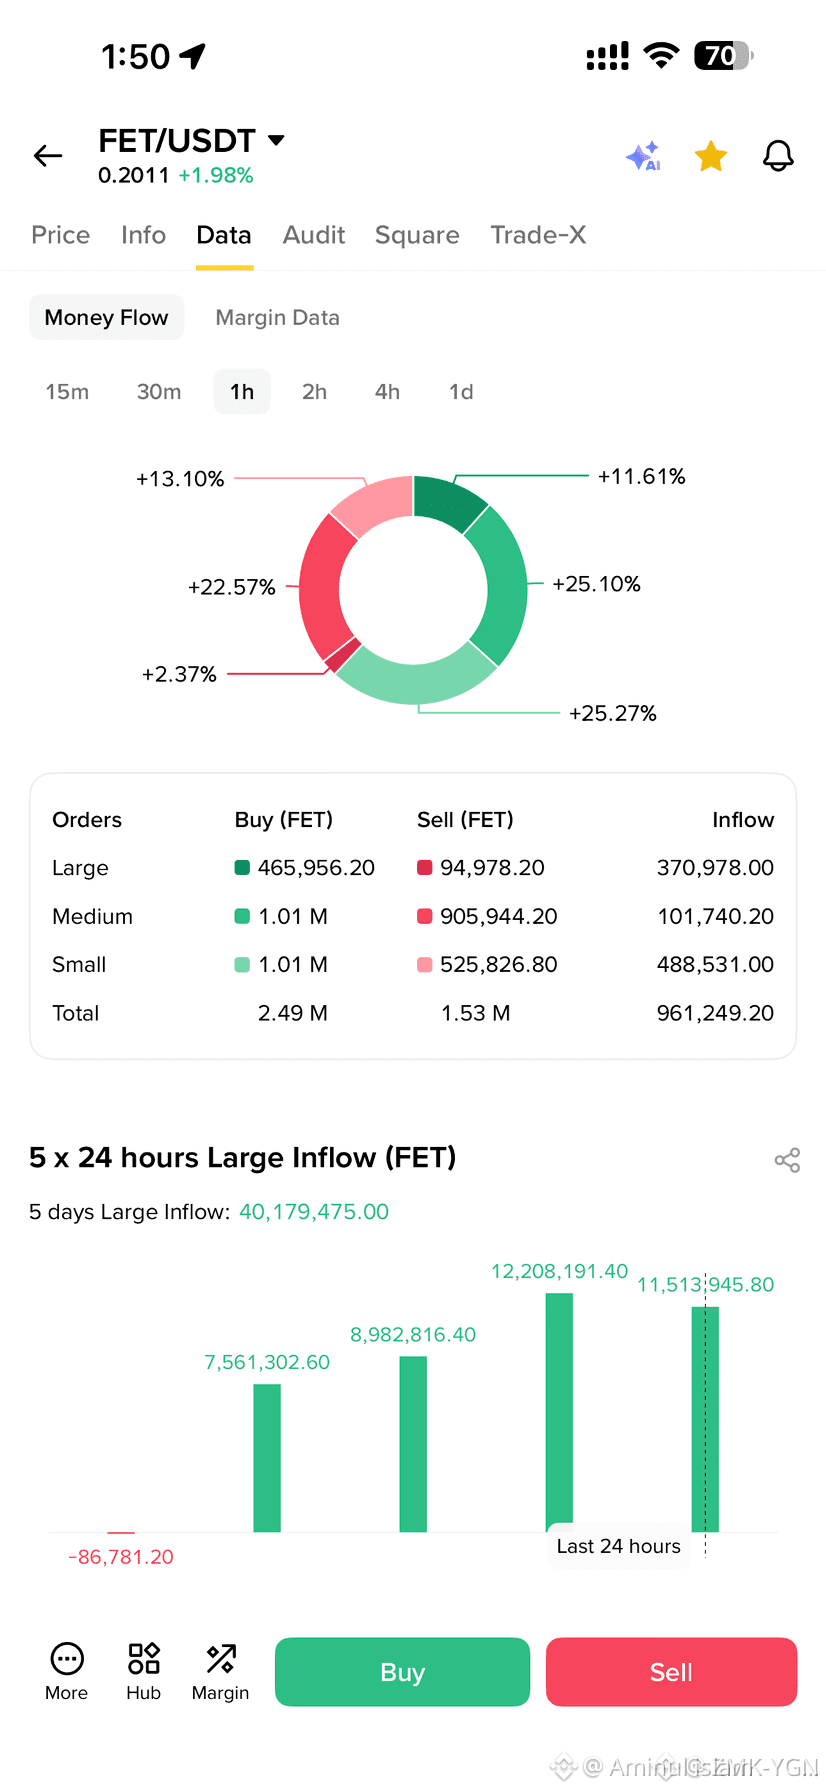
$FET There are a lot of incoming cash into the system. Better check it!!!🚨
$FET
$FET There are a lot of incoming cash into the system. Better check it!!!🚨
$FET There are a lot of incoming cash into the system. Better check it!!!🚨
4
·
--
Tăng giá
Xem bản dịch
🚨 Opend a $BTC longer here.
Am l earl.!
$BTC
{future}(BTCUSDT)
🚨 Opend a $BTC longer here.
Am l earl.!
$BTC
Am l earl.!
$BTC
6
Xem bản dịch
$CFX
{future}(CFXUSDT)
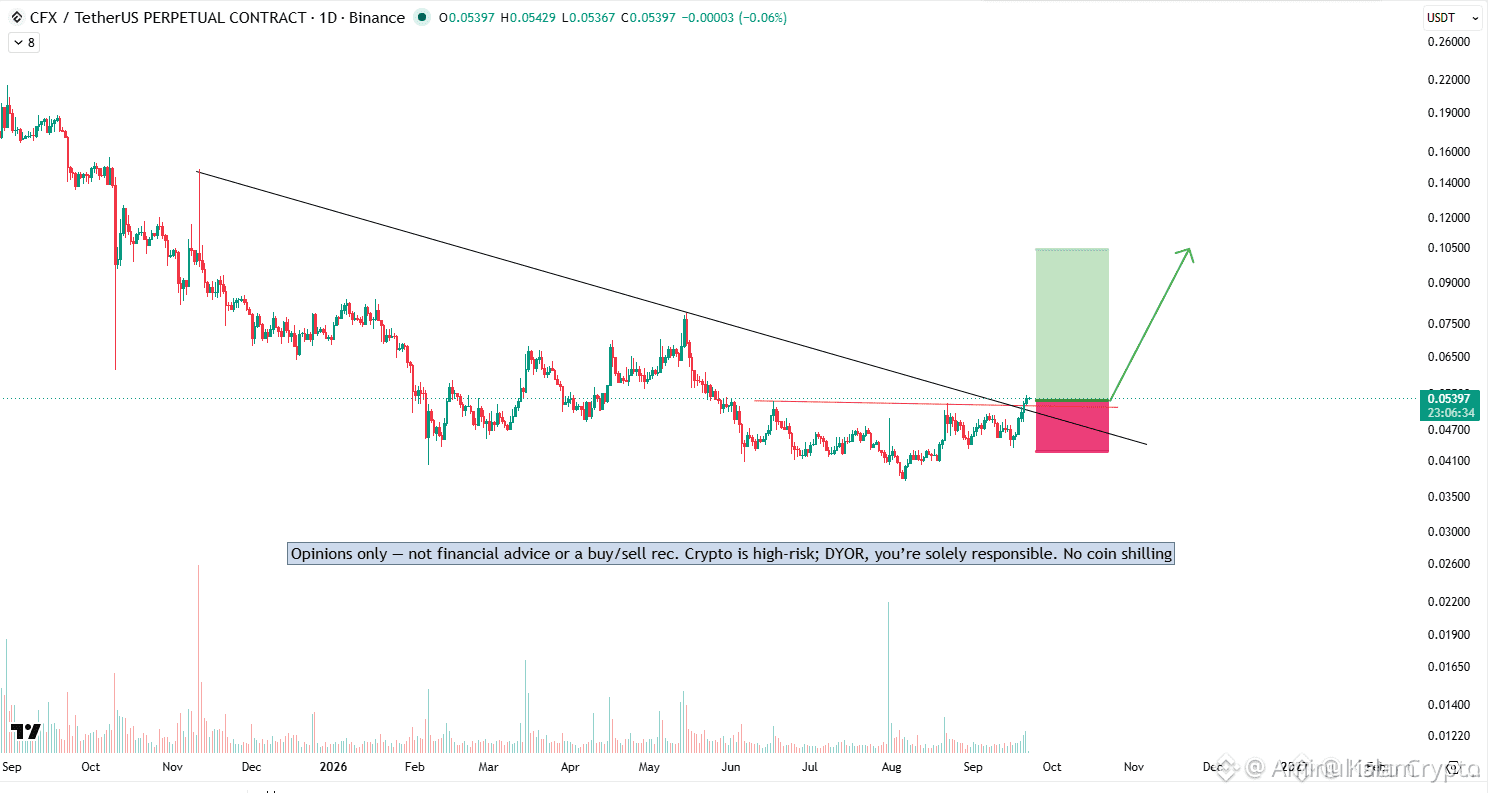
🚨🚨 today timing for this layer1 from CHina
Opinions only — not financial advice or a buy/sell rec. Crypto is high-risk; DYOR, you’re solely responsible. No coin shilling..!
#CFX #CircleLaunchesInstitutionalBTCBackedBorrowing
#CFX/USDT.P
$CFX
🚨🚨 today timing for this layer1 from CHina
Opinions only — not financial advice or a buy/sell rec. Crypto is high-risk; DYOR, you’re solely responsible. No coin shilling..!
#CFX #CircleLaunchesInstitutionalBTCBackedBorrowing
#CFX/USDT.P
🚨🚨 today timing for this layer1 from CHina
Opinions only — not financial advice or a buy/sell rec. Crypto is high-risk; DYOR, you’re solely responsible. No coin shilling..!
#CFX #CircleLaunchesInstitutionalBTCBackedBorrowing
#CFX/USDT.P
1
1
$ZEC
{future}(ZECUSDT)
🚨Có một đồng xu đang tăng giá trong 33 ngày; bạn nên nhận ra rằng họ muốn đẩy giá lên. Nếu không, thì họ đã công bố một vài thông tin từ lâu rồi, và giá đã chạm đáy. Tôi luôn dự đoán nó sẽ tăng đến mức này, nhưng những gì xảy ra tiếp theo thì không có vẻ bình thường đối với tôi.
$ZEC
🚨Có một đồng xu đang tăng giá trong 33 ngày; bạn nên nhận ra rằng họ muốn đẩy giá lên. Nếu không, thì họ đã công bố một vài thông tin từ lâu rồi, và giá đã chạm đáy. Tôi luôn dự đoán nó sẽ tăng đến mức này, nhưng những gì xảy ra tiếp theo thì không có vẻ bình thường đối với tôi.
🚨Có một đồng xu đang tăng giá trong 33 ngày; bạn nên nhận ra rằng họ muốn đẩy giá lên. Nếu không, thì họ đã công bố một vài thông tin từ lâu rồi, và giá đã chạm đáy. Tôi luôn dự đoán nó sẽ tăng đến mức này, nhưng những gì xảy ra tiếp theo thì không có vẻ bình thường đối với tôi.
37
·
--
Giảm giá
$USELESS hoàn toàn vô dụng.?
$USELESS
{alpha}(560xba38b3c706f7a515ff7c8db04daa0a134ec46d2b)
😘
$USELESS hoàn toàn vô dụng.?
$USELESS
😘
$USELESS
😘
28
·
--
Tăng giá
Xem bản dịch
80
·
--
Tăng giá
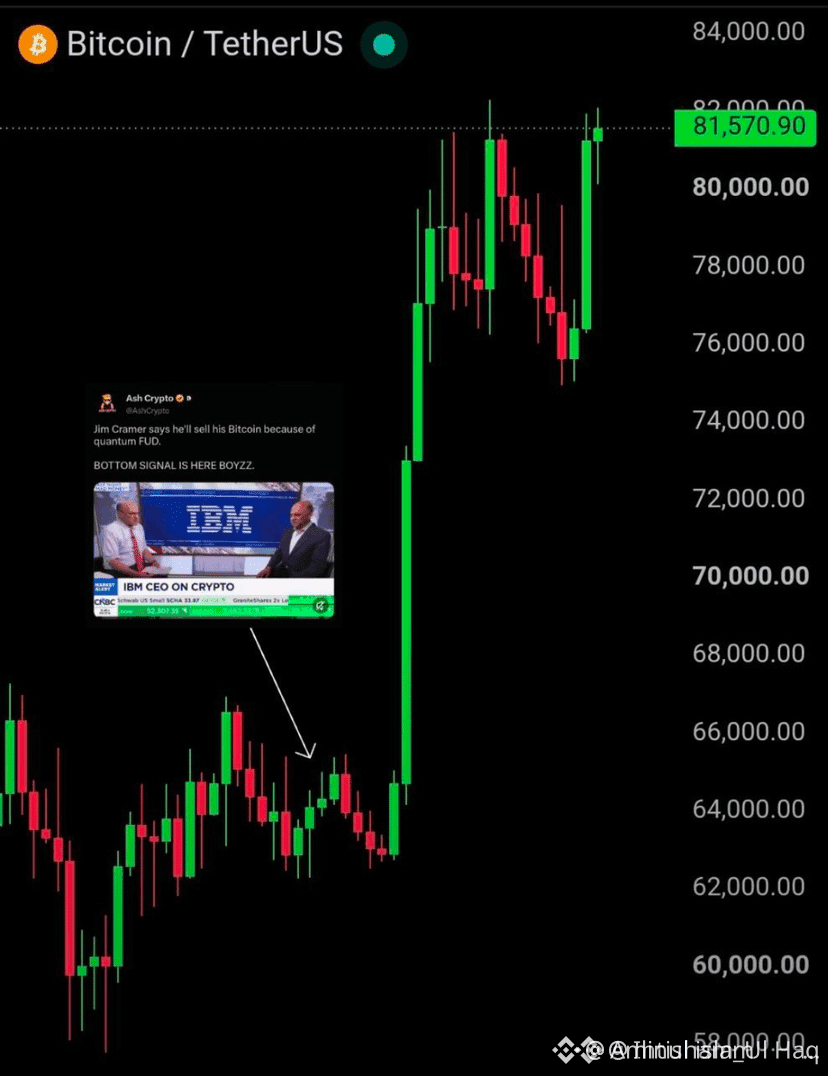
🚨 Tại sao Jim Cramer lại nói về việc bán Bitcoin?
Vào cuối tháng 7 năm 2026, CNBC’s Mad Money có cuộc thảo luận về điện toán lượng tử với CEO IBM Arvind Krishna. Krishna nói rằng trong tương lai, máy tính lượng tử có thể tạo ra rủi ro cho mật mã của Bitcoin. Sau đó, Cramer cho biết ông ấy sẽ bán Bitcoin của chính mình.
Cointelegraph +1
2. Sau đó thì sao?
Trong thời điểm Cramer đưa ra nhận xét, Bitcoin nằm quanh vùng khoảng 62.000–63.000 USD. Sau đó, BTC nhanh chóng tăng và vượt lên trên 80.000 USD. Theo số liệu được công bố vào ngày 21 tháng 9, tính từ đầu đã ghi nhận mức tăng gần 19.500 USD hoặc khoảng +31%.
KuCoin
3. “Inverse Cramer” (Cramer nghịch đảo) là gì mà lại nổi tiếng?
Trong cộng đồng crypto đã có từ nhiều năm một meme/quan niệm rằng—bất cứ khi nào Cramer đưa ra quan điểm theo hướng nào đó về một tài sản, thì phía ngược lại đôi khi lại hoạt động tốt hơn. Người ta gọi điều đó là “Inverse Cramer”. Tuy nhiên, không nên xem nó như một chiến lược trading đáng tin cậy.
Decrypt
4. Điểm quan trọng: Ông ấy có thật sự bán BTC không?#NEARRisesNearly80%InAWeek #
#BTC🔥🔥🔥🔥🔥 $AAPL.US
{stock_us}(AAPL.US)
🚨 Tại sao Jim Cramer lại nói về việc bán Bitcoin?
Vào cuối tháng 7 năm 2026, CNBC’s Mad Money có cuộc thảo luận về điện toán lượng tử với CEO IBM Arvind Krishna. Krishna nói rằng trong tương lai, máy tính lượng tử có thể tạo ra rủi ro cho mật mã của Bitcoin. Sau đó, Cramer cho biết ông ấy sẽ bán Bitcoin của chính mình.
Cointelegraph +1
2. Sau đó thì sao?
Trong thời điểm Cramer đưa ra nhận xét, Bitcoin nằm quanh vùng khoảng 62.000–63.000 USD. Sau đó, BTC nhanh chóng tăng và vượt lên trên 80.000 USD. Theo số liệu được công bố vào ngày 21 tháng 9, tính từ đầu đã ghi nhận mức tăng gần 19.500 USD hoặc khoảng +31%.
KuCoin
3. “Inverse Cramer” (Cramer nghịch đảo) là gì mà lại nổi tiếng?
Trong cộng đồng crypto đã có từ nhiều năm một meme/quan niệm rằng—bất cứ khi nào Cramer đưa ra quan điểm theo hướng nào đó về một tài sản, thì phía ngược lại đôi khi lại hoạt động tốt hơn. Người ta gọi điều đó là “Inverse Cramer”. Tuy nhiên, không nên xem nó như một chiến lược trading đáng tin cậy.
Decrypt
4. Điểm quan trọng: Ông ấy có thật sự bán BTC không?#NEARRisesNearly80%InAWeek #
#BTC🔥🔥🔥🔥🔥 $AAPL.US
Vào cuối tháng 7 năm 2026, CNBC’s Mad Money có cuộc thảo luận về điện toán lượng tử với CEO IBM Arvind Krishna. Krishna nói rằng trong tương lai, máy tính lượng tử có thể tạo ra rủi ro cho mật mã của Bitcoin. Sau đó, Cramer cho biết ông ấy sẽ bán Bitcoin của chính mình.
Cointelegraph +1
2. Sau đó thì sao?
Trong thời điểm Cramer đưa ra nhận xét, Bitcoin nằm quanh vùng khoảng 62.000–63.000 USD. Sau đó, BTC nhanh chóng tăng và vượt lên trên 80.000 USD. Theo số liệu được công bố vào ngày 21 tháng 9, tính từ đầu đã ghi nhận mức tăng gần 19.500 USD hoặc khoảng +31%.
KuCoin
3. “Inverse Cramer” (Cramer nghịch đảo) là gì mà lại nổi tiếng?
Trong cộng đồng crypto đã có từ nhiều năm một meme/quan niệm rằng—bất cứ khi nào Cramer đưa ra quan điểm theo hướng nào đó về một tài sản, thì phía ngược lại đôi khi lại hoạt động tốt hơn. Người ta gọi điều đó là “Inverse Cramer”. Tuy nhiên, không nên xem nó như một chiến lược trading đáng tin cậy.
Decrypt
4. Điểm quan trọng: Ông ấy có thật sự bán BTC không?#NEARRisesNearly80%InAWeek #
#BTC🔥🔥🔥🔥🔥 $AAPL.US

BTC-0,47%
AAPLUS+0,00%
191
Đăng nhập để khám phá thêm nội dung
Tham gia cùng người dùng tiền mã hóa toàn cầu trên Binance Square
⚡️ Nhận thông tin mới nhất và hữu ích về tiền mã hóa.
💬 Được tin cậy bởi sàn giao dịch tiền mã hóa lớn nhất thế giới.
👍 Khám phá những thông tin chuyên sâu thực tế từ những nhà sáng tạo đã xác minh.
Email / Số điện thoại
Chủ đề thịnh hành
AIStocksWhatNext
357,764 lượt xem
2,949 đang thảo luận
Chia sẻ & Nhận thưởng Lưu lượng trong chiến dịch Hashtag Xu hướng của chúng tôi
✨Chủ đề: Những cơ hội đầu tư nào khác vẫn còn khi các cổ phiếu AI tiếp tục tăng?
👉Cách tham gia:
Đăng một bài viết ngắn hoặc bài viết kèm hashtag #AIStocksWhatNext
Chia sẻ bạn đang lạc quan hay bi quan, và đăng danh mục nắm giữ hoặc giao dịch cổ phiếu AI của bạn — việc sử dụng widget giao dịch có thể giúp bạn đủ điều kiện tốt hơn.
Bạn cũng có thể tăng sức thuyết phục cho bài đăng bằng cách chia sẻ dữ liệu hoặc biểu đồ và tránh sử dụng hình ảnh do AI tạo.
✍️Tạo nội dung dựa trên các góc dưới đây:
- Nvidia cho biết doanh số chip sẽ tăng gấp đôi vào năm tới, và các công ty AI hàng đầu tiếp tục đạt doanh thu kỷ lục, khoản chi cho năng lực tính toán phía sau điều đó còn đáng kinh ngạc hơn. Nhu cầu AI thực sự đang bùng nổ sao? Và có thể kéo dài trong bao lâu? Các cổ phiếu AI đang tăng trên toàn bảng. Đây có phải là một đợt bứt phá thật sự hay chỉ là một nhịp hồi ngắn hạn?
- Các nhà lãnh đạo ngành kêu gọi chậm lại việc phát triển AI, trong khi Trump dự định xây dựng “AI Force”, cho rằng AI có thể đóng góp 25% GDP của Mỹ trong tương lai. Bạn đứng về phía nào? Việc được hậu thuẫn ở cấp bang liệu có phải là một thắng lợi dài hạn cho các cổ phiếu AI không?
- Bạn có đang mua cổ phiếu AI không? Chia sẻ hoạt động giao dịch/nắm giữ liên quan đến AI của bạn với widget chia sẻ giao dịch của chúng tôi.
⏰Thời gian chiến dịch:
- 2026-09-22 7:00 - 2026-09-24 4:00 UTC
🎁Phần thưởng:
- Các bài đăng đủ điều kiện tuân thủ hướng dẫn trên và có hơn 100 từ sẽ được xem xét và có thể nhận một lượt tăng lưu lượng ngẫu nhiên từ 500 đến 3.000 lượt xem. Bạn sẽ nhận được thông báo từ thư ký feed nếu bài đăng của bạn được chọn.
- Nhận cơ hội để bài viết của bạn được đăng trên Binance Square Official
Cần ý tưởng cho bài đăng của bạn? Hãy truy cập trang chủ đề #AIStocksWhatNext hoặc Square Guide on How to Post for Better Reach.
Binance Square Official
·360 lượt thích
·882k lượt xem
TheoDõiFOMC
90,352 lượt xem
576 đang thảo luận
TinFed
80,414 lượt xem
380 đang thảo luận