
Shahzin Musa
3 Bài đăng

Shahzin Musa
Báo cáo
Chặn người dùng
1 Đang theo dõi
0 Người theo dõi
0 Đã thích
Bài đăng
·
--
Bài viết
$LUNC: Từ Chết đến Nguy Hiểm 🚀
Họ đã Cười… Cho đến 2026 👀🔥
Đừng bao giờ xem thường $LUNC 💀➡️🚀
T$LUNC ‼️🚨🔥
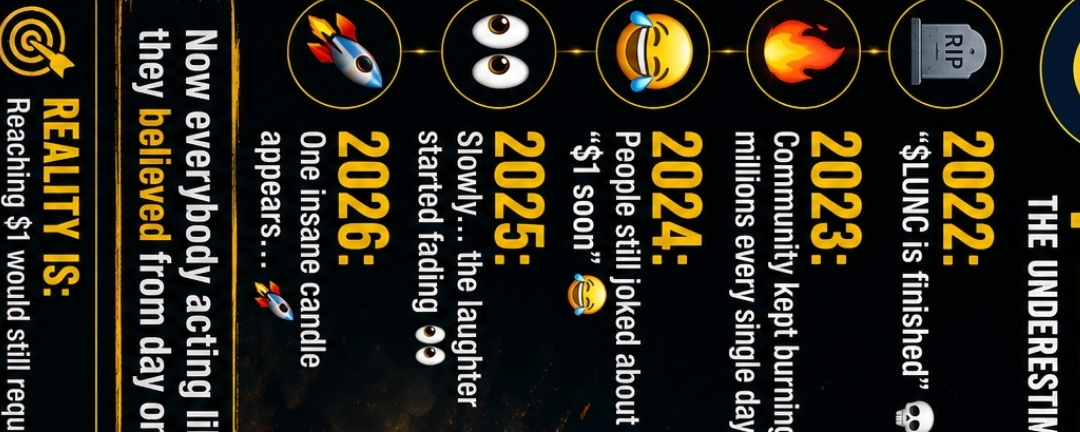
2022: “$LUNC đã kết thúc” 💀
2023: Cộng đồng đã tiếp tục đốt hàng triệu mỗi ngày 🔥
2024: Mọi người vẫn đùa về “$1 sớm” 😂
2025: Từ từ… tiếng cười bắt đầu phai nhạt 👀
2026: Một nến điên rồ xuất hiện… 🚀
Bây giờ mọi người đều hành động như thể họ đã tin từ ngày đầu 😭🔥
Thực tế là: Để đạt $1 vẫn cần đốt token khổng lồ, tiện ích thực sự, khối lượng mạnh, và một cộng đồng vững mạnh.
Nhưng nếu crypto đã dạy chúng ta điều gì… Đừng bao giờ xem thường một cộng đồng không chịu chết 👀🔥
$LUNC: Từ Chết đến Nguy Hiểm 🚀 Họ đã Cười… Cho đến 2026 👀🔥 Đừng bao giờ xem thường $LUNC 💀➡️🚀 T
$LUNC ‼️🚨🔥
2022: “$LUNC đã kết thúc” 💀
2023: Cộng đồng đã tiếp tục đốt hàng triệu mỗi ngày 🔥
2024: Mọi người vẫn đùa về “$1 sớm” 😂
2025: Từ từ… tiếng cười bắt đầu phai nhạt 👀
2026: Một nến điên rồ xuất hiện… 🚀
Bây giờ mọi người đều hành động như thể họ đã tin từ ngày đầu 😭🔥
Thực tế là: Để đạt $1 vẫn cần đốt token khổng lồ, tiện ích thực sự, khối lượng mạnh, và một cộng đồng vững mạnh.
Nhưng nếu crypto đã dạy chúng ta điều gì… Đừng bao giờ xem thường một cộng đồng không chịu chết 👀🔥
2022: “$LUNC đã kết thúc” 💀
2023: Cộng đồng đã tiếp tục đốt hàng triệu mỗi ngày 🔥
2024: Mọi người vẫn đùa về “$1 sớm” 😂
2025: Từ từ… tiếng cười bắt đầu phai nhạt 👀
2026: Một nến điên rồ xuất hiện… 🚀
Bây giờ mọi người đều hành động như thể họ đã tin từ ngày đầu 😭🔥
Thực tế là: Để đạt $1 vẫn cần đốt token khổng lồ, tiện ích thực sự, khối lượng mạnh, và một cộng đồng vững mạnh.
Nhưng nếu crypto đã dạy chúng ta điều gì… Đừng bao giờ xem thường một cộng đồng không chịu chết 👀🔥
126
·
--
Bài viết
Xem bản dịch
BtcYour framework is directionally solid: liquidation clusters often act like “magnets” because leveraged positioning creates areas where forced market orders can amplify moves.
A few important nuances make the analysis stronger though:
What your data is really showing
Those liquidation levels are not guaranteed targets. They represent:
Areas of concentrated leverage
Places where volatility can expand
Zones market makers and large players are watching
Potential fuel for acceleration once breached
The key insight is not “$BTC BTC will go there” — it’s that if price enters those regions with momentum, liquidation mechanics can intensify the move.
---
The asymmetry matters
You highlighted:
~$12.73B long liquidations below
~$9.35B short liquidations above
That creates a structurally asymmetric setup.
When there is more leverage trapped below price:
downside moves can become more violent,
because longs unwind through forced selling,
while spot bids may temporarily disappear during panic.
This is why crypto corrections often become cascade events rather than orderly declines.
---
But liquidity is not destiny
A common mistake is assuming:
> “More liquidity below = market must dump first.”
Markets frequently move against the largest obvious positioning before attacking the opposite side later.
For example:
1. BTC squeezes shorts first above $83k
2. Momentum traders FOMO in
3. Liquidity above gets cleared
4. THEN the market reverses hard into the larger long liquidity below
This happens because markets seek efficient liquidity extraction, not fairness.
---
The critical distinction: spot-led vs leverage-led rally
The next major move likely depends on whether:
spot demand is driving price, or
perp leverage is driving price.
Healthy bullish structure
Rising spot CVD
Falling funding after pumps
Open interest growing moderately
ETF inflows / real buying
Fragile bullish structure
Open interest exploding
Funding overheated
Price grinding upward on leverage alone
If the rally is leverage-led, the downside liquidation map becomes much more dangerous.
---
Why liquidation maps work
Most traders only watch:
candles,
support/resistance,
indicators.
But liquidation data exposes:
where positioning is crowded,
where volatility can mechanically accelerate,
where reflexive feedback loops exist.
That’s why professional derivatives traders track:
Open Interest (OI)
Funding rates
Liquidation heatmaps
CVD
Basis spreads
Stablecoin flows
Price is often the effect, not the cause.
---
The levels that matter structurally
Downside
If BTC loses the ~$70k region decisively, the market could transition from:
controlled pullback → into
liquidation-driven expansion
The $64k–$62k zone then becomes the real stress area.
Upside
If BTC reclaims and accepts above ~$83k:
shorts become vulnerable,
momentum systems re-engage,
and a fast squeeze toward higher liquidity becomes plausible.
Short squeezes tend to move faster than long squeezes because short covering is immediate market buying.
---
The biggest edge in this type of analysis
The real edge is understanding:
where traders are emotionally trapped,
where leverage becomes unstable,
and where forced participation begins.
That’s where volatility is born.
Not from indicators alone — but from positioning imbalances and reflexive liquidation mechanics.
Btc
Your framework is directionally solid: liquidation clusters often act like “magnets” because leveraged positioning creates areas where forced market orders can amplify moves.
A few important nuances make the analysis stronger though:
What your data is really showing
Those liquidation levels are not guaranteed targets. They represent:
Areas of concentrated leverage
Places where volatility can expand
Zones market makers and large players are watching
Potential fuel for acceleration once breached
The key insight is not “$BTC BTC will go there” — it’s that if price enters those regions with momentum, liquidation mechanics can intensify the move.
---
The asymmetry matters
You highlighted:
~$12.73B long liquidations below
~$9.35B short liquidations above
That creates a structurally asymmetric setup.
When there is more leverage trapped below price:
downside moves can become more violent,
because longs unwind through forced selling,
while spot bids may temporarily disappear during panic.
This is why crypto corrections often become cascade events rather than orderly declines.
---
But liquidity is not destiny
A common mistake is assuming:
> “More liquidity below = market must dump first.”
Markets frequently move against the largest obvious positioning before attacking the opposite side later.
For example:
1. BTC squeezes shorts first above $83k
2. Momentum traders FOMO in
3. Liquidity above gets cleared
4. THEN the market reverses hard into the larger long liquidity below
This happens because markets seek efficient liquidity extraction, not fairness.
---
The critical distinction: spot-led vs leverage-led rally
The next major move likely depends on whether:
spot demand is driving price, or
perp leverage is driving price.
Healthy bullish structure
Rising spot CVD
Falling funding after pumps
Open interest growing moderately
ETF inflows / real buying
Fragile bullish structure
Open interest exploding
Funding overheated
Price grinding upward on leverage alone
If the rally is leverage-led, the downside liquidation map becomes much more dangerous.
---
Why liquidation maps work
Most traders only watch:
candles,
support/resistance,
indicators.
But liquidation data exposes:
where positioning is crowded,
where volatility can mechanically accelerate,
where reflexive feedback loops exist.
That’s why professional derivatives traders track:
Open Interest (OI)
Funding rates
Liquidation heatmaps
CVD
Basis spreads
Stablecoin flows
Price is often the effect, not the cause.
---
The levels that matter structurally
Downside
If BTC loses the ~$70k region decisively, the market could transition from:
controlled pullback → into
liquidation-driven expansion
The $64k–$62k zone then becomes the real stress area.
Upside
If BTC reclaims and accepts above ~$83k:
shorts become vulnerable,
momentum systems re-engage,
and a fast squeeze toward higher liquidity becomes plausible.
Short squeezes tend to move faster than long squeezes because short covering is immediate market buying.
---
The biggest edge in this type of analysis
The real edge is understanding:
where traders are emotionally trapped,
where leverage becomes unstable,
and where forced participation begins.
That’s where volatility is born.
Not from indicators alone — but from positioning imbalances and reflexive liquidation mechanics.
A few important nuances make the analysis stronger though:
What your data is really showing
Those liquidation levels are not guaranteed targets. They represent:
Areas of concentrated leverage
Places where volatility can expand
Zones market makers and large players are watching
Potential fuel for acceleration once breached
The key insight is not “$BTC BTC will go there” — it’s that if price enters those regions with momentum, liquidation mechanics can intensify the move.
---
The asymmetry matters
You highlighted:
~$12.73B long liquidations below
~$9.35B short liquidations above
That creates a structurally asymmetric setup.
When there is more leverage trapped below price:
downside moves can become more violent,
because longs unwind through forced selling,
while spot bids may temporarily disappear during panic.
This is why crypto corrections often become cascade events rather than orderly declines.
---
But liquidity is not destiny
A common mistake is assuming:
> “More liquidity below = market must dump first.”
Markets frequently move against the largest obvious positioning before attacking the opposite side later.
For example:
1. BTC squeezes shorts first above $83k
2. Momentum traders FOMO in
3. Liquidity above gets cleared
4. THEN the market reverses hard into the larger long liquidity below
This happens because markets seek efficient liquidity extraction, not fairness.
---
The critical distinction: spot-led vs leverage-led rally
The next major move likely depends on whether:
spot demand is driving price, or
perp leverage is driving price.
Healthy bullish structure
Rising spot CVD
Falling funding after pumps
Open interest growing moderately
ETF inflows / real buying
Fragile bullish structure
Open interest exploding
Funding overheated
Price grinding upward on leverage alone
If the rally is leverage-led, the downside liquidation map becomes much more dangerous.
---
Why liquidation maps work
Most traders only watch:
candles,
support/resistance,
indicators.
But liquidation data exposes:
where positioning is crowded,
where volatility can mechanically accelerate,
where reflexive feedback loops exist.
That’s why professional derivatives traders track:
Open Interest (OI)
Funding rates
Liquidation heatmaps
CVD
Basis spreads
Stablecoin flows
Price is often the effect, not the cause.
---
The levels that matter structurally
Downside
If BTC loses the ~$70k region decisively, the market could transition from:
controlled pullback → into
liquidation-driven expansion
The $64k–$62k zone then becomes the real stress area.
Upside
If BTC reclaims and accepts above ~$83k:
shorts become vulnerable,
momentum systems re-engage,
and a fast squeeze toward higher liquidity becomes plausible.
Short squeezes tend to move faster than long squeezes because short covering is immediate market buying.
---
The biggest edge in this type of analysis
The real edge is understanding:
where traders are emotionally trapped,
where leverage becomes unstable,
and where forced participation begins.
That’s where volatility is born.
Not from indicators alone — but from positioning imbalances and reflexive liquidation mechanics.
80
·
--
Xem bản dịch
$BTC is entering a zone where the market may be forced to reveal its true direction.
Over the last 3 months, a large amount of positions has been accumulated, and the key liquidation levels are very clear.
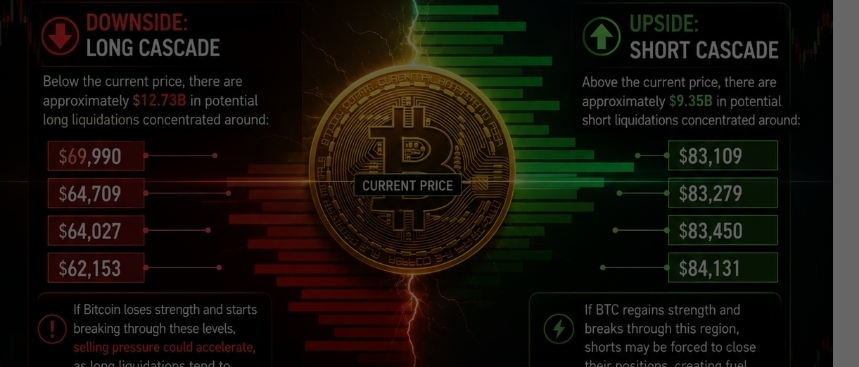
🔴 Downside: Long Cascade
Below the current price, there are approximately $12.73B in potential long liquidations concentrated around:
$69,990
$64,709
$64,027
$62,153
If Bitcoin loses strength and starts breaking through these levels, selling pressure could accelerate, as long liquidations tend to create forced selling in the market.
🟢 Upside: Short Cascade
Above the current price, there are approximately $9.35B in potential short liquidations concentrated around:
$83,109
$83,279
$83,450
$84,131
If BTC regains strength and breaks through this region, shorts may be forced to close their positions, creating fuel for a fast move higher.
The most important point:
There is more liquidity accumulated below the price than above.
This does not mean Bitcoin must go down, but it shows where the biggest structural risk is if the market loses support.
Many people only look at price.
But price is only the result.
The real Alpha is understanding where the market is leveraged, where traders will be forced out, and where volatility can be born.
$BTC is entering a zone where the market may be forced to reveal its true direction.
Over the last 3 months, a large amount of positions has been accumulated, and the key liquidation levels are very clear.
🔴 Downside: Long Cascade
Below the current price, there are approximately $12.73B in potential long liquidations concentrated around:
$69,990
$64,709
$64,027
$62,153
If Bitcoin loses strength and starts breaking through these levels, selling pressure could accelerate, as long liquidations tend to create forced selling in the market.
🟢 Upside: Short Cascade
Above the current price, there are approximately $9.35B in potential short liquidations concentrated around:
$83,109
$83,279
$83,450
$84,131
If BTC regains strength and breaks through this region, shorts may be forced to close their positions, creating fuel for a fast move higher.
The most important point:
There is more liquidity accumulated below the price than above.
This does not mean Bitcoin must go down, but it shows where the biggest structural risk is if the market loses support.
Many people only look at price.
But price is only the result.
The real Alpha is understanding where the market is leveraged, where traders will be forced out, and where volatility can be born.
Over the last 3 months, a large amount of positions has been accumulated, and the key liquidation levels are very clear.
🔴 Downside: Long Cascade
Below the current price, there are approximately $12.73B in potential long liquidations concentrated around:
$69,990
$64,709
$64,027
$62,153
If Bitcoin loses strength and starts breaking through these levels, selling pressure could accelerate, as long liquidations tend to create forced selling in the market.
🟢 Upside: Short Cascade
Above the current price, there are approximately $9.35B in potential short liquidations concentrated around:
$83,109
$83,279
$83,450
$84,131
If BTC regains strength and breaks through this region, shorts may be forced to close their positions, creating fuel for a fast move higher.
The most important point:
There is more liquidity accumulated below the price than above.
This does not mean Bitcoin must go down, but it shows where the biggest structural risk is if the market loses support.
Many people only look at price.
But price is only the result.
The real Alpha is understanding where the market is leveraged, where traders will be forced out, and where volatility can be born.
77
Đăng nhập để khám phá thêm nội dung
Tham gia cùng người dùng tiền mã hóa toàn cầu trên Binance Square
⚡️ Nhận thông tin mới nhất và hữu ích về tiền mã hóa.
💬 Được tin cậy bởi sàn giao dịch tiền mã hóa lớn nhất thế giới.
👍 Khám phá những thông tin chuyên sâu thực tế từ những nhà sáng tạo đã xác minh.
Email / Số điện thoại
Chủ đề thịnh hành
TinFed
78,847 lượt xem
373 đang thảo luận
BofA: Fed có thể tăng lãi suất trên 5%, nhà đầu tư nên chuẩn bị tinh thần.
Các chiến lược gia ngân hàng Bank of America cho rằng nhà đầu tư nên chuẩn bị cho khả năng Fed nâng lãi suất lên trên 5%, trong bối cảnh thị trường hiện mới dự đoán thêm 3 đợt tăng 0,25 điểm phần trăm. Thị trường hiện dự đoán Fed sẽ tăng thêm 3 lần, mỗi lần 0,25 điểm phần trăm. Nếu kịch bản này xảy ra, lãi suất quỹ liên bang có thể tiến tới khoảng 4,5% - 4,75%.
Tuy nhiên, các chiến lược gia BofA cho rằng lãi suất chuẩn có khả năng trở lại mức cao từng ghi nhận trong chu kỳ tăng lãi suất 2022-2023. Khi đó, Fed từng nâng biên độ lãi suất lên 5,25% - 5,5% vào tháng 7/2023. Theo thước đo mà BofA sử dụng, quy tắc này cho thấy lãi suất quỹ liên bang nên ở khoảng 5,3%.
$BTC $AKE $RAYSOL
#TinFed
Auto Tp
·0 lượt thích
·100 lượt xem
TheoDõiFOMC
87,133 lượt xem
566 đang thảo luận
45NgayTuDoTaiChinh
920,767 lượt xem
3,160 đang thảo luận