
ch mueez
13 Bài đăng

ch mueez
Báo cáo
Chặn người dùng
39 Đang theo dõi
16 Người theo dõi
1 Đã thích
Bài đăng
Tất cả
Trích dẫn
·
--
Xem bản dịch
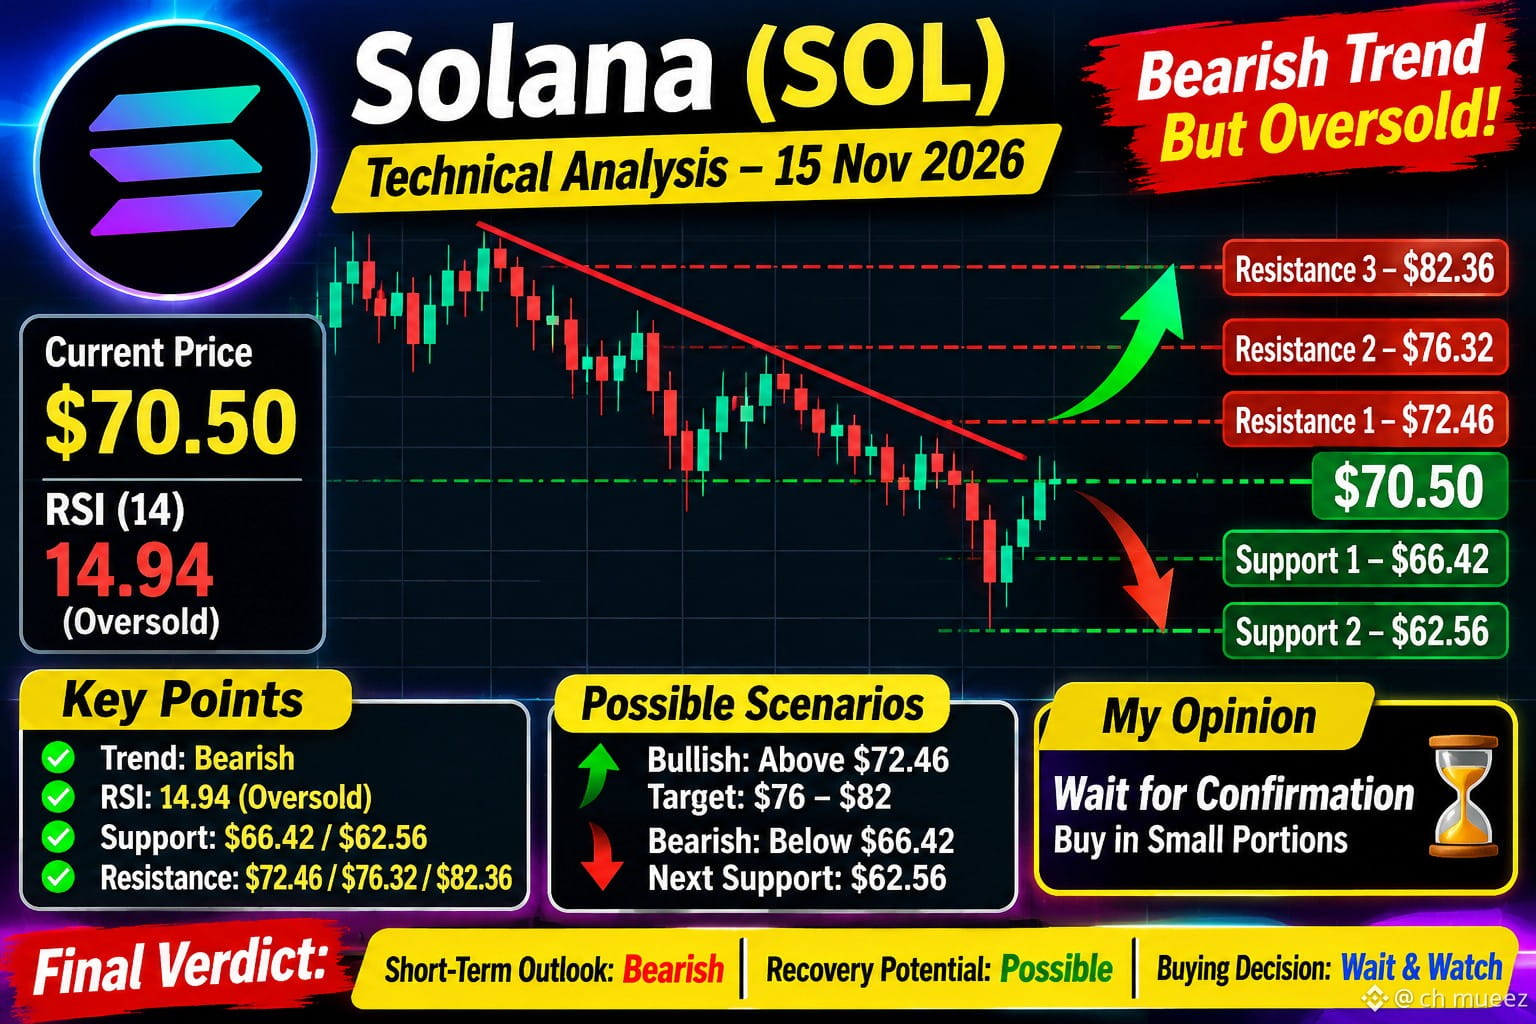
#TradFiForBeginners Solana (SOL) Coin Analysis – 15 November 2026
Solana (SOL)
$70.50
Approximate market price, USD · 15 Nov 2026
Technical analysis: Solana is currently under selling pressure. Its daily trend is bearish, and its RSI is around 15, which indicates an extremely oversold market. This means a short-term recovery is possible, but it does not confirm that the downtrend has ended.
#TradFiForBeginners Solana (SOL) Coin Analysis – 15 November 2026
Solana (SOL)
$70.50
Approximate market price, USD · 15 Nov 2026
Technical analysis: Solana is currently under selling pressure. Its daily trend is bearish, and its RSI is around 15, which indicates an extremely oversold market. This means a short-term recovery is possible, but it does not confirm that the downtrend has ended.
Solana (SOL)
$70.50
Approximate market price, USD · 15 Nov 2026
Technical analysis: Solana is currently under selling pressure. Its daily trend is bearish, and its RSI is around 15, which indicates an extremely oversold market. This means a short-term recovery is possible, but it does not confirm that the downtrend has ended.
60
·
--
Xem bản dịch
#SolanaUSTD
Solana (SOL) Coin Analysis – 15 November 2026
Solana (SOL)
$70.50
Approximate market price, USD · 15 Nov 2026
Technical analysis: Solana is currently under selling pressure. Its daily trend is bearish, and its RSI is around 15, which indicates an extremely oversold market. This means a short-term recovery is possible, but it does not confirm that the downtrend has ended.
#SolanaUSTD
Solana (SOL) Coin Analysis – 15 November 2026
Solana (SOL)
$70.50
Approximate market price, USD · 15 Nov 2026
Technical analysis: Solana is currently under selling pressure. Its daily trend is bearish, and its RSI is around 15, which indicates an extremely oversold market. This means a short-term recovery is possible, but it does not confirm that the downtrend has ended.
Solana (SOL) Coin Analysis – 15 November 2026
Solana (SOL)
$70.50
Approximate market price, USD · 15 Nov 2026
Technical analysis: Solana is currently under selling pressure. Its daily trend is bearish, and its RSI is around 15, which indicates an extremely oversold market. This means a short-term recovery is possible, but it does not confirm that the downtrend has ended.
80
·
--
Xem bản dịch
#JCTUSTD Janction (JCT) Coin – Complete Market & Technical Analysis | 14 November 2026
Janction (JCT) is currently showing a strong bearish trend, with its approximate market price around $0.0020. The coin has experienced a significant decline after reaching a recent high near $0.018 on November 8, representing an approximate 88–90% drop. The current market structure indicates strong selling pressure and high volatility. The important support levels are $0.00195, $0.00180 and $0.00150, while the major resistance levels are $0.00250, $0.00300 and $0.00500. If JCT successfully breaks above $0.00250 with strong trading volume, a recovery towards $0.00300 and potentially $0.00500 may become possible. However, if the price falls below $0.00180, further downside risk could increase. Investors should also watch the expected December 10, 2026 token unlock, which may create additional selling pressure. My overall outlook is cautious and bearish in the short term. For long-term investors, waiting for price stability and a confirmed bullish reversal is a safer approach than investing the entire amount immediately. JCT has potential for recovery, but it remains a highly speculative cryptocurrency with significant investment risk. Final Verdict: Wait for confirmation before buying and always manage your risk.
Important chart levels
Technical level Price
Immediate resistance $0.002446
Strong resistance $0.002512
Bullish confirmation (1H) $0.002549
Immediate support $0.001949
Next support $0.001920
Daily trend invalidation
#JCTUSTD Janction (JCT) Coin – Complete Market & Technical Analysis | 14 November 2026
Janction (JCT) is currently showing a strong bearish trend, with its approximate market price around $0.0020. The coin has experienced a significant decline after reaching a recent high near $0.018 on November 8, representing an approximate 88–90% drop. The current market structure indicates strong selling pressure and high volatility. The important support levels are $0.00195, $0.00180 and $0.00150, while the major resistance levels are $0.00250, $0.00300 and $0.00500. If JCT successfully breaks above $0.00250 with strong trading volume, a recovery towards $0.00300 and potentially $0.00500 may become possible. However, if the price falls below $0.00180, further downside risk could increase. Investors should also watch the expected December 10, 2026 token unlock, which may create additional selling pressure. My overall outlook is cautious and bearish in the short term. For long-term investors, waiting for price stability and a confirmed bullish reversal is a safer approach than investing the entire amount immediately. JCT has potential for recovery, but it remains a highly speculative cryptocurrency with significant investment risk. Final Verdict: Wait for confirmation before buying and always manage your risk.
Important chart levels
Technical level Price
Immediate resistance $0.002446
Strong resistance $0.002512
Bullish confirmation (1H) $0.002549
Immediate support $0.001949
Next support $0.001920
Daily trend invalidation
Janction (JCT) is currently showing a strong bearish trend, with its approximate market price around $0.0020. The coin has experienced a significant decline after reaching a recent high near $0.018 on November 8, representing an approximate 88–90% drop. The current market structure indicates strong selling pressure and high volatility. The important support levels are $0.00195, $0.00180 and $0.00150, while the major resistance levels are $0.00250, $0.00300 and $0.00500. If JCT successfully breaks above $0.00250 with strong trading volume, a recovery towards $0.00300 and potentially $0.00500 may become possible. However, if the price falls below $0.00180, further downside risk could increase. Investors should also watch the expected December 10, 2026 token unlock, which may create additional selling pressure. My overall outlook is cautious and bearish in the short term. For long-term investors, waiting for price stability and a confirmed bullish reversal is a safer approach than investing the entire amount immediately. JCT has potential for recovery, but it remains a highly speculative cryptocurrency with significant investment risk. Final Verdict: Wait for confirmation before buying and always manage your risk.
Important chart levels
Technical level Price
Immediate resistance $0.002446
Strong resistance $0.002512
Bullish confirmation (1H) $0.002549
Immediate support $0.001949
Next support $0.001920
Daily trend invalidation
420
·
--
#Xrp🔥🔥 Phân tích của tôi
Ngắn hạn: Xu hướng giảm.
RSI 24: Quá bán; có thể xuất hiện một đợt phục hồi tạm thời.
Tín hiệu tăng giá: XRP cần vượt lại mức $1.06593.
Tín hiệu giảm giá: Nếu giảm xuống dưới $0.99767, giá có thể tiếp tục rơi về các mức hỗ trợ thấp hơn.
Khuyến nghị của tôi: Đừng đầu tư toàn bộ số tiền cùng một lúc. Hãy chờ xác nhận rằng giá đã phục hồi.
Đây là các mức kỹ thuật, không phải mức giá tương lai được đảm bảo.
Một câu hỏi
Bạn có muốn tôi lập kế hoạch đầu tư XRP chi tiết với 50,000 Rupee Pakistan, bao gồm số lượng XRP bạn có thể mua, giá vào lệnh, mức cắt lỗ và lợi nhuận tiềm năng không?
#Xrp🔥🔥 Phân tích của tôi
Ngắn hạn: Xu hướng giảm.
RSI 24: Quá bán; có thể xuất hiện một đợt phục hồi tạm thời.
Tín hiệu tăng giá: XRP cần vượt lại mức $1.06593.
Tín hiệu giảm giá: Nếu giảm xuống dưới $0.99767, giá có thể tiếp tục rơi về các mức hỗ trợ thấp hơn.
Khuyến nghị của tôi: Đừng đầu tư toàn bộ số tiền cùng một lúc. Hãy chờ xác nhận rằng giá đã phục hồi.
Đây là các mức kỹ thuật, không phải mức giá tương lai được đảm bảo.
Một câu hỏi
Bạn có muốn tôi lập kế hoạch đầu tư XRP chi tiết với 50,000 Rupee Pakistan, bao gồm số lượng XRP bạn có thể mua, giá vào lệnh, mức cắt lỗ và lợi nhuận tiềm năng không?
Ngắn hạn: Xu hướng giảm.
RSI 24: Quá bán; có thể xuất hiện một đợt phục hồi tạm thời.
Tín hiệu tăng giá: XRP cần vượt lại mức $1.06593.
Tín hiệu giảm giá: Nếu giảm xuống dưới $0.99767, giá có thể tiếp tục rơi về các mức hỗ trợ thấp hơn.
Khuyến nghị của tôi: Đừng đầu tư toàn bộ số tiền cùng một lúc. Hãy chờ xác nhận rằng giá đã phục hồi.
Đây là các mức kỹ thuật, không phải mức giá tương lai được đảm bảo.
Một câu hỏi
Bạn có muốn tôi lập kế hoạch đầu tư XRP chi tiết với 50,000 Rupee Pakistan, bao gồm số lượng XRP bạn có thể mua, giá vào lệnh, mức cắt lỗ và lợi nhuận tiềm năng không?
260
·
--
Chỉ báo Giá trị
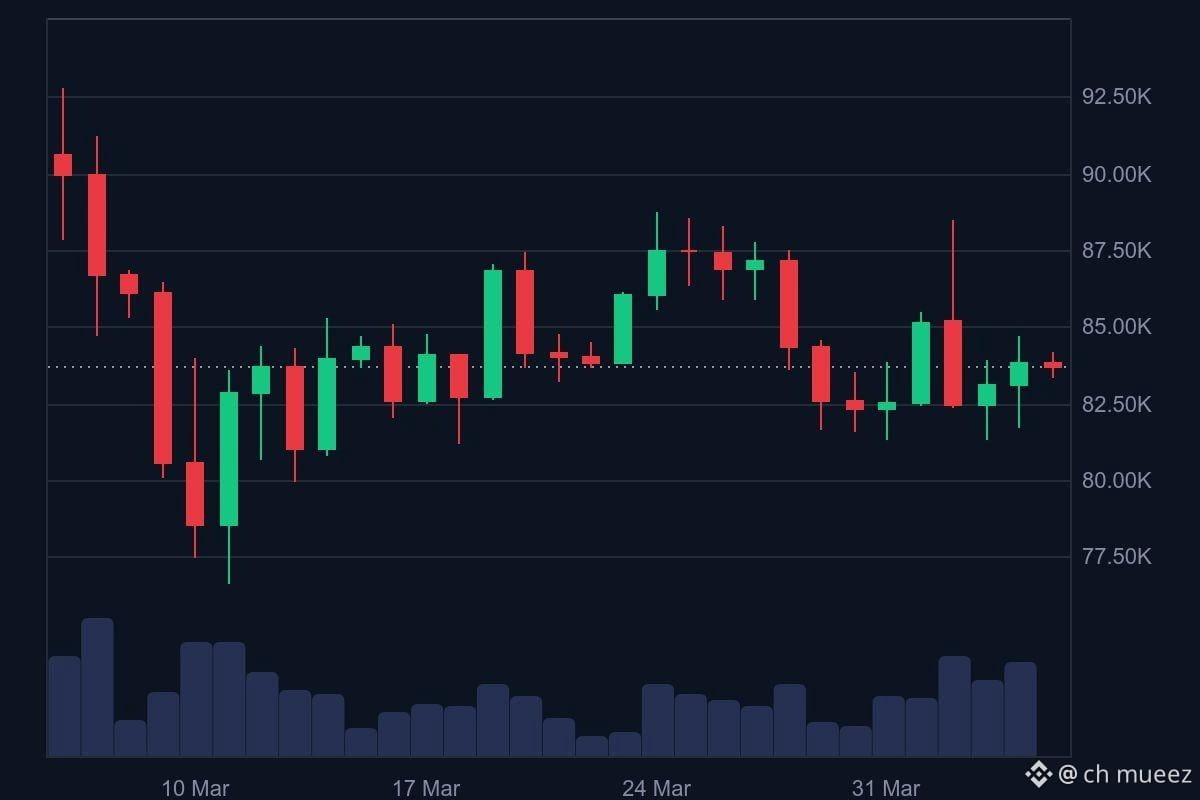
Giá BTC khoảng 65.600 USD
Biến động trong 24 giờ -4,5%
Biến động trong 7 ngày -13,4%
Hỗ trợ 1: 66.750 USD
Hỗ trợ 2: 65.186 USD
Kháng cự 1: 70.696 USD
Kháng cự 2: 73.078 USD
Phân tích của tôi
Xu hướng ngắn hạn: Giảm.
Triển vọng sẽ cải thiện nếu giá phục hồi vượt 70.700 USD.
Nếu giá giảm xuống dưới 65.186 USD, đà giảm có thể tiếp diễn.
Đừng vội mua với số lượng lớn.
Một câu hỏi quan trọng: Bạn dự định mua Bitcoin bằng 50.000 PKR hay muốn giao dịch BTC trong vài ngày?
Dựa trên câu trả lời của bạn, tôi có thể chuẩn bị biểu đồ chi tiết hơn về điểm vào lệnh, mức cắt lỗ và mục tiêu chốt lời.
Chỉ báo Giá trị
Giá BTC khoảng 65.600 USD
Biến động trong 24 giờ -4,5%
Biến động trong 7 ngày -13,4%
Hỗ trợ 1: 66.750 USD
Hỗ trợ 2: 65.186 USD
Kháng cự 1: 70.696 USD
Kháng cự 2: 73.078 USD
Phân tích của tôi
Xu hướng ngắn hạn: Giảm.
Triển vọng sẽ cải thiện nếu giá phục hồi vượt 70.700 USD.
Nếu giá giảm xuống dưới 65.186 USD, đà giảm có thể tiếp diễn.
Đừng vội mua với số lượng lớn.
Một câu hỏi quan trọng: Bạn dự định mua Bitcoin bằng 50.000 PKR hay muốn giao dịch BTC trong vài ngày?
Dựa trên câu trả lời của bạn, tôi có thể chuẩn bị biểu đồ chi tiết hơn về điểm vào lệnh, mức cắt lỗ và mục tiêu chốt lời.
Giá BTC khoảng 65.600 USD
Biến động trong 24 giờ -4,5%
Biến động trong 7 ngày -13,4%
Hỗ trợ 1: 66.750 USD
Hỗ trợ 2: 65.186 USD
Kháng cự 1: 70.696 USD
Kháng cự 2: 73.078 USD
Phân tích của tôi
Xu hướng ngắn hạn: Giảm.
Triển vọng sẽ cải thiện nếu giá phục hồi vượt 70.700 USD.
Nếu giá giảm xuống dưới 65.186 USD, đà giảm có thể tiếp diễn.
Đừng vội mua với số lượng lớn.
Một câu hỏi quan trọng: Bạn dự định mua Bitcoin bằng 50.000 PKR hay muốn giao dịch BTC trong vài ngày?
Dựa trên câu trả lời của bạn, tôi có thể chuẩn bị biểu đồ chi tiết hơn về điểm vào lệnh, mức cắt lỗ và mục tiêu chốt lời.
127


·
--
#MyFirstSquarePost Mới đến Binance Square, rất vui được chia sẻ và kết nối với mọi người ở đây!
#MyFirstSquarePost Mới đến Binance Square, rất vui được chia sẻ và kết nối với mọi người ở đây!
139
Đăng nhập để khám phá thêm nội dung
Tham gia cùng người dùng tiền mã hóa toàn cầu trên Binance Square
⚡️ Nhận thông tin mới nhất và hữu ích về tiền mã hóa.
💬 Được tin cậy bởi sàn giao dịch tiền mã hóa lớn nhất thế giới.
👍 Khám phá những thông tin chuyên sâu thực tế từ những nhà sáng tạo đã xác minh.
Email / Số điện thoại
Chủ đề thịnh hành
TheoDõiFOMC
355,625 lượt xem
1,520 đang thảo luận
TIN NÓNG: Đồng đô la vừa chạm mức cao nhất trong 19 tháng. 💵
📈 Mức: Chỉ số đô la tăng lên 103,02, cao nhất kể từ tháng 4 năm 2025. Đồng yên neo gần mức 160 yên đổi 1 đô la, còn đồng euro chạm mức thấp nhất trong 19 tháng.
🔥 Tác nhân: CPI tháng 10 tăng 0,4%, cao hơn dự báo 0,3%; CPI lõi tăng 0,3%, so với mức dự kiến 0,2%. Thống đốc Fed Waller cho biết Fed đang cân nhắc nâng lãi suất 50 điểm cơ bản vào tháng 12.
📊 Xác suất: Thị trường hiện gần như chắc chắn Fed sẽ tăng lãi suất vào tháng 12, với xác suất khoảng 88% cho mức tăng 25 điểm cơ bản và 12% cho mức tăng 50 điểm cơ bản. Goldman dự đoán sẽ có thêm một đợt tăng lãi suất vào tháng 3.
🔮 Triển vọng: Đồng đô la mạnh gây bất lợi cho các tài sản rủi ro. Bitcoin neo quanh mức 73.600 USD; dữ liệu giá sản xuất công bố vào thứ Sáu sẽ là phép thử tiếp theo.
$BTC #TheoDõiFOMC
lenamphoto
·1 lượt thích
·1.2k lượt xem
TinFed
416,875 lượt xem
1,259 đang thảo luận
CryptoSelloffTriggersMultipleWhaleLiquidations
6,792 lượt xem
178 đang thảo luận