

8crpto guy
20 Bài đăng

8crpto guy
Báo cáo
Chặn người dùng
10 Đang theo dõi
3 Người theo dõi
1 Đã thích
Bài đăng
PINNED
·
--
SPCX
Tổng quan đầu tư
bearish
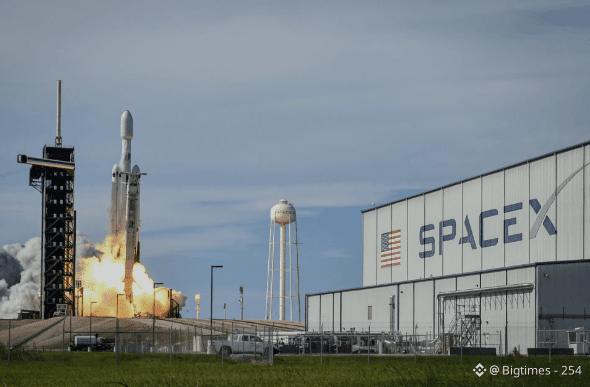
SPCX đạt điểm tin cậy 61/100 và xếp hạng HOLD, phản ánh một doanh nghiệp nền tảng đẳng cấp thế giới (Starlink +50% tăng trưởng, 83% thị phần phóng toàn cầu) nhưng bị kìm hãm nghiêm trọng bởi bội số EV/Doanh thu 45x, lỗ ròng theo chuẩn GAAP 4,94B USD và một biểu đồ kỹ thuật bị “gãy”, đã mất 45% từ đỉnh ngày 16/6. Cổ phiếu đã vượt khỏi giá IPO 135 USD trong bối cảnh quá trình Starship bị hủy/chỉnh sửa và bán ra trước thềm công bố lợi nhuận; hai chất xúc tác ngắn hạn quan trọng nhất là báo cáo Q2 vào ngày 6/8 và thời hạn hết “lockup” vào tháng 12. Các nhà đầu tư tổ chức như ARK đang bước vào ở mức giá hiện tại, nhưng tỷ lệ rủi ro/lợi nhuận là cân bằng chứ chưa thật sự hấp dẫn cho đến khi định giá và sự không chắc chắn về thực thi được làm rõ.
Tóm tắt Luận điểm:
SPCX là một doanh nghiệp mang tính thế hệ (độc quyền Starlink, thống trị mảng phóng, tùy chọn tăng trưởng nhờ AI) nhưng bị “nhốt” trong cấu trúc hậu IPO đang bị định giá quá cao; cổ phiếu cần một chất xúc tác từ kết quả lợi nhuận và bằng chứng Starship để được định giá lại.
Điều Gì Sẽ Làm Luận Điểm Này Sai:
Kịch bản tăng giá bị vô hiệu nếu chương trình Starship gặp thất bại kéo dài, các khoản lỗ do AI mở rộng vượt quá 8B USD mỗi năm, hoặc Musk chuyển vốn sang Tesla/các dự án khác; kịch bản giảm giá bị vô hiệu nếu kết quả Q2 vượt kỳ vọng mạnh và Flight 13 thành công.
SPCX
Tổng quan đầu tư
bearish
SPCX đạt điểm tin cậy 61/100 và xếp hạng HOLD, phản ánh một doanh nghiệp nền tảng đẳng cấp thế giới (Starlink +50% tăng trưởng, 83% thị phần phóng toàn cầu) nhưng bị kìm hãm nghiêm trọng bởi bội số EV/Doanh thu 45x, lỗ ròng theo chuẩn GAAP 4,94B USD và một biểu đồ kỹ thuật bị “gãy”, đã mất 45% từ đỉnh ngày 16/6. Cổ phiếu đã vượt khỏi giá IPO 135 USD trong bối cảnh quá trình Starship bị hủy/chỉnh sửa và bán ra trước thềm công bố lợi nhuận; hai chất xúc tác ngắn hạn quan trọng nhất là báo cáo Q2 vào ngày 6/8 và thời hạn hết “lockup” vào tháng 12. Các nhà đầu tư tổ chức như ARK đang bước vào ở mức giá hiện tại, nhưng tỷ lệ rủi ro/lợi nhuận là cân bằng chứ chưa thật sự hấp dẫn cho đến khi định giá và sự không chắc chắn về thực thi được làm rõ.
Tóm tắt Luận điểm:
SPCX là một doanh nghiệp mang tính thế hệ (độc quyền Starlink, thống trị mảng phóng, tùy chọn tăng trưởng nhờ AI) nhưng bị “nhốt” trong cấu trúc hậu IPO đang bị định giá quá cao; cổ phiếu cần một chất xúc tác từ kết quả lợi nhuận và bằng chứng Starship để được định giá lại.
Điều Gì Sẽ Làm Luận Điểm Này Sai:
Kịch bản tăng giá bị vô hiệu nếu chương trình Starship gặp thất bại kéo dài, các khoản lỗ do AI mở rộng vượt quá 8B USD mỗi năm, hoặc Musk chuyển vốn sang Tesla/các dự án khác; kịch bản giảm giá bị vô hiệu nếu kết quả Q2 vượt kỳ vọng mạnh và Flight 13 thành công.
Tổng quan đầu tư
bearish
SPCX đạt điểm tin cậy 61/100 và xếp hạng HOLD, phản ánh một doanh nghiệp nền tảng đẳng cấp thế giới (Starlink +50% tăng trưởng, 83% thị phần phóng toàn cầu) nhưng bị kìm hãm nghiêm trọng bởi bội số EV/Doanh thu 45x, lỗ ròng theo chuẩn GAAP 4,94B USD và một biểu đồ kỹ thuật bị “gãy”, đã mất 45% từ đỉnh ngày 16/6. Cổ phiếu đã vượt khỏi giá IPO 135 USD trong bối cảnh quá trình Starship bị hủy/chỉnh sửa và bán ra trước thềm công bố lợi nhuận; hai chất xúc tác ngắn hạn quan trọng nhất là báo cáo Q2 vào ngày 6/8 và thời hạn hết “lockup” vào tháng 12. Các nhà đầu tư tổ chức như ARK đang bước vào ở mức giá hiện tại, nhưng tỷ lệ rủi ro/lợi nhuận là cân bằng chứ chưa thật sự hấp dẫn cho đến khi định giá và sự không chắc chắn về thực thi được làm rõ.
Tóm tắt Luận điểm:
SPCX là một doanh nghiệp mang tính thế hệ (độc quyền Starlink, thống trị mảng phóng, tùy chọn tăng trưởng nhờ AI) nhưng bị “nhốt” trong cấu trúc hậu IPO đang bị định giá quá cao; cổ phiếu cần một chất xúc tác từ kết quả lợi nhuận và bằng chứng Starship để được định giá lại.
Điều Gì Sẽ Làm Luận Điểm Này Sai:
Kịch bản tăng giá bị vô hiệu nếu chương trình Starship gặp thất bại kéo dài, các khoản lỗ do AI mở rộng vượt quá 8B USD mỗi năm, hoặc Musk chuyển vốn sang Tesla/các dự án khác; kịch bản giảm giá bị vô hiệu nếu kết quả Q2 vượt kỳ vọng mạnh và Flight 13 thành công.
1
195
·
--
📈 $SPCX — Tóm tắt thị trường
Giá: 140,00 USD (-0,91%)
Điểm tin cậy: 61/100 · MUA
Xu hướng: TÍCH CỰC
Mục tiêu mô hình hóa: 232 USD (12 tháng, đồng thuận); Morgan Stanley cơ sở $300 (12–24 tháng)
SPCX đạt điểm tin cậy 61/100 và xếp hạng MUA, phản ánh động lượng cơ bản đặc biệt mạnh (tăng trưởng doanh thu 92%, tăng trưởng EBITDA 191%, Cursor đã đóng) được cân bằng với hồ sơ RỦI RO CAO do định giá cực cao, rủi ro thời gian khóa kéo dài, vượt hạn
Gần đây:
• Tháng 8/2026: Morgan Stanley tái khẳng định Tăng tỷ trọng (Overweight), mục tiêu $300; đưa ra kịch bản định giá tăng giá $600.
• Tháng 8/2026: Giao dịch mua lại Cursor đóng vào ngày 14/8; mô hình Grok 4.6 được phát hành; các mốc quan trọng mảng AI đang tăng tốc.
$SPCX
📈 $SPCX — Tóm tắt thị trường
Giá: 140,00 USD (-0,91%)
Điểm tin cậy: 61/100 · MUA
Xu hướng: TÍCH CỰC
Mục tiêu mô hình hóa: 232 USD (12 tháng, đồng thuận); Morgan Stanley cơ sở $300 (12–24 tháng)
SPCX đạt điểm tin cậy 61/100 và xếp hạng MUA, phản ánh động lượng cơ bản đặc biệt mạnh (tăng trưởng doanh thu 92%, tăng trưởng EBITDA 191%, Cursor đã đóng) được cân bằng với hồ sơ RỦI RO CAO do định giá cực cao, rủi ro thời gian khóa kéo dài, vượt hạn
Gần đây:
• Tháng 8/2026: Morgan Stanley tái khẳng định Tăng tỷ trọng (Overweight), mục tiêu $300; đưa ra kịch bản định giá tăng giá $600.
• Tháng 8/2026: Giao dịch mua lại Cursor đóng vào ngày 14/8; mô hình Grok 4.6 được phát hành; các mốc quan trọng mảng AI đang tăng tốc.
$SPCX
Giá: 140,00 USD (-0,91%)
Điểm tin cậy: 61/100 · MUA
Xu hướng: TÍCH CỰC
Mục tiêu mô hình hóa: 232 USD (12 tháng, đồng thuận); Morgan Stanley cơ sở $300 (12–24 tháng)
SPCX đạt điểm tin cậy 61/100 và xếp hạng MUA, phản ánh động lượng cơ bản đặc biệt mạnh (tăng trưởng doanh thu 92%, tăng trưởng EBITDA 191%, Cursor đã đóng) được cân bằng với hồ sơ RỦI RO CAO do định giá cực cao, rủi ro thời gian khóa kéo dài, vượt hạn
Gần đây:
• Tháng 8/2026: Morgan Stanley tái khẳng định Tăng tỷ trọng (Overweight), mục tiêu $300; đưa ra kịch bản định giá tăng giá $600.
• Tháng 8/2026: Giao dịch mua lại Cursor đóng vào ngày 14/8; mô hình Grok 4.6 được phát hành; các mốc quan trọng mảng AI đang tăng tốc.
$SPCX
88
·
--
SpaceX đóng cửa thương vụ mua lại Cursor trị giá 60B USD bằng cổ phiếu; Cursor bắt đầu huấn luyện các mô hình Grok trên siêu máy tính Colossus $SPCX
SpaceX đóng cửa thương vụ mua lại Cursor trị giá 60B USD bằng cổ phiếu; Cursor bắt đầu huấn luyện các mô hình Grok trên siêu máy tính Colossus $SPCX

84
·
--
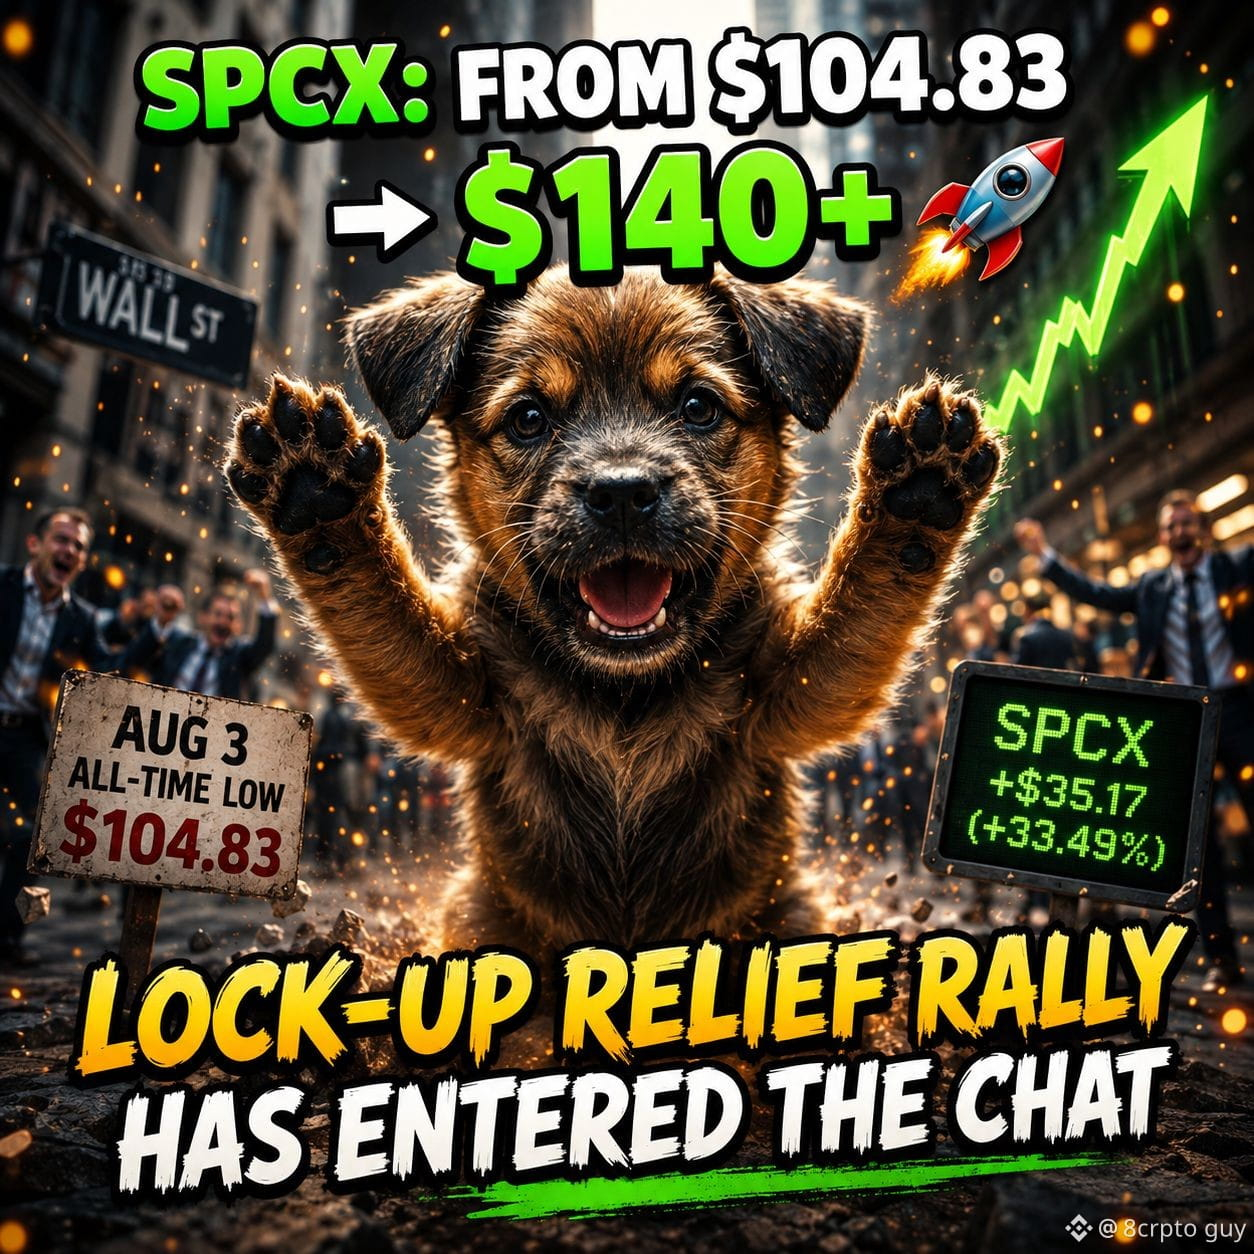
SPCX bật tăng 30%+ từ mức thấp mọi thời đại ngày 3/8 là 104,83 USD; giành lại 140 USD sau đợt phục hồi nhờ tin tức xoa dịu hậu kỳ hạn khóa/lock-up
$SPCX
SPCX bật tăng 30%+ từ mức thấp mọi thời đại ngày 3/8 là 104,83 USD; giành lại 140 USD sau đợt phục hồi nhờ tin tức xoa dịu hậu kỳ hạn khóa/lock-up
$SPCX
$SPCX
160
·
--
$BTC
➖ $BTC — Tóm tắt thị trường
Giá: 64.967 USD (+1,26%)
Điểm tin cậy: 54/100 · GIỮ
Xu hướng: TRUNG LẬP
Mục tiêu mô hình: 76.000 USD (kịch bản cơ sở 12 tháng); 120.000 USD (kịch bản tăng giá khi Đạo luật CLARITY được thông qua + dòng tiền ETF tái khởi động) (12 tháng)
BTC đạt Điểm tin cậy 54/100 và được xếp hạng GIỮ. Tài sản có nền tảng vững chắc về mặt cấu trúc — nguồn cung cố định, hạ tầng thể chế đang mở rộng và mức độ rõ ràng về pháp lý ở Mỹ ngày càng được cải thiện — nhưng hiện tại đang trong giai đoạn tích lũy/đi ngang mang tính kỹ thuật
Gần đây:
• Th07/2026: Hạn chót ban hành quy định theo Đạo luật GENIUS đã qua; sự im lặng của Fed có thể đẩy việc tuân thủ stablecoin sang tháng 01/2027.
• Th08/2026: BTC tích lũy trong vùng 62.500–65.500 USD; các hồ sơ 13-F của tổ chức ở Q2 sẽ đến hạn vào ngày 15/08 và sẽ cho thấy danh mục nắm giữ ETF.
$BTC
➖ $BTC — Tóm tắt thị trường
Giá: 64.967 USD (+1,26%)
Điểm tin cậy: 54/100 · GIỮ
Xu hướng: TRUNG LẬP
Mục tiêu mô hình: 76.000 USD (kịch bản cơ sở 12 tháng); 120.000 USD (kịch bản tăng giá khi Đạo luật CLARITY được thông qua + dòng tiền ETF tái khởi động) (12 tháng)
BTC đạt Điểm tin cậy 54/100 và được xếp hạng GIỮ. Tài sản có nền tảng vững chắc về mặt cấu trúc — nguồn cung cố định, hạ tầng thể chế đang mở rộng và mức độ rõ ràng về pháp lý ở Mỹ ngày càng được cải thiện — nhưng hiện tại đang trong giai đoạn tích lũy/đi ngang mang tính kỹ thuật
Gần đây:
• Th07/2026: Hạn chót ban hành quy định theo Đạo luật GENIUS đã qua; sự im lặng của Fed có thể đẩy việc tuân thủ stablecoin sang tháng 01/2027.
• Th08/2026: BTC tích lũy trong vùng 62.500–65.500 USD; các hồ sơ 13-F của tổ chức ở Q2 sẽ đến hạn vào ngày 15/08 và sẽ cho thấy danh mục nắm giữ ETF.
➖ $BTC — Tóm tắt thị trường
Giá: 64.967 USD (+1,26%)
Điểm tin cậy: 54/100 · GIỮ
Xu hướng: TRUNG LẬP
Mục tiêu mô hình: 76.000 USD (kịch bản cơ sở 12 tháng); 120.000 USD (kịch bản tăng giá khi Đạo luật CLARITY được thông qua + dòng tiền ETF tái khởi động) (12 tháng)
BTC đạt Điểm tin cậy 54/100 và được xếp hạng GIỮ. Tài sản có nền tảng vững chắc về mặt cấu trúc — nguồn cung cố định, hạ tầng thể chế đang mở rộng và mức độ rõ ràng về pháp lý ở Mỹ ngày càng được cải thiện — nhưng hiện tại đang trong giai đoạn tích lũy/đi ngang mang tính kỹ thuật
Gần đây:
• Th07/2026: Hạn chót ban hành quy định theo Đạo luật GENIUS đã qua; sự im lặng của Fed có thể đẩy việc tuân thủ stablecoin sang tháng 01/2027.
• Th08/2026: BTC tích lũy trong vùng 62.500–65.500 USD; các hồ sơ 13-F của tổ chức ở Q2 sẽ đến hạn vào ngày 15/08 và sẽ cho thấy danh mục nắm giữ ETF.

88
·
--
Xem bản dịch
📈 $NVDA —Market Summary
Price: $211.94 (+2.93%)
Conviction Score: 81/100 · BUY
Bias: BULLISH
Modeled Target: $300 (12 months)
NVDA earns a conviction score of 81/100 and a BUY rating, anchored by record revenue acceleration, the Vera Rubin platform ramp beginning Q3 2026, and a forward P/E of ~21x that sits 44% below its 10-year historical average.
Recent:
• Jun 2026: GTC Taipei: Vera Rubin confirmed entering full production; Vera CPU ships to OpenAI, Oracle, Anthropic.
• Jul 2026: KeyBanc raises NVDA price target from $310 to $330; consensus Strong Buy maintained.
📈 $NVDA —Market Summary
Price: $211.94 (+2.93%)
Conviction Score: 81/100 · BUY
Bias: BULLISH
Modeled Target: $300 (12 months)
NVDA earns a conviction score of 81/100 and a BUY rating, anchored by record revenue acceleration, the Vera Rubin platform ramp beginning Q3 2026, and a forward P/E of ~21x that sits 44% below its 10-year historical average.
Recent:
• Jun 2026: GTC Taipei: Vera Rubin confirmed entering full production; Vera CPU ships to OpenAI, Oracle, Anthropic.
• Jul 2026: KeyBanc raises NVDA price target from $310 to $330; consensus Strong Buy maintained.
Price: $211.94 (+2.93%)
Conviction Score: 81/100 · BUY
Bias: BULLISH
Modeled Target: $300 (12 months)
NVDA earns a conviction score of 81/100 and a BUY rating, anchored by record revenue acceleration, the Vera Rubin platform ramp beginning Q3 2026, and a forward P/E of ~21x that sits 44% below its 10-year historical average.
Recent:
• Jun 2026: GTC Taipei: Vera Rubin confirmed entering full production; Vera CPU ships to OpenAI, Oracle, Anthropic.
• Jul 2026: KeyBanc raises NVDA price target from $310 to $330; consensus Strong Buy maintained.
71
·
--
$BTC
{spot}(BTCUSDT)
Bitcoin ghi 38/100 điểm theo khung niềm tin (conviction) của Bigtimes, nhận xếp hạng GIỮ (HOLD) trong bối cảnh vĩ mô và kỹ thuật đang nghiêng về bi quan. BTC đã giảm khoảng ~31% từ đầu năm (YTD) trong năm 2026, từ mức $93K xuống đáy 21 tháng gần $58K, do chính sách diều hâu của Fed và dòng ETF chảy ra 4,5 tỷ USD trong tháng 6, chứ không phải do thất bại nội tại của crypto. Luận điểm cấu trúc dài hạn — nguồn cung bị giới hạn, quy định của Mỹ đang cải thiện, và chính sách SBR — vẫn còn nguyên vẹn, nhưng cần có một sự đảo chiều xu hướng được xác nhận vượt $65,600 trước khi nâng mức độ tin cậy (conviction).
BTC đang ở trong một xu hướng giảm sau đỉnh ATH (suy giảm sau mức cao nhất mọi thời đại) đã được xác nhận, được thúc đẩy bởi chính sách Fed diều hâu và dòng ETF chảy ra ở mức kỷ lục; tuy nhiên, tính khan hiếm dài hạn và mức độ rõ ràng về quy định của Mỹ đang cải thiện tạo nền tảng cho giá sàn. Quyết định của FOMC ngày 28–29/7 và việc công bố kiến trúc SBR là các chất xúc tác nhị phân (binary) gần nhất.
Điều gì sẽ làm luận điểm này bị phủ định: Chuyển đổi niềm tin sang TÍCH CỰC (bullish) khi: duy trì đóng cửa trên $70,000 kèm dòng tiền ETF quay trở lại; chuyển đổi niềm tin sang BÁN (SELL) khi: phá vỡ và đóng cửa theo tuần dưới $57,800 hoặc khi có xác nhận Fed tăng lãi suất.
$BTC
Bitcoin ghi 38/100 điểm theo khung niềm tin (conviction) của Bigtimes, nhận xếp hạng GIỮ (HOLD) trong bối cảnh vĩ mô và kỹ thuật đang nghiêng về bi quan. BTC đã giảm khoảng ~31% từ đầu năm (YTD) trong năm 2026, từ mức $93K xuống đáy 21 tháng gần $58K, do chính sách diều hâu của Fed và dòng ETF chảy ra 4,5 tỷ USD trong tháng 6, chứ không phải do thất bại nội tại của crypto. Luận điểm cấu trúc dài hạn — nguồn cung bị giới hạn, quy định của Mỹ đang cải thiện, và chính sách SBR — vẫn còn nguyên vẹn, nhưng cần có một sự đảo chiều xu hướng được xác nhận vượt $65,600 trước khi nâng mức độ tin cậy (conviction).
BTC đang ở trong một xu hướng giảm sau đỉnh ATH (suy giảm sau mức cao nhất mọi thời đại) đã được xác nhận, được thúc đẩy bởi chính sách Fed diều hâu và dòng ETF chảy ra ở mức kỷ lục; tuy nhiên, tính khan hiếm dài hạn và mức độ rõ ràng về quy định của Mỹ đang cải thiện tạo nền tảng cho giá sàn. Quyết định của FOMC ngày 28–29/7 và việc công bố kiến trúc SBR là các chất xúc tác nhị phân (binary) gần nhất.
Điều gì sẽ làm luận điểm này bị phủ định: Chuyển đổi niềm tin sang TÍCH CỰC (bullish) khi: duy trì đóng cửa trên $70,000 kèm dòng tiền ETF quay trở lại; chuyển đổi niềm tin sang BÁN (SELL) khi: phá vỡ và đóng cửa theo tuần dưới $57,800 hoặc khi có xác nhận Fed tăng lãi suất.
Bitcoin ghi 38/100 điểm theo khung niềm tin (conviction) của Bigtimes, nhận xếp hạng GIỮ (HOLD) trong bối cảnh vĩ mô và kỹ thuật đang nghiêng về bi quan. BTC đã giảm khoảng ~31% từ đầu năm (YTD) trong năm 2026, từ mức $93K xuống đáy 21 tháng gần $58K, do chính sách diều hâu của Fed và dòng ETF chảy ra 4,5 tỷ USD trong tháng 6, chứ không phải do thất bại nội tại của crypto. Luận điểm cấu trúc dài hạn — nguồn cung bị giới hạn, quy định của Mỹ đang cải thiện, và chính sách SBR — vẫn còn nguyên vẹn, nhưng cần có một sự đảo chiều xu hướng được xác nhận vượt $65,600 trước khi nâng mức độ tin cậy (conviction).
BTC đang ở trong một xu hướng giảm sau đỉnh ATH (suy giảm sau mức cao nhất mọi thời đại) đã được xác nhận, được thúc đẩy bởi chính sách Fed diều hâu và dòng ETF chảy ra ở mức kỷ lục; tuy nhiên, tính khan hiếm dài hạn và mức độ rõ ràng về quy định của Mỹ đang cải thiện tạo nền tảng cho giá sàn. Quyết định của FOMC ngày 28–29/7 và việc công bố kiến trúc SBR là các chất xúc tác nhị phân (binary) gần nhất.
Điều gì sẽ làm luận điểm này bị phủ định: Chuyển đổi niềm tin sang TÍCH CỰC (bullish) khi: duy trì đóng cửa trên $70,000 kèm dòng tiền ETF quay trở lại; chuyển đổi niềm tin sang BÁN (SELL) khi: phá vỡ và đóng cửa theo tuần dưới $57,800 hoặc khi có xác nhận Fed tăng lãi suất.

77
·
--

Bài viết
BNB · BNB (Xây dựng và Xây dựng) / Binance Coin Tháng 7/2026 · Crypto (BNB Chain / Binance$BNB
#binancecoin
Phân tích kỹ thuật
Xu hướng
Xu hướng giảm chính từ đỉnh ATH tháng 10/2025 ($1.375); giá đã giảm khoảng ~58% so với hiện tại; cấu trúc khung tuần vẫn nằm trong kênh giảm dần.
Tín hiệu RSI
RSI trung tính (~50–55); không quá bán, không có phân kỳ động lượng rõ ràng; cú bật lại trước đó vào tháng 2 khi RSI ở 26 đã không thể vượt lại các đỉnh trước.
Đường trung bình động.
Giá dưới EMA20 và EMA50; Supertrend kháng cự giảm giá trong vùng $685–$715; tương quan BTC 0,85+ nghĩa là hướng đi của BTC là động lực chính.
Hỗ trợ / Kháng cự
$560–$564 (hỗ trợ quan trọng đa khung thời gian); phụ ở $530 và vùng thanh khoản sâu tại $345. / $634–$653 (vùng cung ngắn hạn); kháng cự Supertrend tại $685; kháng cự Fibonacci 1W lớn tại $764.
BNB · BNB (Xây dựng và Xây dựng) / Binance Coin Tháng 7/2026 · Crypto (BNB Chain / Binance
$BNB
#binancecoin
Phân tích kỹ thuật
Xu hướng
Xu hướng giảm chính từ đỉnh ATH tháng 10/2025 ($1.375); giá đã giảm khoảng ~58% so với hiện tại; cấu trúc khung tuần vẫn nằm trong kênh giảm dần.
Tín hiệu RSI
RSI trung tính (~50–55); không quá bán, không có phân kỳ động lượng rõ ràng; cú bật lại trước đó vào tháng 2 khi RSI ở 26 đã không thể vượt lại các đỉnh trước.
Đường trung bình động.
Giá dưới EMA20 và EMA50; Supertrend kháng cự giảm giá trong vùng $685–$715; tương quan BTC 0,85+ nghĩa là hướng đi của BTC là động lực chính.
Hỗ trợ / Kháng cự
$560–$564 (hỗ trợ quan trọng đa khung thời gian); phụ ở $530 và vùng thanh khoản sâu tại $345. / $634–$653 (vùng cung ngắn hạn); kháng cự Supertrend tại $685; kháng cự Fibonacci 1W lớn tại $764.
#binancecoin
Phân tích kỹ thuật
Xu hướng
Xu hướng giảm chính từ đỉnh ATH tháng 10/2025 ($1.375); giá đã giảm khoảng ~58% so với hiện tại; cấu trúc khung tuần vẫn nằm trong kênh giảm dần.
Tín hiệu RSI
RSI trung tính (~50–55); không quá bán, không có phân kỳ động lượng rõ ràng; cú bật lại trước đó vào tháng 2 khi RSI ở 26 đã không thể vượt lại các đỉnh trước.
Đường trung bình động.
Giá dưới EMA20 và EMA50; Supertrend kháng cự giảm giá trong vùng $685–$715; tương quan BTC 0,85+ nghĩa là hướng đi của BTC là động lực chính.
Hỗ trợ / Kháng cự
$560–$564 (hỗ trợ quan trọng đa khung thời gian); phụ ở $530 và vùng thanh khoản sâu tại $345. / $634–$653 (vùng cung ngắn hạn); kháng cự Supertrend tại $685; kháng cự Fibonacci 1W lớn tại $764.
79
·
--
Bài viết
XRP$XRP
Phân tích kỹ thuật
Xu hướng
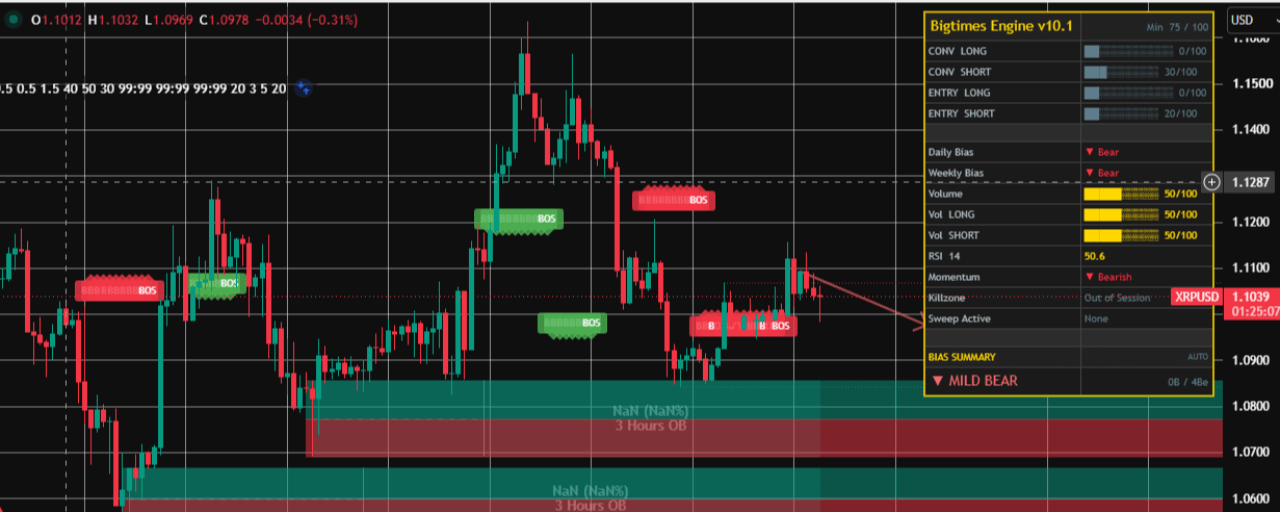
Bearish — xác nhận là giao cắt tử (MA 50 ngày $1.20 thấp hơn MA 200 ngày $1.50); giá đang ở kênh giảm (Channel Down) trong chu kỳ 1 năm tính từ đỉnh chu kỳ từ tháng 7/2025.
Tín hiệu RSI
Trung lập — RSI khoảng 54–57 trên các nguồn; chưa bị bán quá mức (>>30) nhưng không có động lượng; RSI khung tuần trước đó ở 34.7 báo hiệu điểm yếu mang tính cấu trúc.
Đường trung bình
Bearish — giá nằm dưới cả MA 50 ngày ($1.20) và MA 200 ngày ($1.50); EMA20 ($1.11) đang đóng vai trò hỗ trợ/kháng cự ngay lập tức.
Hỗ trợ / Kháng cự
$1.07–$1.00 (Fib 0.618 / tâm lý; rủi ro vi phạm giảm xuống $0.85–$0.90) / $1.15–$1.19 (EMA50 / điểm xoay); mốc quan trọng tiếp theo ở $1.30; $1.46–$1.60 là ngưỡng cản trung hạn
XRP
$XRP
Phân tích kỹ thuật
Xu hướng
Bearish — xác nhận là giao cắt tử (MA 50 ngày $1.20 thấp hơn MA 200 ngày $1.50); giá đang ở kênh giảm (Channel Down) trong chu kỳ 1 năm tính từ đỉnh chu kỳ từ tháng 7/2025.
Tín hiệu RSI
Trung lập — RSI khoảng 54–57 trên các nguồn; chưa bị bán quá mức (>>30) nhưng không có động lượng; RSI khung tuần trước đó ở 34.7 báo hiệu điểm yếu mang tính cấu trúc.
Đường trung bình
Bearish — giá nằm dưới cả MA 50 ngày ($1.20) và MA 200 ngày ($1.50); EMA20 ($1.11) đang đóng vai trò hỗ trợ/kháng cự ngay lập tức.
Hỗ trợ / Kháng cự
$1.07–$1.00 (Fib 0.618 / tâm lý; rủi ro vi phạm giảm xuống $0.85–$0.90) / $1.15–$1.19 (EMA50 / điểm xoay); mốc quan trọng tiếp theo ở $1.30; $1.46–$1.60 là ngưỡng cản trung hạn
Phân tích kỹ thuật
Xu hướng
Bearish — xác nhận là giao cắt tử (MA 50 ngày $1.20 thấp hơn MA 200 ngày $1.50); giá đang ở kênh giảm (Channel Down) trong chu kỳ 1 năm tính từ đỉnh chu kỳ từ tháng 7/2025.
Tín hiệu RSI
Trung lập — RSI khoảng 54–57 trên các nguồn; chưa bị bán quá mức (>>30) nhưng không có động lượng; RSI khung tuần trước đó ở 34.7 báo hiệu điểm yếu mang tính cấu trúc.
Đường trung bình
Bearish — giá nằm dưới cả MA 50 ngày ($1.20) và MA 200 ngày ($1.50); EMA20 ($1.11) đang đóng vai trò hỗ trợ/kháng cự ngay lập tức.
Hỗ trợ / Kháng cự
$1.07–$1.00 (Fib 0.618 / tâm lý; rủi ro vi phạm giảm xuống $0.85–$0.90) / $1.15–$1.19 (EMA50 / điểm xoay); mốc quan trọng tiếp theo ở $1.30; $1.46–$1.60 là ngưỡng cản trung hạn
141
·
--
Bài viết
TESLA$TSLA
Phân tích kỹ thuật
Xu hướng
Xu hướng giảm chính từ mức cao 52 tuần $498.83; cổ phiếu giảm ~37% so với đỉnh và đang giao dịch gần đáy 11 tháng sau cú sụt giảm hậu công bố KQKD Q2.
Tín hiệu RSI
Điều kiện quá bán nghiêm trọng sau đợt bán tháo hậu công bố KQ; RSI có khả năng dưới 30 trong ngắn hạn, và theo lịch sử đây là tín hiệu cho khả năng quay về trung bình đối với TSLA.
Trung bình động
Đang giao dịch thấp hơn đáng kể so với MA 50 ngày ($402.92) và MA 200 ngày ($403.16); cả hai đường MA đang hội tụ theo xu hướng giảm — lực cản mạnh phía trên.
Hỗ trợ / Kháng cự
$297.82 (đáy 52 tuần / hỗ trợ cấu trúc) / $375–$403 (cụm MA 50 ngày / 200 ngày)
TESLA
$TSLA
Phân tích kỹ thuật
Xu hướng
Xu hướng giảm chính từ mức cao 52 tuần $498.83; cổ phiếu giảm ~37% so với đỉnh và đang giao dịch gần đáy 11 tháng sau cú sụt giảm hậu công bố KQKD Q2.
Tín hiệu RSI
Điều kiện quá bán nghiêm trọng sau đợt bán tháo hậu công bố KQ; RSI có khả năng dưới 30 trong ngắn hạn, và theo lịch sử đây là tín hiệu cho khả năng quay về trung bình đối với TSLA.
Trung bình động
Đang giao dịch thấp hơn đáng kể so với MA 50 ngày ($402.92) và MA 200 ngày ($403.16); cả hai đường MA đang hội tụ theo xu hướng giảm — lực cản mạnh phía trên.
Hỗ trợ / Kháng cự
$297.82 (đáy 52 tuần / hỗ trợ cấu trúc) / $375–$403 (cụm MA 50 ngày / 200 ngày)
Phân tích kỹ thuật
Xu hướng
Xu hướng giảm chính từ mức cao 52 tuần $498.83; cổ phiếu giảm ~37% so với đỉnh và đang giao dịch gần đáy 11 tháng sau cú sụt giảm hậu công bố KQKD Q2.
Tín hiệu RSI
Điều kiện quá bán nghiêm trọng sau đợt bán tháo hậu công bố KQ; RSI có khả năng dưới 30 trong ngắn hạn, và theo lịch sử đây là tín hiệu cho khả năng quay về trung bình đối với TSLA.
Trung bình động
Đang giao dịch thấp hơn đáng kể so với MA 50 ngày ($402.92) và MA 200 ngày ($403.16); cả hai đường MA đang hội tụ theo xu hướng giảm — lực cản mạnh phía trên.
Hỗ trợ / Kháng cự
$297.82 (đáy 52 tuần / hỗ trợ cấu trúc) / $375–$403 (cụm MA 50 ngày / 200 ngày)
145
·
--
Xem bản dịch
Supporting Independent Financial Research
We are committed to delivering high-quality analysis and educational content covering cryptocurrency, forex, and global financial markets. My goal is to provide objective market insights, data-driven research, and timely updates that help the community make more informed decisions.
If you find our work valuable and would like to support the continued production of independent market research, you are welcome to make a voluntary contribution.
USDT (TRC20) Donation Address: TJoujS7hF4DBkxrJc6FEzW1ZEocn3asAYH
Your support directly contributes to: • In-depth market research and analysis • High-quality educational content • Access to professional research tools and market data • Consistent publication of valuable insights for the community
Every contribution is sincerely appreciated and helps sustain independent financial research.
Disclaimer: Contributions are entirely voluntary and do not constitute payment for investment advice, financial services, or guaranteed returns. All published content is for educational and informational purposes only. Please conduct your own research before making any investment decisions.
#BinanceSquare #Crypto #Bitcoin #USDT #MarketAnalysis #Trading #Investing #Blockchain #Finance #DYOR
$BTC
Supporting Independent Financial Research
We are committed to delivering high-quality analysis and educational content covering cryptocurrency, forex, and global financial markets. My goal is to provide objective market insights, data-driven research, and timely updates that help the community make more informed decisions.
If you find our work valuable and would like to support the continued production of independent market research, you are welcome to make a voluntary contribution.
USDT (TRC20) Donation Address: TJoujS7hF4DBkxrJc6FEzW1ZEocn3asAYH
Your support directly contributes to: • In-depth market research and analysis • High-quality educational content • Access to professional research tools and market data • Consistent publication of valuable insights for the community
Every contribution is sincerely appreciated and helps sustain independent financial research.
Disclaimer: Contributions are entirely voluntary and do not constitute payment for investment advice, financial services, or guaranteed returns. All published content is for educational and informational purposes only. Please conduct your own research before making any investment decisions.
#BinanceSquare #Crypto #Bitcoin #USDT #MarketAnalysis #Trading #Investing #Blockchain #Finance #DYOR
$BTC
We are committed to delivering high-quality analysis and educational content covering cryptocurrency, forex, and global financial markets. My goal is to provide objective market insights, data-driven research, and timely updates that help the community make more informed decisions.
If you find our work valuable and would like to support the continued production of independent market research, you are welcome to make a voluntary contribution.
USDT (TRC20) Donation Address: TJoujS7hF4DBkxrJc6FEzW1ZEocn3asAYH
Your support directly contributes to: • In-depth market research and analysis • High-quality educational content • Access to professional research tools and market data • Consistent publication of valuable insights for the community
Every contribution is sincerely appreciated and helps sustain independent financial research.
Disclaimer: Contributions are entirely voluntary and do not constitute payment for investment advice, financial services, or guaranteed returns. All published content is for educational and informational purposes only. Please conduct your own research before making any investment decisions.
#BinanceSquare #Crypto #Bitcoin #USDT #MarketAnalysis #Trading #Investing #Blockchain #Finance #DYOR
$BTC
8
·
--

Bài viết
Xem bản dịch
GOOGL · Alphabet Inc.$GOOGL.US
Technical Analysis
Trend
Medium-term uptrend intact (200-DMA rising) but short-term bearish; stock pulled back ~17% from May ATH of $408.61.
RSI Signal
RSI ~28-42 (depending on source); approaching oversold; stochastic oversold — bounce probability rising.
Moving Avg.
Price below 5-, 20-, 50-, and 200-DMA cluster ($346-$357); bearish MA configuration near-term.
Support / Resistance
$334–$337 (multi-timeframe confluence) / $357–$375 (EMA cluster + prior consolidation)
Post-earnings gap-down creates a potential mean-reversion setup near oversold RSI; fundamentals argue for support at $334; reclaim of $357 needed to restore momentum.
Risk Assessment Moderate
Beta 1.25; 52-week range $187–$408; elevated post-earnings vol (~5% implied move); EBITDA margin buffer limits downside. Risk profile is Moderate — strong balance sheet and diversified revenues offset regulatory and capex headwinds; antitrust ruling is the single largest binary risk.
DOJ Search antitrust remedies could structurally impair Google Search revenue.Rising capex ($195–205B 2026) compresses FCF and elevates dilution risk.EU DMA compliance orders may force data-sharing, eroding competitive moat.
Investment Recommendation BUY
Price Target: $433
Time Horizon :12 months
Cloud hyper-growth (82% YoY), Search durability, Gemini monetization inflection, and below-peer-average PE (~27x vs. 37x) create a compelling risk/reward at current levels.
Overall Investment Summary
bullish
GOOGL earns a conviction score of 74/100 (BUY) driven by an exceptional Fundamental Structure (28/34) reflecting 12 consecutive quarters of double-digit growth, 82% Cloud acceleration, and sector-low PE valuation. Macro and technical headwinds — elevated capex, post-earnings selloff, and looming antitrust rulings — weigh on near-term momentum, but the 26% gap to analyst consensus fair value and approaching-oversold technicals favor accumulation. We recommend buying into weakness with a 12-month target of $433.
Thesis Summary
Alphabet is the only mega-cap combining a dominant search franchise with a hyper-scaling cloud business (82% YoY), enterprise AI adoption at scale (Gemini in 90% of Fortune 100), and a valuation meaningfully below its mega-cap peer group.
What Would Invalidate This
Adverse DOJ Search remedy imposing structural separation; Cloud growth deceleration below 40% YoY; sustained FCF destruction from capex overshoot above $210B.
Prepared By
GOOGL · Alphabet Inc.
$GOOGL.US
Technical Analysis
Trend
Medium-term uptrend intact (200-DMA rising) but short-term bearish; stock pulled back ~17% from May ATH of $408.61.
RSI Signal
RSI ~28-42 (depending on source); approaching oversold; stochastic oversold — bounce probability rising.
Moving Avg.
Price below 5-, 20-, 50-, and 200-DMA cluster ($346-$357); bearish MA configuration near-term.
Support / Resistance
$334–$337 (multi-timeframe confluence) / $357–$375 (EMA cluster + prior consolidation)
Post-earnings gap-down creates a potential mean-reversion setup near oversold RSI; fundamentals argue for support at $334; reclaim of $357 needed to restore momentum.
Risk Assessment Moderate
Beta 1.25; 52-week range $187–$408; elevated post-earnings vol (~5% implied move); EBITDA margin buffer limits downside. Risk profile is Moderate — strong balance sheet and diversified revenues offset regulatory and capex headwinds; antitrust ruling is the single largest binary risk.
DOJ Search antitrust remedies could structurally impair Google Search revenue.Rising capex ($195–205B 2026) compresses FCF and elevates dilution risk.EU DMA compliance orders may force data-sharing, eroding competitive moat.
Investment Recommendation BUY
Price Target: $433
Time Horizon :12 months
Cloud hyper-growth (82% YoY), Search durability, Gemini monetization inflection, and below-peer-average PE (~27x vs. 37x) create a compelling risk/reward at current levels.
Overall Investment Summary
bullish
GOOGL earns a conviction score of 74/100 (BUY) driven by an exceptional Fundamental Structure (28/34) reflecting 12 consecutive quarters of double-digit growth, 82% Cloud acceleration, and sector-low PE valuation. Macro and technical headwinds — elevated capex, post-earnings selloff, and looming antitrust rulings — weigh on near-term momentum, but the 26% gap to analyst consensus fair value and approaching-oversold technicals favor accumulation. We recommend buying into weakness with a 12-month target of $433.
Thesis Summary
Alphabet is the only mega-cap combining a dominant search franchise with a hyper-scaling cloud business (82% YoY), enterprise AI adoption at scale (Gemini in 90% of Fortune 100), and a valuation meaningfully below its mega-cap peer group.
What Would Invalidate This
Adverse DOJ Search remedy imposing structural separation; Cloud growth deceleration below 40% YoY; sustained FCF destruction from capex overshoot above $210B.
Prepared By
Technical Analysis
Trend
Medium-term uptrend intact (200-DMA rising) but short-term bearish; stock pulled back ~17% from May ATH of $408.61.
RSI Signal
RSI ~28-42 (depending on source); approaching oversold; stochastic oversold — bounce probability rising.
Moving Avg.
Price below 5-, 20-, 50-, and 200-DMA cluster ($346-$357); bearish MA configuration near-term.
Support / Resistance
$334–$337 (multi-timeframe confluence) / $357–$375 (EMA cluster + prior consolidation)
Post-earnings gap-down creates a potential mean-reversion setup near oversold RSI; fundamentals argue for support at $334; reclaim of $357 needed to restore momentum.
Risk Assessment Moderate
Beta 1.25; 52-week range $187–$408; elevated post-earnings vol (~5% implied move); EBITDA margin buffer limits downside. Risk profile is Moderate — strong balance sheet and diversified revenues offset regulatory and capex headwinds; antitrust ruling is the single largest binary risk.
DOJ Search antitrust remedies could structurally impair Google Search revenue.Rising capex ($195–205B 2026) compresses FCF and elevates dilution risk.EU DMA compliance orders may force data-sharing, eroding competitive moat.
Investment Recommendation BUY
Price Target: $433
Time Horizon :12 months
Cloud hyper-growth (82% YoY), Search durability, Gemini monetization inflection, and below-peer-average PE (~27x vs. 37x) create a compelling risk/reward at current levels.
Overall Investment Summary
bullish
GOOGL earns a conviction score of 74/100 (BUY) driven by an exceptional Fundamental Structure (28/34) reflecting 12 consecutive quarters of double-digit growth, 82% Cloud acceleration, and sector-low PE valuation. Macro and technical headwinds — elevated capex, post-earnings selloff, and looming antitrust rulings — weigh on near-term momentum, but the 26% gap to analyst consensus fair value and approaching-oversold technicals favor accumulation. We recommend buying into weakness with a 12-month target of $433.
Thesis Summary
Alphabet is the only mega-cap combining a dominant search franchise with a hyper-scaling cloud business (82% YoY), enterprise AI adoption at scale (Gemini in 90% of Fortune 100), and a valuation meaningfully below its mega-cap peer group.
What Would Invalidate This
Adverse DOJ Search remedy imposing structural separation; Cloud growth deceleration below 40% YoY; sustained FCF destruction from capex overshoot above $210B.
Prepared By
1
88
·
--

Bài viết
Xem bản dịch
BTC FULL ANALYSIS$BTC
Trend
Primary trend bearish: BTC well below EMA200 (~$74,405); death cross formed in early 2026 persisting.
RSI Signal
RSI at ~52–62 (neutral); recovering from oversold conditions near $58K; not yet overbought.
Moving Avg.
Price below 50-month EMA (~$65,150); short-term MAs beginning to curl up but lagging long-term resistance.
Support / Resistance
$58,000–$58,500 (multi-month technical floor, tested Jul 1 2026) / $65,600–$66,000 (50-month EMA); $74,400 (EMA200); $80,000 (psychological)
BTC is compressed in a tight $58K–$66K range; Bollinger Band squeeze signals an imminent directional breakout; MACD histogram positive but below zero signal line.
Risk Assessment High
30-day price volatility ~2.94%; swings of 15–20% in single months commonplace; Fear & Greed Index at 29 (Fear). BTC faces a confluence of macro headwinds (elevated rates, risk-off), structural ETF redemption pressure, and unresolved US legislation — all within a bear-phase technical structure post-ATH.
CLARITY Act fails Senate vote, removing key regulatory tailwind catalyst.Fed maintains higher-for-longer rates, sustaining ETF outflow pressure.Break below $58K support triggers cascade to $40K–$50K worst-case scenario.
Investment Recommendation HOLD
Price Target
$82,000
Time Horizon
12–18 months
Structural scarcity (halving cycle), US SBR legislation, and CLARITY Act represent meaningful upside catalysts; accumulate on confirmed $58K support, exit on CLARITY Act failure.
Overall Investment Summary
neutral
BTC earns a Conviction Score of 44/100 (HOLD), reflecting a standoff between powerful long-term structural catalysts and near-term macro and ETF-driven headwinds. The asset is technically bearish below its EMA200 but coiling near major support, making the $58K–$66K range a critical decision zone. Pending US legislative catalysts (CLARITY Act, ARMA) and institutional Q2 13F disclosures in August represent the next high-impact binary events for directional resolution.
Thesis Summary
BTC is in a post-ATH corrective phase, down ~48% from its $126K peak, but retains structural bullish underpinnings via the halving supply shock, US Strategic Bitcoin Reserve legislation, and $58B+ in cumulative ETF demand. Near-term path depends on CLARITY Act progress, Fed pivot signals, and whether $58K support holds.
$$
What Would Invalidate This
A decisive weekly close below $55,000 or sustained net ETF outflows exceeding $2B/month for 3+ consecutive months invalidates the bullish recovery thesis.
BTC FULL ANALYSIS
$BTC
Trend
Primary trend bearish: BTC well below EMA200 (~$74,405); death cross formed in early 2026 persisting.
RSI Signal
RSI at ~52–62 (neutral); recovering from oversold conditions near $58K; not yet overbought.
Moving Avg.
Price below 50-month EMA (~$65,150); short-term MAs beginning to curl up but lagging long-term resistance.
Support / Resistance
$58,000–$58,500 (multi-month technical floor, tested Jul 1 2026) / $65,600–$66,000 (50-month EMA); $74,400 (EMA200); $80,000 (psychological)
BTC is compressed in a tight $58K–$66K range; Bollinger Band squeeze signals an imminent directional breakout; MACD histogram positive but below zero signal line.
Risk Assessment High
30-day price volatility ~2.94%; swings of 15–20% in single months commonplace; Fear & Greed Index at 29 (Fear). BTC faces a confluence of macro headwinds (elevated rates, risk-off), structural ETF redemption pressure, and unresolved US legislation — all within a bear-phase technical structure post-ATH.
CLARITY Act fails Senate vote, removing key regulatory tailwind catalyst.Fed maintains higher-for-longer rates, sustaining ETF outflow pressure.Break below $58K support triggers cascade to $40K–$50K worst-case scenario.
Investment Recommendation HOLD
Price Target
$82,000
Time Horizon
12–18 months
Structural scarcity (halving cycle), US SBR legislation, and CLARITY Act represent meaningful upside catalysts; accumulate on confirmed $58K support, exit on CLARITY Act failure.
Overall Investment Summary
neutral
BTC earns a Conviction Score of 44/100 (HOLD), reflecting a standoff between powerful long-term structural catalysts and near-term macro and ETF-driven headwinds. The asset is technically bearish below its EMA200 but coiling near major support, making the $58K–$66K range a critical decision zone. Pending US legislative catalysts (CLARITY Act, ARMA) and institutional Q2 13F disclosures in August represent the next high-impact binary events for directional resolution.
Thesis Summary
BTC is in a post-ATH corrective phase, down ~48% from its $126K peak, but retains structural bullish underpinnings via the halving supply shock, US Strategic Bitcoin Reserve legislation, and $58B+ in cumulative ETF demand. Near-term path depends on CLARITY Act progress, Fed pivot signals, and whether $58K support holds.
$$
What Would Invalidate This
A decisive weekly close below $55,000 or sustained net ETF outflows exceeding $2B/month for 3+ consecutive months invalidates the bullish recovery thesis.
Trend
Primary trend bearish: BTC well below EMA200 (~$74,405); death cross formed in early 2026 persisting.
RSI Signal
RSI at ~52–62 (neutral); recovering from oversold conditions near $58K; not yet overbought.
Moving Avg.
Price below 50-month EMA (~$65,150); short-term MAs beginning to curl up but lagging long-term resistance.
Support / Resistance
$58,000–$58,500 (multi-month technical floor, tested Jul 1 2026) / $65,600–$66,000 (50-month EMA); $74,400 (EMA200); $80,000 (psychological)
BTC is compressed in a tight $58K–$66K range; Bollinger Band squeeze signals an imminent directional breakout; MACD histogram positive but below zero signal line.
Risk Assessment High
30-day price volatility ~2.94%; swings of 15–20% in single months commonplace; Fear & Greed Index at 29 (Fear). BTC faces a confluence of macro headwinds (elevated rates, risk-off), structural ETF redemption pressure, and unresolved US legislation — all within a bear-phase technical structure post-ATH.
CLARITY Act fails Senate vote, removing key regulatory tailwind catalyst.Fed maintains higher-for-longer rates, sustaining ETF outflow pressure.Break below $58K support triggers cascade to $40K–$50K worst-case scenario.
Investment Recommendation HOLD
Price Target
$82,000
Time Horizon
12–18 months
Structural scarcity (halving cycle), US SBR legislation, and CLARITY Act represent meaningful upside catalysts; accumulate on confirmed $58K support, exit on CLARITY Act failure.
Overall Investment Summary
neutral
BTC earns a Conviction Score of 44/100 (HOLD), reflecting a standoff between powerful long-term structural catalysts and near-term macro and ETF-driven headwinds. The asset is technically bearish below its EMA200 but coiling near major support, making the $58K–$66K range a critical decision zone. Pending US legislative catalysts (CLARITY Act, ARMA) and institutional Q2 13F disclosures in August represent the next high-impact binary events for directional resolution.
Thesis Summary
BTC is in a post-ATH corrective phase, down ~48% from its $126K peak, but retains structural bullish underpinnings via the halving supply shock, US Strategic Bitcoin Reserve legislation, and $58B+ in cumulative ETF demand. Near-term path depends on CLARITY Act progress, Fed pivot signals, and whether $58K support holds.
$$
What Would Invalidate This
A decisive weekly close below $55,000 or sustained net ETF outflows exceeding $2B/month for 3+ consecutive months invalidates the bullish recovery thesis.
88
·
--
Bài viết
Xem bản dịch
S&P 500$S&P 500
Valuation: OvervaluedP/E: ~29x trailing TTM (Feb 2026 data); forward ~21–22x NTMP/B: Data not found
EV/EBITDA: ~18–20x (above dot-com-era comparisons per ISABELNET)Fair Value Est.: ~7,850 (Wall Street median year-end consensus)CAPE at ~41–42.5x (second-highest in 140 years); trailing P/E 45-55% above long-run average; earnings growth partially justifies premium but margin of safety is thin.
Financial Analysis
Revenue Growth
FY2026 consensus +11% — fastest since 2022; Q1 actuals +12%, beating +10% estimate.
Margin Trend
Q1 2026 blended net margin 13.4% — new all-time record for the index.
Balance Sheet
Aggregate leverage moderate; tech mega-caps net-cash; energy/industrials carry higher debt loads.
Cash Flow
Strong FCF generation concentrated in top-10 names; AI capex surge may pressure FCF in H2.
Earnings growth trajectory strongest since 2021, driven by AI infrastructure spending and semiconductor demand; concentration in handful of names is primary structural risk.
TECHNICAL ANALYSIS
Trend: Primary uptrend intact YTD +7.6%; pulled back ~2.2% from 7,620.90 all-time high.
RSI Signal: RSI returned to ~70 after April surge; VIX at 18.77 (+12% on day) signals short-term caution.
Moving Avg: Trading above 200-DMA; 50-DMA in uptrend; recent session close below 10-DMA on sell-off.
Support and ressistance: ~7,294 (1-month low per Investing.com data) / ~7,620.90 (52-week high / all-time record)
Bullish primary trend with elevated concentration; near-term momentum softening as Iran-war headlines and VIX spike signal possible consolidation before next leg higher.
Risk Assessment: ELEVATED
VIX 18.77; orderly but rising; Iran-war tail risk and tariff cliff in late July as key event volatility drivers. Risk profile is elevated by historically stretched valuations, geopolitical oil shock, sticky inflation above Fed target, and extreme index concentration in AI-linked semiconductors — any one catalyst could compress multiples rapidly.
Iran war escalation re-closes Hormuz, spiking oil and triggering stagflation.Fed forced to hike rates on persistent 3.5%+ inflation, crushing multiples.AI capex bubble burst or Mag-7 earnings miss collapses narrow breadth rally.
Investment Recommendation: HOLD
Price Target;: 7,850 (12-month, Wall Street median consensus)
Time Horizon: 12 months
Earnings momentum and AI-driven growth justify near-term support, but stretched CAPE (~42x), Fed-on-hold policy, Iran oil risk, and index concentration cap conviction; hold with disciplined stop near 7,100.
Overall Investment Summary
Neutral
The S&P 500 earns a 61/100 conviction score and a HOLD rating, reflecting a classic late-cycle tension: exceptional corporate earnings and AI-driven growth momentum on one side, versus historically extreme valuations (CAPE ~42x), geopolitical oil risk from the Iran war, and sticky inflation keeping the Fed sidelined on the other. The index is up ~7.6% YTD but trades just 2% below its all-time high, offering limited margin of safety. Investors should hold core positions but avoid adding aggressively until Iran-war uncertainty resolves or valuations compress via earnings growth.
Thesis Summary
The S&P 500 is a HOLD at 7,457 with a conviction score of 61/100. Fundamental earnings strength — record margins, +28% Q1 EPS growth — is real but priced in at 29x trailing P/E and CAPE of ~42x. AI capex tailwinds and Mag-7 dominance sustain the bull case, while Iran-war stagflation risk, a Fed anchored on hold, and historically extreme valuations cap upside. The risk/reward is asymmetric near all-time highs.
What Would Invalidate This:
Conviction flips bearish if CPI re-accelerates above 4.5%, Fed hikes rates, or Mag-7 Q2 earnings disappoint materially; flips strong bull if Iran ceasefire collapses oil prices and Fed signals cut path.
S&P 500
$S&P 500
Valuation: OvervaluedP/E: ~29x trailing TTM (Feb 2026 data); forward ~21–22x NTMP/B: Data not found
EV/EBITDA: ~18–20x (above dot-com-era comparisons per ISABELNET)Fair Value Est.: ~7,850 (Wall Street median year-end consensus)CAPE at ~41–42.5x (second-highest in 140 years); trailing P/E 45-55% above long-run average; earnings growth partially justifies premium but margin of safety is thin.
Financial Analysis
Revenue Growth
FY2026 consensus +11% — fastest since 2022; Q1 actuals +12%, beating +10% estimate.
Margin Trend
Q1 2026 blended net margin 13.4% — new all-time record for the index.
Balance Sheet
Aggregate leverage moderate; tech mega-caps net-cash; energy/industrials carry higher debt loads.
Cash Flow
Strong FCF generation concentrated in top-10 names; AI capex surge may pressure FCF in H2.
Earnings growth trajectory strongest since 2021, driven by AI infrastructure spending and semiconductor demand; concentration in handful of names is primary structural risk.
TECHNICAL ANALYSIS
Trend: Primary uptrend intact YTD +7.6%; pulled back ~2.2% from 7,620.90 all-time high.
RSI Signal: RSI returned to ~70 after April surge; VIX at 18.77 (+12% on day) signals short-term caution.
Moving Avg: Trading above 200-DMA; 50-DMA in uptrend; recent session close below 10-DMA on sell-off.
Support and ressistance: ~7,294 (1-month low per Investing.com data) / ~7,620.90 (52-week high / all-time record)
Bullish primary trend with elevated concentration; near-term momentum softening as Iran-war headlines and VIX spike signal possible consolidation before next leg higher.
Risk Assessment: ELEVATED
VIX 18.77; orderly but rising; Iran-war tail risk and tariff cliff in late July as key event volatility drivers. Risk profile is elevated by historically stretched valuations, geopolitical oil shock, sticky inflation above Fed target, and extreme index concentration in AI-linked semiconductors — any one catalyst could compress multiples rapidly.
Iran war escalation re-closes Hormuz, spiking oil and triggering stagflation.Fed forced to hike rates on persistent 3.5%+ inflation, crushing multiples.AI capex bubble burst or Mag-7 earnings miss collapses narrow breadth rally.
Investment Recommendation: HOLD
Price Target;: 7,850 (12-month, Wall Street median consensus)
Time Horizon: 12 months
Earnings momentum and AI-driven growth justify near-term support, but stretched CAPE (~42x), Fed-on-hold policy, Iran oil risk, and index concentration cap conviction; hold with disciplined stop near 7,100.
Overall Investment Summary
Neutral
The S&P 500 earns a 61/100 conviction score and a HOLD rating, reflecting a classic late-cycle tension: exceptional corporate earnings and AI-driven growth momentum on one side, versus historically extreme valuations (CAPE ~42x), geopolitical oil risk from the Iran war, and sticky inflation keeping the Fed sidelined on the other. The index is up ~7.6% YTD but trades just 2% below its all-time high, offering limited margin of safety. Investors should hold core positions but avoid adding aggressively until Iran-war uncertainty resolves or valuations compress via earnings growth.
Thesis Summary
The S&P 500 is a HOLD at 7,457 with a conviction score of 61/100. Fundamental earnings strength — record margins, +28% Q1 EPS growth — is real but priced in at 29x trailing P/E and CAPE of ~42x. AI capex tailwinds and Mag-7 dominance sustain the bull case, while Iran-war stagflation risk, a Fed anchored on hold, and historically extreme valuations cap upside. The risk/reward is asymmetric near all-time highs.
What Would Invalidate This:
Conviction flips bearish if CPI re-accelerates above 4.5%, Fed hikes rates, or Mag-7 Q2 earnings disappoint materially; flips strong bull if Iran ceasefire collapses oil prices and Fed signals cut path.
Valuation: OvervaluedP/E: ~29x trailing TTM (Feb 2026 data); forward ~21–22x NTMP/B: Data not found
EV/EBITDA: ~18–20x (above dot-com-era comparisons per ISABELNET)Fair Value Est.: ~7,850 (Wall Street median year-end consensus)CAPE at ~41–42.5x (second-highest in 140 years); trailing P/E 45-55% above long-run average; earnings growth partially justifies premium but margin of safety is thin.
Financial Analysis
Revenue Growth
FY2026 consensus +11% — fastest since 2022; Q1 actuals +12%, beating +10% estimate.
Margin Trend
Q1 2026 blended net margin 13.4% — new all-time record for the index.
Balance Sheet
Aggregate leverage moderate; tech mega-caps net-cash; energy/industrials carry higher debt loads.
Cash Flow
Strong FCF generation concentrated in top-10 names; AI capex surge may pressure FCF in H2.
Earnings growth trajectory strongest since 2021, driven by AI infrastructure spending and semiconductor demand; concentration in handful of names is primary structural risk.
TECHNICAL ANALYSIS
Trend: Primary uptrend intact YTD +7.6%; pulled back ~2.2% from 7,620.90 all-time high.
RSI Signal: RSI returned to ~70 after April surge; VIX at 18.77 (+12% on day) signals short-term caution.
Moving Avg: Trading above 200-DMA; 50-DMA in uptrend; recent session close below 10-DMA on sell-off.
Support and ressistance: ~7,294 (1-month low per Investing.com data) / ~7,620.90 (52-week high / all-time record)
Bullish primary trend with elevated concentration; near-term momentum softening as Iran-war headlines and VIX spike signal possible consolidation before next leg higher.
Risk Assessment: ELEVATED
VIX 18.77; orderly but rising; Iran-war tail risk and tariff cliff in late July as key event volatility drivers. Risk profile is elevated by historically stretched valuations, geopolitical oil shock, sticky inflation above Fed target, and extreme index concentration in AI-linked semiconductors — any one catalyst could compress multiples rapidly.
Iran war escalation re-closes Hormuz, spiking oil and triggering stagflation.Fed forced to hike rates on persistent 3.5%+ inflation, crushing multiples.AI capex bubble burst or Mag-7 earnings miss collapses narrow breadth rally.
Investment Recommendation: HOLD
Price Target;: 7,850 (12-month, Wall Street median consensus)
Time Horizon: 12 months
Earnings momentum and AI-driven growth justify near-term support, but stretched CAPE (~42x), Fed-on-hold policy, Iran oil risk, and index concentration cap conviction; hold with disciplined stop near 7,100.
Overall Investment Summary
Neutral
The S&P 500 earns a 61/100 conviction score and a HOLD rating, reflecting a classic late-cycle tension: exceptional corporate earnings and AI-driven growth momentum on one side, versus historically extreme valuations (CAPE ~42x), geopolitical oil risk from the Iran war, and sticky inflation keeping the Fed sidelined on the other. The index is up ~7.6% YTD but trades just 2% below its all-time high, offering limited margin of safety. Investors should hold core positions but avoid adding aggressively until Iran-war uncertainty resolves or valuations compress via earnings growth.
Thesis Summary
The S&P 500 is a HOLD at 7,457 with a conviction score of 61/100. Fundamental earnings strength — record margins, +28% Q1 EPS growth — is real but priced in at 29x trailing P/E and CAPE of ~42x. AI capex tailwinds and Mag-7 dominance sustain the bull case, while Iran-war stagflation risk, a Fed anchored on hold, and historically extreme valuations cap upside. The risk/reward is asymmetric near all-time highs.
What Would Invalidate This:
Conviction flips bearish if CPI re-accelerates above 4.5%, Fed hikes rates, or Mag-7 Q2 earnings disappoint materially; flips strong bull if Iran ceasefire collapses oil prices and Fed signals cut path.
57
·
--
Xem bản dịch
Overall Investment Summary
bearish:
BTC earns a Conviction Score of 44/100 and a HOLD rating, reflecting a deeply bearish near-term technical and macro environment offset by structural long-term bullish fundamentals (fixed supply, institutional adoption, regulatory catalysts). The asset is in a high-risk distribution phase with the primary trend pointing lower, but RSI divergences and scheduled H2 2026 regulatory catalysts (CLARITY Act, SBR architecture release, midterms) justify a watchful, scaled-accumulation posture rather than outright exit. Risk-tolerant investors should size conservatively and define downside to the $55,500–$58,000 support zone.
Thesis Summary:
BTC trades ~50% below its Oct 2025 ATH, pressured by ETF outflows, geopolitical risk, and technical breakdown; however, deep oversold conditions, institutional infrastructure expansion (E*TRADE, Morgan Stanley ETF), and pending U.S. crypto legislation create an asymmetric medium-term setup.
What Would Invalidate This:
Sustained close below $55,500 (Fibonacci support) with accelerating ETF redemptions and CLARITY Act failure invalidates the recovery thesis and targets $39,000–$45,000.
Overall Investment Summary
bearish:
BTC earns a Conviction Score of 44/100 and a HOLD rating, reflecting a deeply bearish near-term technical and macro environment offset by structural long-term bullish fundamentals (fixed supply, institutional adoption, regulatory catalysts). The asset is in a high-risk distribution phase with the primary trend pointing lower, but RSI divergences and scheduled H2 2026 regulatory catalysts (CLARITY Act, SBR architecture release, midterms) justify a watchful, scaled-accumulation posture rather than outright exit. Risk-tolerant investors should size conservatively and define downside to the $55,500–$58,000 support zone.
Thesis Summary:
BTC trades ~50% below its Oct 2025 ATH, pressured by ETF outflows, geopolitical risk, and technical breakdown; however, deep oversold conditions, institutional infrastructure expansion (E*TRADE, Morgan Stanley ETF), and pending U.S. crypto legislation create an asymmetric medium-term setup.
What Would Invalidate This:
Sustained close below $55,500 (Fibonacci support) with accelerating ETF redemptions and CLARITY Act failure invalidates the recovery thesis and targets $39,000–$45,000.
bearish:
BTC earns a Conviction Score of 44/100 and a HOLD rating, reflecting a deeply bearish near-term technical and macro environment offset by structural long-term bullish fundamentals (fixed supply, institutional adoption, regulatory catalysts). The asset is in a high-risk distribution phase with the primary trend pointing lower, but RSI divergences and scheduled H2 2026 regulatory catalysts (CLARITY Act, SBR architecture release, midterms) justify a watchful, scaled-accumulation posture rather than outright exit. Risk-tolerant investors should size conservatively and define downside to the $55,500–$58,000 support zone.
Thesis Summary:
BTC trades ~50% below its Oct 2025 ATH, pressured by ETF outflows, geopolitical risk, and technical breakdown; however, deep oversold conditions, institutional infrastructure expansion (E*TRADE, Morgan Stanley ETF), and pending U.S. crypto legislation create an asymmetric medium-term setup.
What Would Invalidate This:
Sustained close below $55,500 (Fibonacci support) with accelerating ETF redemptions and CLARITY Act failure invalidates the recovery thesis and targets $39,000–$45,000.

63
Đăng nhập để khám phá thêm nội dung
Tham gia cùng người dùng tiền mã hóa toàn cầu trên Binance Square
⚡️ Nhận thông tin mới nhất và hữu ích về tiền mã hóa.
💬 Được tin cậy bởi sàn giao dịch tiền mã hóa lớn nhất thế giới.
👍 Khám phá những thông tin chuyên sâu thực tế từ những nhà sáng tạo đã xác minh.
Email / Số điện thoại
Chủ đề thịnh hành
TheoDõiFOMC
101,906 lượt xem
597 đang thảo luận
Cục Dự trữ Liên bang (Fed) đã tăng lãi suất lần đầu tiên kể từ năm 2023 trong bối cảnh lạm phát dai dẳng. Các nhà hoạch định chính sách của Fed đã bỏ phiếu 12-0 để nâng lãi suất quỹ liên bang từ 3,5% lên 3,75%, với mức mục tiêu mới là 3,75% đến 4%. Mức tăng 25 điểm cơ bản này đánh dấu lần điều chỉnh lãi suất đầu tiên kể từ tháng 7/2023 và diễn ra sau khi Fed giữ nguyên lãi suất trong năm cuộc họp đầu tiên trong năm nay. #TheoDõiFOMC #45NgayTuDoTaiChinh #DotPlotSignalsOneMoreHikeIn2026 $NVDAB $AAPLB $NVDA.US #45NgayTuDoTaiChinh #FedHikes25BpsUSStocksClose #
kynfoolishupdate
·0 lượt thích
·188 lượt xem
TinFed
85,165 lượt xem
405 đang thảo luận
CircleMints500MUSDCOnSolana
26,768 lượt xem
794 đang thảo luận