
hazikusman
153 Bài đăng

hazikusman
Báo cáo
Chặn người dùng
0 Đang theo dõi
7 Người theo dõi
20 Đã thích
Bài đăng
·
--
Xem bản dịch
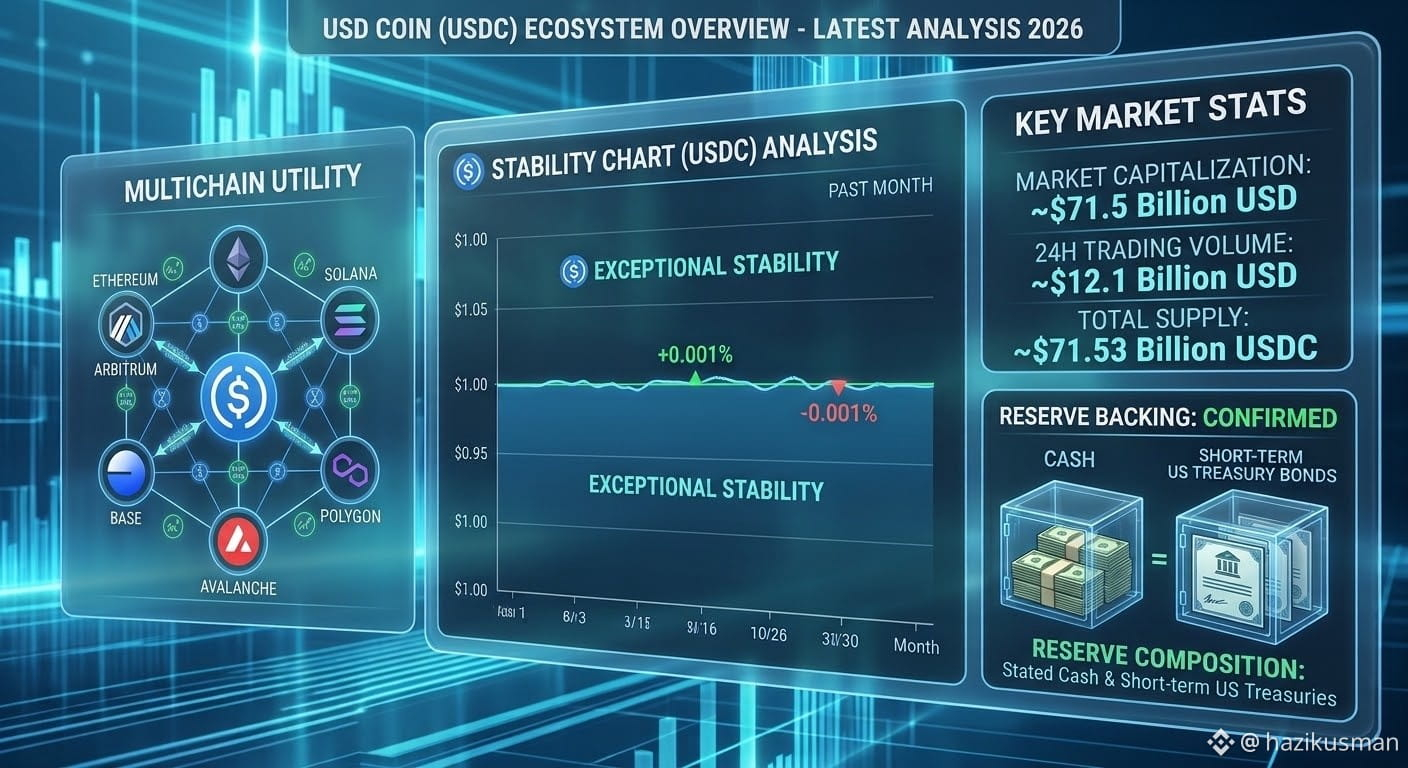
USDC maintains a remarkably stable peg, strictly adhering to the $1.00 USD value with negligible fluctuations. This stability is supported by a significant Market Capitalization, currently circulating at approximately $71.5 Billion USD, making it a vital pillar of liquidity for the entire decentralized finance (DeFi) sector.
Key Technical Pillars:
Fully Backed Reserves: USDC's primary metric of trust is its reserve backing. Monthly attestation reports confirm that USDC is 100% backed by a combination of cash and short-term US Treasury bonds, managed within the US regulatory framework.
Multichain Dominance: USDC has established strong interoperability, moving beyond its Ethereum roots to become a dominant native stablecoin on high-throughput networks like Solana, Polygon, and newer Layer-2 solutions. This cross-chain utility significantly reduces friction and transaction costs for users.
Outlook:
USDC remains the preferred asset for risk-averse institutional market participants and DeFi applications requiring a reliable store of value and unit of account. Future growth is likely to be driven by deeper integrations into traditional payment systems and the continued expansion of real-world asset (RWA) tokenization, where a trusted, stable digital currency is mandatory.
#BinanceSquareTalks #Write2Earn! #USDC
USDC maintains a remarkably stable peg, strictly adhering to the $1.00 USD value with negligible fluctuations. This stability is supported by a significant Market Capitalization, currently circulating at approximately $71.5 Billion USD, making it a vital pillar of liquidity for the entire decentralized finance (DeFi) sector.
Key Technical Pillars:
Fully Backed Reserves: USDC's primary metric of trust is its reserve backing. Monthly attestation reports confirm that USDC is 100% backed by a combination of cash and short-term US Treasury bonds, managed within the US regulatory framework.
Multichain Dominance: USDC has established strong interoperability, moving beyond its Ethereum roots to become a dominant native stablecoin on high-throughput networks like Solana, Polygon, and newer Layer-2 solutions. This cross-chain utility significantly reduces friction and transaction costs for users.
Outlook:
USDC remains the preferred asset for risk-averse institutional market participants and DeFi applications requiring a reliable store of value and unit of account. Future growth is likely to be driven by deeper integrations into traditional payment systems and the continued expansion of real-world asset (RWA) tokenization, where a trusted, stable digital currency is mandatory.
#BinanceSquareTalks #Write2Earn! #USDC
Key Technical Pillars:
Fully Backed Reserves: USDC's primary metric of trust is its reserve backing. Monthly attestation reports confirm that USDC is 100% backed by a combination of cash and short-term US Treasury bonds, managed within the US regulatory framework.
Multichain Dominance: USDC has established strong interoperability, moving beyond its Ethereum roots to become a dominant native stablecoin on high-throughput networks like Solana, Polygon, and newer Layer-2 solutions. This cross-chain utility significantly reduces friction and transaction costs for users.
Outlook:
USDC remains the preferred asset for risk-averse institutional market participants and DeFi applications requiring a reliable store of value and unit of account. Future growth is likely to be driven by deeper integrations into traditional payment systems and the continued expansion of real-world asset (RWA) tokenization, where a trusted, stable digital currency is mandatory.
#BinanceSquareTalks #Write2Earn! #USDC
2
·
--
Xem bản dịch
$HYPE market is buzzing, and all eyes are back on the "Hype Coins." After a period of consolidation, retail sentiment is exploding, and several assets are flashing massive buy signals. If you are looking for momentum, this is where the action is.
🔍 Latest Market Analysis: What’s Moving?
We are seeing a massive rotation of capital into high-beta altcoins. The formula right now is simple: High Volume + Strong Community Sentiment = Explosive Price Action.
Sentiment Check: The "Fear & Greed Index" is moving towards Extreme Greed for speculative assets. Social media mentions for trending coins are at monthly highs.
Technicals: Many hype assets are breaking out of multiple-week Bull Pennants and Ascending Triangles on the 4H charts. When these charts break resistance with high volume, the moves are swift and violent.
🛡️ The Smart Hype Strategy:
Rule #1: Take Profits Regularly. Hype moves are fast. Do not get greedy. Set laddered profit targets.
Rule #2: Tight Stop-Losses. Protect your capital from the eventual dip. Never trade without a plan.
Rule #3: Confirm Volume. Never chase a pump that doesn't have rising buy volume to support it.
#Hyperium #Write2Earn! #BinanceSquareTalks #besttrader
$HYPE market is buzzing, and all eyes are back on the "Hype Coins." After a period of consolidation, retail sentiment is exploding, and several assets are flashing massive buy signals. If you are looking for momentum, this is where the action is.
🔍 Latest Market Analysis: What’s Moving?
We are seeing a massive rotation of capital into high-beta altcoins. The formula right now is simple: High Volume + Strong Community Sentiment = Explosive Price Action.
Sentiment Check: The "Fear & Greed Index" is moving towards Extreme Greed for speculative assets. Social media mentions for trending coins are at monthly highs.
Technicals: Many hype assets are breaking out of multiple-week Bull Pennants and Ascending Triangles on the 4H charts. When these charts break resistance with high volume, the moves are swift and violent.
🛡️ The Smart Hype Strategy:
Rule #1: Take Profits Regularly. Hype moves are fast. Do not get greedy. Set laddered profit targets.
Rule #2: Tight Stop-Losses. Protect your capital from the eventual dip. Never trade without a plan.
Rule #3: Confirm Volume. Never chase a pump that doesn't have rising buy volume to support it.
#Hyperium #Write2Earn! #BinanceSquareTalks #besttrader
🔍 Latest Market Analysis: What’s Moving?
We are seeing a massive rotation of capital into high-beta altcoins. The formula right now is simple: High Volume + Strong Community Sentiment = Explosive Price Action.
Sentiment Check: The "Fear & Greed Index" is moving towards Extreme Greed for speculative assets. Social media mentions for trending coins are at monthly highs.
Technicals: Many hype assets are breaking out of multiple-week Bull Pennants and Ascending Triangles on the 4H charts. When these charts break resistance with high volume, the moves are swift and violent.
🛡️ The Smart Hype Strategy:
Rule #1: Take Profits Regularly. Hype moves are fast. Do not get greedy. Set laddered profit targets.
Rule #2: Tight Stop-Losses. Protect your capital from the eventual dip. Never trade without a plan.
Rule #3: Confirm Volume. Never chase a pump that doesn't have rising buy volume to support it.
#Hyperium #Write2Earn! #BinanceSquareTalks #besttrader

33
·
--
Xem bản dịch
Binance Trading Alert: Which Coins to Trade Right Now? 📈
Looking for the best setups on Binance today? Here is a quick market breakdown and strategy guide to help you catch the next big move:
🎯 Top Focus Areas on Binance:
The Market Leaders ($BTC & $ETH):
Always check the big picture first. Keep a close eye on Bitcoin and Ethereum price action to gauge overall market direction before entering altcoins.
High-Momentum Altcoins ($SOL,$SUI, etc.):
Focus on liquid, high-volume assets on Binance that are showing strong relative strength and clean chart structures for swing trades.
Patience Pays Off:
Don't chase green candles. Wait for retests of Key Support Levels or confirmed Breakouts on the 4H/Daily charts.
🛡️ Smart Trading Rules for Binance Futures & Spot:
🛑 Always use a Stop-Loss (SL): Protect your capital first; profits come second.
📊 Check the Indicators: Combine RSI, MACD, and Order Book depth for better entry confirmations.
🧠 Control Your Leverage: If trading futures, avoid over-leveraging—keep risk management tight.
#TopCryptoNews #Write2Earrn #BinanceSquareTalks #BinanceSquareFamily
Binance Trading Alert: Which Coins to Trade Right Now? 📈
Looking for the best setups on Binance today? Here is a quick market breakdown and strategy guide to help you catch the next big move:
🎯 Top Focus Areas on Binance:
The Market Leaders ($BTC & $ETH):
Always check the big picture first. Keep a close eye on Bitcoin and Ethereum price action to gauge overall market direction before entering altcoins.
High-Momentum Altcoins ($SOL,$SUI, etc.):
Focus on liquid, high-volume assets on Binance that are showing strong relative strength and clean chart structures for swing trades.
Patience Pays Off:
Don't chase green candles. Wait for retests of Key Support Levels or confirmed Breakouts on the 4H/Daily charts.
🛡️ Smart Trading Rules for Binance Futures & Spot:
🛑 Always use a Stop-Loss (SL): Protect your capital first; profits come second.
📊 Check the Indicators: Combine RSI, MACD, and Order Book depth for better entry confirmations.
🧠 Control Your Leverage: If trading futures, avoid over-leveraging—keep risk management tight.
#TopCryptoNews #Write2Earrn #BinanceSquareTalks #BinanceSquareFamily
Looking for the best setups on Binance today? Here is a quick market breakdown and strategy guide to help you catch the next big move:
🎯 Top Focus Areas on Binance:
The Market Leaders ($BTC & $ETH):
Always check the big picture first. Keep a close eye on Bitcoin and Ethereum price action to gauge overall market direction before entering altcoins.
High-Momentum Altcoins ($SOL,$SUI, etc.):
Focus on liquid, high-volume assets on Binance that are showing strong relative strength and clean chart structures for swing trades.
Patience Pays Off:
Don't chase green candles. Wait for retests of Key Support Levels or confirmed Breakouts on the 4H/Daily charts.
🛡️ Smart Trading Rules for Binance Futures & Spot:
🛑 Always use a Stop-Loss (SL): Protect your capital first; profits come second.
📊 Check the Indicators: Combine RSI, MACD, and Order Book depth for better entry confirmations.
🧠 Control Your Leverage: If trading futures, avoid over-leveraging—keep risk management tight.
#TopCryptoNews #Write2Earrn #BinanceSquareTalks #BinanceSquareFamily
33
·
--
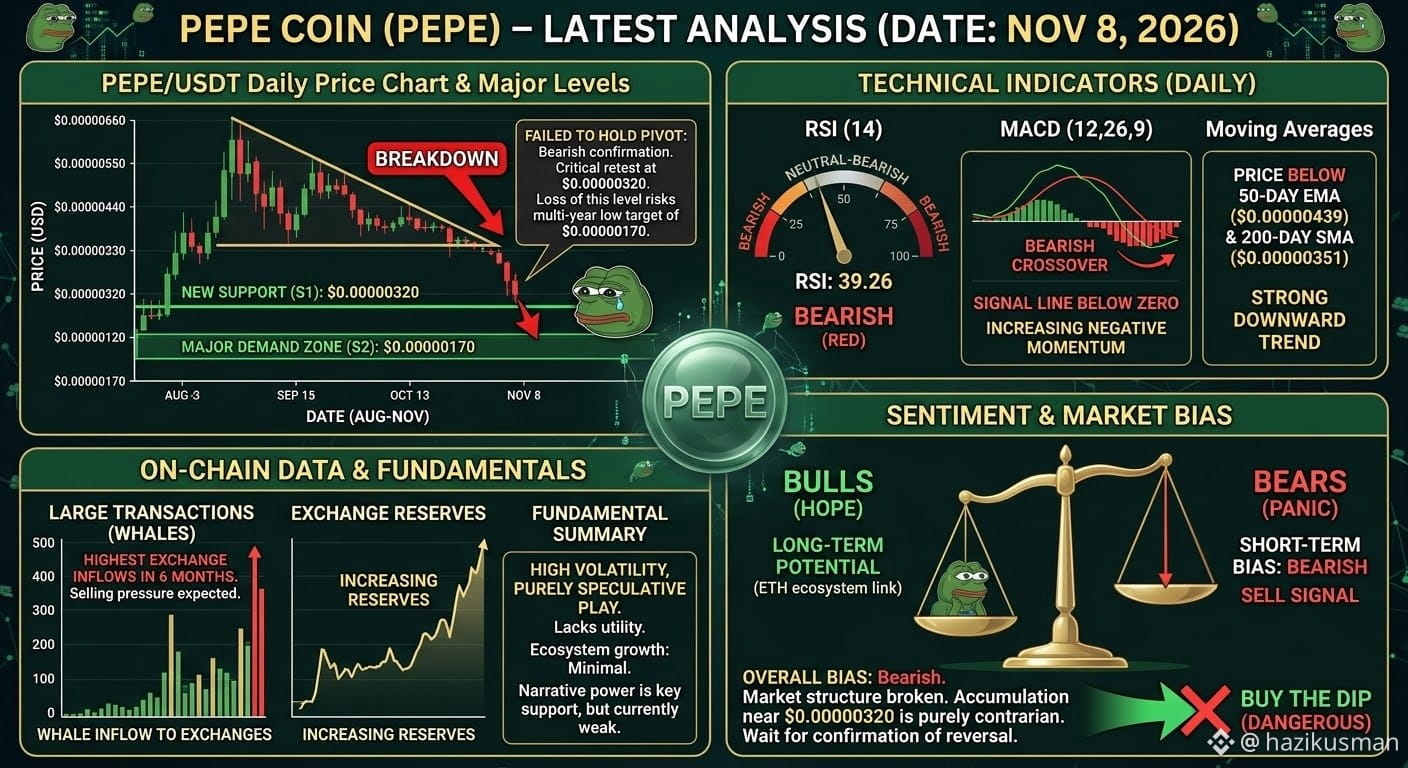
$PEPE hiện đang tích lũy trong vùng $0.0000048 – $0.0000049. Kháng cự gần nhất nằm quanh mức $0.0000053 đến $0.0000055. Nếu bứt phá dứt khoát lên trên vùng này, giá có thể tăng hướng tới cụm kháng cự cao hơn tại $0.0000095. Ở chiều giảm, vùng hỗ trợ chính nằm tại $0.00000405 – $0.00000420.
Đường trung bình động và cấu trúc xu hướng: PEPE tiếp tục duy trì trên các đường trung bình động quan trọng, bao gồm EMA 50 ngày ($0.00000420) và EMA 200 ngày ($0.00000388). Điều này giúp duy trì cấu trúc xu hướng trung hạn đến dài hạn tích cực và thiên về tăng, bất chấp những biến động ngắn hạn.
Các chỉ báo động lượng:
RSI (14) đang ở mức trung tính khoảng 60.8, cho thấy lực mua ổn định nhưng chưa đi vào vùng quá mua.
MACD vẫn nằm trên đường tín hiệu và ở vùng dương, xác nhận động lượng tăng đang hiện diện trên các khung thời gian ngày.
Xu hướng thị trường: Trung tính trong ngắn hạn (dao động trong biên độ), tăng trong trung hạn. Điều kiện thị trường dao động trong biên độ thuận lợi cho việc tích lũy gần mức hỗ trợ $0.0000042, đồng thời cần kiểm soát rủi ro chặt chẽ do biến động thị trường đang ở mức cao.
#writetoearn #BinanceSquareFamily #ToptrandingCoin #pepe⚡
$PEPE hiện đang tích lũy trong vùng $0.0000048 – $0.0000049. Kháng cự gần nhất nằm quanh mức $0.0000053 đến $0.0000055. Nếu bứt phá dứt khoát lên trên vùng này, giá có thể tăng hướng tới cụm kháng cự cao hơn tại $0.0000095. Ở chiều giảm, vùng hỗ trợ chính nằm tại $0.00000405 – $0.00000420.
Đường trung bình động và cấu trúc xu hướng: PEPE tiếp tục duy trì trên các đường trung bình động quan trọng, bao gồm EMA 50 ngày ($0.00000420) và EMA 200 ngày ($0.00000388). Điều này giúp duy trì cấu trúc xu hướng trung hạn đến dài hạn tích cực và thiên về tăng, bất chấp những biến động ngắn hạn.
Các chỉ báo động lượng:
RSI (14) đang ở mức trung tính khoảng 60.8, cho thấy lực mua ổn định nhưng chưa đi vào vùng quá mua.
MACD vẫn nằm trên đường tín hiệu và ở vùng dương, xác nhận động lượng tăng đang hiện diện trên các khung thời gian ngày.
Xu hướng thị trường: Trung tính trong ngắn hạn (dao động trong biên độ), tăng trong trung hạn. Điều kiện thị trường dao động trong biên độ thuận lợi cho việc tích lũy gần mức hỗ trợ $0.0000042, đồng thời cần kiểm soát rủi ro chặt chẽ do biến động thị trường đang ở mức cao.
#writetoearn #BinanceSquareFamily #ToptrandingCoin #pepe⚡
Đường trung bình động và cấu trúc xu hướng: PEPE tiếp tục duy trì trên các đường trung bình động quan trọng, bao gồm EMA 50 ngày ($0.00000420) và EMA 200 ngày ($0.00000388). Điều này giúp duy trì cấu trúc xu hướng trung hạn đến dài hạn tích cực và thiên về tăng, bất chấp những biến động ngắn hạn.
Các chỉ báo động lượng:
RSI (14) đang ở mức trung tính khoảng 60.8, cho thấy lực mua ổn định nhưng chưa đi vào vùng quá mua.
MACD vẫn nằm trên đường tín hiệu và ở vùng dương, xác nhận động lượng tăng đang hiện diện trên các khung thời gian ngày.
Xu hướng thị trường: Trung tính trong ngắn hạn (dao động trong biên độ), tăng trong trung hạn. Điều kiện thị trường dao động trong biên độ thuận lợi cho việc tích lũy gần mức hỗ trợ $0.0000042, đồng thời cần kiểm soát rủi ro chặt chẽ do biến động thị trường đang ở mức cao.
#writetoearn #BinanceSquareFamily #ToptrandingCoin #pepe⚡
51
·
--
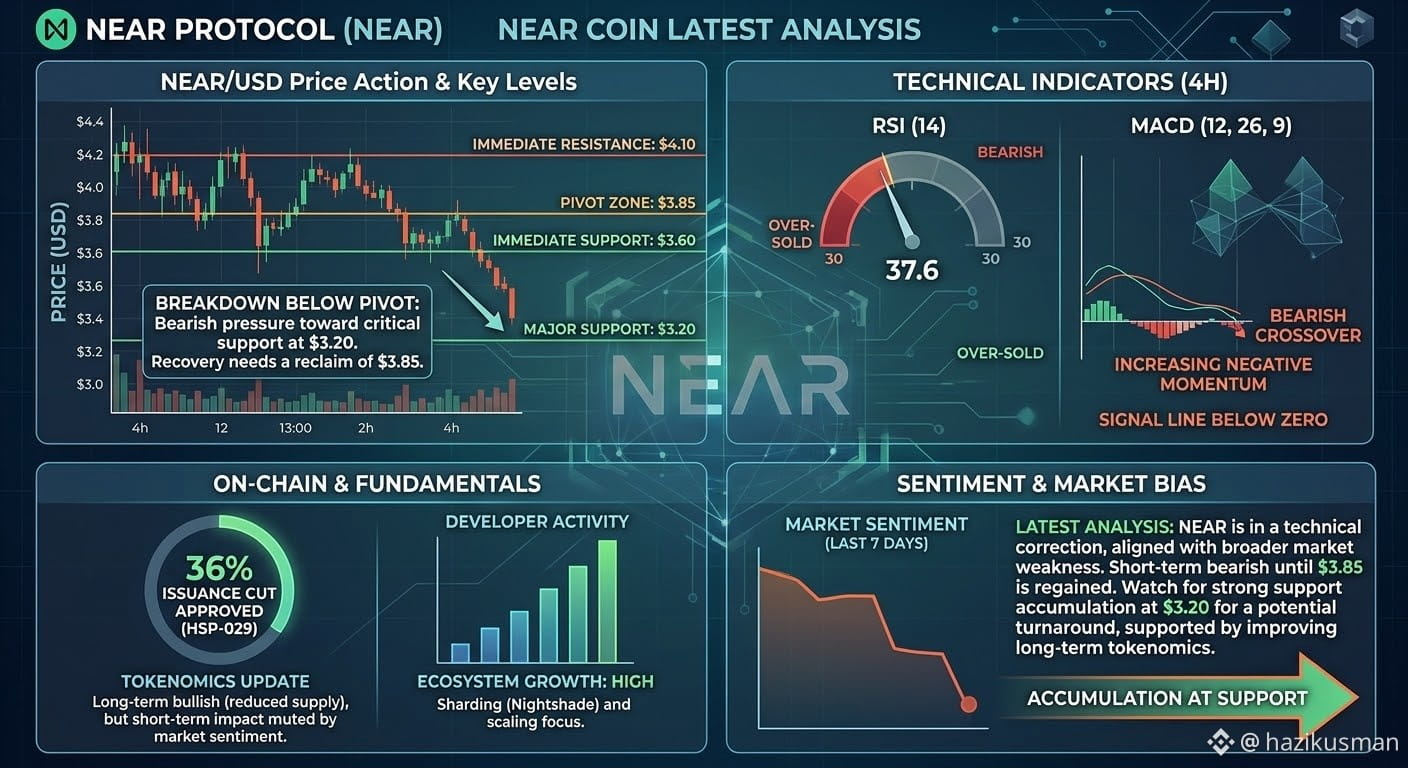
$NEAR đã giảm xuống dưới vùng pivot chính ở mức 3,85 USD, điều chỉnh về vùng hỗ trợ gần nhất quanh 3,60 USD. Nếu không giữ được mức 3,60 USD, giá có thể kiểm tra lại vùng cầu mạnh tại 3,20 USD. Việc lấy lại mốc 3,85 USD là thiết yếu để tiếp tục cấu trúc tăng giá hướng tới mức 4,10 USD trở lên.
Chỉ báo kỹ thuật (4H): RSI 14 kỳ (~37–38) cho thấy giá đang tiến gần vùng quá bán, gợi ý động lượng có thể chậm lại. Trong khi đó, MACD cho thấy giao cắt giảm dưới ngưỡng 0, xác nhận áp lực giảm trong ngắn hạn.
Các yếu tố cơ bản và Tokenomics: Việc phê duyệt HSP-029 (cắt giảm 36% lượng phát hành hằng năm) cải thiện động lực nguồn cung dài hạn, tạo nền tảng hỗ trợ vững chắc bất chấp những trở ngại của thị trường trong ngắn hạn.
Xu hướng thị trường: Trung lập đến giảm trong ngắn hạn, tăng trong trung hạn. Tích lũy quanh vùng hỗ trợ 3,20–3,60 USD có thể mang lại giá trị tiềm năng cho những người nắm giữ dài hạn.
#besttranding #BinanceSquareTalks
#$NEAR
$NEAR đã giảm xuống dưới vùng pivot chính ở mức 3,85 USD, điều chỉnh về vùng hỗ trợ gần nhất quanh 3,60 USD. Nếu không giữ được mức 3,60 USD, giá có thể kiểm tra lại vùng cầu mạnh tại 3,20 USD. Việc lấy lại mốc 3,85 USD là thiết yếu để tiếp tục cấu trúc tăng giá hướng tới mức 4,10 USD trở lên.
Chỉ báo kỹ thuật (4H): RSI 14 kỳ (~37–38) cho thấy giá đang tiến gần vùng quá bán, gợi ý động lượng có thể chậm lại. Trong khi đó, MACD cho thấy giao cắt giảm dưới ngưỡng 0, xác nhận áp lực giảm trong ngắn hạn.
Các yếu tố cơ bản và Tokenomics: Việc phê duyệt HSP-029 (cắt giảm 36% lượng phát hành hằng năm) cải thiện động lực nguồn cung dài hạn, tạo nền tảng hỗ trợ vững chắc bất chấp những trở ngại của thị trường trong ngắn hạn.
Xu hướng thị trường: Trung lập đến giảm trong ngắn hạn, tăng trong trung hạn. Tích lũy quanh vùng hỗ trợ 3,20–3,60 USD có thể mang lại giá trị tiềm năng cho những người nắm giữ dài hạn.
#besttranding #BinanceSquareTalks
#$NEAR
Chỉ báo kỹ thuật (4H): RSI 14 kỳ (~37–38) cho thấy giá đang tiến gần vùng quá bán, gợi ý động lượng có thể chậm lại. Trong khi đó, MACD cho thấy giao cắt giảm dưới ngưỡng 0, xác nhận áp lực giảm trong ngắn hạn.
Các yếu tố cơ bản và Tokenomics: Việc phê duyệt HSP-029 (cắt giảm 36% lượng phát hành hằng năm) cải thiện động lực nguồn cung dài hạn, tạo nền tảng hỗ trợ vững chắc bất chấp những trở ngại của thị trường trong ngắn hạn.
Xu hướng thị trường: Trung lập đến giảm trong ngắn hạn, tăng trong trung hạn. Tích lũy quanh vùng hỗ trợ 3,20–3,60 USD có thể mang lại giá trị tiềm năng cho những người nắm giữ dài hạn.
#besttranding #BinanceSquareTalks
#$NEAR
66
·
--
Xem bản dịch
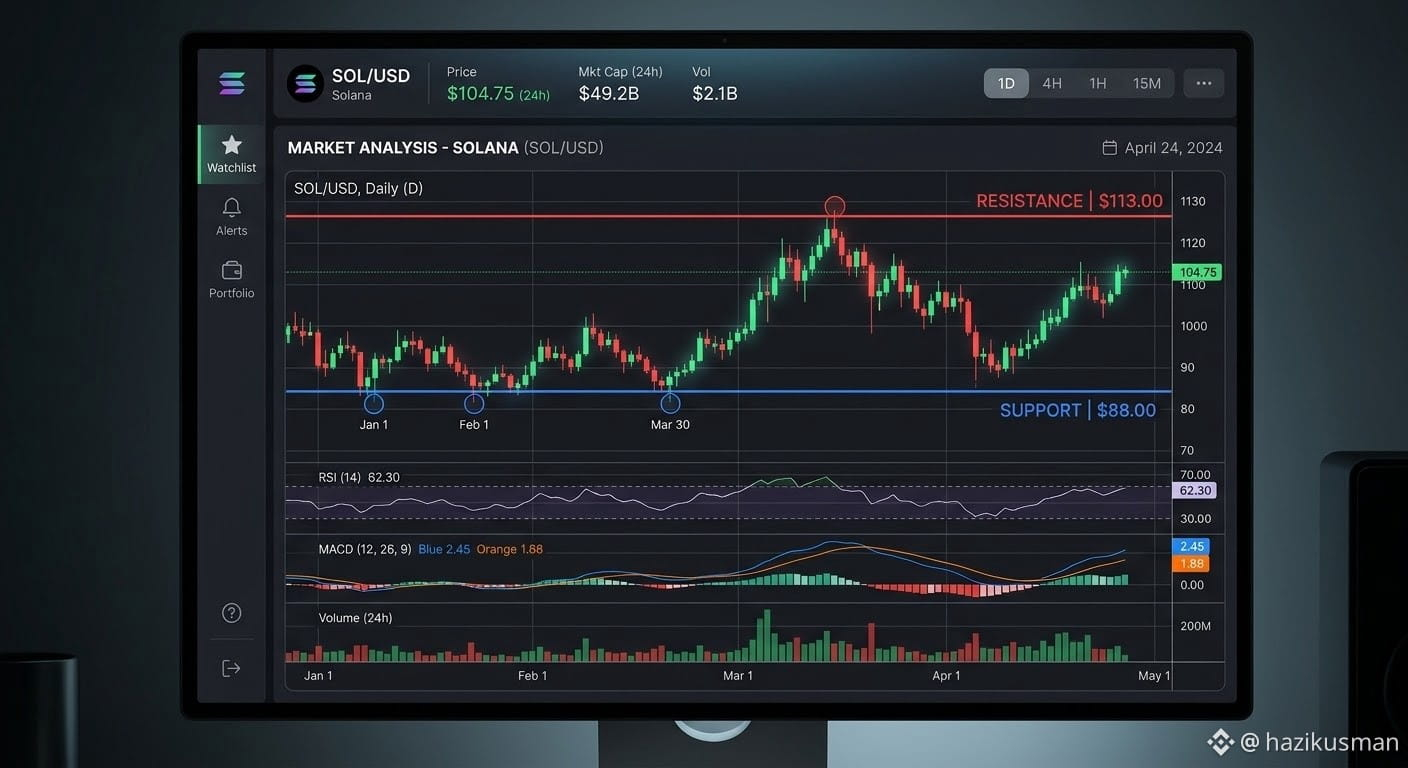
$SOL is trading near $89 - $90, experiencing short-term sell pressure in step with broader crypto market pullbacks. Following a decline over recent weeks, the market structure shows lower high patterns, putting key technical levels under test.
Key Technical Levels
Immediate Support Zone: $87.00 – $88.50 Holding this support floor is critical for buyers to prevent further downside risk toward the $80 psychological level.
Resistance Levels: $98.00 (Short-term) and $113.50 (Major Overhead) Reclaiming the $98 – $100 region is necessary to invalidate the short-term bearish trend and open a path back toward higher range targets around $113.40.
Market Outlook & Drivers
Sentiment: Bearish to neutral in the immediate short term, with 24-hour trading volumes reflecting consolidation rather than aggressive capitulation.
Recovery Forecast: Analysts project a potential baseline recovery into the $104 – $114 range by year-end if SOL consolidates above key moving averages.
#top Solana
#TrendingTopic #BinanceSquareTalks
$SOL is trading near $89 - $90, experiencing short-term sell pressure in step with broader crypto market pullbacks. Following a decline over recent weeks, the market structure shows lower high patterns, putting key technical levels under test.
Key Technical Levels
Immediate Support Zone: $87.00 – $88.50 Holding this support floor is critical for buyers to prevent further downside risk toward the $80 psychological level.
Resistance Levels: $98.00 (Short-term) and $113.50 (Major Overhead) Reclaiming the $98 – $100 region is necessary to invalidate the short-term bearish trend and open a path back toward higher range targets around $113.40.
Market Outlook & Drivers
Sentiment: Bearish to neutral in the immediate short term, with 24-hour trading volumes reflecting consolidation rather than aggressive capitulation.
Recovery Forecast: Analysts project a potential baseline recovery into the $104 – $114 range by year-end if SOL consolidates above key moving averages.
#top Solana
#TrendingTopic #BinanceSquareTalks
Key Technical Levels
Immediate Support Zone: $87.00 – $88.50 Holding this support floor is critical for buyers to prevent further downside risk toward the $80 psychological level.
Resistance Levels: $98.00 (Short-term) and $113.50 (Major Overhead) Reclaiming the $98 – $100 region is necessary to invalidate the short-term bearish trend and open a path back toward higher range targets around $113.40.
Market Outlook & Drivers
Sentiment: Bearish to neutral in the immediate short term, with 24-hour trading volumes reflecting consolidation rather than aggressive capitulation.
Recovery Forecast: Analysts project a potential baseline recovery into the $104 – $114 range by year-end if SOL consolidates above key moving averages.
#top Solana
#TrendingTopic #BinanceSquareTalks
79
·
--
Xem bản dịch
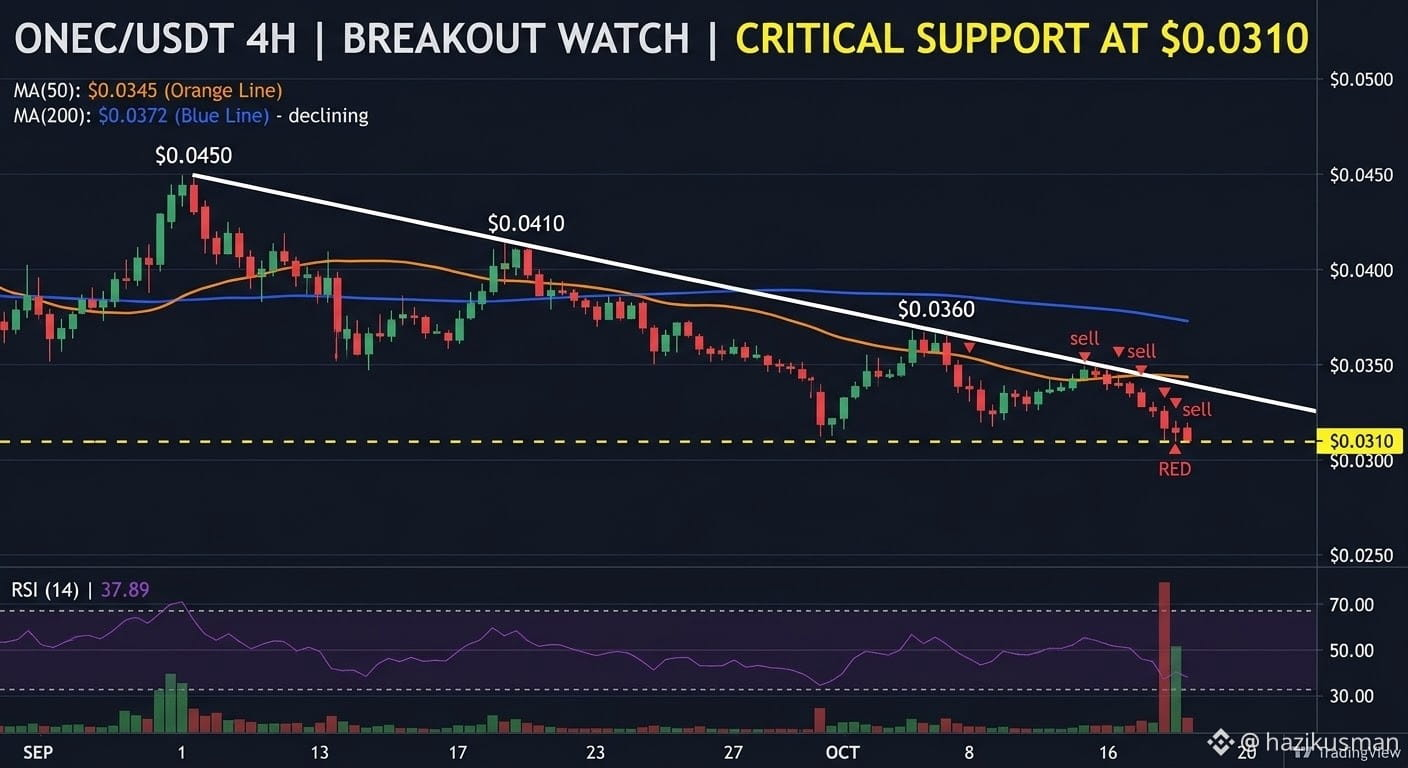
$ONE is trading around $0.000049 to $0.00010 with a low total market capitalization and modest 24-hour trading volume. The overall structure remains low-liquidity and range-bound.
Key Levels:
Resistance: Implied near the $0.00011 – $0.00017 horizontal supply ceiling where recent upside rejections occurred.
Support: Immediate demand sits near $0.000045 – $0.000085. A drop below this zone risks further downside expansion.
Technical Indicators:
RSI & MACD: Long-term momentum indicators reflect a weak/neutral profile with limited directional conviction, typical of micro-cap assets tracking broader crypto market sentiment.
Volume: Low daily volume indicates limited institutional involvement, making the price highly sensitive to single-order volatility.
$ONE is trading around $0.000049 to $0.00010 with a low total market capitalization and modest 24-hour trading volume. The overall structure remains low-liquidity and range-bound.
Key Levels:
Resistance: Implied near the $0.00011 – $0.00017 horizontal supply ceiling where recent upside rejections occurred.
Support: Immediate demand sits near $0.000045 – $0.000085. A drop below this zone risks further downside expansion.
Technical Indicators:
RSI & MACD: Long-term momentum indicators reflect a weak/neutral profile with limited directional conviction, typical of micro-cap assets tracking broader crypto market sentiment.
Volume: Low daily volume indicates limited institutional involvement, making the price highly sensitive to single-order volatility.
Key Levels:
Resistance: Implied near the $0.00011 – $0.00017 horizontal supply ceiling where recent upside rejections occurred.
Support: Immediate demand sits near $0.000045 – $0.000085. A drop below this zone risks further downside expansion.
Technical Indicators:
RSI & MACD: Long-term momentum indicators reflect a weak/neutral profile with limited directional conviction, typical of micro-cap assets tracking broader crypto market sentiment.
Volume: Low daily volume indicates limited institutional involvement, making the price highly sensitive to single-order volatility.
3
·
--
Xem bản dịch
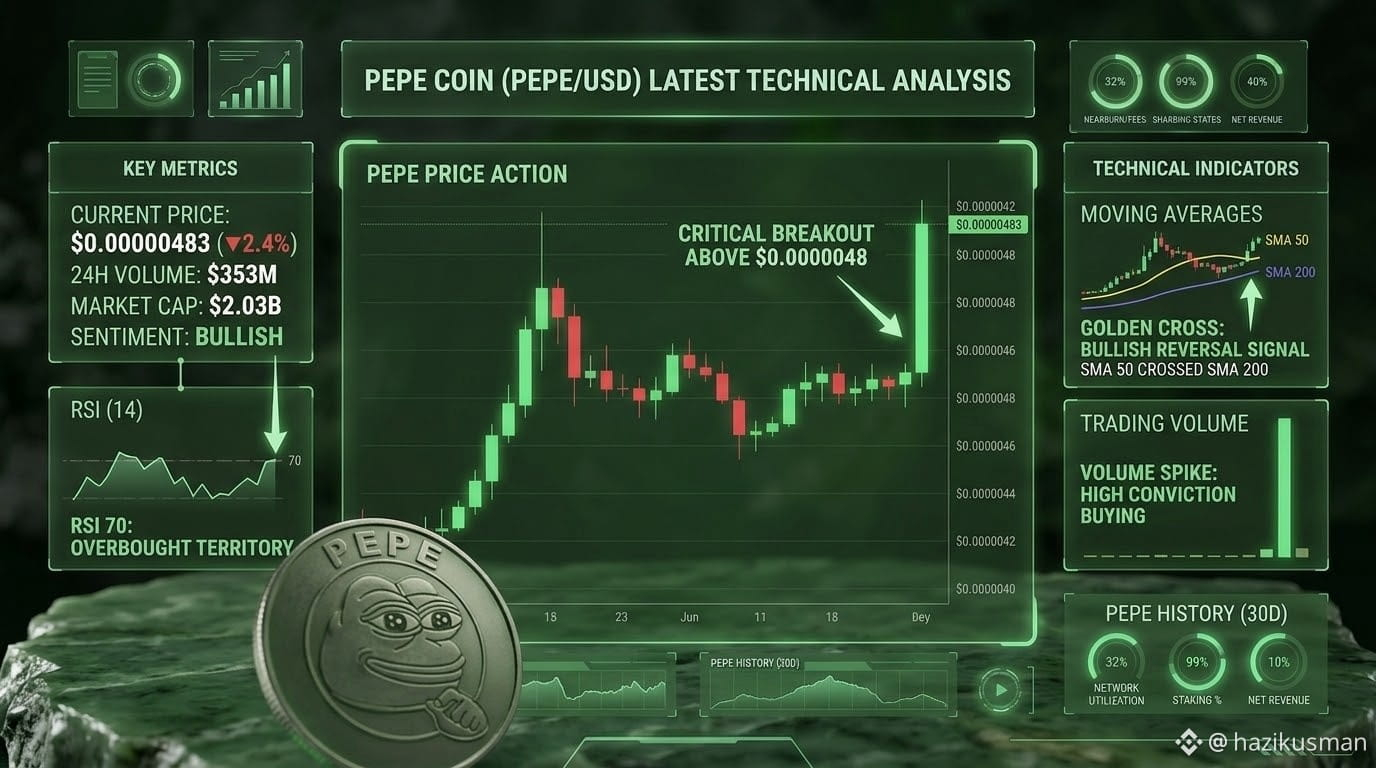
$PEPE (PEPE/USD) is exhibiting significant bullish momentum. The generated 30-day technical analysis infographic captures a critical breakout above the established resistance level of $0.0000048, which has triggered substantial buying conviction, evidenced by a massive spike in trading volume.
The analysis dashboard highlights two primary indicators of a bullish reversal: the successful breakout and a confirmed 'Golden Cross,' where the 50-day SMA has crossed above the 200-day SMA. With a current price of $0.00000483 and strong on-chain volume ($353M), PEPE's sentiment is firmly bullish, although the RSI at 70 indicates the asset has entered overbought territory in the short term, suggesting a potential consolidation or minor pullback.
$PEPE (PEPE/USD) is exhibiting significant bullish momentum. The generated 30-day technical analysis infographic captures a critical breakout above the established resistance level of $0.0000048, which has triggered substantial buying conviction, evidenced by a massive spike in trading volume.
The analysis dashboard highlights two primary indicators of a bullish reversal: the successful breakout and a confirmed 'Golden Cross,' where the 50-day SMA has crossed above the 200-day SMA. With a current price of $0.00000483 and strong on-chain volume ($353M), PEPE's sentiment is firmly bullish, although the RSI at 70 indicates the asset has entered overbought territory in the short term, suggesting a potential consolidation or minor pullback.
The analysis dashboard highlights two primary indicators of a bullish reversal: the successful breakout and a confirmed 'Golden Cross,' where the 50-day SMA has crossed above the 200-day SMA. With a current price of $0.00000483 and strong on-chain volume ($353M), PEPE's sentiment is firmly bullish, although the RSI at 70 indicates the asset has entered overbought territory in the short term, suggesting a potential consolidation or minor pullback.
5
·
--
Xem bản dịch
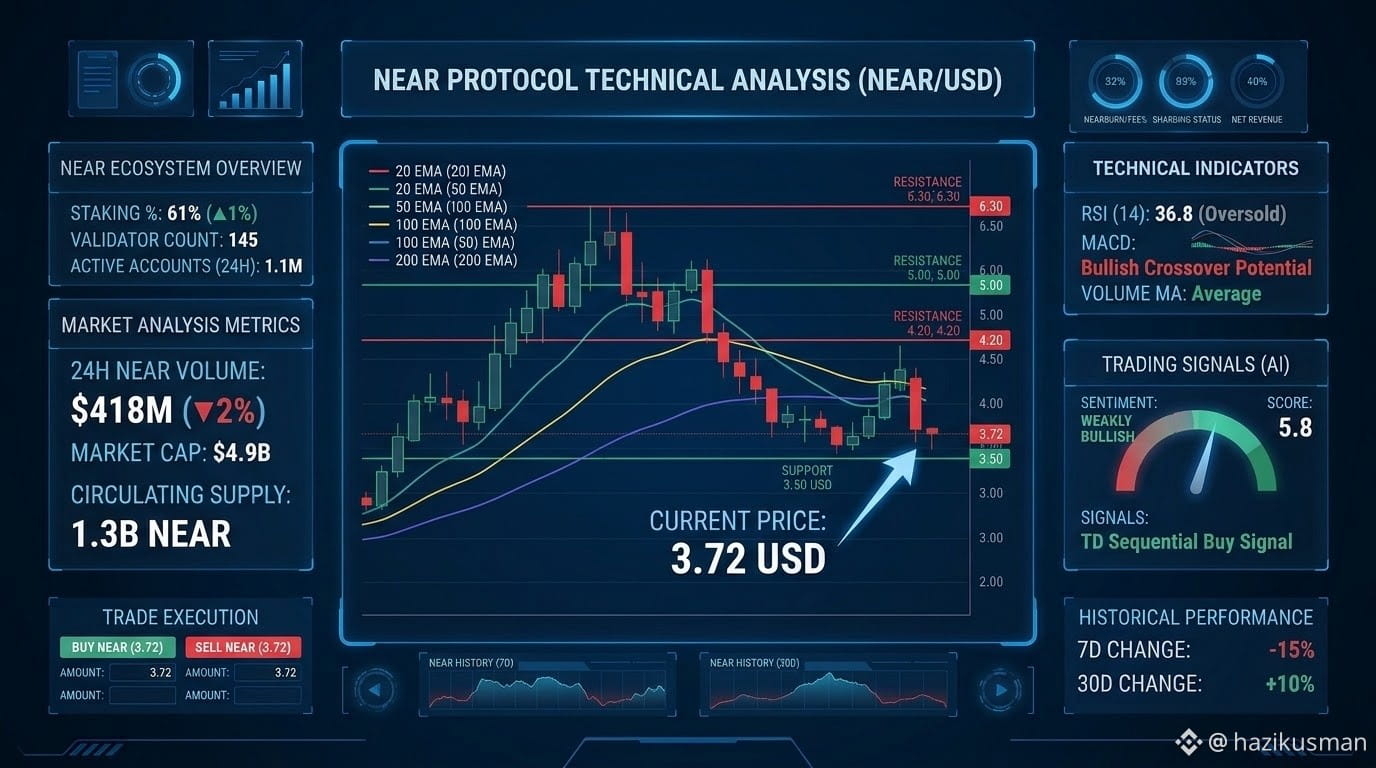
$NEAR is currently trading around $3.70 – $3.76 USD, consolidating after recent market-wide retests. While short-term macro fluctuations have kept price action tight within the $3.50 – $3.75 range, daily technical indicators show early signs of a bullish momentum pivot supported by key moving average crossovers.
NEAR Protocol (NEAR/USD) Technical Analysis Chart displaying price around $3.72 USD with key support, resistance, and technical indicators. (Generated visual model based on market data)
Key Market Metrics & Snapshot
Current Price: ~$3.72 USD
24-Hour Trading Volume: ~$410M – $430M USD
Market Capitalization: ~$4.91B USD (Ranked #19)
Immediate Support Zone: $3.50 – $3.63 USD
Immediate Resistance Zone: $3.95 – $4.20 USD
Technical Summary: Neutral to Bullish (RSI near 36.8 [Oversold recovery], 50-day EMA at ~$3.33 providing solid base support)
Critical Takeaways & Outlook
Base Support Defense: NEAR has repeatedly defended the $3.50 – $3.60 demand zone. Holding above this floor is critical to maintain structural strength toward key overhead targets.
Moving Average Positioning: The 50-day EMA (~$3.33) is holding firm below the current price, offering clear trend support while the 200-day EMA (~$6.32) acts as the primary long-term macro resistance objective.
Ecosystem & AI Catalyst: NEAR's positioning as an AI-native Layer-1 blockchain alongside steady institutional involvement continues to bolster user adoption, providing a strong fundamental backbone for potential upside once broader market liquidity improves.
$NEAR is currently trading around $3.70 – $3.76 USD, consolidating after recent market-wide retests. While short-term macro fluctuations have kept price action tight within the $3.50 – $3.75 range, daily technical indicators show early signs of a bullish momentum pivot supported by key moving average crossovers.
NEAR Protocol (NEAR/USD) Technical Analysis Chart displaying price around $3.72 USD with key support, resistance, and technical indicators. (Generated visual model based on market data)
Key Market Metrics & Snapshot
Current Price: ~$3.72 USD
24-Hour Trading Volume: ~$410M – $430M USD
Market Capitalization: ~$4.91B USD (Ranked #19)
Immediate Support Zone: $3.50 – $3.63 USD
Immediate Resistance Zone: $3.95 – $4.20 USD
Technical Summary: Neutral to Bullish (RSI near 36.8 [Oversold recovery], 50-day EMA at ~$3.33 providing solid base support)
Critical Takeaways & Outlook
Base Support Defense: NEAR has repeatedly defended the $3.50 – $3.60 demand zone. Holding above this floor is critical to maintain structural strength toward key overhead targets.
Moving Average Positioning: The 50-day EMA (~$3.33) is holding firm below the current price, offering clear trend support while the 200-day EMA (~$6.32) acts as the primary long-term macro resistance objective.
Ecosystem & AI Catalyst: NEAR's positioning as an AI-native Layer-1 blockchain alongside steady institutional involvement continues to bolster user adoption, providing a strong fundamental backbone for potential upside once broader market liquidity improves.
NEAR Protocol (NEAR/USD) Technical Analysis Chart displaying price around $3.72 USD with key support, resistance, and technical indicators. (Generated visual model based on market data)
Key Market Metrics & Snapshot
Current Price: ~$3.72 USD
24-Hour Trading Volume: ~$410M – $430M USD
Market Capitalization: ~$4.91B USD (Ranked #19)
Immediate Support Zone: $3.50 – $3.63 USD
Immediate Resistance Zone: $3.95 – $4.20 USD
Technical Summary: Neutral to Bullish (RSI near 36.8 [Oversold recovery], 50-day EMA at ~$3.33 providing solid base support)
Critical Takeaways & Outlook
Base Support Defense: NEAR has repeatedly defended the $3.50 – $3.60 demand zone. Holding above this floor is critical to maintain structural strength toward key overhead targets.
Moving Average Positioning: The 50-day EMA (~$3.33) is holding firm below the current price, offering clear trend support while the 200-day EMA (~$6.32) acts as the primary long-term macro resistance objective.
Ecosystem & AI Catalyst: NEAR's positioning as an AI-native Layer-1 blockchain alongside steady institutional involvement continues to bolster user adoption, providing a strong fundamental backbone for potential upside once broader market liquidity improves.
6
·
--
Xem bản dịch
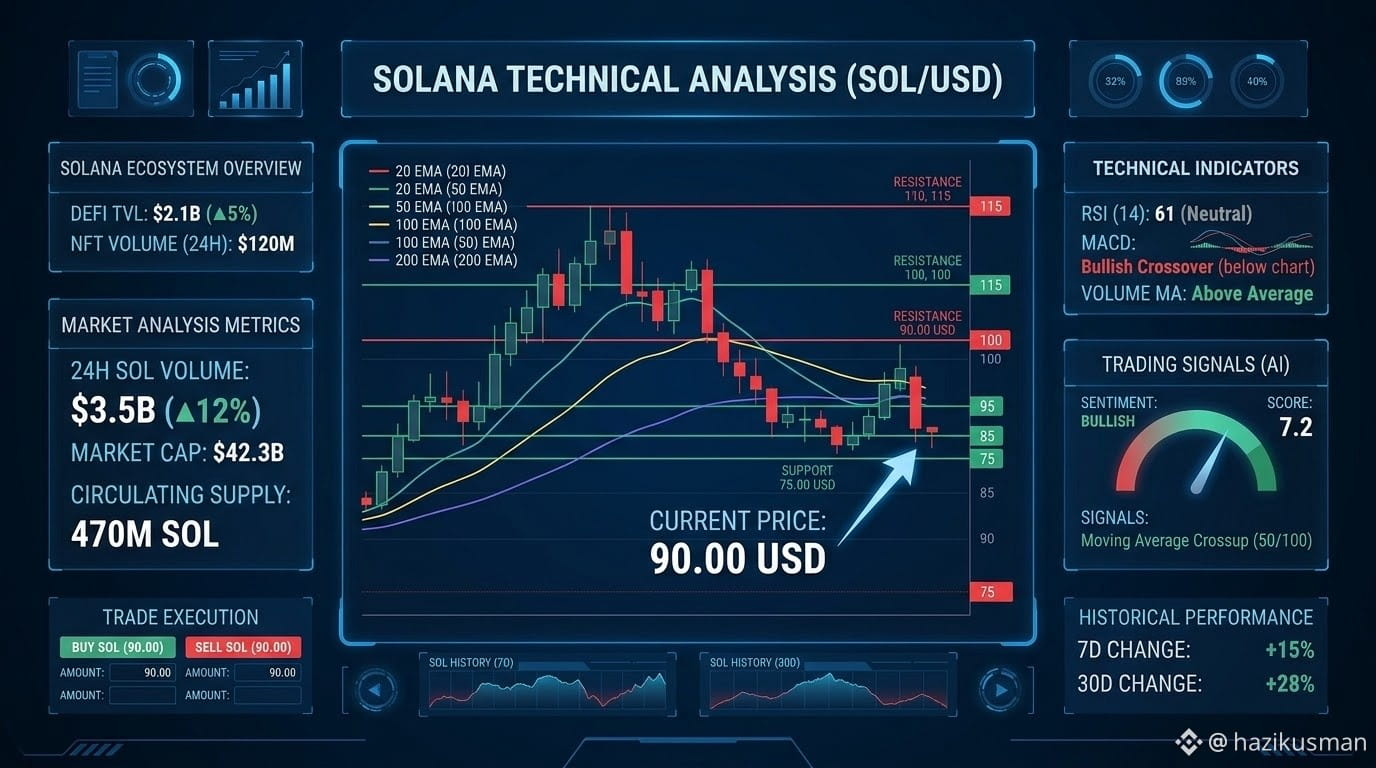
$SOL is currently testing a critical structural boundary as market volatility accelerates. After pulling back toward the $89 – $90 range, the asset is hovering directly near key long-term moving averages.
Current Price: ~$89.00 – $90.50 USD
200-Day Moving Average: ~$88.90 (Serving as primary macro support)
Immediate Support Zone: $87.50 – $89.00
Key Resistance Levels: $95.50 (Short-term hurdle) and $98.70 (100-Day MA)
50-Day Moving Average: ~$108.60 (Required for structural trend reversal)
Key Takeaways & Outlook
200-Day MA Defense: Solana is aggressively testing its 200-day moving average near $88.90. Holding this zone is essential for bulls to prevent deeper drawdowns toward secondary support at $77.00.
On-Chain Fundamentals: Network engagement remains high with robust decentralized exchange (DEX) volume performance relative to market cap, despite recent broader market liquidations and ETF outflows impacting spot momentum.
Trader Focus: A daily close above $98.70 (100-Day MA) would mark the first concrete technical signal of a bullish pivot back toward the $100+ range.
$SOL is currently testing a critical structural boundary as market volatility accelerates. After pulling back toward the $89 – $90 range, the asset is hovering directly near key long-term moving averages.
Current Price: ~$89.00 – $90.50 USD
200-Day Moving Average: ~$88.90 (Serving as primary macro support)
Immediate Support Zone: $87.50 – $89.00
Key Resistance Levels: $95.50 (Short-term hurdle) and $98.70 (100-Day MA)
50-Day Moving Average: ~$108.60 (Required for structural trend reversal)
Key Takeaways & Outlook
200-Day MA Defense: Solana is aggressively testing its 200-day moving average near $88.90. Holding this zone is essential for bulls to prevent deeper drawdowns toward secondary support at $77.00.
On-Chain Fundamentals: Network engagement remains high with robust decentralized exchange (DEX) volume performance relative to market cap, despite recent broader market liquidations and ETF outflows impacting spot momentum.
Trader Focus: A daily close above $98.70 (100-Day MA) would mark the first concrete technical signal of a bullish pivot back toward the $100+ range.
Current Price: ~$89.00 – $90.50 USD
200-Day Moving Average: ~$88.90 (Serving as primary macro support)
Immediate Support Zone: $87.50 – $89.00
Key Resistance Levels: $95.50 (Short-term hurdle) and $98.70 (100-Day MA)
50-Day Moving Average: ~$108.60 (Required for structural trend reversal)
Key Takeaways & Outlook
200-Day MA Defense: Solana is aggressively testing its 200-day moving average near $88.90. Holding this zone is essential for bulls to prevent deeper drawdowns toward secondary support at $77.00.
On-Chain Fundamentals: Network engagement remains high with robust decentralized exchange (DEX) volume performance relative to market cap, despite recent broader market liquidations and ETF outflows impacting spot momentum.
Trader Focus: A daily close above $98.70 (100-Day MA) would mark the first concrete technical signal of a bullish pivot back toward the $100+ range.
·
--
Xem bản dịch
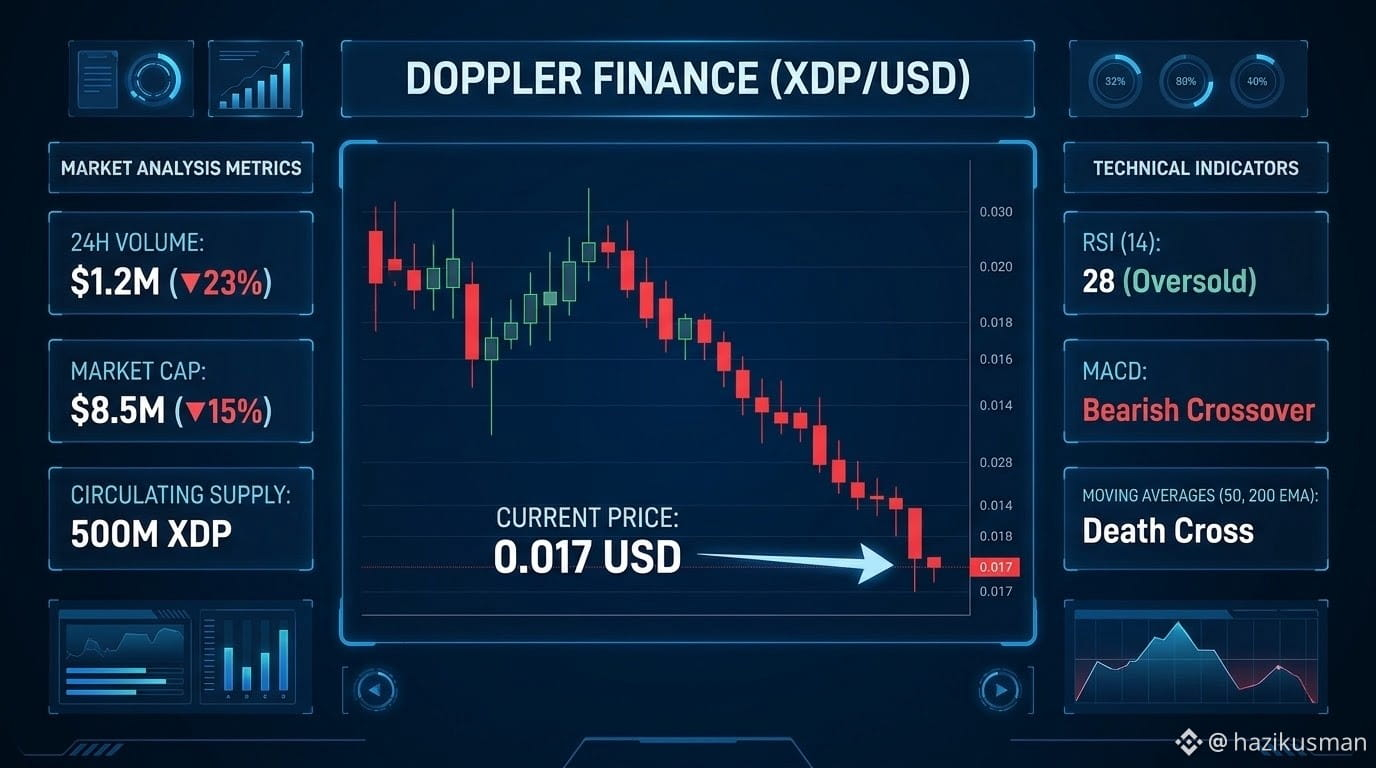
$XDP is currently undergoing a consolidation phase following its late-September price discovery run. The token has settled into a narrow trading channel as early market volatility cools down.
Key Technical Indicators & Price Snapshot
Current Trading Price: ~$0.017 – $0.018 USD
24-Hour Change: -1.4% to -6.0% (slight short-term downside pressure)
Circulating Supply: 1.0 Billion XDP (out of 10B Max Supply)
Key Support Level: $0.0160 – $0.0170 (Defending near recent all-time lows)
Key Resistance Zone: $0.0195 – $0.0230 (First hurdle before any bullish reversal)
Short-Term Outlook & Summary
Bearish Range-Bound Trajectory: XDP has pulled back substantially from its post-launch peak near $0.044. Lower volume indicates reduced speculative interest, making the token range-bound between $0.017 and $0.020.
Downside Risks: With only 10% of the total supply currently in circulation, token unlocks and utility adoption speed remain the primary long-term factors for price retention.
Traders' Strategy: Short-term traders are keeping a close watch on the $0.016 support line. A strong bounce above $0.0195 would be required to shift market sentiment back to neutral-bullish.
$XDP is currently undergoing a consolidation phase following its late-September price discovery run. The token has settled into a narrow trading channel as early market volatility cools down.
Key Technical Indicators & Price Snapshot
Current Trading Price: ~$0.017 – $0.018 USD
24-Hour Change: -1.4% to -6.0% (slight short-term downside pressure)
Circulating Supply: 1.0 Billion XDP (out of 10B Max Supply)
Key Support Level: $0.0160 – $0.0170 (Defending near recent all-time lows)
Key Resistance Zone: $0.0195 – $0.0230 (First hurdle before any bullish reversal)
Short-Term Outlook & Summary
Bearish Range-Bound Trajectory: XDP has pulled back substantially from its post-launch peak near $0.044. Lower volume indicates reduced speculative interest, making the token range-bound between $0.017 and $0.020.
Downside Risks: With only 10% of the total supply currently in circulation, token unlocks and utility adoption speed remain the primary long-term factors for price retention.
Traders' Strategy: Short-term traders are keeping a close watch on the $0.016 support line. A strong bounce above $0.0195 would be required to shift market sentiment back to neutral-bullish.
Key Technical Indicators & Price Snapshot
Current Trading Price: ~$0.017 – $0.018 USD
24-Hour Change: -1.4% to -6.0% (slight short-term downside pressure)
Circulating Supply: 1.0 Billion XDP (out of 10B Max Supply)
Key Support Level: $0.0160 – $0.0170 (Defending near recent all-time lows)
Key Resistance Zone: $0.0195 – $0.0230 (First hurdle before any bullish reversal)
Short-Term Outlook & Summary
Bearish Range-Bound Trajectory: XDP has pulled back substantially from its post-launch peak near $0.044. Lower volume indicates reduced speculative interest, making the token range-bound between $0.017 and $0.020.
Downside Risks: With only 10% of the total supply currently in circulation, token unlocks and utility adoption speed remain the primary long-term factors for price retention.
Traders' Strategy: Short-term traders are keeping a close watch on the $0.016 support line. A strong bounce above $0.0195 would be required to shift market sentiment back to neutral-bullish.
37
·
--
Xem bản dịch
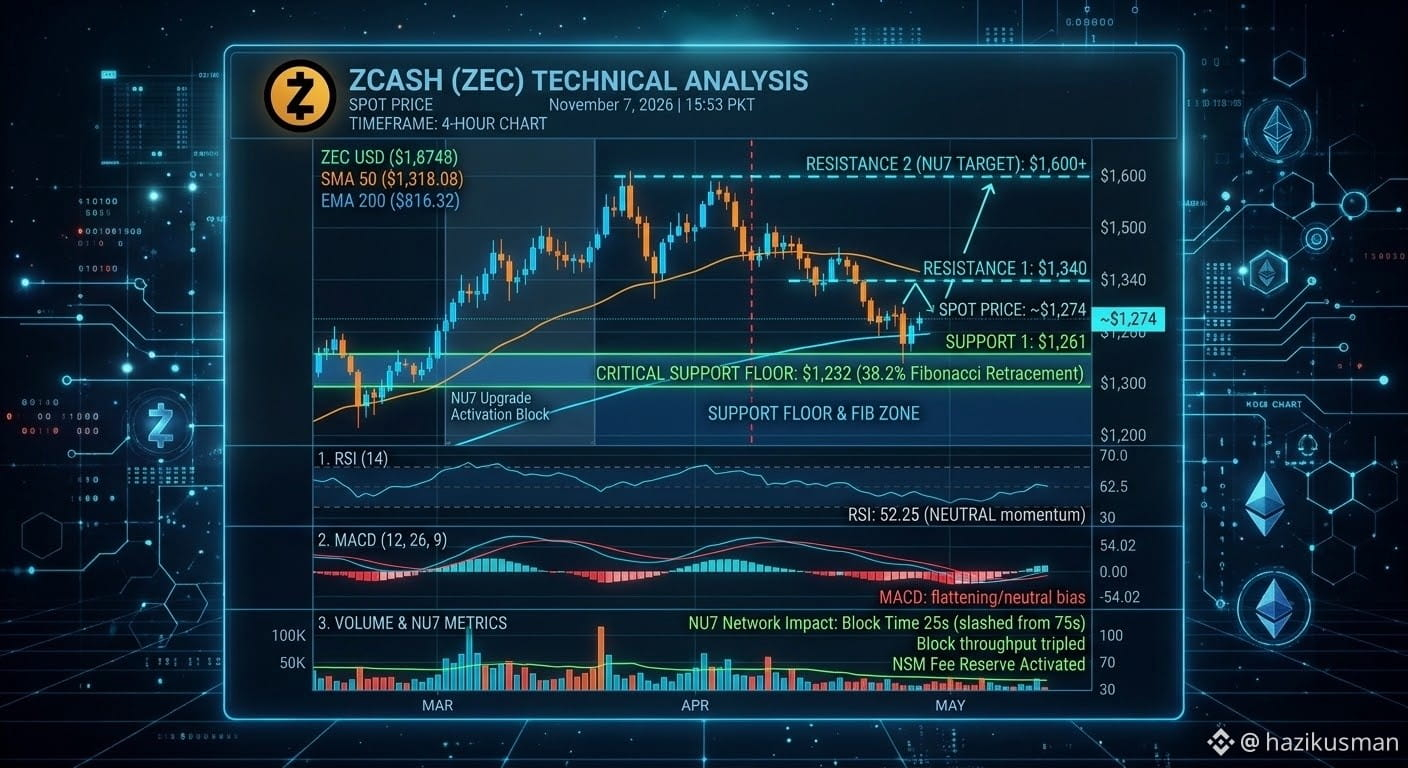
$ZEC is trading around $1,261 – $1,287, experiencing a brief cooling period following recent volatility tied to the network's major NU7 upgrade rollout and broader market liquidations. Despite near-term digestion, ZEC maintains a robust multi-month structure, bolstered by institutional interest (including spot ETP/ETF product frameworks) and reduced block times from the NU7 activation.
NU7 Network Upgrade: The recent activation successfully slashed block confirmation times to 25 seconds and introduced the Network Sustainability Mechanism, creating strong long-term fundamental tailwinds despite minor transitional debates.
Institutional Context: ZEC continues to benefit from wider regulated visibility via privacy-focused ETP/ETF products, positioning it uniquely among layer-1 privacy assets.
Bullish Scenario: Sustained defense of the $1,261 support zone sets the stage for a push back through $1,340, paving a clear path toward retesting multi-week highs near $1,600+.
Bearish Scenario: A decisive daily close below $1,230 risks an extended correction toward deeper Fibonacci support anchors around $1,180.
$ZEC is trading around $1,261 – $1,287, experiencing a brief cooling period following recent volatility tied to the network's major NU7 upgrade rollout and broader market liquidations. Despite near-term digestion, ZEC maintains a robust multi-month structure, bolstered by institutional interest (including spot ETP/ETF product frameworks) and reduced block times from the NU7 activation.
NU7 Network Upgrade: The recent activation successfully slashed block confirmation times to 25 seconds and introduced the Network Sustainability Mechanism, creating strong long-term fundamental tailwinds despite minor transitional debates.
Institutional Context: ZEC continues to benefit from wider regulated visibility via privacy-focused ETP/ETF products, positioning it uniquely among layer-1 privacy assets.
Bullish Scenario: Sustained defense of the $1,261 support zone sets the stage for a push back through $1,340, paving a clear path toward retesting multi-week highs near $1,600+.
Bearish Scenario: A decisive daily close below $1,230 risks an extended correction toward deeper Fibonacci support anchors around $1,180.
NU7 Network Upgrade: The recent activation successfully slashed block confirmation times to 25 seconds and introduced the Network Sustainability Mechanism, creating strong long-term fundamental tailwinds despite minor transitional debates.
Institutional Context: ZEC continues to benefit from wider regulated visibility via privacy-focused ETP/ETF products, positioning it uniquely among layer-1 privacy assets.
Bullish Scenario: Sustained defense of the $1,261 support zone sets the stage for a push back through $1,340, paving a clear path toward retesting multi-week highs near $1,600+.
Bearish Scenario: A decisive daily close below $1,230 risks an extended correction toward deeper Fibonacci support anchors around $1,180.
30
·
--
Xem bản dịch
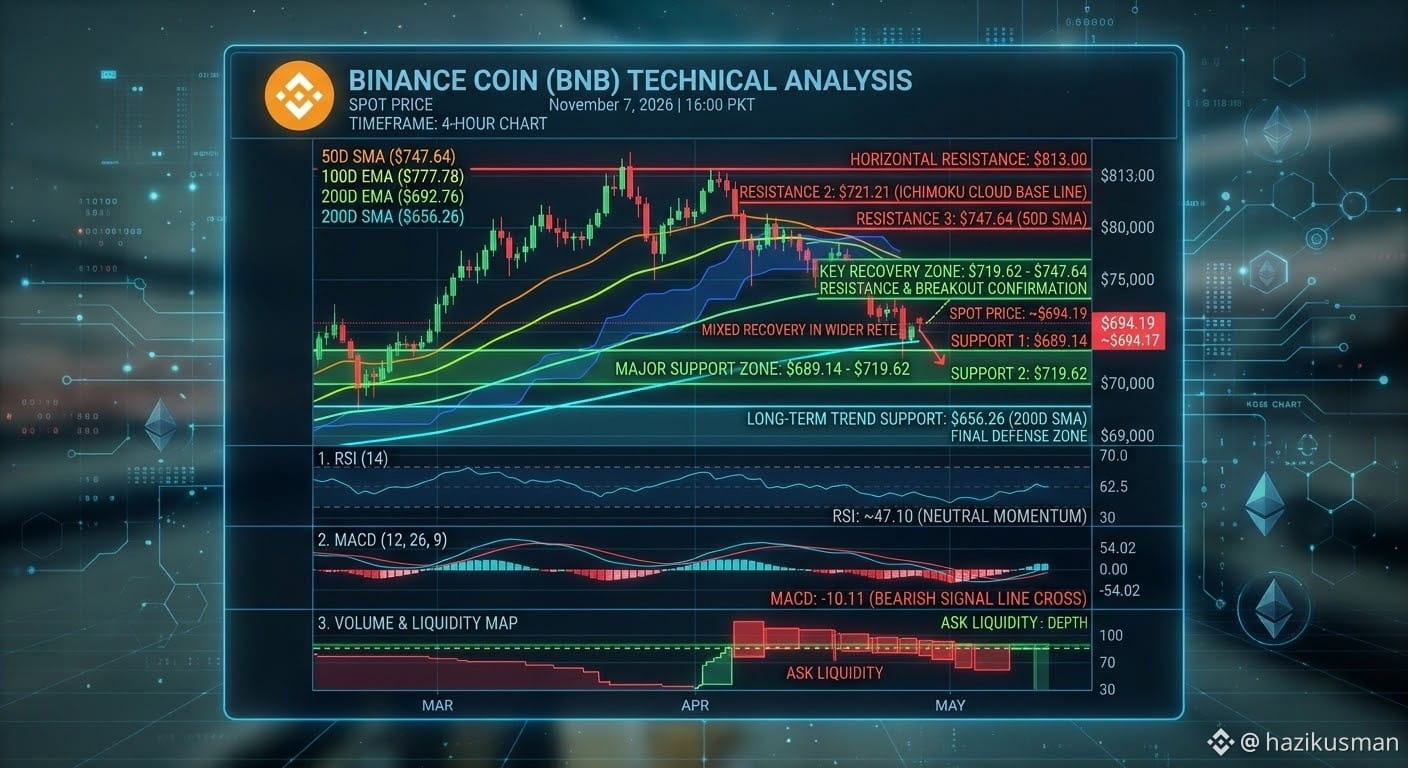
$BNB is currently at a critical juncture, navigating a complex technical landscape. As of November 7, 2026, the price is testing a pivotal, wider demand zone while facing multiple trend-based resistance clusters, creating a "make-or-break" scenario.
Analysis Conclusion & Outlook
BNB’s price structure is defined by heavy overhead resistance. The immediate ceiling at $692.76 (200D EMA) must be broken for a neutral recovery attempt. Until that happens, the dominant path is defined by a series of downward-sloping barriers.
Bullish Scenario: A decisive, high-volume close above the multi-tiered resistance cluster up to $721.21 (Ichimoku Cloud and 50D SMA) is required to unlock a bullish recovery toward $800+.
Bearish Scenario: If BNB is rejected at the current $692.76 level and breaks below the wide support floor at $689.14, it will likely target the final long-term defense line at $656.26.
$BNB is currently at a critical juncture, navigating a complex technical landscape. As of November 7, 2026, the price is testing a pivotal, wider demand zone while facing multiple trend-based resistance clusters, creating a "make-or-break" scenario.
Analysis Conclusion & Outlook
BNB’s price structure is defined by heavy overhead resistance. The immediate ceiling at $692.76 (200D EMA) must be broken for a neutral recovery attempt. Until that happens, the dominant path is defined by a series of downward-sloping barriers.
Bullish Scenario: A decisive, high-volume close above the multi-tiered resistance cluster up to $721.21 (Ichimoku Cloud and 50D SMA) is required to unlock a bullish recovery toward $800+.
Bearish Scenario: If BNB is rejected at the current $692.76 level and breaks below the wide support floor at $689.14, it will likely target the final long-term defense line at $656.26.
Analysis Conclusion & Outlook
BNB’s price structure is defined by heavy overhead resistance. The immediate ceiling at $692.76 (200D EMA) must be broken for a neutral recovery attempt. Until that happens, the dominant path is defined by a series of downward-sloping barriers.
Bullish Scenario: A decisive, high-volume close above the multi-tiered resistance cluster up to $721.21 (Ichimoku Cloud and 50D SMA) is required to unlock a bullish recovery toward $800+.
Bearish Scenario: If BNB is rejected at the current $692.76 level and breaks below the wide support floor at $689.14, it will likely target the final long-term defense line at $656.26.
43
·
--
Xem bản dịch
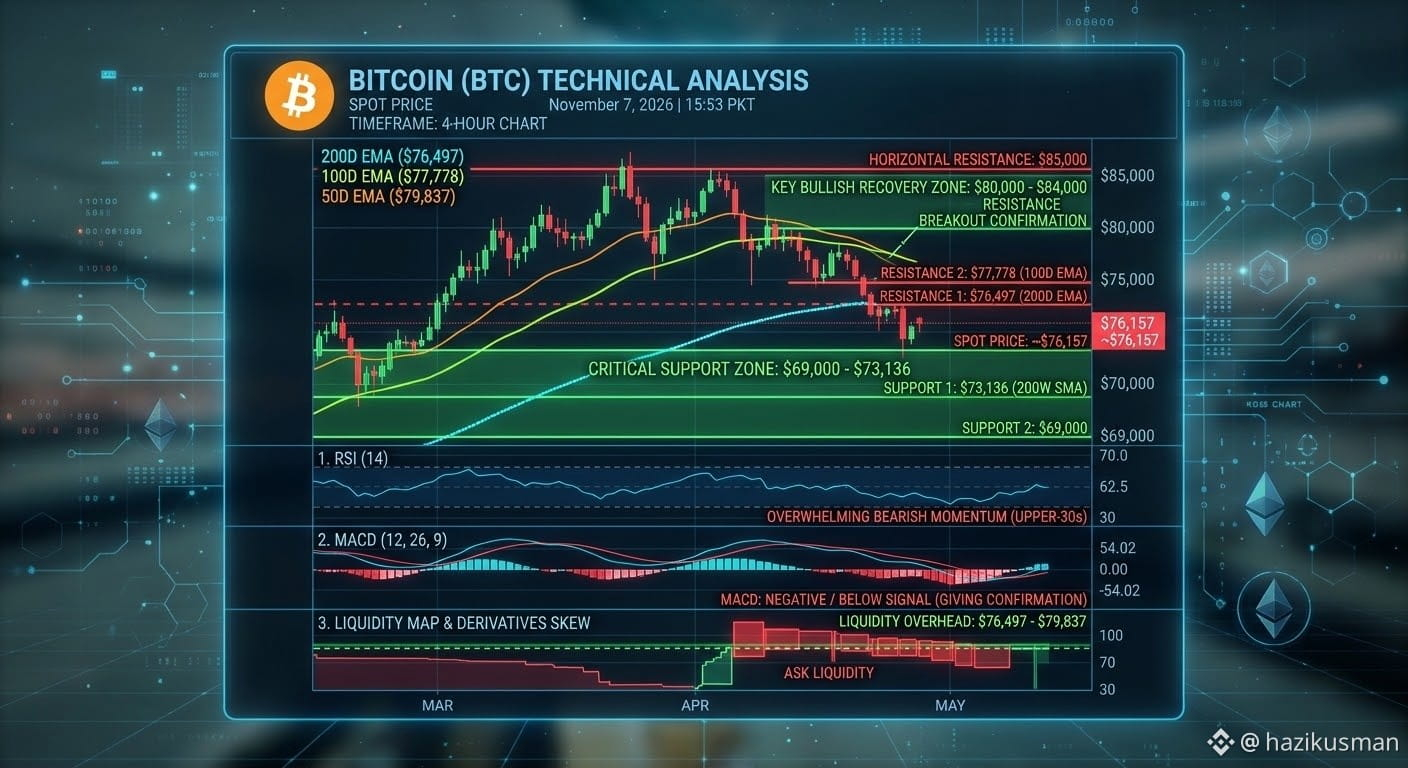
$BTC is navigating a significant trend shift, having closed below a critical cluster of moving averages, signalling renewed bearish near-term bias. The dominant feature of the current landscape is a dense band of medium- and longer-term trend resistance overhead, which has capped recent recovery attempts.
Analysis Conclusion & Outlook
The market structure has broken down in the near term. The cluster of EMAs ($76,497–$79,837) now acts as a dense ceiling, suggesting that any rallies are likely to be capped until a significant volume breakout occurs.
Bullish Scenario: To invalidate the bearish bias, BTC must first regain and consolidate above the 200-day EMA at $76,497. A daily close above the horizontal resistance at $85,000 would signal a potential return to the broader high-volatility range.
Bearish Scenario (Current Dominant): As long as BTC holds beneath the EMA cluster, the trend favors continuation of the corrective phase. Given the lack of immediate horizontal support, any pullback is likely to seek a new, undefined floor well below spot. Rallies are vulnerable.
$BTC is navigating a significant trend shift, having closed below a critical cluster of moving averages, signalling renewed bearish near-term bias. The dominant feature of the current landscape is a dense band of medium- and longer-term trend resistance overhead, which has capped recent recovery attempts.
Analysis Conclusion & Outlook
The market structure has broken down in the near term. The cluster of EMAs ($76,497–$79,837) now acts as a dense ceiling, suggesting that any rallies are likely to be capped until a significant volume breakout occurs.
Bullish Scenario: To invalidate the bearish bias, BTC must first regain and consolidate above the 200-day EMA at $76,497. A daily close above the horizontal resistance at $85,000 would signal a potential return to the broader high-volatility range.
Bearish Scenario (Current Dominant): As long as BTC holds beneath the EMA cluster, the trend favors continuation of the corrective phase. Given the lack of immediate horizontal support, any pullback is likely to seek a new, undefined floor well below spot. Rallies are vulnerable.
Analysis Conclusion & Outlook
The market structure has broken down in the near term. The cluster of EMAs ($76,497–$79,837) now acts as a dense ceiling, suggesting that any rallies are likely to be capped until a significant volume breakout occurs.
Bullish Scenario: To invalidate the bearish bias, BTC must first regain and consolidate above the 200-day EMA at $76,497. A daily close above the horizontal resistance at $85,000 would signal a potential return to the broader high-volatility range.
Bearish Scenario (Current Dominant): As long as BTC holds beneath the EMA cluster, the trend favors continuation of the corrective phase. Given the lack of immediate horizontal support, any pullback is likely to seek a new, undefined floor well below spot. Rallies are vulnerable.
57
·
--
Xem bản dịch
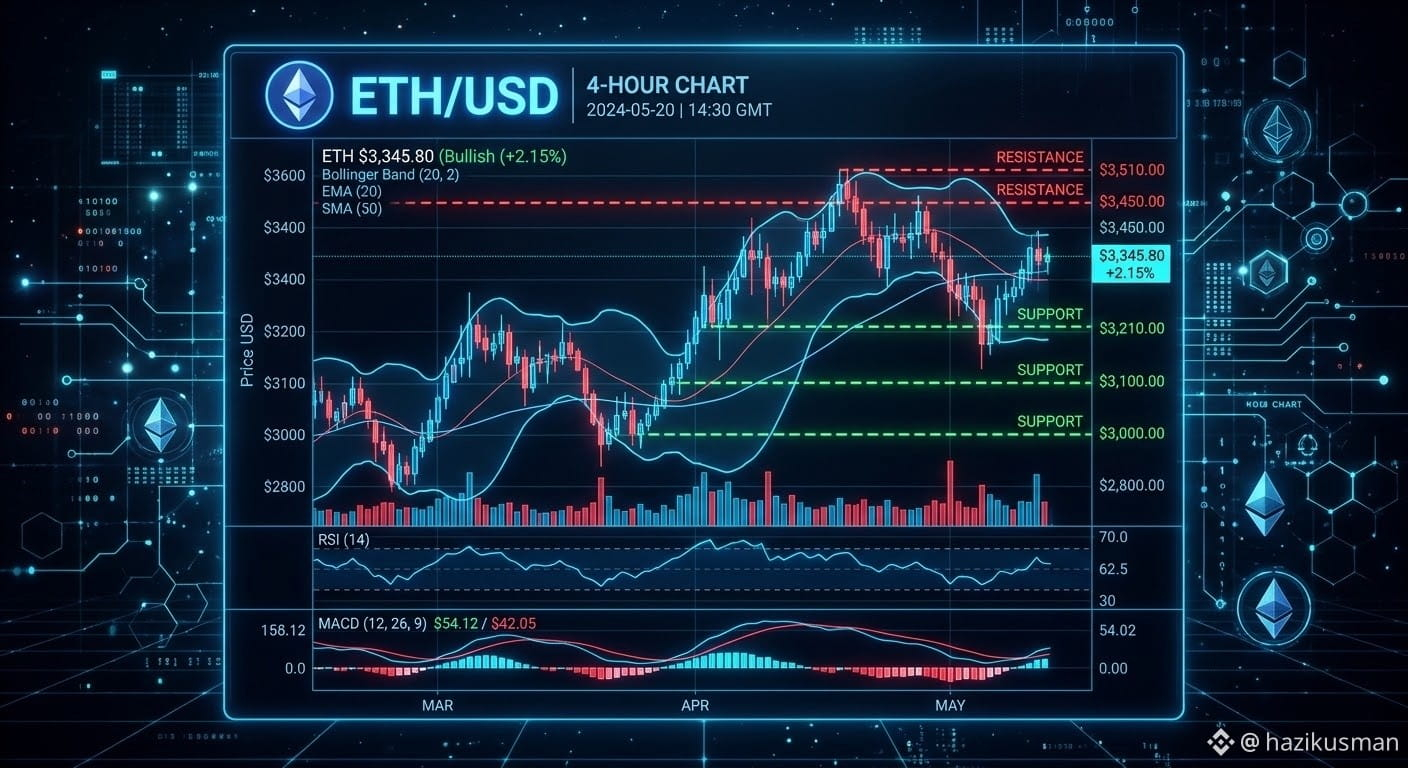
$ETH is currently hovering around $2,225 – $2,250, establishing a consolidation zone following a pullback from earlier high test levels. Its total market capitalization stands near $274 billion, maintaining its position as the leading smart-contract platform and second-largest cryptocurrency by market value.
Key Drivers & Outlook
Layer-2 Expansion & Staking: Network activity remains healthy on Layer-2 solutions, driven by steady protocol activity and reduced transaction friction.
Macro Headwinds & Yields: Crypto asset prices remain tightly bound to Treasury yield movements and broader macroeconomic rate expectations.
Bullish Scenario: A decisive breakout and daily close above the $2,500 – $2,550 resistance range would clear the path for a retest of $2,700+.
Bearish Scenario: Slipping below key support at $2,150 risks extended consolidation down toward the $2,000 psychological floor.
$ETH is currently hovering around $2,225 – $2,250, establishing a consolidation zone following a pullback from earlier high test levels. Its total market capitalization stands near $274 billion, maintaining its position as the leading smart-contract platform and second-largest cryptocurrency by market value.
Key Drivers & Outlook
Layer-2 Expansion & Staking: Network activity remains healthy on Layer-2 solutions, driven by steady protocol activity and reduced transaction friction.
Macro Headwinds & Yields: Crypto asset prices remain tightly bound to Treasury yield movements and broader macroeconomic rate expectations.
Bullish Scenario: A decisive breakout and daily close above the $2,500 – $2,550 resistance range would clear the path for a retest of $2,700+.
Bearish Scenario: Slipping below key support at $2,150 risks extended consolidation down toward the $2,000 psychological floor.
Key Drivers & Outlook
Layer-2 Expansion & Staking: Network activity remains healthy on Layer-2 solutions, driven by steady protocol activity and reduced transaction friction.
Macro Headwinds & Yields: Crypto asset prices remain tightly bound to Treasury yield movements and broader macroeconomic rate expectations.
Bullish Scenario: A decisive breakout and daily close above the $2,500 – $2,550 resistance range would clear the path for a retest of $2,700+.
Bearish Scenario: Slipping below key support at $2,150 risks extended consolidation down toward the $2,000 psychological floor.
64
·
--
Xem bản dịch
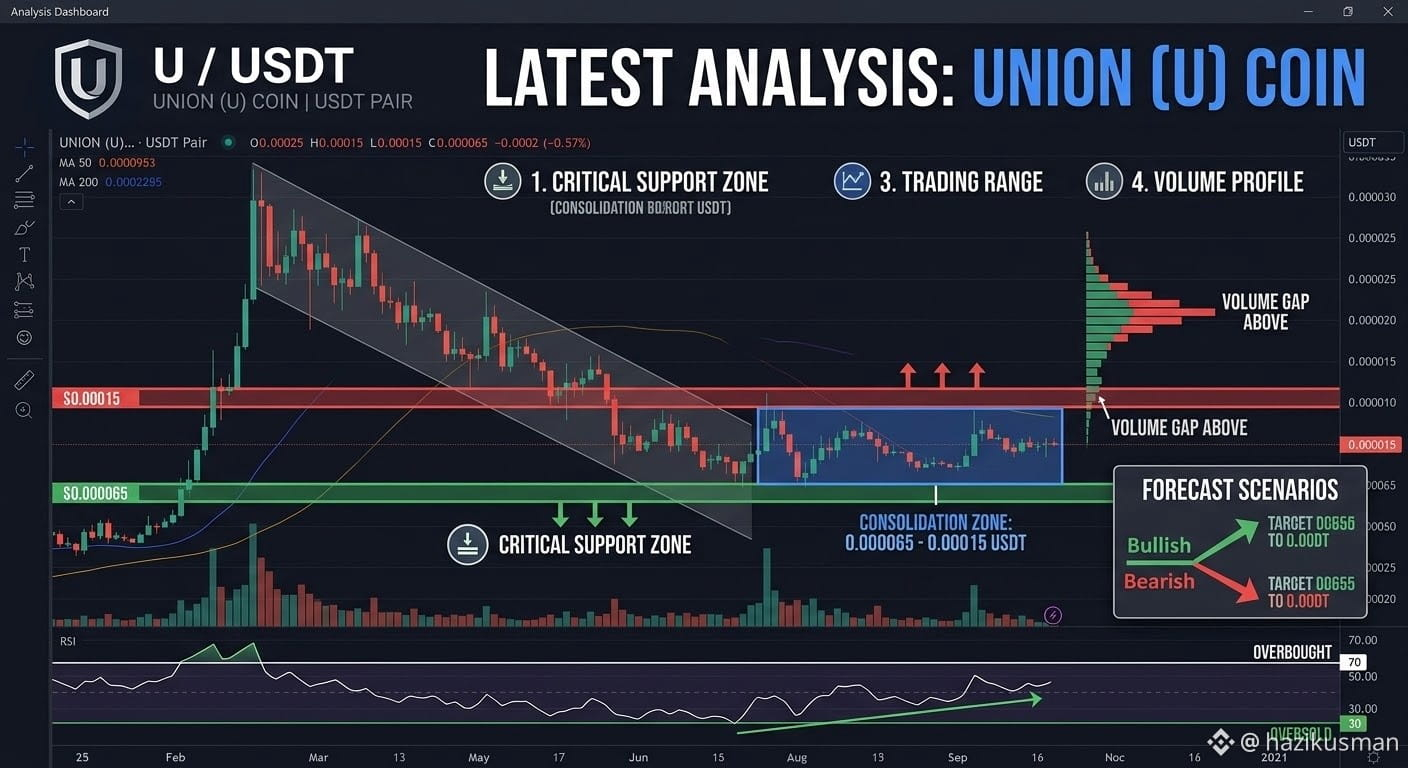
$U token is currently attempting to build a short-term bottom following extended macro consolidation. Recent trading activity shows a moderate 7-day price rebound, though overhead resistance remains strong due to lower market liquidity.
Immediate Support Zone ($0.000065 – $0.000095): The token recently established its baseline support around $0.000065. Holding above the $0.000095 level is critical to preventing another retest of macro historical lows.
Resistance Levels ($0.00015 – $0.00025): Immediate overhead resistance lies near $0.00015. A sustained high-volume breakout past $0.00025 is required to reverse the broader bearish technical bias.
Technical Oscillators: Daily moving averages signal a prevailing Sell / Neutral sentiment across major exchanges, while short-term RSI indicators show oversold recovery signs.
Market Sentiment: Cautious. Traded volumes are low, so short-term moves remain highly volatile until a clear breakout past initial resistance occurs.
$U token is currently attempting to build a short-term bottom following extended macro consolidation. Recent trading activity shows a moderate 7-day price rebound, though overhead resistance remains strong due to lower market liquidity.
Immediate Support Zone ($0.000065 – $0.000095): The token recently established its baseline support around $0.000065. Holding above the $0.000095 level is critical to preventing another retest of macro historical lows.
Resistance Levels ($0.00015 – $0.00025): Immediate overhead resistance lies near $0.00015. A sustained high-volume breakout past $0.00025 is required to reverse the broader bearish technical bias.
Technical Oscillators: Daily moving averages signal a prevailing Sell / Neutral sentiment across major exchanges, while short-term RSI indicators show oversold recovery signs.
Market Sentiment: Cautious. Traded volumes are low, so short-term moves remain highly volatile until a clear breakout past initial resistance occurs.
Immediate Support Zone ($0.000065 – $0.000095): The token recently established its baseline support around $0.000065. Holding above the $0.000095 level is critical to preventing another retest of macro historical lows.
Resistance Levels ($0.00015 – $0.00025): Immediate overhead resistance lies near $0.00015. A sustained high-volume breakout past $0.00025 is required to reverse the broader bearish technical bias.
Technical Oscillators: Daily moving averages signal a prevailing Sell / Neutral sentiment across major exchanges, while short-term RSI indicators show oversold recovery signs.
Market Sentiment: Cautious. Traded volumes are low, so short-term moves remain highly volatile until a clear breakout past initial resistance occurs.
2
·
--
Xem bản dịch
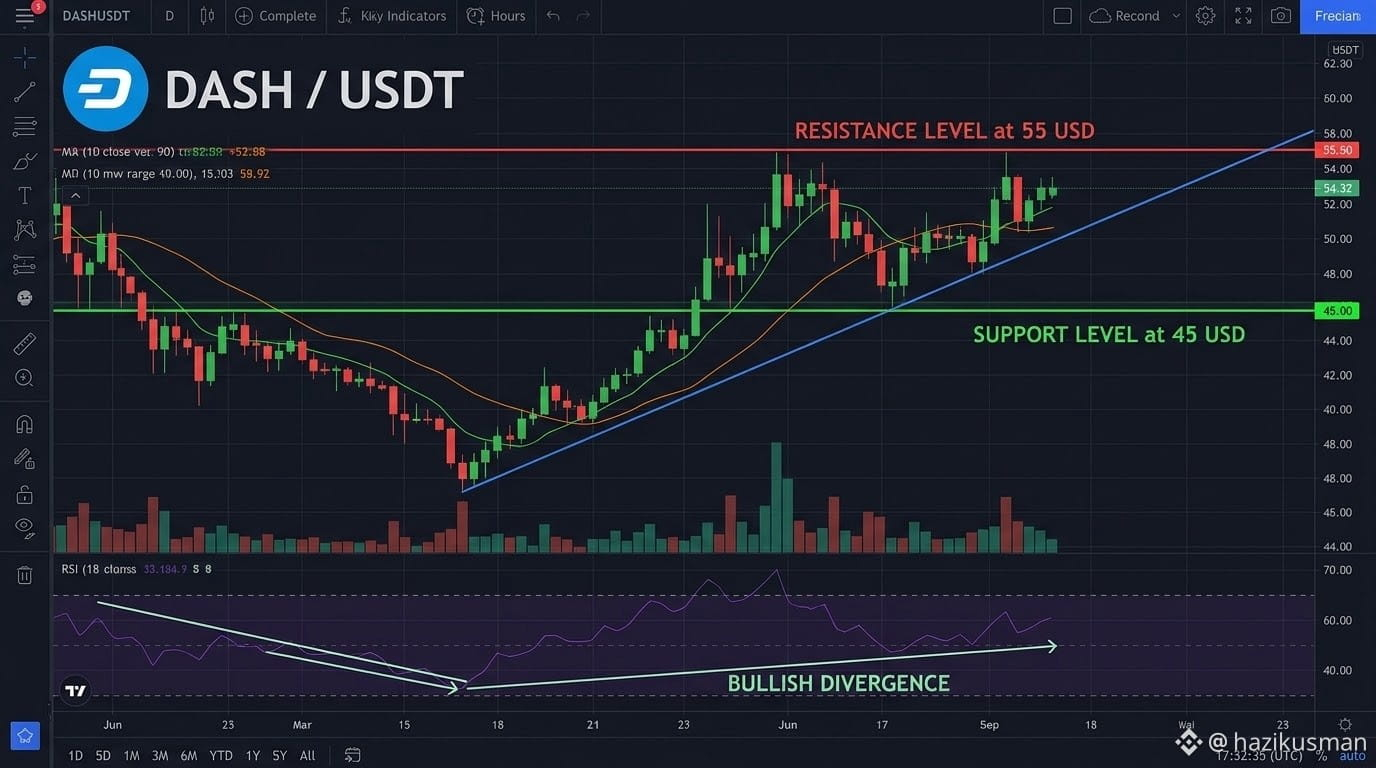
$DASH continues to navigate a broad consolidation phase within the $45.00 – $55.00 range. The price is currently reacting around critical support, balancing near-term crypto market pullbacks against key technical defense zones.
Key Technical Breakdown
Immediate Support Zone ($41.00 – $45.00): The $45.00 level serves as the primary floor protecting the current structure. A sustained break below $41.00 would open downside risks toward multi-month lows.
Key Resistance Zone ($55.00 – $60.00): Bulls face major overhead resistance near $55.00 to $60.00. Clearing this zone with strong volume is required to confirm a medium-term bullish trend continuation.
Chart Patterns & Momentum: On shorter timeframes (4H/8H), lower-boundary tests display signs of bullish RSI divergence along an ascending trendline. Holding this trendline is crucial for setting up a retest of range highs.
Trading Sentiment: Neutral-to-Cautiously Bullish while holding above $45.00. Wait for a confirmed breakout past $55.00 before anticipating extended rallies toward $65.00.
$DASH continues to navigate a broad consolidation phase within the $45.00 – $55.00 range. The price is currently reacting around critical support, balancing near-term crypto market pullbacks against key technical defense zones.
Key Technical Breakdown
Immediate Support Zone ($41.00 – $45.00): The $45.00 level serves as the primary floor protecting the current structure. A sustained break below $41.00 would open downside risks toward multi-month lows.
Key Resistance Zone ($55.00 – $60.00): Bulls face major overhead resistance near $55.00 to $60.00. Clearing this zone with strong volume is required to confirm a medium-term bullish trend continuation.
Chart Patterns & Momentum: On shorter timeframes (4H/8H), lower-boundary tests display signs of bullish RSI divergence along an ascending trendline. Holding this trendline is crucial for setting up a retest of range highs.
Trading Sentiment: Neutral-to-Cautiously Bullish while holding above $45.00. Wait for a confirmed breakout past $55.00 before anticipating extended rallies toward $65.00.
Key Technical Breakdown
Immediate Support Zone ($41.00 – $45.00): The $45.00 level serves as the primary floor protecting the current structure. A sustained break below $41.00 would open downside risks toward multi-month lows.
Key Resistance Zone ($55.00 – $60.00): Bulls face major overhead resistance near $55.00 to $60.00. Clearing this zone with strong volume is required to confirm a medium-term bullish trend continuation.
Chart Patterns & Momentum: On shorter timeframes (4H/8H), lower-boundary tests display signs of bullish RSI divergence along an ascending trendline. Holding this trendline is crucial for setting up a retest of range highs.
Trading Sentiment: Neutral-to-Cautiously Bullish while holding above $45.00. Wait for a confirmed breakout past $55.00 before anticipating extended rallies toward $65.00.
33
·
--
Xem bản dịch
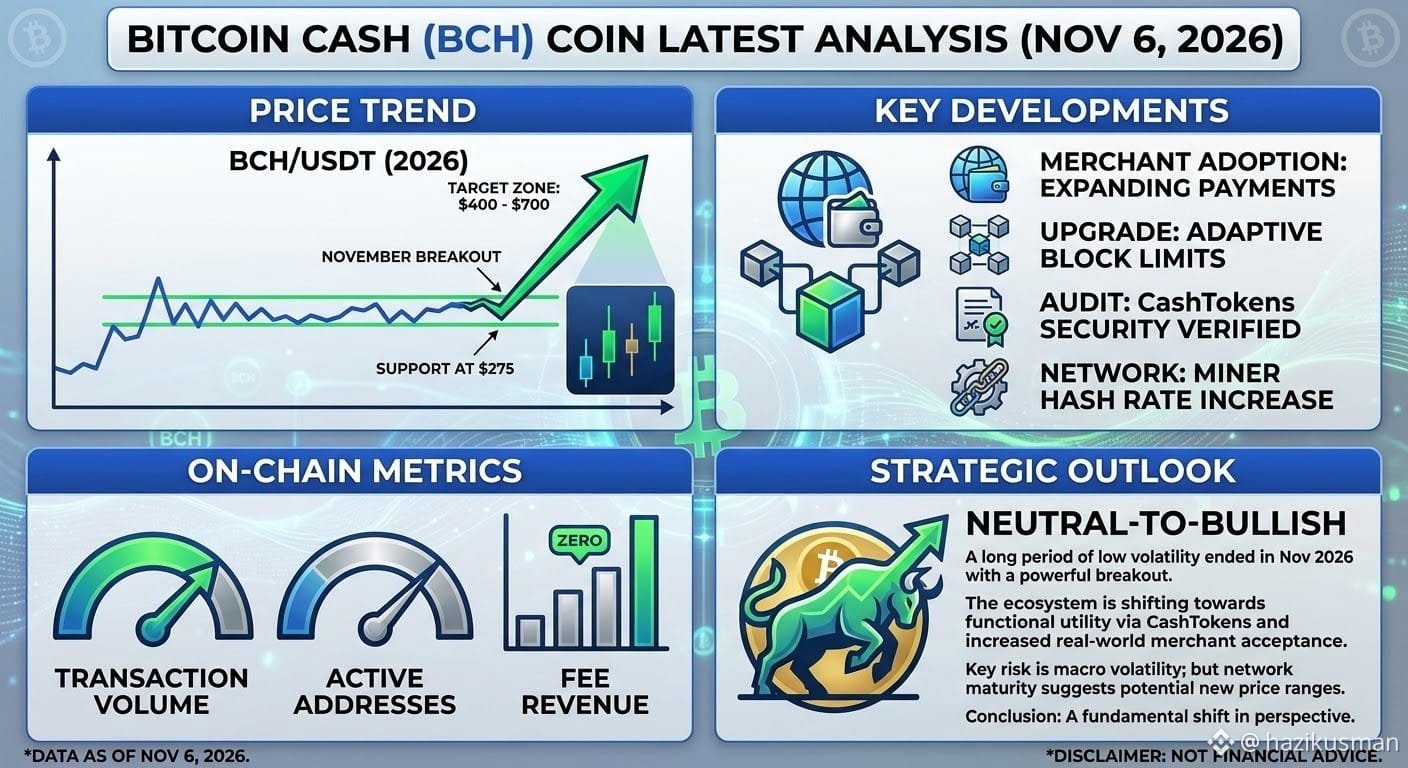
$BCH successfully tested key support at approximately $275 and has since initiated a powerful, high-volume move, shattering long-standing resistance.
Target Zones: Market structure now points to a fresh trading range, with analysts projecting initial upside targets between $400 and $700 before year-end, contingent on the rally’s sustainability.
2. Network Utility: Beyond Payments
CashTokens Integration: The 2026 upgrade for CashTokens has matured, enabling developers to build sophisticated decentralized applications (dApps) and issue native tokens on the BCH blockchain.
Smart Contracts: This functional expansion shifts BCH’s narrative from purely a medium of exchange to a scalable layer-one utility network.
3. Adaptive Scaling & Miner Support
Network Stability: The ongoing implementation of the Adaptive Block Limit Algorithm ensures transaction fees remain fractions of a cent, reinforcing its advantage for micro-transactions.
Hash Rate Stability: A recent, sustained increase in miner hash rate confirms strong network security and confidence from large-scale operators.
Strategic Outlook
We maintain a Neutral-to-Bullish outlook on Bitcoin Cash (BCH). While macro volatility is a persistent risk, the convergence of a clear technical breakout with a major fundamental expansion via CashTokens suggests a potential re-rating of the asset. The network is successfully pivoting to prove it can be both a high-speed payment tool and a scalable host for on-chain finance.
$BCH successfully tested key support at approximately $275 and has since initiated a powerful, high-volume move, shattering long-standing resistance.
Target Zones: Market structure now points to a fresh trading range, with analysts projecting initial upside targets between $400 and $700 before year-end, contingent on the rally’s sustainability.
2. Network Utility: Beyond Payments
CashTokens Integration: The 2026 upgrade for CashTokens has matured, enabling developers to build sophisticated decentralized applications (dApps) and issue native tokens on the BCH blockchain.
Smart Contracts: This functional expansion shifts BCH’s narrative from purely a medium of exchange to a scalable layer-one utility network.
3. Adaptive Scaling & Miner Support
Network Stability: The ongoing implementation of the Adaptive Block Limit Algorithm ensures transaction fees remain fractions of a cent, reinforcing its advantage for micro-transactions.
Hash Rate Stability: A recent, sustained increase in miner hash rate confirms strong network security and confidence from large-scale operators.
Strategic Outlook
We maintain a Neutral-to-Bullish outlook on Bitcoin Cash (BCH). While macro volatility is a persistent risk, the convergence of a clear technical breakout with a major fundamental expansion via CashTokens suggests a potential re-rating of the asset. The network is successfully pivoting to prove it can be both a high-speed payment tool and a scalable host for on-chain finance.
Target Zones: Market structure now points to a fresh trading range, with analysts projecting initial upside targets between $400 and $700 before year-end, contingent on the rally’s sustainability.
2. Network Utility: Beyond Payments
CashTokens Integration: The 2026 upgrade for CashTokens has matured, enabling developers to build sophisticated decentralized applications (dApps) and issue native tokens on the BCH blockchain.
Smart Contracts: This functional expansion shifts BCH’s narrative from purely a medium of exchange to a scalable layer-one utility network.
3. Adaptive Scaling & Miner Support
Network Stability: The ongoing implementation of the Adaptive Block Limit Algorithm ensures transaction fees remain fractions of a cent, reinforcing its advantage for micro-transactions.
Hash Rate Stability: A recent, sustained increase in miner hash rate confirms strong network security and confidence from large-scale operators.
Strategic Outlook
We maintain a Neutral-to-Bullish outlook on Bitcoin Cash (BCH). While macro volatility is a persistent risk, the convergence of a clear technical breakout with a major fundamental expansion via CashTokens suggests a potential re-rating of the asset. The network is successfully pivoting to prove it can be both a high-speed payment tool and a scalable host for on-chain finance.
30
·
--
Xem bản dịch
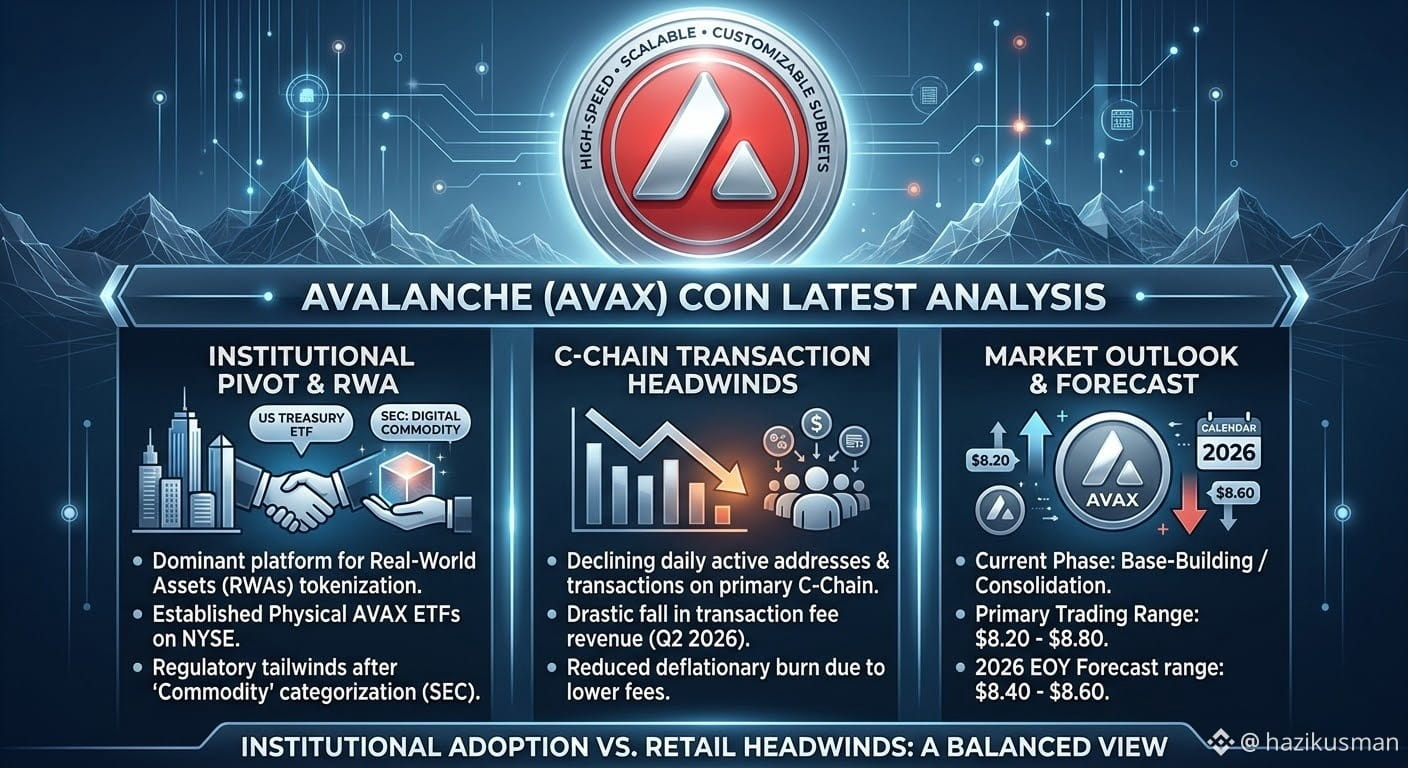
$AVAX now has established physical ETFs listed on major global exchanges, such as the NYSE, further bridging the gap with traditional finance.
Regulatory Clarity: In March 2026, an interpretive release from the SEC categorized AVAX among "digital commodities," providing a significant long-term regulatory tailwind.
.
Network Performance & Usage (The Headwinds): While the institutional story is strong, the primary transaction layer for retail, the C-Chain, has shown weakness.
Declining Metrics: Usage metrics, including average daily active addresses and total transaction count, have declined significantly from early 2026 highs.
Fee Revenue: Reflecting the usage decline, network fee revenue fell drastically in Q2 2026. This is particularly relevant because all AVAX transaction fees are burned, meaning lower revenue translates directly to reduced deflationary pressure.
.
Market Outlook & Trading Range (Technical View): AVAX price action has been characterized by a multi-month period of base-building, trading primarily in the $8.20 - $8.80 range.
Technical Breakdown: The token remains significantly below its 2021 all-time high, underperforming larger ecosystems.
Forecast: Analysts generally project 2026 to end as a "basing" year, rather than the start of a new fresh trend. Forecasts for the end of the year center on a range of $8.40 - $8.60.
.
Strategic Outlook
The Avalanche investment thesis now depends entirely on whether the growing institutional flows, subnets, and tokenized asset base can create sufficient, sustainable demand to offset the scheduled token unlocks and the current weakness in the retail-facing ecosystem. The infrastructure is solid and legally recognized; the network must now prove its utility outside of asset custody.
$AVAX now has established physical ETFs listed on major global exchanges, such as the NYSE, further bridging the gap with traditional finance.
Regulatory Clarity: In March 2026, an interpretive release from the SEC categorized AVAX among "digital commodities," providing a significant long-term regulatory tailwind.
.
Network Performance & Usage (The Headwinds): While the institutional story is strong, the primary transaction layer for retail, the C-Chain, has shown weakness.
Declining Metrics: Usage metrics, including average daily active addresses and total transaction count, have declined significantly from early 2026 highs.
Fee Revenue: Reflecting the usage decline, network fee revenue fell drastically in Q2 2026. This is particularly relevant because all AVAX transaction fees are burned, meaning lower revenue translates directly to reduced deflationary pressure.
.
Market Outlook & Trading Range (Technical View): AVAX price action has been characterized by a multi-month period of base-building, trading primarily in the $8.20 - $8.80 range.
Technical Breakdown: The token remains significantly below its 2021 all-time high, underperforming larger ecosystems.
Forecast: Analysts generally project 2026 to end as a "basing" year, rather than the start of a new fresh trend. Forecasts for the end of the year center on a range of $8.40 - $8.60.
.
Strategic Outlook
The Avalanche investment thesis now depends entirely on whether the growing institutional flows, subnets, and tokenized asset base can create sufficient, sustainable demand to offset the scheduled token unlocks and the current weakness in the retail-facing ecosystem. The infrastructure is solid and legally recognized; the network must now prove its utility outside of asset custody.
Regulatory Clarity: In March 2026, an interpretive release from the SEC categorized AVAX among "digital commodities," providing a significant long-term regulatory tailwind.
.
Network Performance & Usage (The Headwinds): While the institutional story is strong, the primary transaction layer for retail, the C-Chain, has shown weakness.
Declining Metrics: Usage metrics, including average daily active addresses and total transaction count, have declined significantly from early 2026 highs.
Fee Revenue: Reflecting the usage decline, network fee revenue fell drastically in Q2 2026. This is particularly relevant because all AVAX transaction fees are burned, meaning lower revenue translates directly to reduced deflationary pressure.
.
Market Outlook & Trading Range (Technical View): AVAX price action has been characterized by a multi-month period of base-building, trading primarily in the $8.20 - $8.80 range.
Technical Breakdown: The token remains significantly below its 2021 all-time high, underperforming larger ecosystems.
Forecast: Analysts generally project 2026 to end as a "basing" year, rather than the start of a new fresh trend. Forecasts for the end of the year center on a range of $8.40 - $8.60.
.
Strategic Outlook
The Avalanche investment thesis now depends entirely on whether the growing institutional flows, subnets, and tokenized asset base can create sufficient, sustainable demand to offset the scheduled token unlocks and the current weakness in the retail-facing ecosystem. The infrastructure is solid and legally recognized; the network must now prove its utility outside of asset custody.
41
·
--
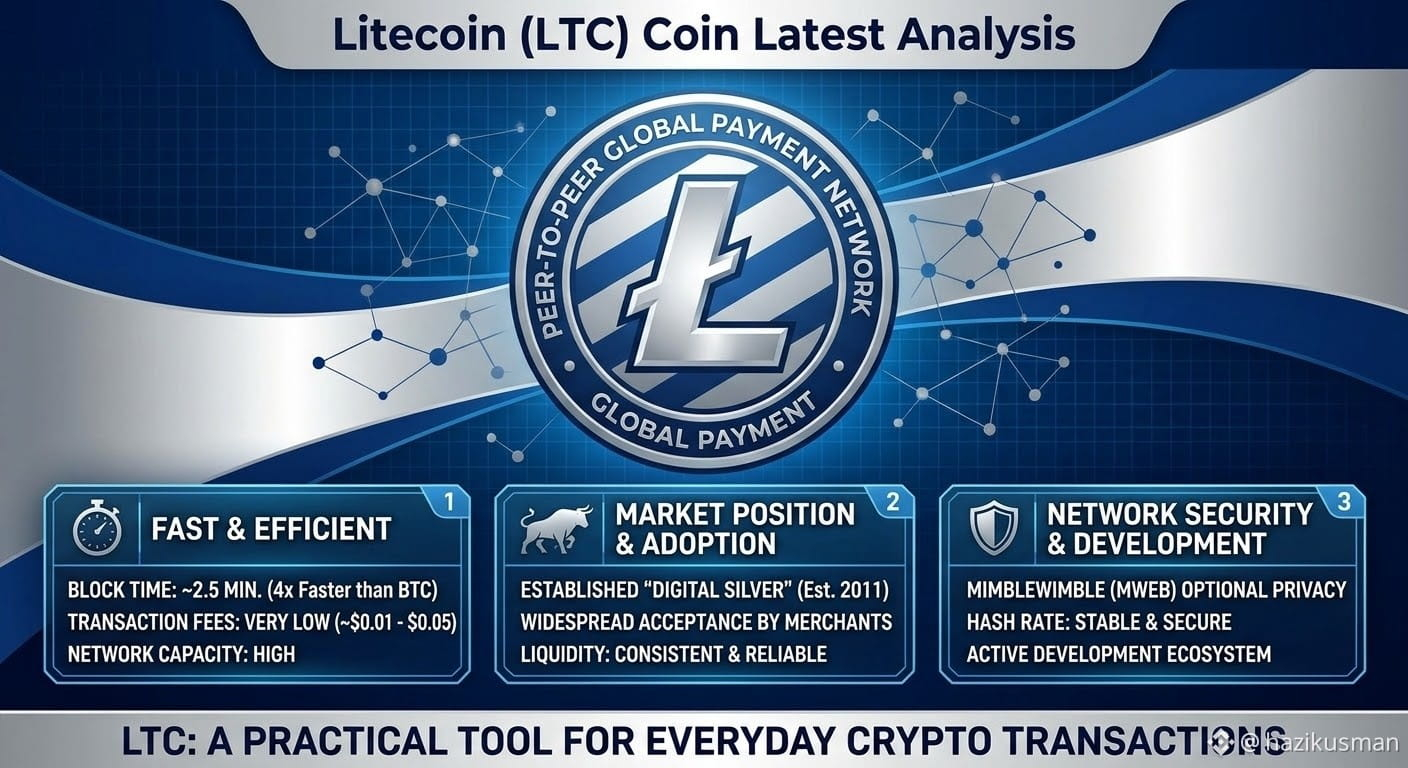
$LTC thế mạnh cốt lõi của LTC là tính hữu dụng. Với thời gian tạo khối khoảng 2,5 phút (nhanh gấp bốn lần Bitcoin) và phí giao dịch luôn gần bằng không (thường chỉ bằng một phần của một xu), LTC là lựa chọn hàng đầu cho các giao dịch hằng ngày thiết thực và chuyển tiền giữa các sàn.
Độ trưởng thành và ổn định của mạng lưới: Ra mắt năm 2011, Litecoin là một tài sản trưởng thành chưa từng ngừng hoạt động. Thành tích đáng tin cậy được duy trì trong thời gian dài khiến Litecoin trở thành lựa chọn chủ chốt của các đơn vị lưu ký tổ chức và được tích hợp rộng rãi với các bộ xử lý thanh toán. Nguồn cung tối đa 84 triệu coin tạo nên mô hình lạm phát có thể dự đoán.
Quyền riêng tư tùy chọn thông qua MWEB: Việc tích hợp MimbleWimble Extension Block (MWEB) mang đến cho Litecoin các tính năng bảo mật tùy chọn, cho phép người dùng che giấu số tiền giao dịch. Sự kết hợp độc đáo giữa tính minh bạch về mặt pháp lý và quyền bảo mật thông tin tùy chọn của người dùng làm tăng sức hấp dẫn của Litecoin với tư cách là một phương tiện trao đổi thực thụ.
Triển vọng mạng lưới
Dù LTC không phải lúc nào cũng dẫn đầu trong các chu kỳ đầu cơ và thổi phồng, tính hữu dụng của nó là không thể phủ nhận. Việc tập trung trở thành một “cỗ máy giao dịch tinh gọn và hiệu quả” đảm bảo rằng khi mức độ chấp nhận tiền mã hóa trong thương mại đời thực tăng lên, Litecoin sẽ có vị thế độc đáo để nắm bắt khối lượng giao dịch đó. Litecoin vẫn là một tài sản nền tảng trong bức tranh đa dạng của thị trường tiền mã hóa.
$LTC thế mạnh cốt lõi của LTC là tính hữu dụng. Với thời gian tạo khối khoảng 2,5 phút (nhanh gấp bốn lần Bitcoin) và phí giao dịch luôn gần bằng không (thường chỉ bằng một phần của một xu), LTC là lựa chọn hàng đầu cho các giao dịch hằng ngày thiết thực và chuyển tiền giữa các sàn.
Độ trưởng thành và ổn định của mạng lưới: Ra mắt năm 2011, Litecoin là một tài sản trưởng thành chưa từng ngừng hoạt động. Thành tích đáng tin cậy được duy trì trong thời gian dài khiến Litecoin trở thành lựa chọn chủ chốt của các đơn vị lưu ký tổ chức và được tích hợp rộng rãi với các bộ xử lý thanh toán. Nguồn cung tối đa 84 triệu coin tạo nên mô hình lạm phát có thể dự đoán.
Quyền riêng tư tùy chọn thông qua MWEB: Việc tích hợp MimbleWimble Extension Block (MWEB) mang đến cho Litecoin các tính năng bảo mật tùy chọn, cho phép người dùng che giấu số tiền giao dịch. Sự kết hợp độc đáo giữa tính minh bạch về mặt pháp lý và quyền bảo mật thông tin tùy chọn của người dùng làm tăng sức hấp dẫn của Litecoin với tư cách là một phương tiện trao đổi thực thụ.
Triển vọng mạng lưới
Dù LTC không phải lúc nào cũng dẫn đầu trong các chu kỳ đầu cơ và thổi phồng, tính hữu dụng của nó là không thể phủ nhận. Việc tập trung trở thành một “cỗ máy giao dịch tinh gọn và hiệu quả” đảm bảo rằng khi mức độ chấp nhận tiền mã hóa trong thương mại đời thực tăng lên, Litecoin sẽ có vị thế độc đáo để nắm bắt khối lượng giao dịch đó. Litecoin vẫn là một tài sản nền tảng trong bức tranh đa dạng của thị trường tiền mã hóa.
Độ trưởng thành và ổn định của mạng lưới: Ra mắt năm 2011, Litecoin là một tài sản trưởng thành chưa từng ngừng hoạt động. Thành tích đáng tin cậy được duy trì trong thời gian dài khiến Litecoin trở thành lựa chọn chủ chốt của các đơn vị lưu ký tổ chức và được tích hợp rộng rãi với các bộ xử lý thanh toán. Nguồn cung tối đa 84 triệu coin tạo nên mô hình lạm phát có thể dự đoán.
Quyền riêng tư tùy chọn thông qua MWEB: Việc tích hợp MimbleWimble Extension Block (MWEB) mang đến cho Litecoin các tính năng bảo mật tùy chọn, cho phép người dùng che giấu số tiền giao dịch. Sự kết hợp độc đáo giữa tính minh bạch về mặt pháp lý và quyền bảo mật thông tin tùy chọn của người dùng làm tăng sức hấp dẫn của Litecoin với tư cách là một phương tiện trao đổi thực thụ.
Triển vọng mạng lưới
Dù LTC không phải lúc nào cũng dẫn đầu trong các chu kỳ đầu cơ và thổi phồng, tính hữu dụng của nó là không thể phủ nhận. Việc tập trung trở thành một “cỗ máy giao dịch tinh gọn và hiệu quả” đảm bảo rằng khi mức độ chấp nhận tiền mã hóa trong thương mại đời thực tăng lên, Litecoin sẽ có vị thế độc đáo để nắm bắt khối lượng giao dịch đó. Litecoin vẫn là một tài sản nền tảng trong bức tranh đa dạng của thị trường tiền mã hóa.
56
Đăng nhập để khám phá thêm nội dung
Tham gia cùng người dùng tiền mã hóa toàn cầu trên Binance Square
⚡️ Nhận thông tin mới nhất và hữu ích về tiền mã hóa.
💬 Được tin cậy bởi sàn giao dịch tiền mã hóa lớn nhất thế giới.
👍 Khám phá những thông tin chuyên sâu thực tế từ những nhà sáng tạo đã xác minh.
Email / Số điện thoại