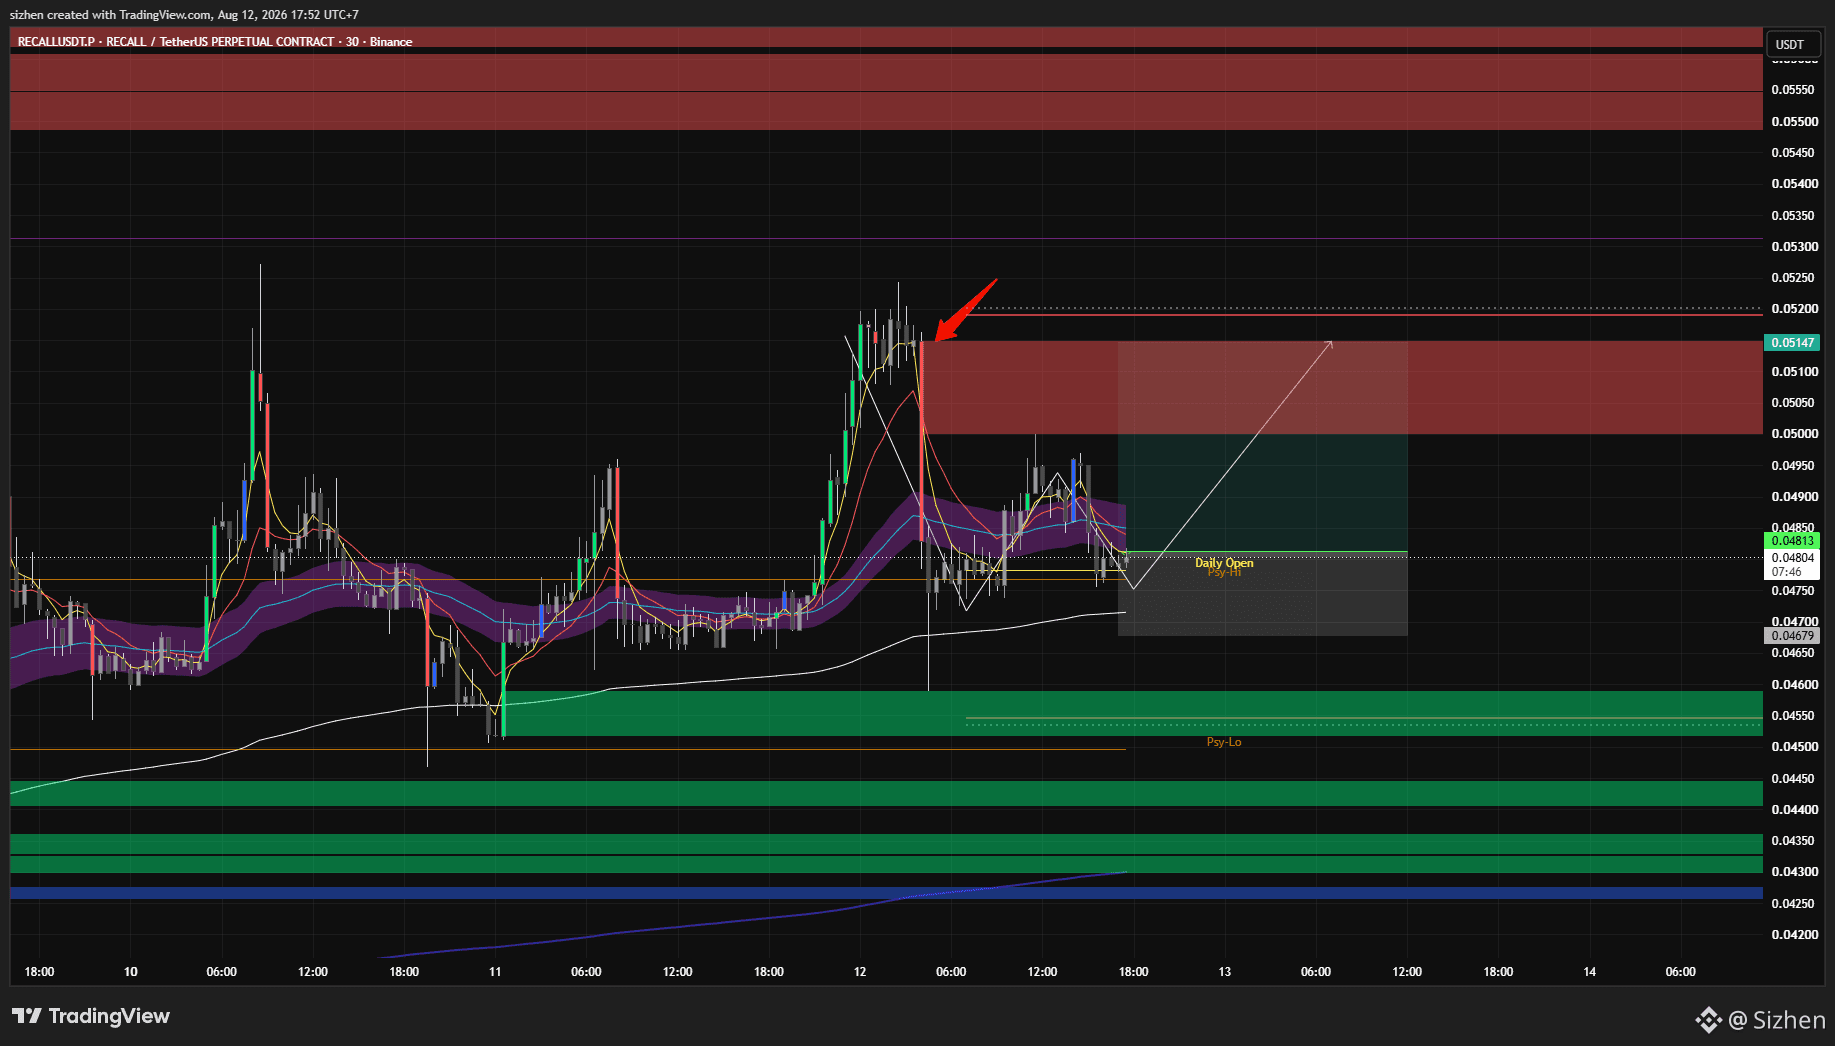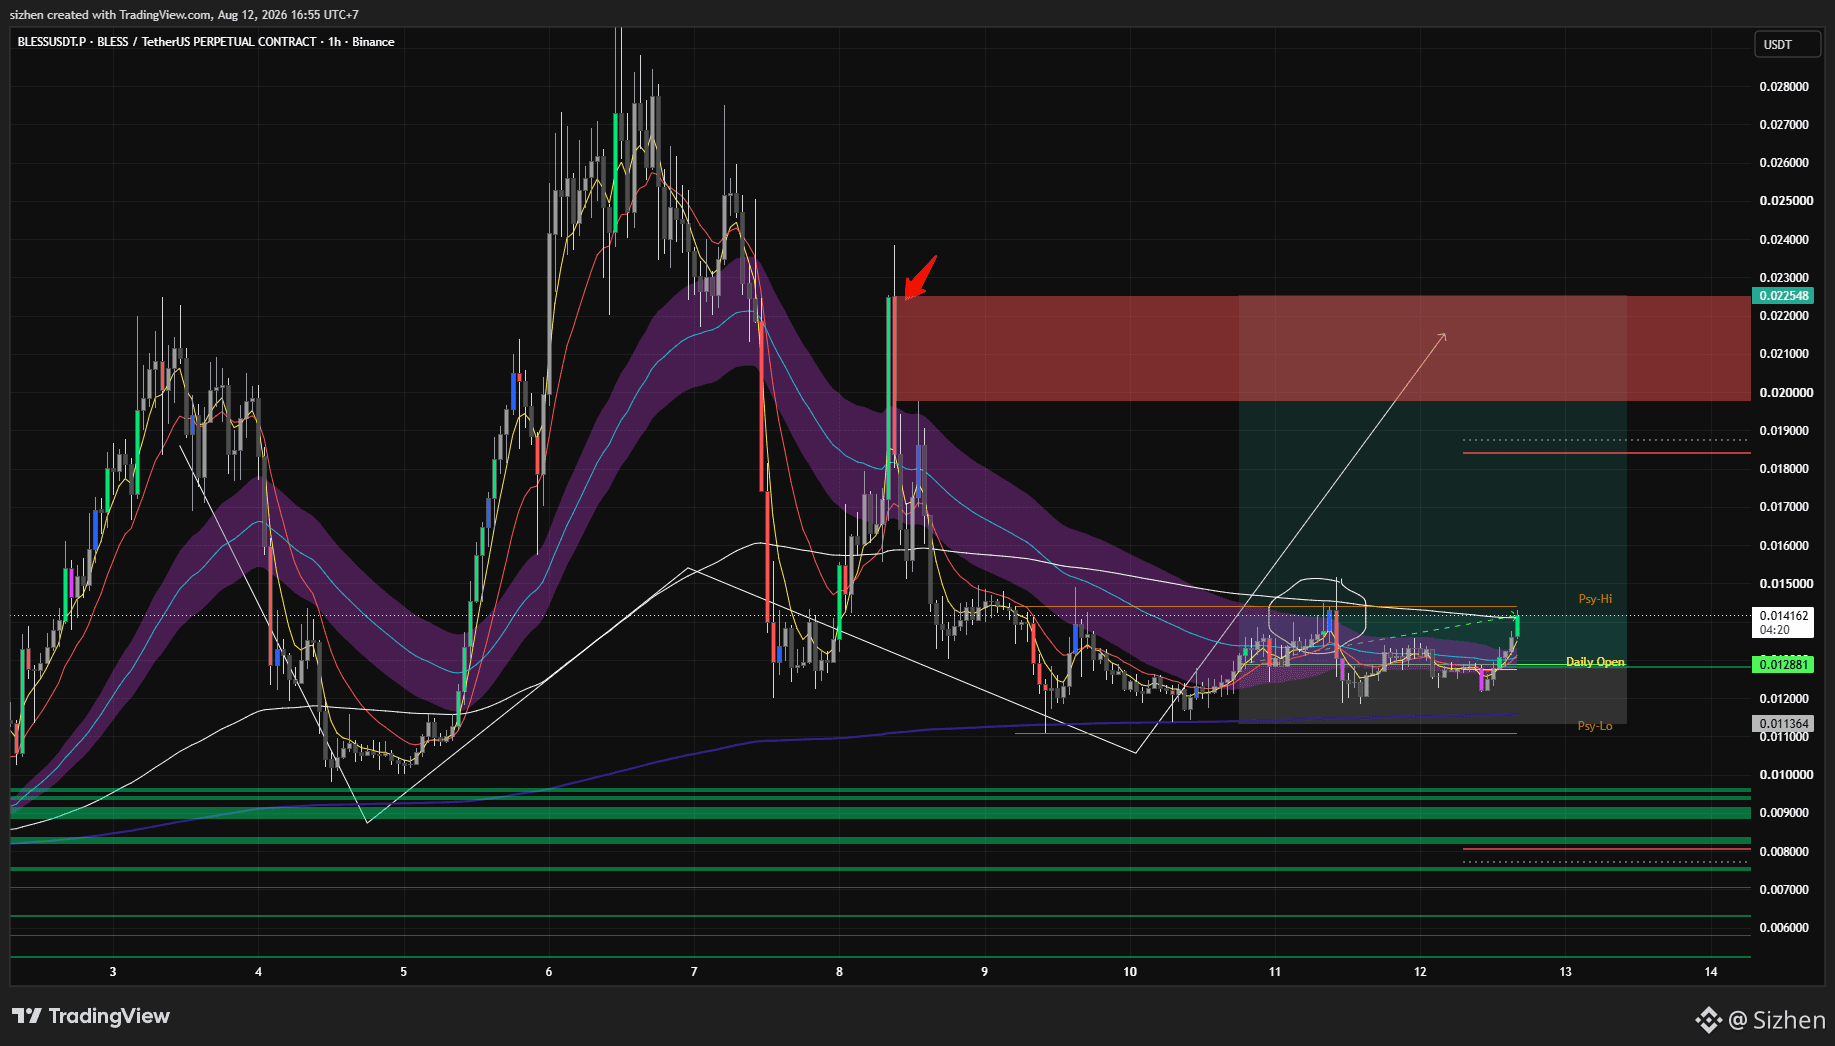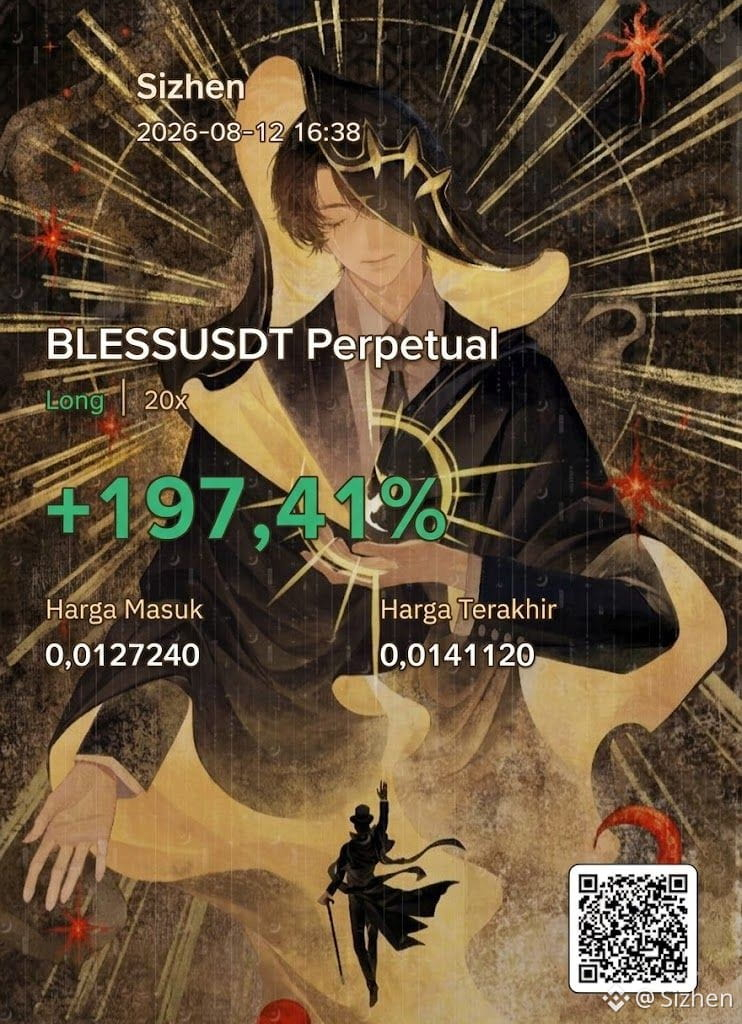
After I closed my long position on $RECALL , the price continued to rise by 8% and almost reached the full take-profit level. Congratulations to those who made a profit from this analysis
Sizhen
·
--
$RECALL is almost at its target on the violet vector; from here, I’ll be closing the position. If anyone is still holding it, simply move the stop-loss to the entry point
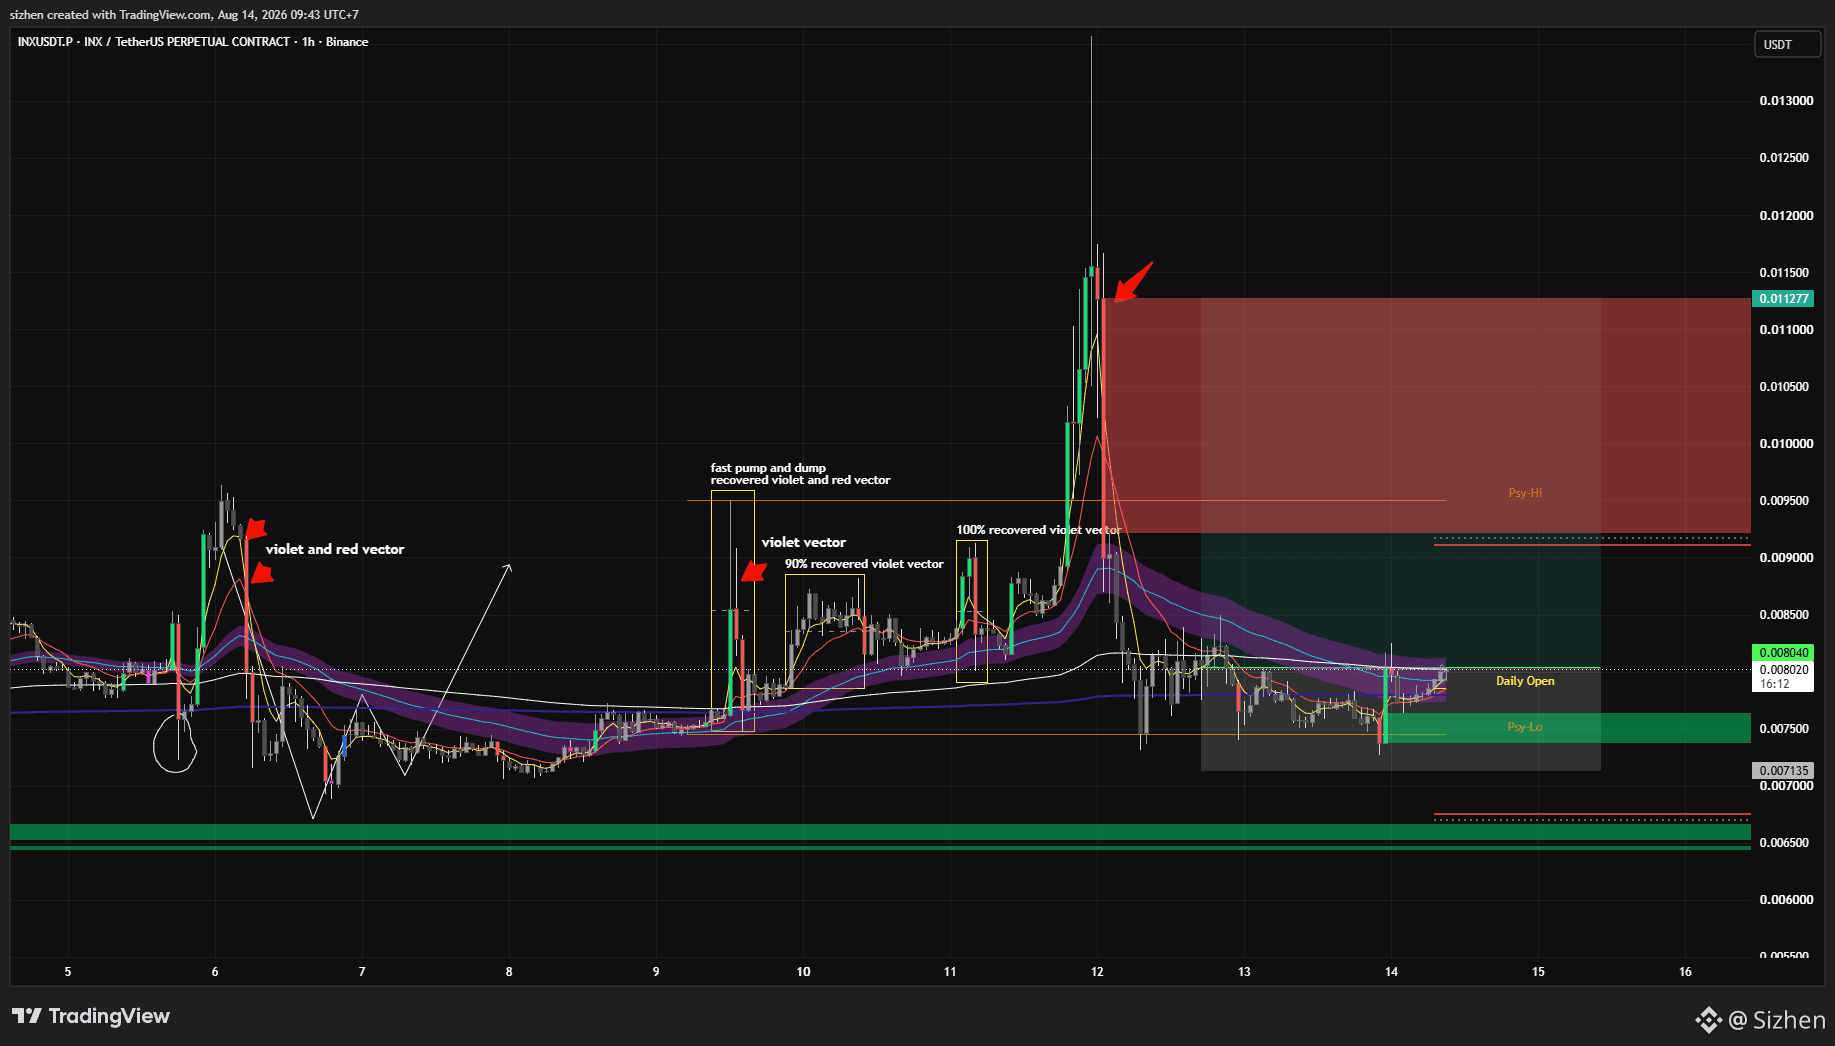
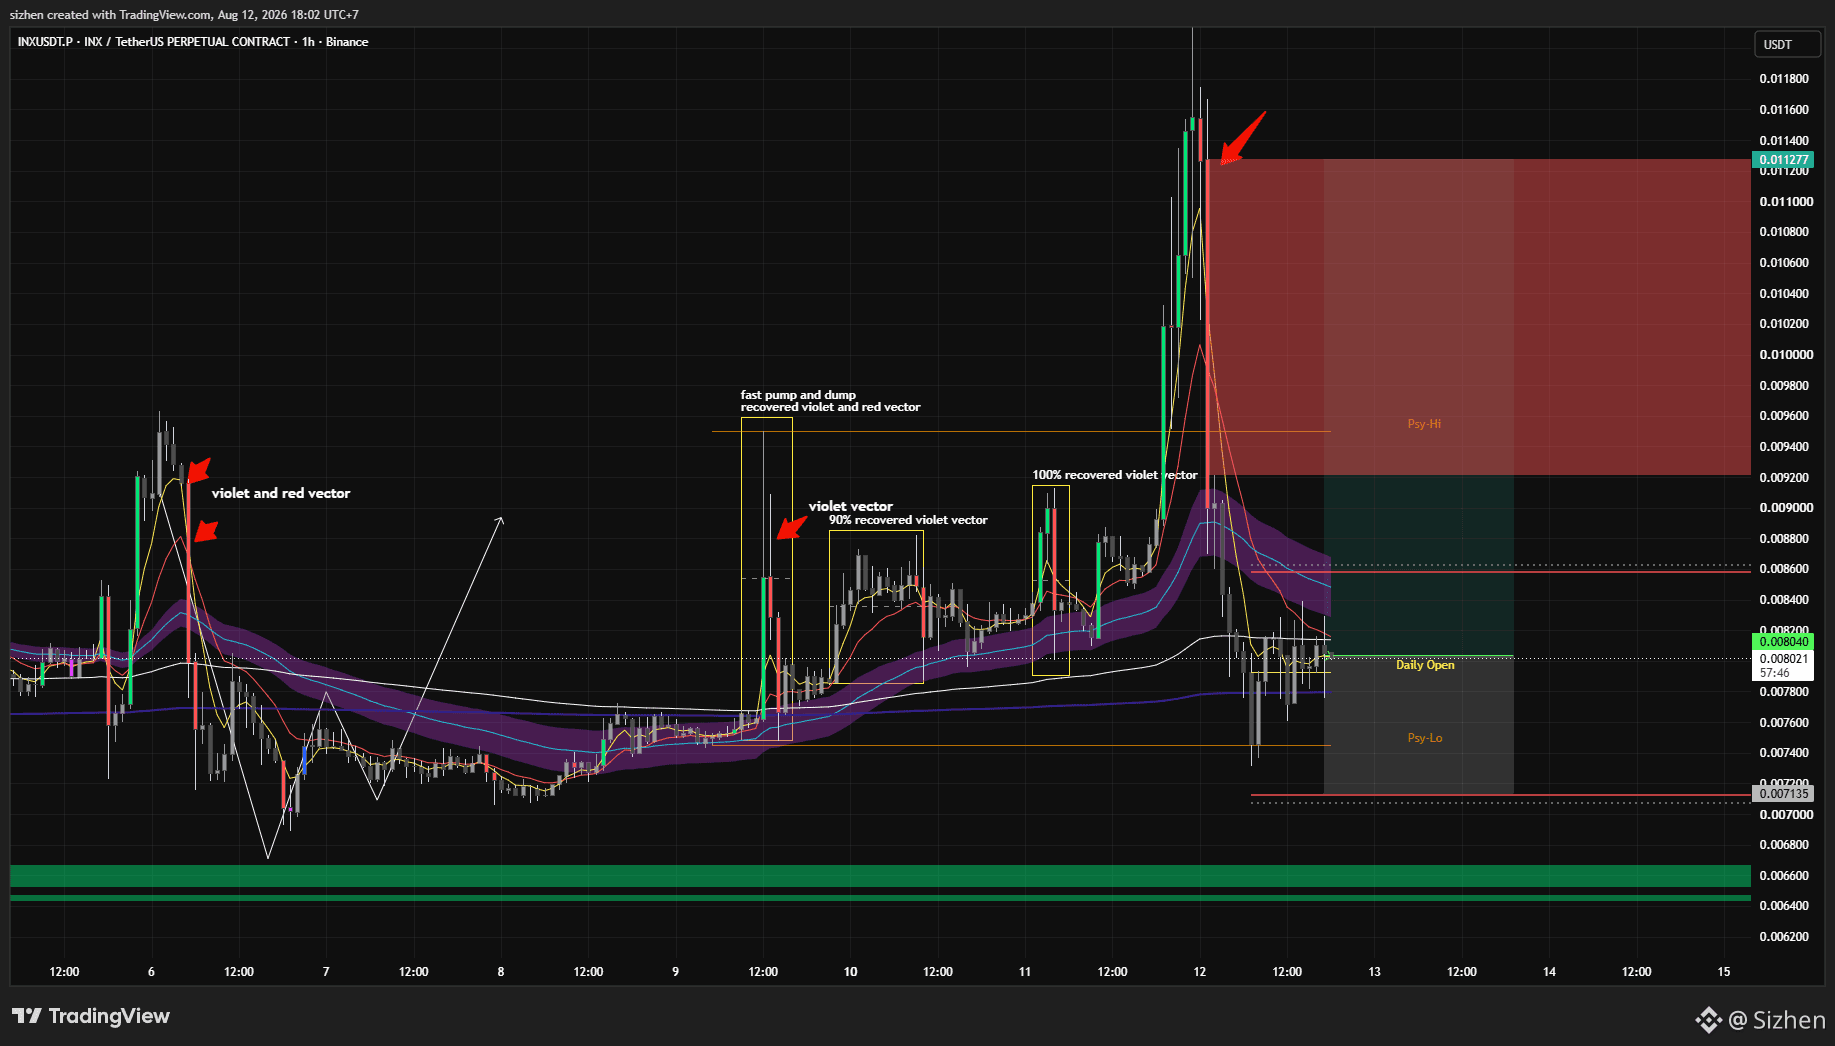
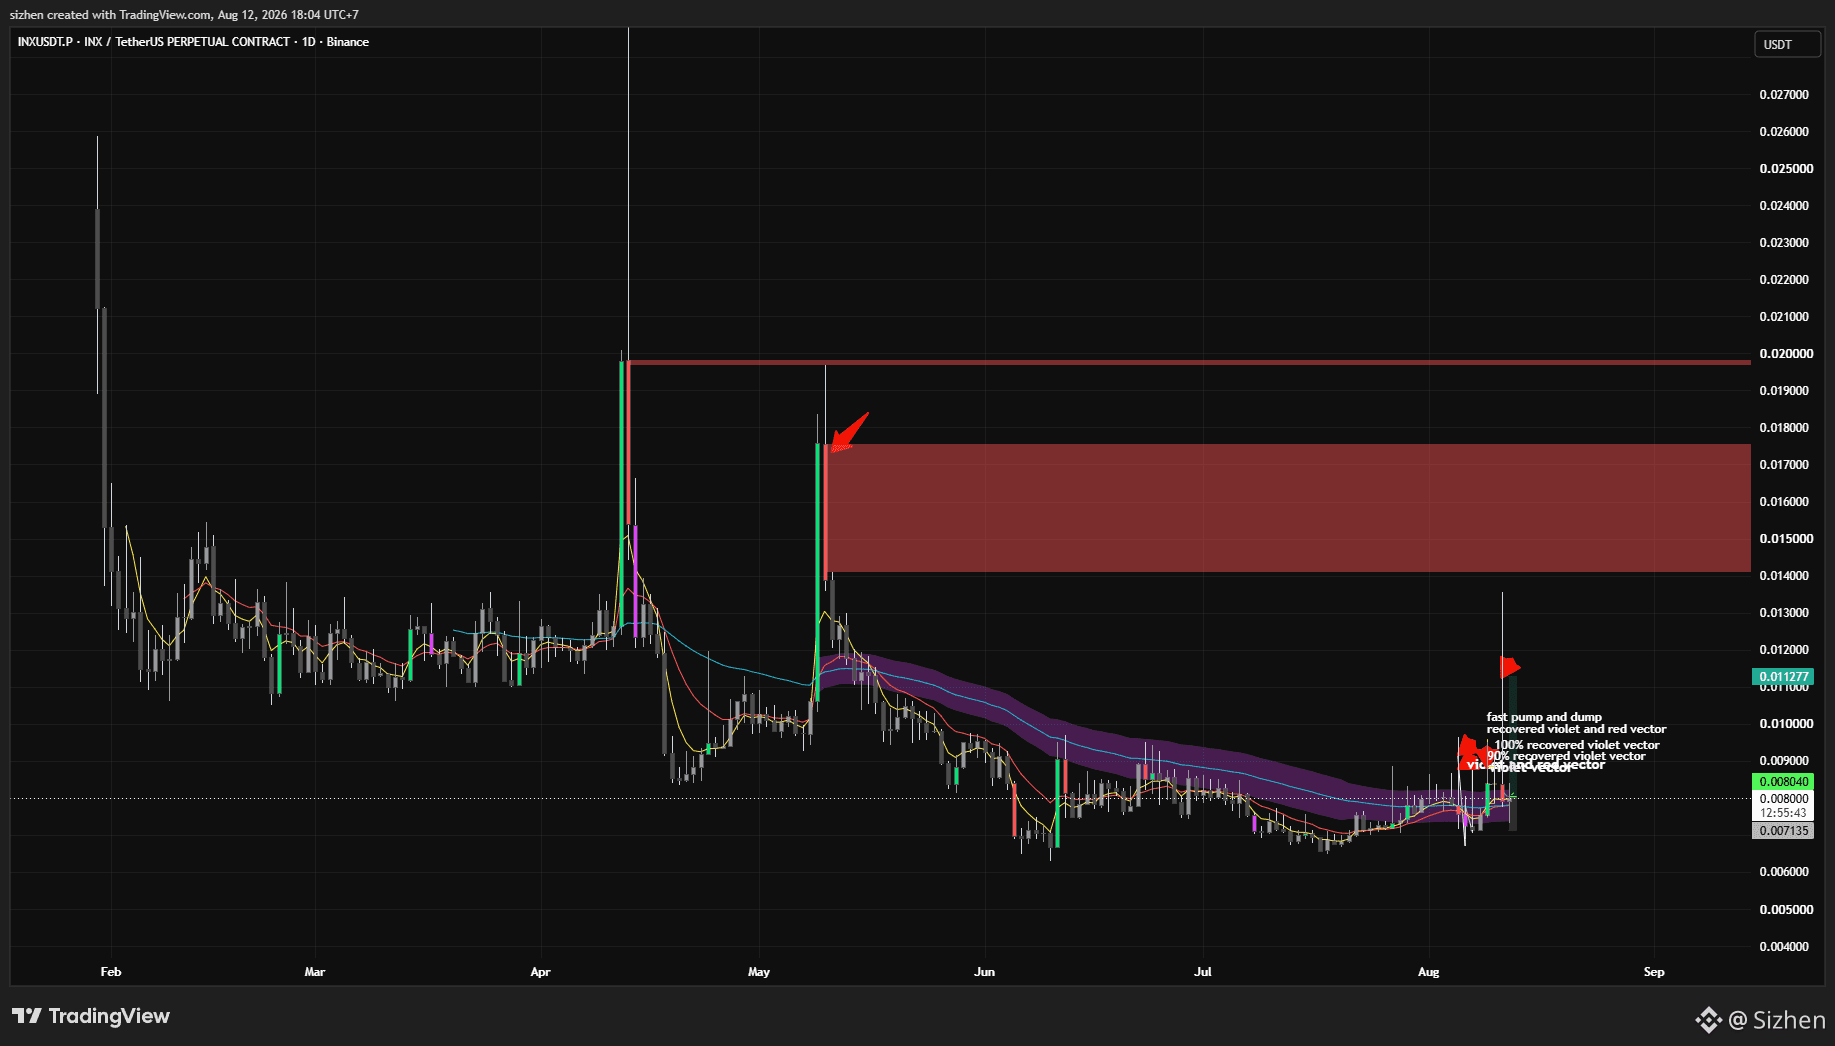
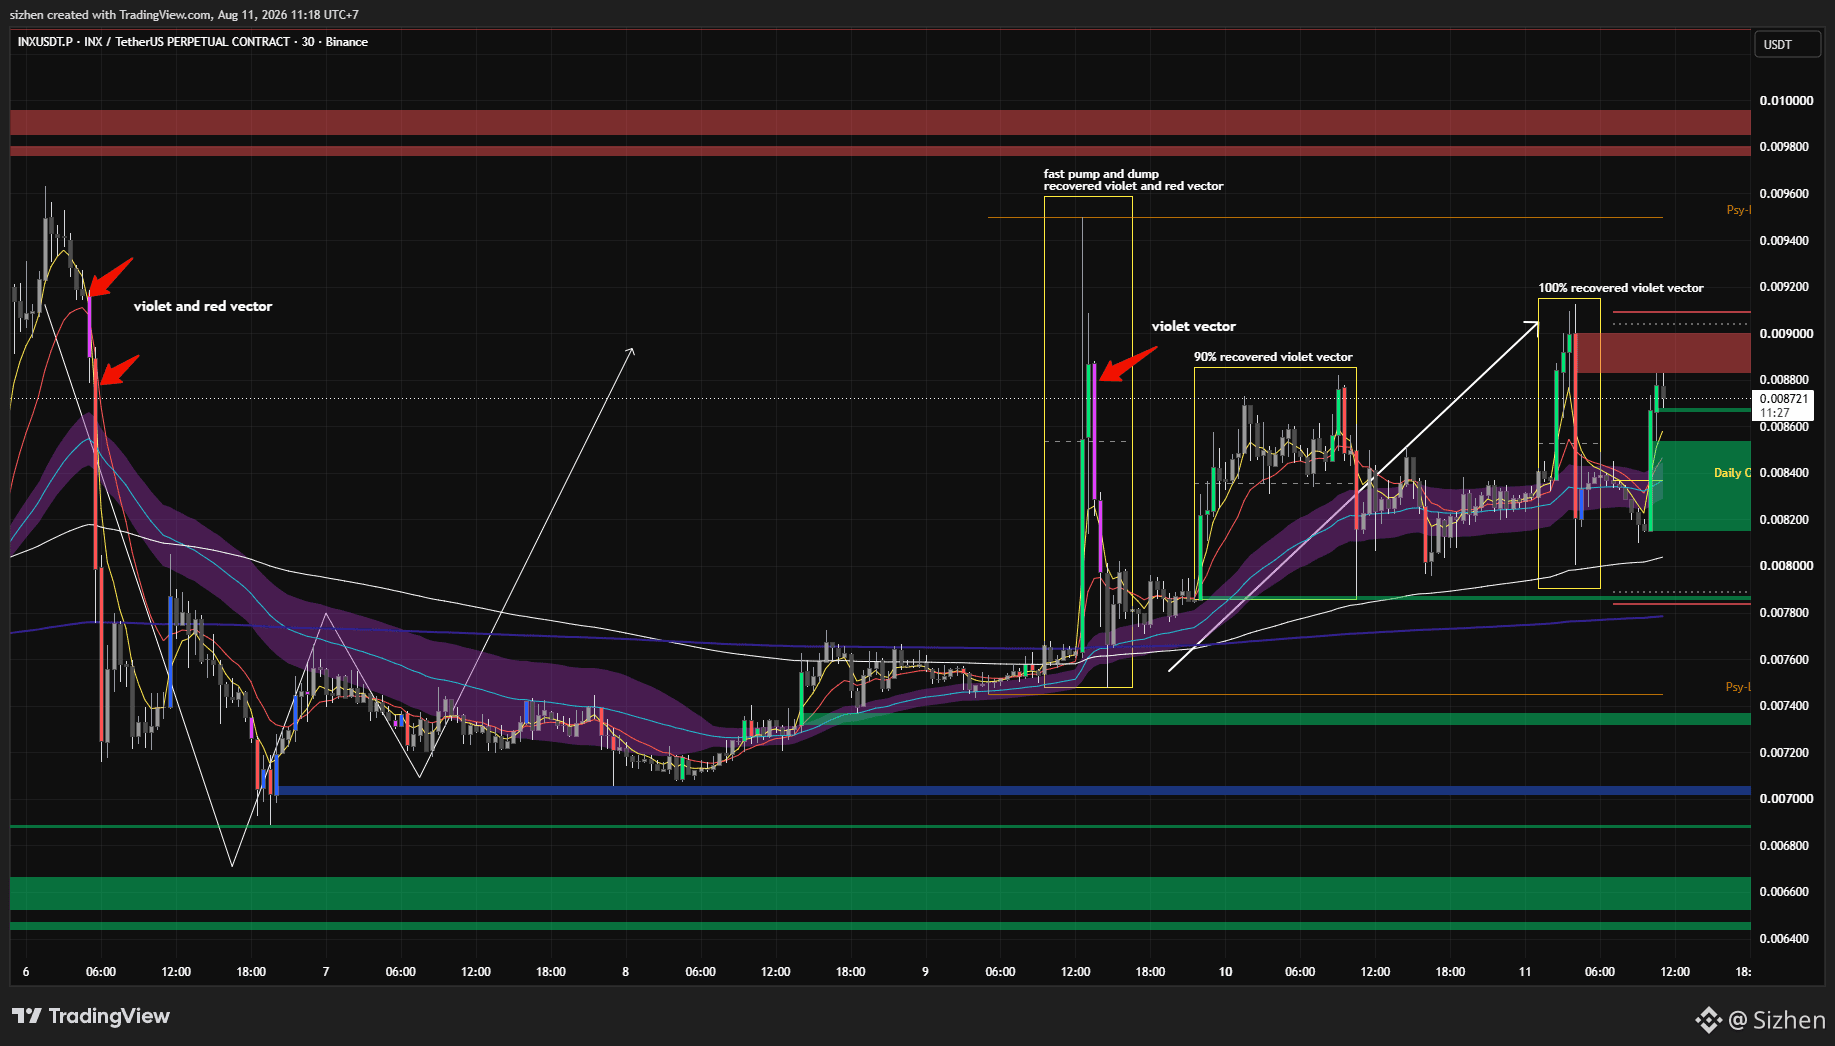
$INX TP is full and has recovered all the vectors listed above, Congratulations for those who have been following
Sizhen
·
--
Tăng giá
I had closed my position on the $INX due to a rejection at the EMA, and it has now fully broken through the 50 EMA this breakout was signalled by a green vector candle, which provides sufficient confidence to reopen a long position on the $INX
$RECALL is almost at its target on the violet vector; from here, I’ll be closing the position. If anyone is still holding it, simply move the stop-loss to the entry point
Sizhen
·
--
Tăng giá
$RECALL đã có mặt trong giao dịch và đang tiến gần đến khu vực nến vector màu tím. Khi nến vector màu tím được chạm tới, bạn có thể dời stop
loss về điểm vào hoặc về 50% lợi nhuận ROI của bạn
$RECALL đã có mặt trong giao dịch và đang tiến gần đến khu vực nến vector màu tím. Khi nến vector màu tím được chạm tới, bạn có thể dời stop loss về điểm vào hoặc về 50% lợi nhuận ROI của bạn
Sizhen
·
--
Tăng giá
$RECALL khá thú vị; nếu giá giữ được trên đường EMA 50 (đường màu tím), có khả năng nó sẽ tăng lên mức giá mở cửa trong ngày hoặc cao hơn
Trên khung thời gian 4 giờ mà tôi đã chia sẻ, có một vùng/động lượng có thể đóng vai trò là mục tiêu tăng giá của chúng ta, hãy giả sử giá sẽ tăng lên khu vực đó
Đối với mức vào lệnh, cắt lỗ và chốt lời, vui lòng xem biểu đồ tôi đã chia sẻ
$RECALL khá thú vị; nếu giá giữ được trên đường EMA 50 (đường màu tím), có khả năng nó sẽ tăng lên mức giá mở cửa trong ngày hoặc cao hơn
Trên khung thời gian 4 giờ mà tôi đã chia sẻ, có một vùng/động lượng có thể đóng vai trò là mục tiêu tăng giá của chúng ta, hãy giả sử giá sẽ tăng lên khu vực đó
Đối với mức vào lệnh, cắt lỗ và chốt lời, vui lòng xem biểu đồ tôi đã chia sẻ
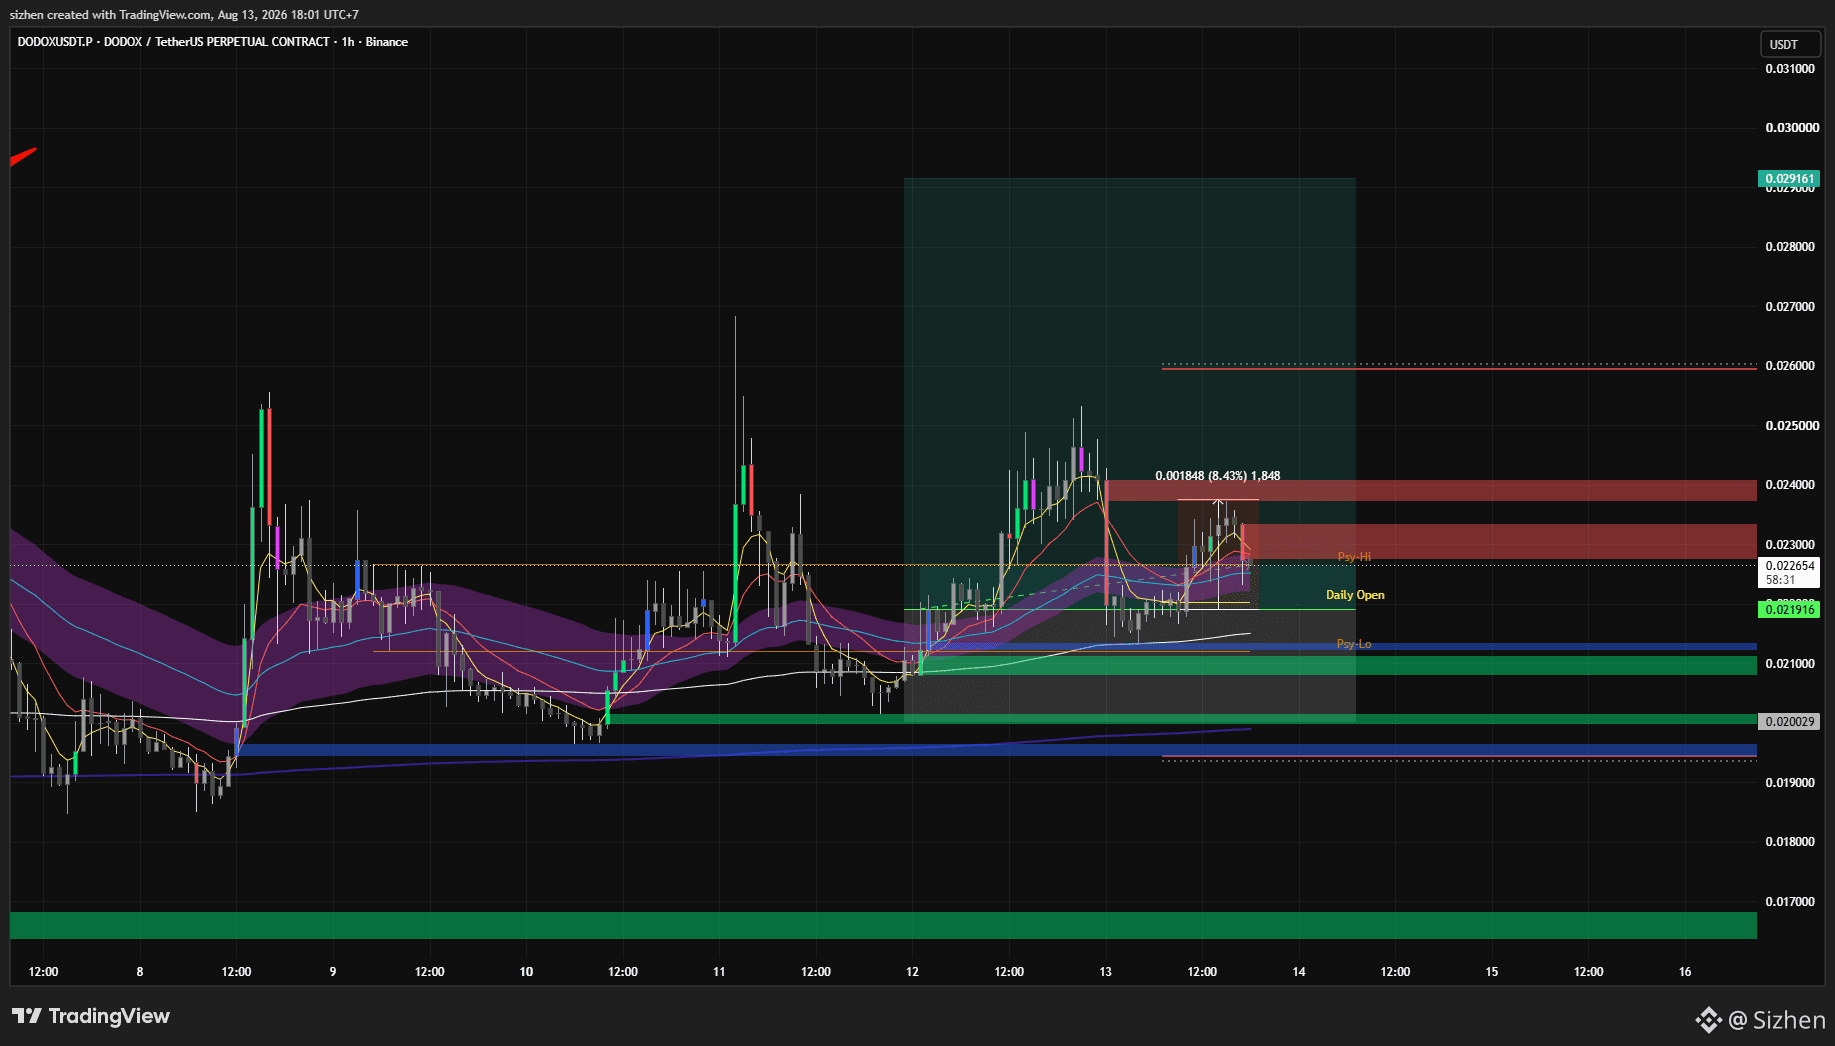
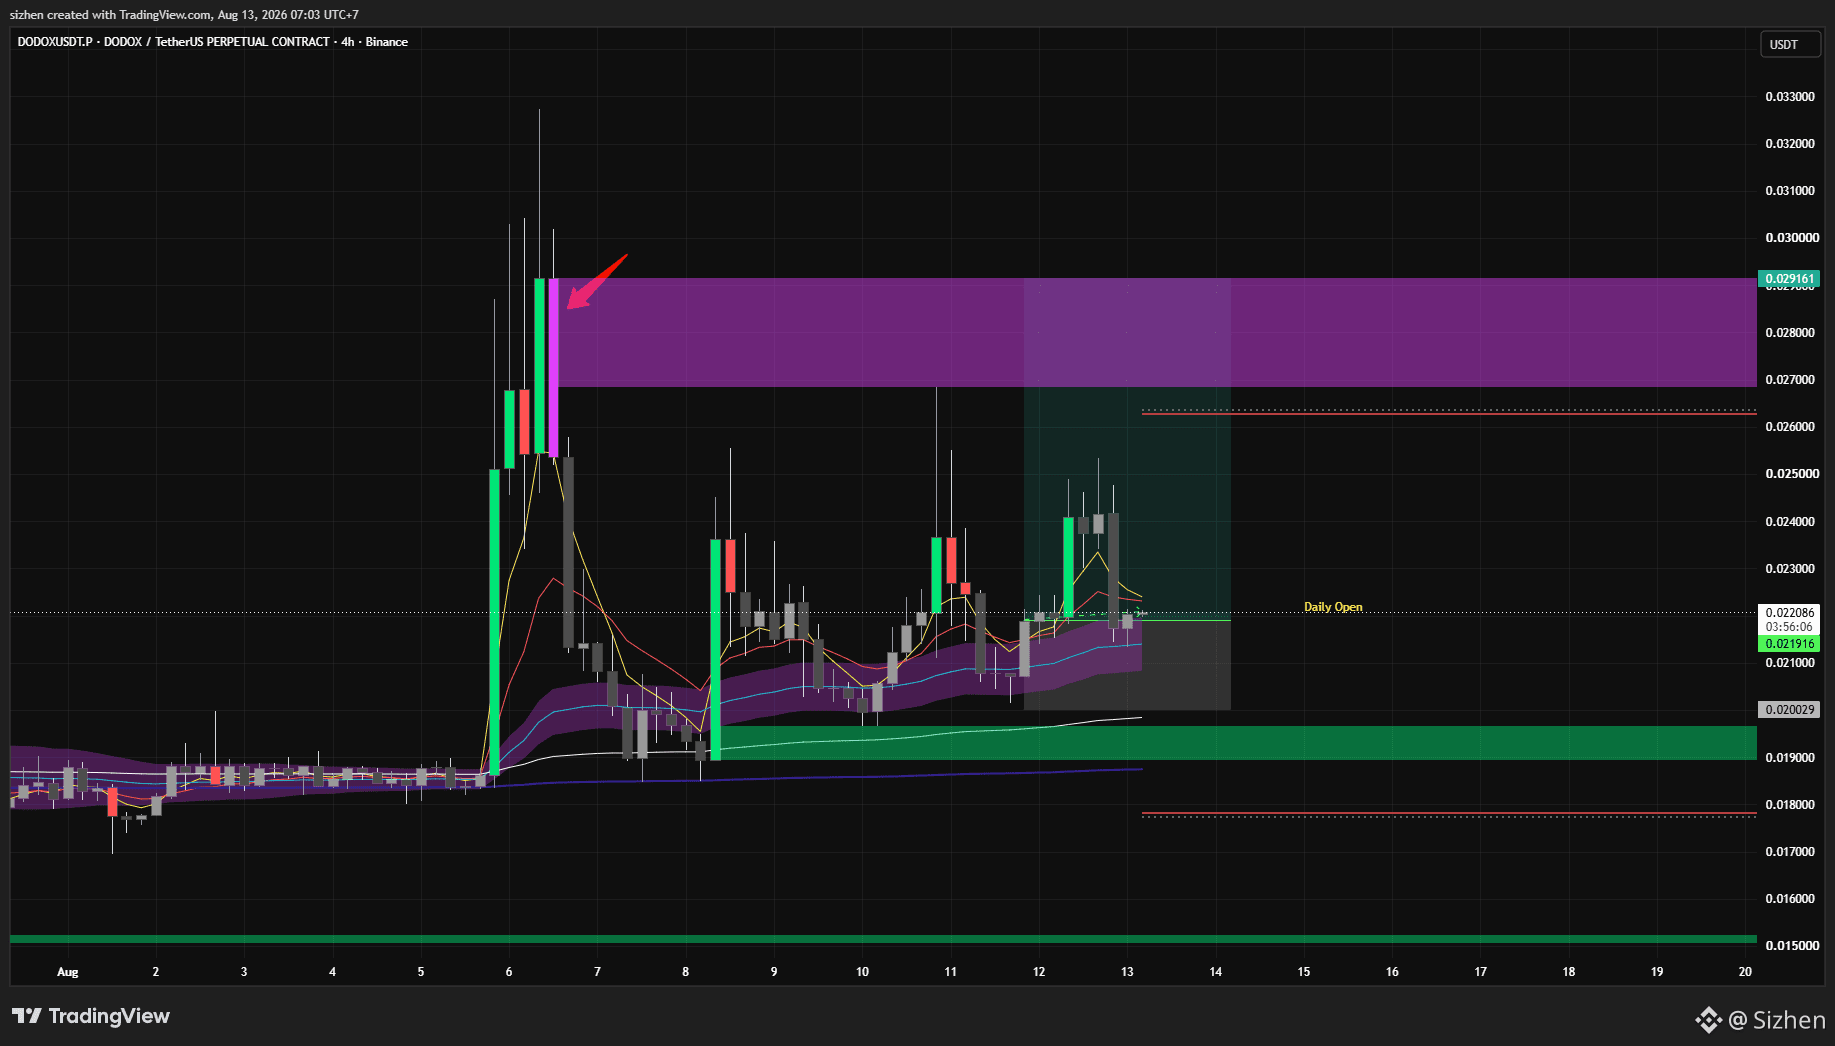
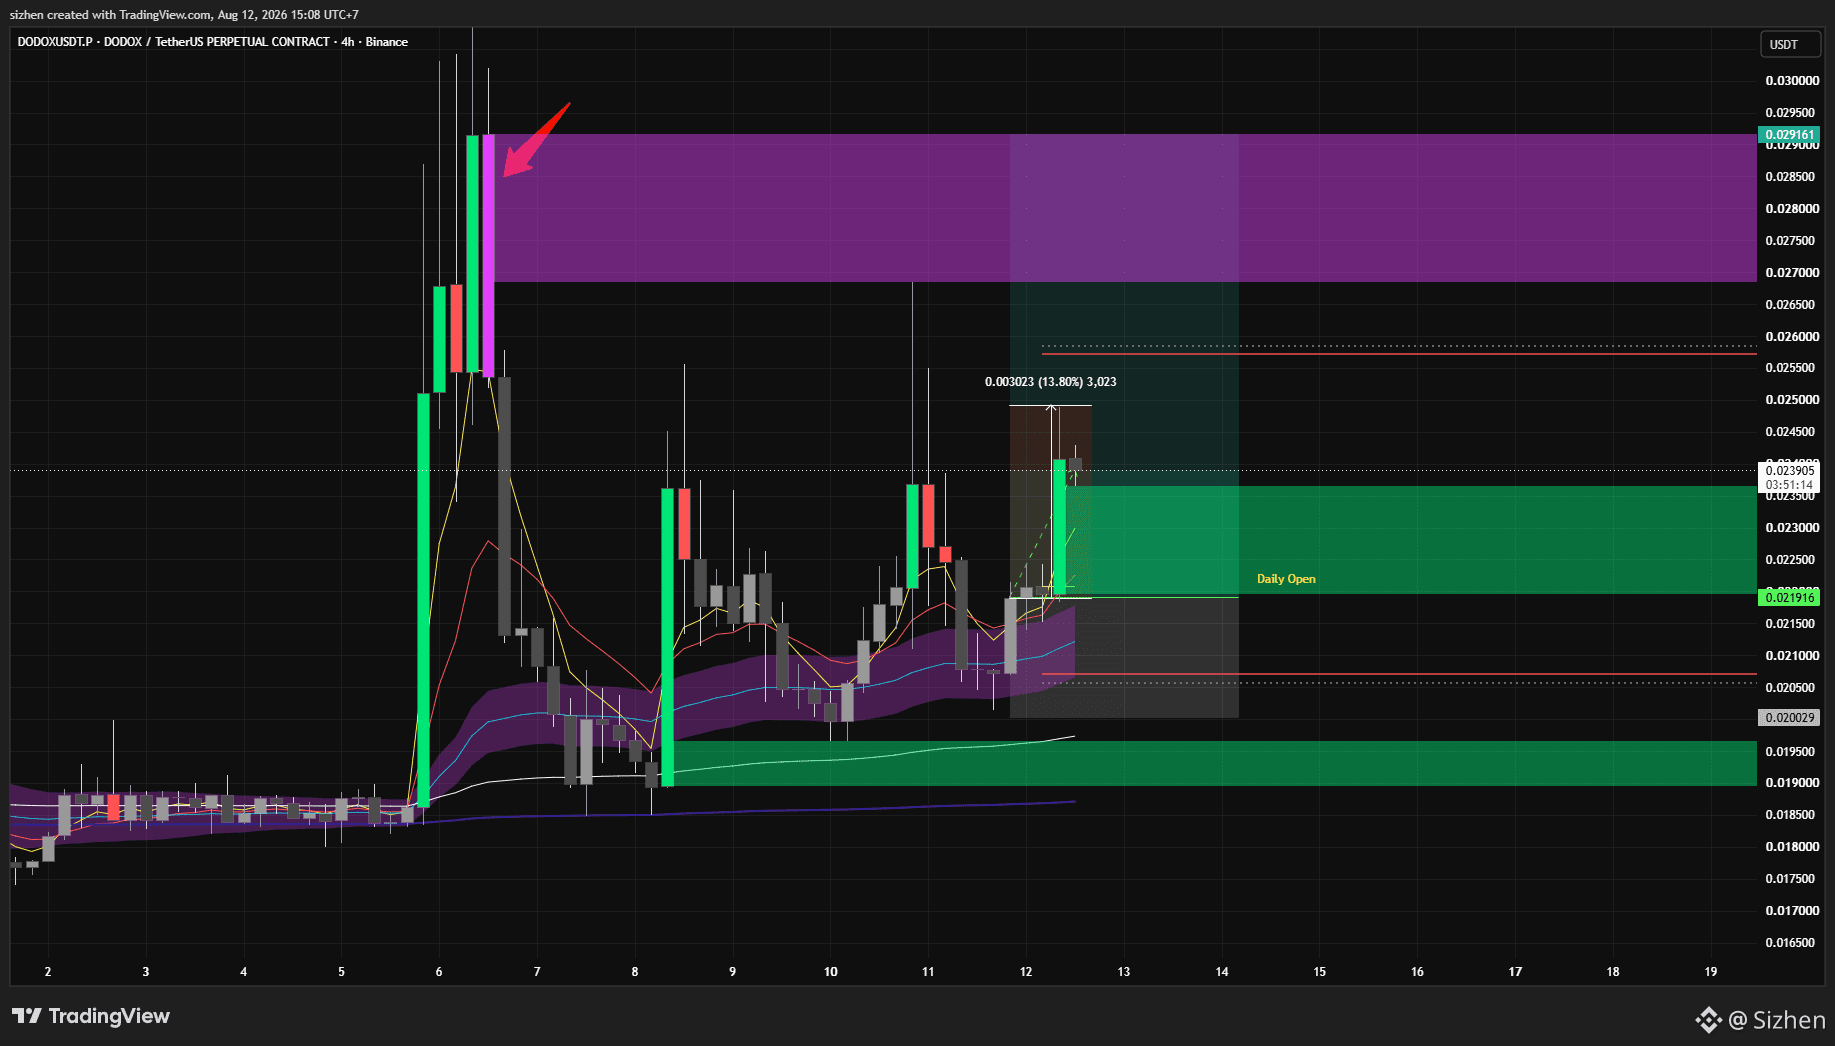
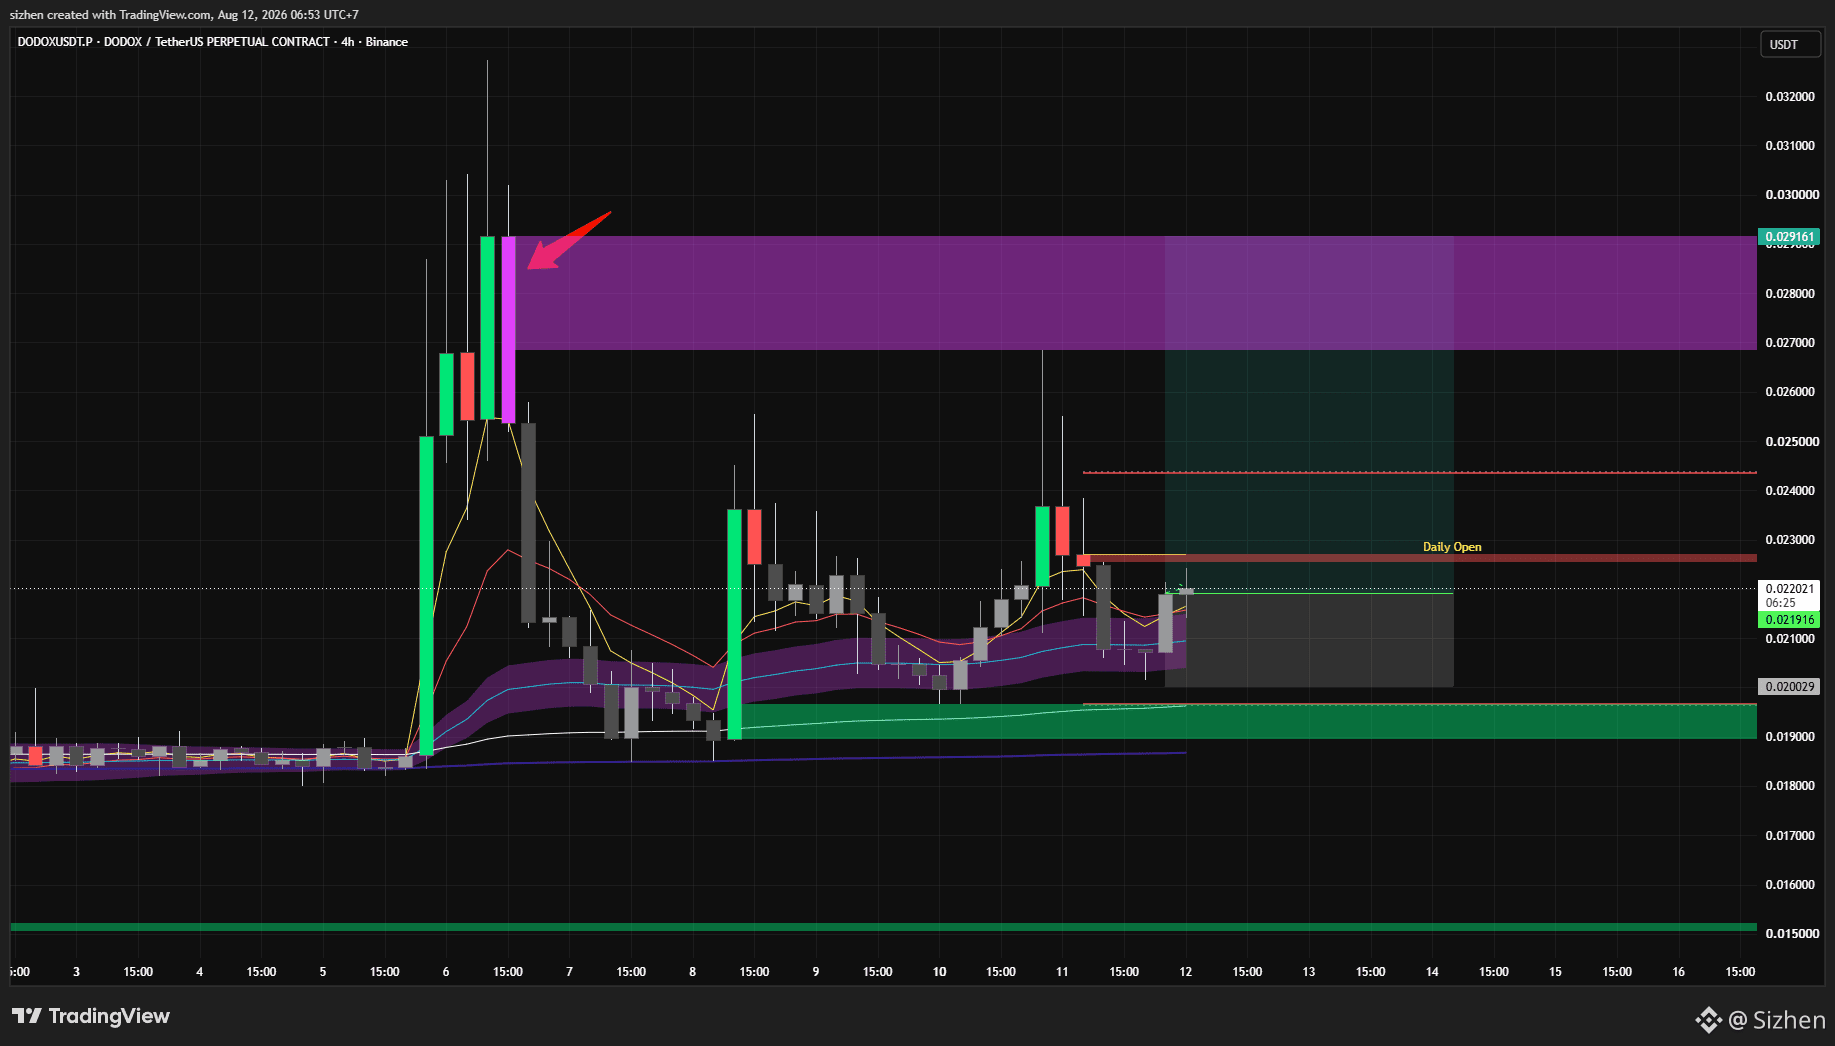
$DODOX I’ve been watching this for a while now, but it seems that whilst I was away for a moment, the price has risen. However, as long as the price doesn’t fall below the daily open, it’s worth keeping an eye on, and I’ve opened a long position even though it’s risen slightly our target is the violet vector above
W formation on $HEI if the price rises and the green vector candle breaks through the daily open, it is highly likely that we will see a further rise above the red vector on $HEI
I had closed my position on the $INX due to a rejection at the EMA, and it has now fully broken through the 50 EMA this breakout was signalled by a green vector candle, which provides sufficient confidence to reopen a long position on the $INX
Sizhen
·
--
Tăng giá
$INX I’m still holding onto my long position if the price starts to break above the level I’ve marked, it could rise to the red vector candle that hasn’t yet been filled, and if it’s rejected by the 50 EMA, I’ll close the position
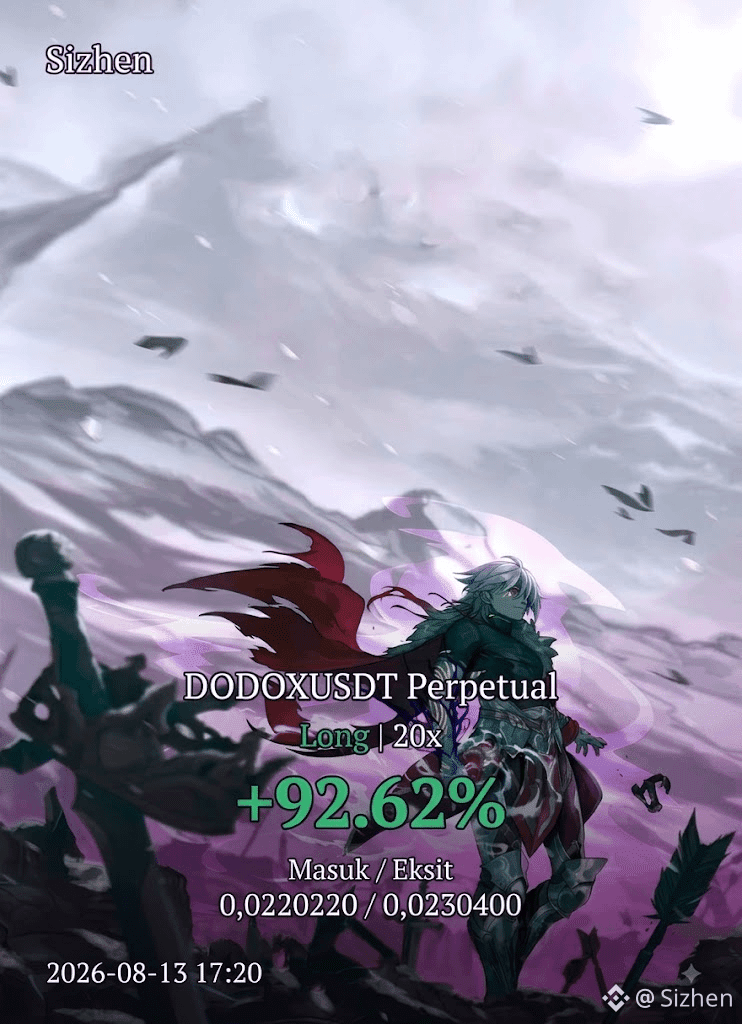
$DODOX has already risen quite a bit from here; will it reach the target level? I closed the position too quickly out of habit I’m a bit regretful, but never mind, I’ll take this as a lesson for next time
Sizhen
·
--
Tăng giá
$DODOX I’ve been watching this for a while now, but it seems that whilst I was away for a moment, the price has risen. However, as long as the price doesn’t fall below the daily open, it’s worth keeping an eye on, and I’ve opened a long position even though it’s risen slightly our target is the violet vector above
$AIO Trên khung thời gian 1h, giá có thể tăng lên tới hai mức mục tiêu mà tôi đã đánh dấu, vì vậy tôi đã mở thêm một lệnh long – đây là lần thứ ba tôi mở
Và trên khung thời gian 4h, nếu giá phá vỡ qua đường EMA 50 và bật lại từ EMA 50, chúng ta có thể thấy một đợt phục hồi hoàn chỉnh đi lên và đồng thời là sự thoái lui của toàn bộ các nến vector đỏ hiện có
Sizhen
·
--
Tăng giá
Dựa trên phân tích tôi đã chia sẻ hôm qua, $AIO đã tăng cao hơn từ đây. Bạn có thể dời stoploss về mức vào lệnh hoặc chốt một phần lợi nhuận và để phần còn lại chạy tiếp
$INX I’m still holding onto my long position if the price starts to break above the level I’ve marked, it could rise to the red vector candle that hasn’t yet been filled, and if it’s rejected by the 50 EMA, I’ll close the position
Sizhen
·
--
Tăng giá
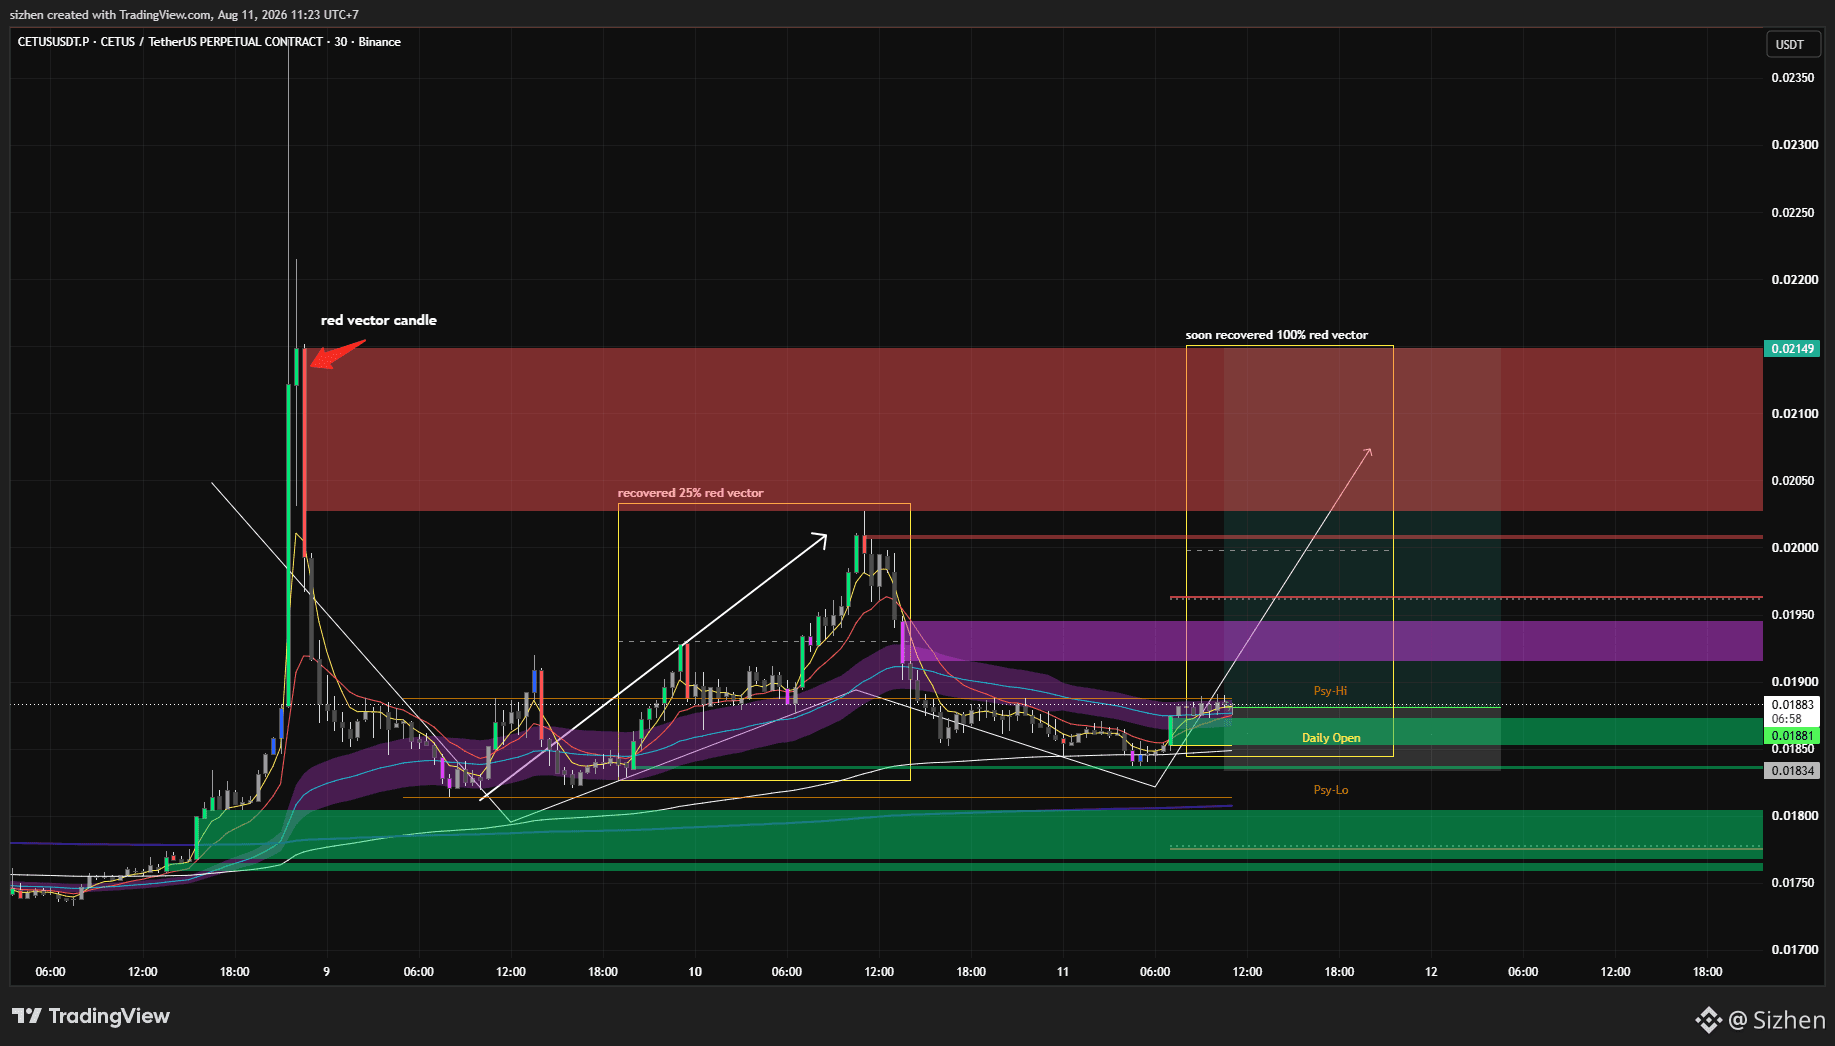
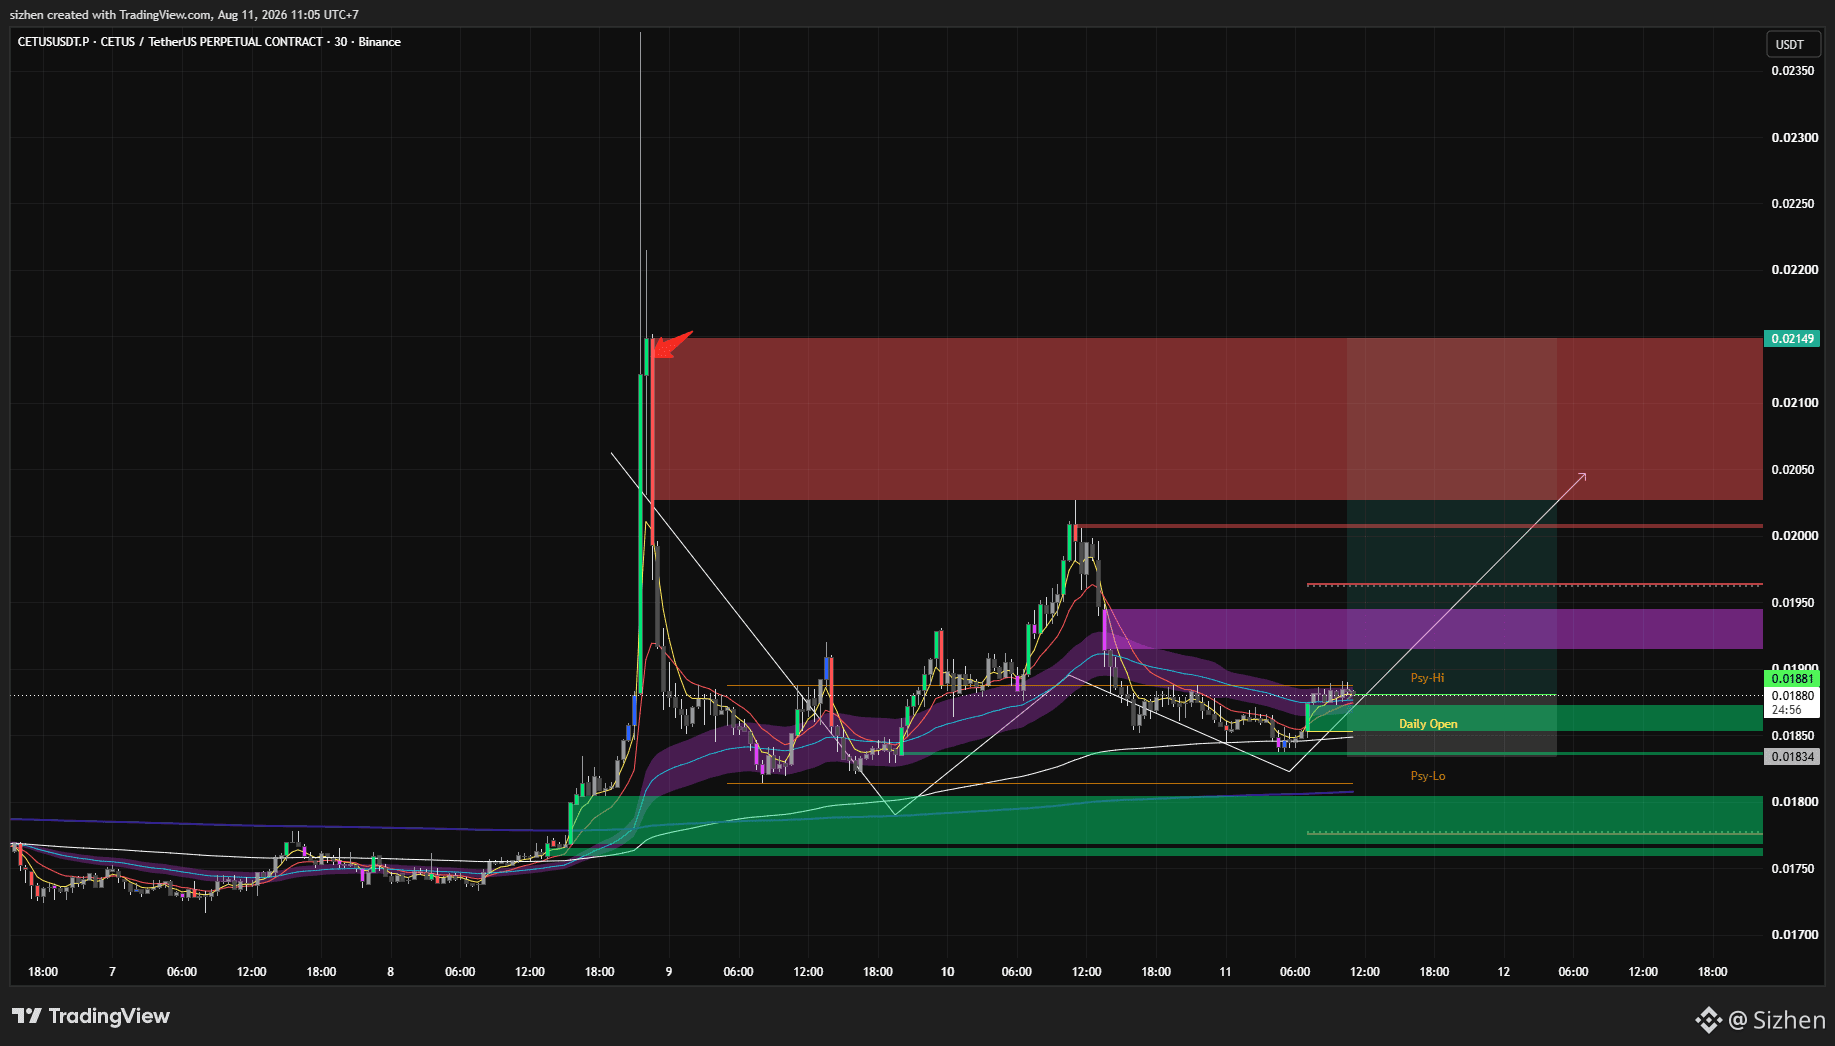
If $INX can bounce within this range, the price may target the red vector marked there
There are also entry points, stoploss and take profit levels there as well
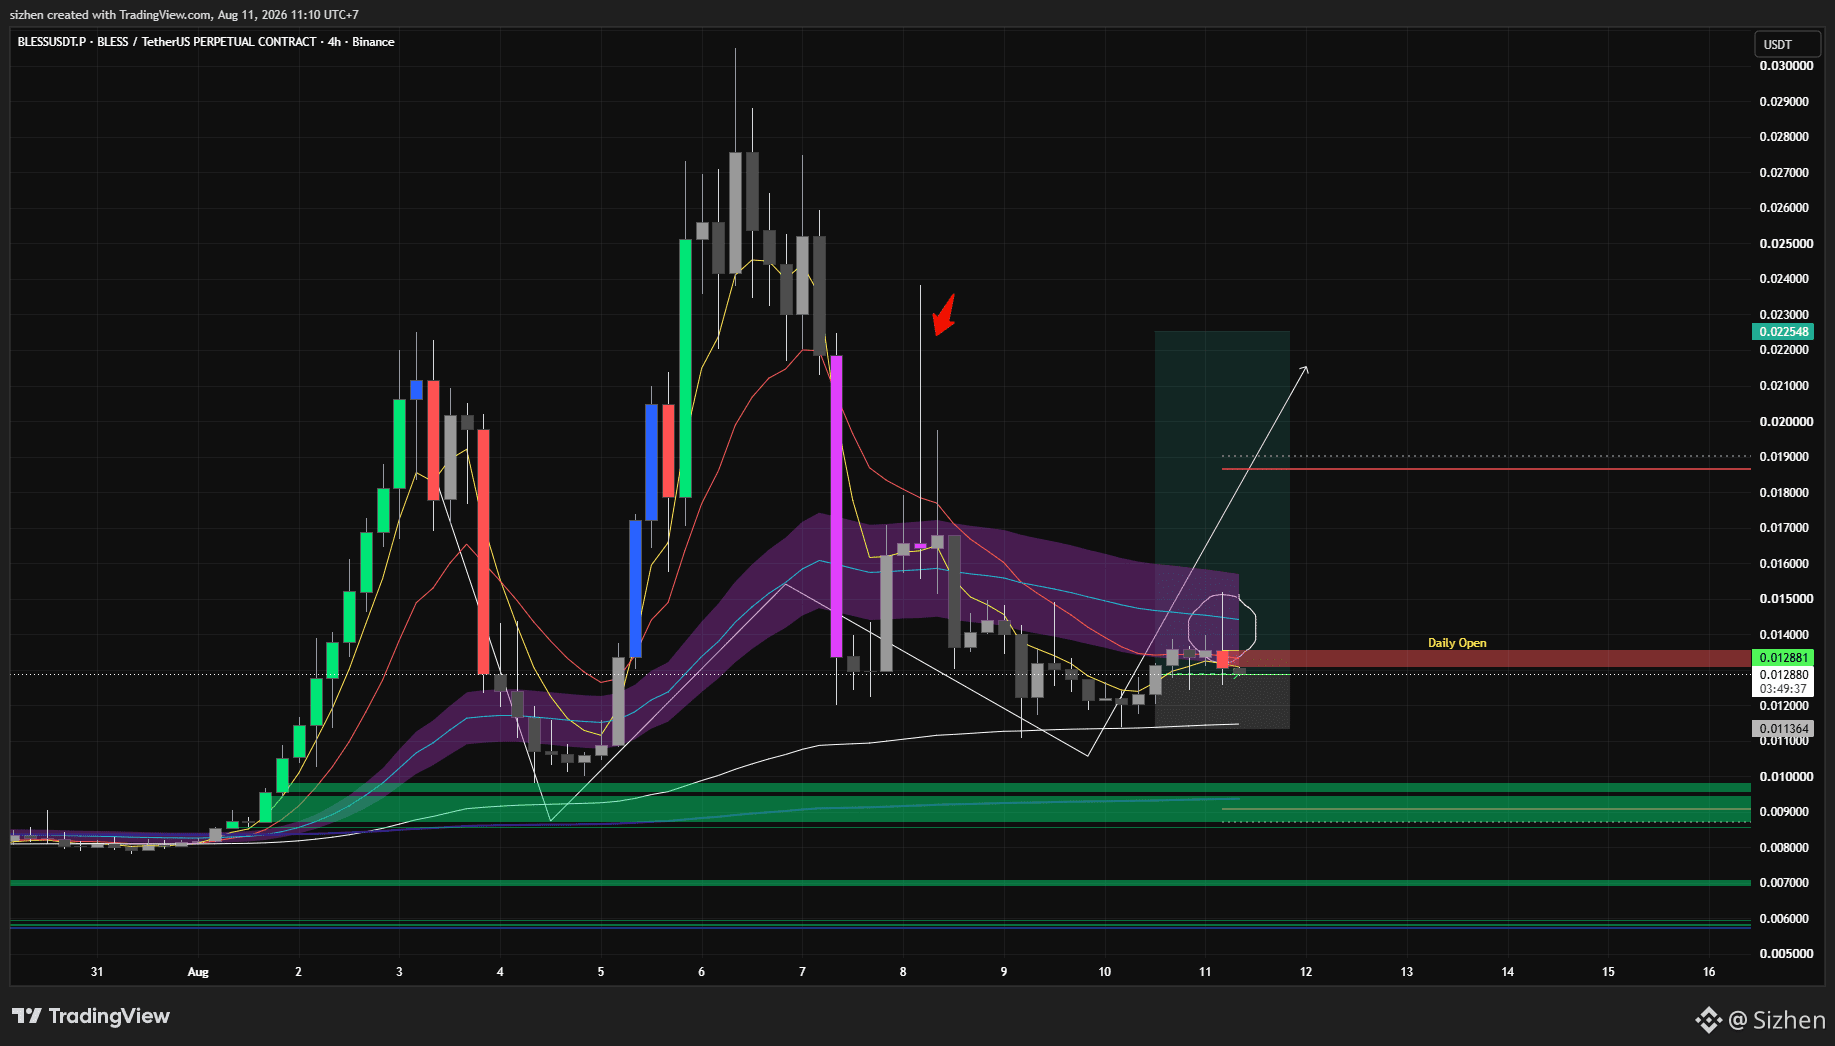
It looks as though $HEI needs a bit more time to bounce back up
Sizhen
·
--
Tăng giá
$HEI This one is also interesting; as long as it remains above yesterday’s daily open – or the new one that’s due to appear, there’s a chance it will rise again
$KGEN đã tăng thêm 7% kể từ khi tôi đăng bài về việc $KGEN có thể tiếp tục “flash pump” theo hướng đi lên
Đối với những ai đang theo dõi thiết lập này, bạn có thể dời stoploss về đúng điểm vào lệnh hoặc đóng vị thế ngay bây giờ
Sizhen
·
--
Tăng giá
Khi giá của $KGEN đã bật lại sau khi chạm Đường trung bình 50 EMA và giá mở cửa trong ngày, liệu sẽ có một đợt bơm nhanh (flash pump) sau đợt giảm trước đó không?