

Mughal007
3 Bài đăng

Mughal007
Báo cáo
Chặn người dùng
Giao dịch mở
Trader tần suất thấp
{thời gian} năm
1 Đang theo dõi
4 Người theo dõi
0 Đã thích
Bài đăng
Danh mục đầu tư
·
--
$ETH Thành thật mà nói, ETH có vẻ khá chật vật trong tháng này. Sau khi cố gắng tăng lên gần mức kháng cự 2.800 USD một thời gian trước, phe bò đã không thể duy trì đà tăng. Hiện tại, giá đang trượt xuống quanh vùng 2.310–2.330 USD, giảm khoảng 11–12% trong tháng 10.
Nếu bạn đang theo dõi biểu đồ, có một vài điểm đáng chú ý:
Kiểm tra vùng hỗ trợ: Giá hiện đang ở ngay quanh mốc 2.300 USD. Đây là một vùng khá then chốt. Nếu mức này bị phá vỡ, giá có thể dễ dàng giảm xuống kiểm tra vùng tâm lý 2.000 USD.
Các chỉ báo: RSI đang ở khoảng giữa 30—tiến gần vùng quá bán. Điều này thường cho thấy giá có thể sớm hồi phục nhẹ, nhưng xu hướng chung vẫn còn yếu. Khối lượng bán trên thị trường hợp đồng tương lai cũng đang áp đảo.
Tâm lý thị trường: Dòng vốn từ các tổ chức gần đây vẫn chưa đủ mạnh để vực giá lên, còn thị trường vĩ mô rộng hơn thì đang bị bao trùm bởi tâm lý lo ngại.
Về cơ bản, hiện tại mọi người đang chờ đợi. ETH cần lấy lại mốc trên 2.400 USD và giữ vững mức đó thì mới có thể nghiêm túc bàn đến chuyện đảo chiều xu hướng.
Hiện bạn đang cân nhắc chiến lược nào—đang tìm điểm để tích lũy, hay chỉ theo dõi sát biểu đồ Binance để xem giá tạo đáy ở đâu? @Ethereum_official
{spot}(ETHUSDT)
#Ethereum
$ETH Thành thật mà nói, ETH có vẻ khá chật vật trong tháng này. Sau khi cố gắng tăng lên gần mức kháng cự 2.800 USD một thời gian trước, phe bò đã không thể duy trì đà tăng. Hiện tại, giá đang trượt xuống quanh vùng 2.310–2.330 USD, giảm khoảng 11–12% trong tháng 10.
Nếu bạn đang theo dõi biểu đồ, có một vài điểm đáng chú ý:
Kiểm tra vùng hỗ trợ: Giá hiện đang ở ngay quanh mốc 2.300 USD. Đây là một vùng khá then chốt. Nếu mức này bị phá vỡ, giá có thể dễ dàng giảm xuống kiểm tra vùng tâm lý 2.000 USD.
Các chỉ báo: RSI đang ở khoảng giữa 30—tiến gần vùng quá bán. Điều này thường cho thấy giá có thể sớm hồi phục nhẹ, nhưng xu hướng chung vẫn còn yếu. Khối lượng bán trên thị trường hợp đồng tương lai cũng đang áp đảo.
Tâm lý thị trường: Dòng vốn từ các tổ chức gần đây vẫn chưa đủ mạnh để vực giá lên, còn thị trường vĩ mô rộng hơn thì đang bị bao trùm bởi tâm lý lo ngại.
Về cơ bản, hiện tại mọi người đang chờ đợi. ETH cần lấy lại mốc trên 2.400 USD và giữ vững mức đó thì mới có thể nghiêm túc bàn đến chuyện đảo chiều xu hướng.
Hiện bạn đang cân nhắc chiến lược nào—đang tìm điểm để tích lũy, hay chỉ theo dõi sát biểu đồ Binance để xem giá tạo đáy ở đâu? @Ethereum
#Ethereum

102
·
--
Bài viết
Xem bản dịch
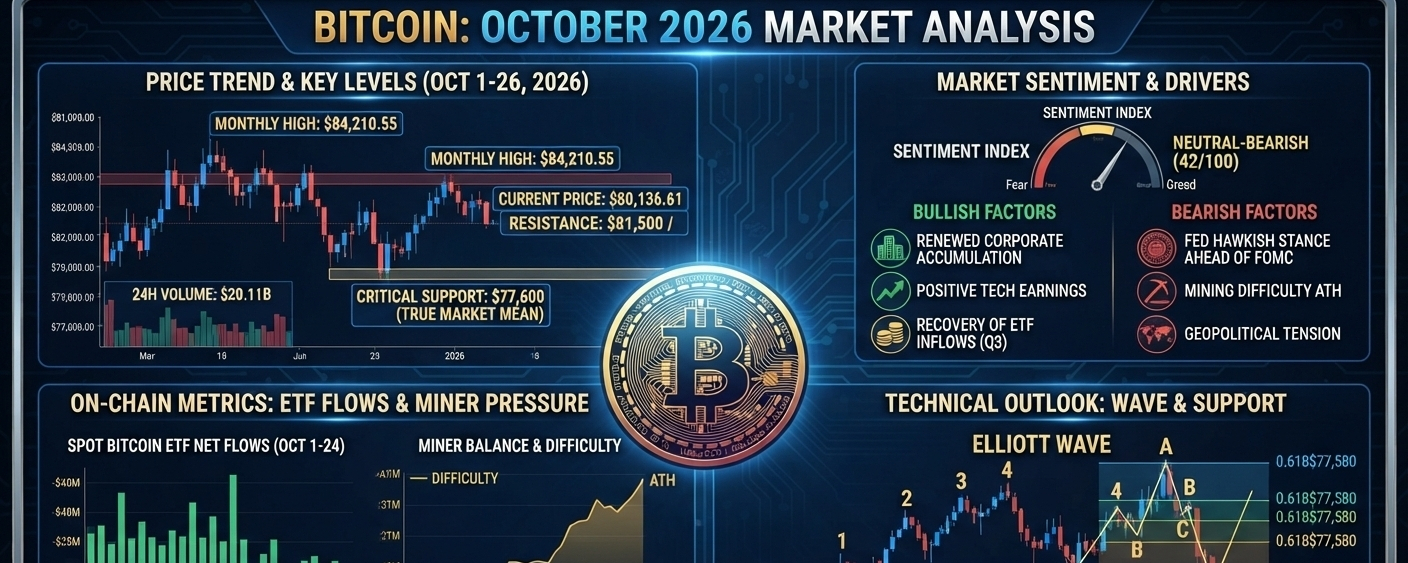
Bitcoin Analysis October 2026$BTC (BTC) Market Analysis – October 2026
Bitcoin ($BTC) has experienced notable volatility in October 2026, dropping to the $77,600 region before attempting to stabilize around the $80,100 mark. The current market phase represents a critical consolidation period as the asset navigates contrasting macro-economic headwinds and fundamental on-chain shifts.
Here is a detailed breakdown of the technical, fundamental, and sentiment factors currently shaping Bitcoin's price action:
1. Price Action & Key Levels
After reaching a monthly high of $84,210.55, Bitcoin faced a correctional pull-back, touching a critical support level at $77,600. This support area is particularly significant as it aligns with the 2026 "True Market Mean" and previous high-volume node areas, offering a strong floor for bulls.
Resistance: Immidiate hurdles lie at the $81,500 to $82,500 range. For the bullish trend to resume with strength, $BTC needs to decisively break and hold above the $81,500 resistance.
Support: The $77,600 area remains the most vital defense line. A sustained breach below this point could see Bitcoin fall back to the $72,856 level, which coincides with the 200-day Moving Average (MA).
2. Market Sentiment: "Neutral-Bearish"
The Crypto Fear & Greed / Sentiment Index has dipped into Neutral-Bearish territory (42/100), reflecting cautiousness among retail and institutional players.
Bearish Drivers: General hesitation is fueled by a hawkish Federal Reserve stance heading into the upcoming FOMC meeting, alongside escalating geopolitical tensions. Furthermore, the network’s mining difficulty has hit an All-Time High (ATH), squeezing miner margins.
Bullish Undercurrents: Despite the fear, underlying institutional interest remains steady, marked by renewed corporate accumulation. The market is also benefiting from a general recovery trend in spot ETF interest after a mixed third quarter.
3. On-Chain Metrics & ETF Activity
ETF Flow Activity (Oct 1–24): Mid-October saw a period of net outflows (totaling around -$485M). Spot Bitcoin ETFs have seen sporadic daily activity as institutional desk managers adjust their portfolios ahead of year-end.
Miner Behavior: With the mining difficulty peaking, on-chain data shows Miner Balances decreasing slightly, indicating that miners may be selling off some holdings to cover rising operational costs. This miner capitulation pressure is currently keeping a lid on rapid upward movements.
4. Technical Outlook (Elliott Wave Analysis)
From a technical wave perspective, Bitcoin's drop from its local highs can be interpreted as a standard corrective 'Wave C' phase within an Elliott Wave pattern.
A natural ending to the correction appears to have formed around the $77,600 (0.618 Fibonacci level).
If the support continues to hold, we are likely to see a period of consolidation between $77,600 and $81,500.
An accumulation pattern in this range could lay the groundwork for the next impulsive 'Wave 5' upward push toward new highs later in the year.
Summary: The market is at a crossroads. While near-term headwinds like mining difficulty and macro-economic policies are caping large gains, Bitcoin's defense of the $77,600 level demonstrates resilient buy-side interest. A period of sideways consolidation is expected before the next major directional breakout.
Disclaimer: This analysis is for informational purposes only and does not constitute financial advice. Cryptocurrency markets are highly volatile
#bitcoin #cryptooinsigts

Bitcoin Analysis October 2026
$BTC (BTC) Market Analysis – October 2026
Bitcoin ($BTC ) has experienced notable volatility in October 2026, dropping to the $77,600 region before attempting to stabilize around the $80,100 mark. The current market phase represents a critical consolidation period as the asset navigates contrasting macro-economic headwinds and fundamental on-chain shifts.
Here is a detailed breakdown of the technical, fundamental, and sentiment factors currently shaping Bitcoin's price action:
1. Price Action & Key Levels
After reaching a monthly high of $84,210.55, Bitcoin faced a correctional pull-back, touching a critical support level at $77,600. This support area is particularly significant as it aligns with the 2026 "True Market Mean" and previous high-volume node areas, offering a strong floor for bulls.
Resistance: Immidiate hurdles lie at the $81,500 to $82,500 range. For the bullish trend to resume with strength, $BTC needs to decisively break and hold above the $81,500 resistance.
Support: The $77,600 area remains the most vital defense line. A sustained breach below this point could see Bitcoin fall back to the $72,856 level, which coincides with the 200-day Moving Average (MA).
2. Market Sentiment: "Neutral-Bearish"
The Crypto Fear & Greed / Sentiment Index has dipped into Neutral-Bearish territory (42/100), reflecting cautiousness among retail and institutional players.
Bearish Drivers: General hesitation is fueled by a hawkish Federal Reserve stance heading into the upcoming FOMC meeting, alongside escalating geopolitical tensions. Furthermore, the network’s mining difficulty has hit an All-Time High (ATH), squeezing miner margins.
Bullish Undercurrents: Despite the fear, underlying institutional interest remains steady, marked by renewed corporate accumulation. The market is also benefiting from a general recovery trend in spot ETF interest after a mixed third quarter.
3. On-Chain Metrics & ETF Activity
ETF Flow Activity (Oct 1–24): Mid-October saw a period of net outflows (totaling around -$485M). Spot Bitcoin ETFs have seen sporadic daily activity as institutional desk managers adjust their portfolios ahead of year-end.
Miner Behavior: With the mining difficulty peaking, on-chain data shows Miner Balances decreasing slightly, indicating that miners may be selling off some holdings to cover rising operational costs. This miner capitulation pressure is currently keeping a lid on rapid upward movements.
4. Technical Outlook (Elliott Wave Analysis)
From a technical wave perspective, Bitcoin's drop from its local highs can be interpreted as a standard corrective 'Wave C' phase within an Elliott Wave pattern.
A natural ending to the correction appears to have formed around the $77,600 (0.618 Fibonacci level).
If the support continues to hold, we are likely to see a period of consolidation between $77,600 and $81,500.
An accumulation pattern in this range could lay the groundwork for the next impulsive 'Wave 5' upward push toward new highs later in the year.
Summary: The market is at a crossroads. While near-term headwinds like mining difficulty and macro-economic policies are caping large gains, Bitcoin's defense of the $77,600 level demonstrates resilient buy-side interest. A period of sideways consolidation is expected before the next major directional breakout.
Disclaimer: This analysis is for informational purposes only and does not constitute financial advice. Cryptocurrency markets are highly volatile
#bitcoin #cryptooinsigts

68
·
--
#EarnFreeCrypto2024
Tôi nghĩ chúng ta nên bình tĩnh trong thời kỳ tài chính khó khăn để có thể tạo ra khoảng thời gian vui vẻ cho chúng ta.
#EarnFreeCrypto2024
Tôi nghĩ chúng ta nên bình tĩnh trong thời kỳ tài chính khó khăn để có thể tạo ra khoảng thời gian vui vẻ cho chúng ta.
Tôi nghĩ chúng ta nên bình tĩnh trong thời kỳ tài chính khó khăn để có thể tạo ra khoảng thời gian vui vẻ cho chúng ta.
1
138
Đăng nhập để khám phá thêm nội dung
Tham gia cùng người dùng tiền mã hóa toàn cầu trên Binance Square
⚡️ Nhận thông tin mới nhất và hữu ích về tiền mã hóa.
💬 Được tin cậy bởi sàn giao dịch tiền mã hóa lớn nhất thế giới.
👍 Khám phá những thông tin chuyên sâu thực tế từ những nhà sáng tạo đã xác minh.
Email / Số điện thoại
Chủ đề thịnh hành
BinancePick
2.9M lượt xem
149,978 đang thảo luận
Tham gia #MùaBáoCáoKếtQuảKinhDoanh: Dự đoán kết quả kinh doanh trên Binance Pick, chia sẻ quan điểm trên Binance Square!
Binance Square Official
·405 lượt thích
·341.6k lượt xem
EarningsSeason
5.2M lượt xem
25,580 đang thảo luận
TheoDõiFOMC
292,401 lượt xem
1,227 đang thảo luận