
M Naveed Zafar
4 Bài đăng

M Naveed Zafar
Báo cáo
Chặn người dùng
Bitcoin Market Analysis
📊
45 Đang theo dõi
4 Người theo dõi
0 Đã thích
Bài đăng
Tất cả
Trích dẫn
Xem bản dịch
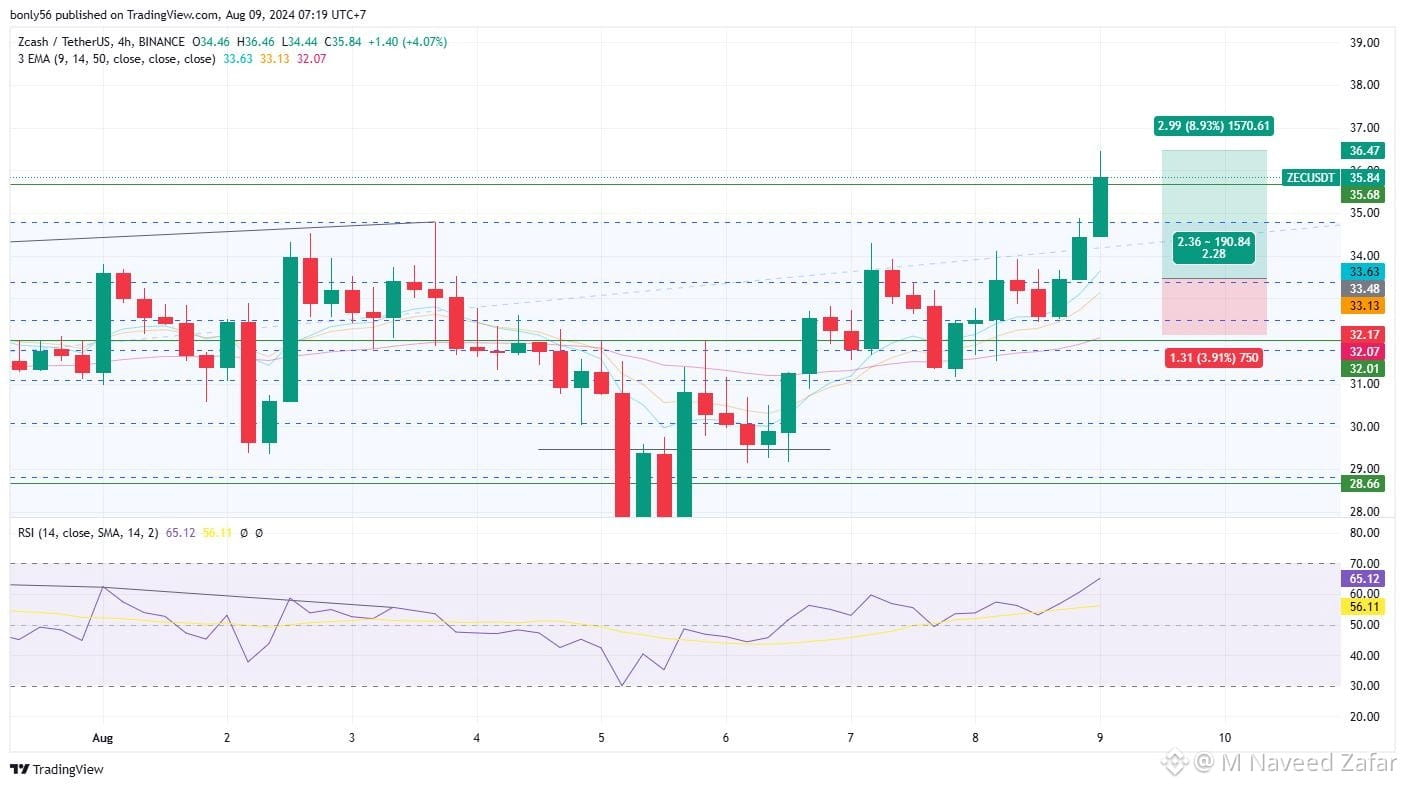
🚨 ZCASH (ZEC) PRICE ANALYSIS: BEARS ARE APPLYING PRESSURE — WHAT COMES NEXT?
Zcash ($ZEC) is showing short-term weakness on the Binance spot market. Traders are now watching whether buyers can defend the recent intraday support zone.
📊 BINANCE MARKET SNAPSHOT
Trading Pair: ZEC/USDT
Price: 1,275.89 USDT
24H Change: -2.91%
24H Volume: 210,860 ZEC
Daily High: 1,333.34 USDT
Daily Low: 1,271.27 USDT
🔍 TECHNICAL ANALYSIS
1️⃣ SUPPORT ZONES
The 1,271–1,275 area is the immediate support region based on recent trading activity.
If sellers push price below this zone and it fails to recover, downside pressure could increase.
A deeper reference area is around 1,221.
2️⃣ RESISTANCE ZONES
The first area to watch is 1,281–1,285.
The stronger resistance zone is around 1,330–1,335.
A convincing breakout above resistance, supported by trading volume, could improve the bullish outlook.
3️⃣ RSI, EMA & VOLUME
RSI: Monitor whether momentum moves out of oversold territory or remains weak.
EMA: Watch the 20 EMA and 50 EMA for trend direction and potential confirmation.
Volume: A breakdown with increasing selling volume would strengthen the bearish case. Increasing buying volume during a recovery would support a possible reversal.
If ZEC holds above immediate support and buyers reclaim the 1,281–1,285 region, a recovery towards the 1,330–1,335 resistance area becomes possible.
📉 BEARISH SCENARIO
If ZEC loses 1,271 with strong selling pressure, the next downside reference is around 1,221.
⚡ MY TRADING VIEW
At the moment, I would prefer waiting for confirmation rather than entering blindly
Capital protection matters more than chasing every market movement
💬 YOUR OPINION MATTERS
What is your expectation for ZEC?
🟢 Bullish — Recovery towards 1,330+
🔴 Bearish — Breakdown below 1,271
🟡 Neutral — Consolidation before the next move
Share your analysis in the comments!
Follow for more daily cryptocurrency market analysis.
$ZEC $BTC C $ETH #Zcash #CryptoAnalysis #BinanceSquare #TechnicalAnalysis #CryptoTrading
Educational market analysis only.
🚨 ZCASH (ZEC) PRICE ANALYSIS: BEARS ARE APPLYING PRESSURE — WHAT COMES NEXT?
Zcash ($ZEC ) is showing short-term weakness on the Binance spot market. Traders are now watching whether buyers can defend the recent intraday support zone.
📊 BINANCE MARKET SNAPSHOT
Trading Pair: ZEC/USDT
Price: 1,275.89 USDT
24H Change: -2.91%
24H Volume: 210,860 ZEC
Daily High: 1,333.34 USDT
Daily Low: 1,271.27 USDT
🔍 TECHNICAL ANALYSIS
1️⃣ SUPPORT ZONES
The 1,271–1,275 area is the immediate support region based on recent trading activity.
If sellers push price below this zone and it fails to recover, downside pressure could increase.
A deeper reference area is around 1,221.
2️⃣ RESISTANCE ZONES
The first area to watch is 1,281–1,285.
The stronger resistance zone is around 1,330–1,335.
A convincing breakout above resistance, supported by trading volume, could improve the bullish outlook.
3️⃣ RSI, EMA & VOLUME
RSI: Monitor whether momentum moves out of oversold territory or remains weak.
EMA: Watch the 20 EMA and 50 EMA for trend direction and potential confirmation.
Volume: A breakdown with increasing selling volume would strengthen the bearish case. Increasing buying volume during a recovery would support a possible reversal.
If ZEC holds above immediate support and buyers reclaim the 1,281–1,285 region, a recovery towards the 1,330–1,335 resistance area becomes possible.
📉 BEARISH SCENARIO
If ZEC loses 1,271 with strong selling pressure, the next downside reference is around 1,221.
⚡ MY TRADING VIEW
At the moment, I would prefer waiting for confirmation rather than entering blindly
Capital protection matters more than chasing every market movement
💬 YOUR OPINION MATTERS
What is your expectation for ZEC?
🟢 Bullish — Recovery towards 1,330+
🔴 Bearish — Breakdown below 1,271
🟡 Neutral — Consolidation before the next move
Share your analysis in the comments!
Follow for more daily cryptocurrency market analysis.
$ZEC $BTC C $ETH #Zcash #CryptoAnalysis #BinanceSquare #TechnicalAnalysis #CryptoTrading
Educational market analysis only.
Zcash ($ZEC ) is showing short-term weakness on the Binance spot market. Traders are now watching whether buyers can defend the recent intraday support zone.
📊 BINANCE MARKET SNAPSHOT
Trading Pair: ZEC/USDT
Price: 1,275.89 USDT
24H Change: -2.91%
24H Volume: 210,860 ZEC
Daily High: 1,333.34 USDT
Daily Low: 1,271.27 USDT
🔍 TECHNICAL ANALYSIS
1️⃣ SUPPORT ZONES
The 1,271–1,275 area is the immediate support region based on recent trading activity.
If sellers push price below this zone and it fails to recover, downside pressure could increase.
A deeper reference area is around 1,221.
2️⃣ RESISTANCE ZONES
The first area to watch is 1,281–1,285.
The stronger resistance zone is around 1,330–1,335.
A convincing breakout above resistance, supported by trading volume, could improve the bullish outlook.
3️⃣ RSI, EMA & VOLUME
RSI: Monitor whether momentum moves out of oversold territory or remains weak.
EMA: Watch the 20 EMA and 50 EMA for trend direction and potential confirmation.
Volume: A breakdown with increasing selling volume would strengthen the bearish case. Increasing buying volume during a recovery would support a possible reversal.
If ZEC holds above immediate support and buyers reclaim the 1,281–1,285 region, a recovery towards the 1,330–1,335 resistance area becomes possible.
📉 BEARISH SCENARIO
If ZEC loses 1,271 with strong selling pressure, the next downside reference is around 1,221.
⚡ MY TRADING VIEW
At the moment, I would prefer waiting for confirmation rather than entering blindly
Capital protection matters more than chasing every market movement
💬 YOUR OPINION MATTERS
What is your expectation for ZEC?
🟢 Bullish — Recovery towards 1,330+
🔴 Bearish — Breakdown below 1,271
🟡 Neutral — Consolidation before the next move
Share your analysis in the comments!
Follow for more daily cryptocurrency market analysis.
$ZEC $BTC C $ETH #Zcash #CryptoAnalysis #BinanceSquare #TechnicalAnalysis #CryptoTrading
Educational market analysis only.
174
BITCOIN CHỊU ÁP LỰC — NHÀ GIAO DỊCH NÊN THEO DÕI ĐIỀU GÌ TIẾP THEO?
Bitcoin đang chịu áp lực bán trở lại sau khi không thể duy trì đà phục hồi gần đây trên mức 80.000 USD.
Tính đến ngày 6 tháng 11, BTC đã giảm về vùng 75.000–76.000 USD. Đây là vùng quan trọng mà những người tham gia thị trường cần theo dõi.
🔍 BA ĐIỀU TÔI ĐANG THEO DÕI:
1️⃣ Hỗ trợ: Liệu bên mua có thể bảo vệ vùng 75.000 USD không?
2️⃣ Kháng cự: BTC có thể phục hồi lên vùng 78.000–80.000 USD không?
3️⃣ Động lượng thị trường: Áp lực bán sẽ giảm hay bên bán vẫn nắm quyền kiểm soát?
📊 HAI KỊCH BẢN CÓ THỂ XẢY RA
🟢 Kịch bản tăng giá:
Nếu BTC giữ vững vùng hỗ trợ, tạo đáy sau cao hơn đáy trước và vượt lại vùng kháng cự gần nhất, đà phục hồi có thể hình thành.
🔴 Kịch bản giảm giá:
Nếu BTC mất vùng hỗ trợ trong bối cảnh khối lượng bán tăng mạnh, áp lực giảm sâu hơn có thể tiếp diễn.
Quan điểm của tôi: Tôi thà chờ tín hiệu xác nhận còn hơn đuổi theo thị trường đang giảm. Bảo toàn vốn quan trọng hơn việc bắt kịp mọi biến động.
💬 CÂU HỎI DÀNH CHO CỘNG ĐỒNG:
Bạn có nghĩ Bitcoin sẽ phục hồi lên trên 80.000 USD, hay chúng ta cần chuẩn bị cho một đợt giảm nữa?
Hãy chia sẻ lý do của bạn bên dưới.
$BTC $BTCUSDT #Bitc oin #CryptoAnalysis #BinanceSquare
BITCOIN CHỊU ÁP LỰC — NHÀ GIAO DỊCH NÊN THEO DÕI ĐIỀU GÌ TIẾP THEO?
Bitcoin đang chịu áp lực bán trở lại sau khi không thể duy trì đà phục hồi gần đây trên mức 80.000 USD.
Tính đến ngày 6 tháng 11, BTC đã giảm về vùng 75.000–76.000 USD. Đây là vùng quan trọng mà những người tham gia thị trường cần theo dõi.
🔍 BA ĐIỀU TÔI ĐANG THEO DÕI:
1️⃣ Hỗ trợ: Liệu bên mua có thể bảo vệ vùng 75.000 USD không?
2️⃣ Kháng cự: BTC có thể phục hồi lên vùng 78.000–80.000 USD không?
3️⃣ Động lượng thị trường: Áp lực bán sẽ giảm hay bên bán vẫn nắm quyền kiểm soát?
📊 HAI KỊCH BẢN CÓ THỂ XẢY RA
🟢 Kịch bản tăng giá:
Nếu BTC giữ vững vùng hỗ trợ, tạo đáy sau cao hơn đáy trước và vượt lại vùng kháng cự gần nhất, đà phục hồi có thể hình thành.
🔴 Kịch bản giảm giá:
Nếu BTC mất vùng hỗ trợ trong bối cảnh khối lượng bán tăng mạnh, áp lực giảm sâu hơn có thể tiếp diễn.
Quan điểm của tôi: Tôi thà chờ tín hiệu xác nhận còn hơn đuổi theo thị trường đang giảm. Bảo toàn vốn quan trọng hơn việc bắt kịp mọi biến động.
💬 CÂU HỎI DÀNH CHO CỘNG ĐỒNG:
Bạn có nghĩ Bitcoin sẽ phục hồi lên trên 80.000 USD, hay chúng ta cần chuẩn bị cho một đợt giảm nữa?
Hãy chia sẻ lý do của bạn bên dưới.
$BTC $BTCUSDT #Bitc oin #CryptoAnalysis #BinanceSquare
Bitcoin đang chịu áp lực bán trở lại sau khi không thể duy trì đà phục hồi gần đây trên mức 80.000 USD.
Tính đến ngày 6 tháng 11, BTC đã giảm về vùng 75.000–76.000 USD. Đây là vùng quan trọng mà những người tham gia thị trường cần theo dõi.
🔍 BA ĐIỀU TÔI ĐANG THEO DÕI:
1️⃣ Hỗ trợ: Liệu bên mua có thể bảo vệ vùng 75.000 USD không?
2️⃣ Kháng cự: BTC có thể phục hồi lên vùng 78.000–80.000 USD không?
3️⃣ Động lượng thị trường: Áp lực bán sẽ giảm hay bên bán vẫn nắm quyền kiểm soát?
📊 HAI KỊCH BẢN CÓ THỂ XẢY RA
🟢 Kịch bản tăng giá:
Nếu BTC giữ vững vùng hỗ trợ, tạo đáy sau cao hơn đáy trước và vượt lại vùng kháng cự gần nhất, đà phục hồi có thể hình thành.
🔴 Kịch bản giảm giá:
Nếu BTC mất vùng hỗ trợ trong bối cảnh khối lượng bán tăng mạnh, áp lực giảm sâu hơn có thể tiếp diễn.
Quan điểm của tôi: Tôi thà chờ tín hiệu xác nhận còn hơn đuổi theo thị trường đang giảm. Bảo toàn vốn quan trọng hơn việc bắt kịp mọi biến động.
💬 CÂU HỎI DÀNH CHO CỘNG ĐỒNG:
Bạn có nghĩ Bitcoin sẽ phục hồi lên trên 80.000 USD, hay chúng ta cần chuẩn bị cho một đợt giảm nữa?
Hãy chia sẻ lý do của bạn bên dưới.
$BTC $BTCUSDT #Bitc oin #CryptoAnalysis #BinanceSquare
75
Xem bản dịch
source of info
source of info

Paweł Łaskarzewski
·
--
🤯 Eric Trump vừa tiết lộ rằng anh ấy sở hữu $XRP!
Gia đình Trump tham gia vào tiền điện tử.
Tích cực hay Tích cực cực kỳ?
Gia đình Trump tham gia vào tiền điện tử.
Tích cực hay Tích cực cực kỳ?


147
Đăng nhập để khám phá thêm nội dung
Tham gia cùng người dùng tiền mã hóa toàn cầu trên Binance Square
⚡️ Nhận thông tin mới nhất và hữu ích về tiền mã hóa.
💬 Được tin cậy bởi sàn giao dịch tiền mã hóa lớn nhất thế giới.
👍 Khám phá những thông tin chuyên sâu thực tế từ những nhà sáng tạo đã xác minh.
Email / Số điện thoại
Chủ đề thịnh hành
TheoDõiFOMC
327,462 lượt xem
1,425 đang thảo luận
Bão #TinFed và #TheoDõiFOMC sắp đổ bộ: Anh em nhỏ lẻ nên làm gì để không bị "quét" sạch túi tiền?
Tunglx
·1 lượt thích
·518 lượt xem
TinFed
406,364 lượt xem
1,158 đang thảo luận
BinanceReopensWithdrawalsForHYPE&APT
19,750 lượt xem
385 đang thảo luận