

Haroon AG
8 Bài đăng

Haroon AG
Báo cáo
Chặn người dùng
Crypto Trader | Market Analysis | Price Action & Technical Insights | Sharing setups, market updates & trading knowledge | Precision • Discipline • Consistency
0 Đang theo dõi
8 Người theo dõi
18 Đã thích
Bài đăng
·
--
Tăng giá
Xem bản dịch
$ETH /
{spot}(ETHUSDT)
$USDT — 4H Analysis
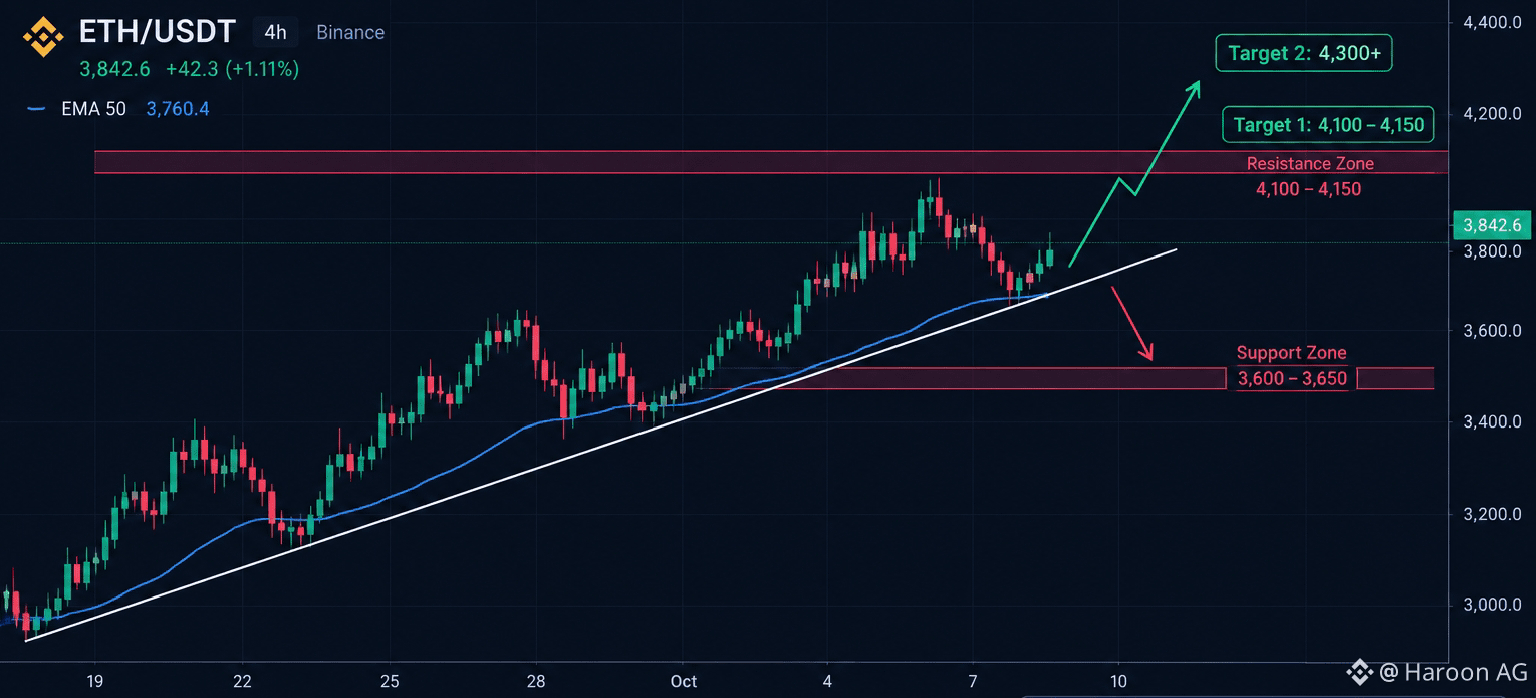
ETH is holding above the 3,760 area, which is acting as an important trend-support level along with the ascending trendline.
Bullish scenario: If ETH holds above 3,760 and breaks 3,900, the next resistance is 4,100–4,150. A clean breakout above this zone could open the way toward 4,300+.
Bearish scenario: If ETH breaks below the ascending trendline and 3,760, the price could move toward the 3,600–3,650 support zone.
Key levels:
Resistance: 4,100–4,150
Breakout target: 4,300+
Trend support: 3,760
Major support: 3,600–3,650
#ETH #cryptoAnylasis #ETH/USDT
$ETH /
$USDT — 4H Analysis
ETH is holding above the 3,760 area, which is acting as an important trend-support level along with the ascending trendline.
Bullish scenario: If ETH holds above 3,760 and breaks 3,900, the next resistance is 4,100–4,150. A clean breakout above this zone could open the way toward 4,300+.
Bearish scenario: If ETH breaks below the ascending trendline and 3,760, the price could move toward the 3,600–3,650 support zone.
Key levels:
Resistance: 4,100–4,150
Breakout target: 4,300+
Trend support: 3,760
Major support: 3,600–3,650
#ETH #cryptoAnylasis #ETH/USDT
$USDT — 4H Analysis
ETH is holding above the 3,760 area, which is acting as an important trend-support level along with the ascending trendline.
Bullish scenario: If ETH holds above 3,760 and breaks 3,900, the next resistance is 4,100–4,150. A clean breakout above this zone could open the way toward 4,300+.
Bearish scenario: If ETH breaks below the ascending trendline and 3,760, the price could move toward the 3,600–3,650 support zone.
Key levels:
Resistance: 4,100–4,150
Breakout target: 4,300+
Trend support: 3,760
Major support: 3,600–3,650
#ETH #cryptoAnylasis #ETH/USDT
65
·
--
Xem bản dịch
$BTC
WEEKLY OUTLOOK | SEPT 28 – OCT 5
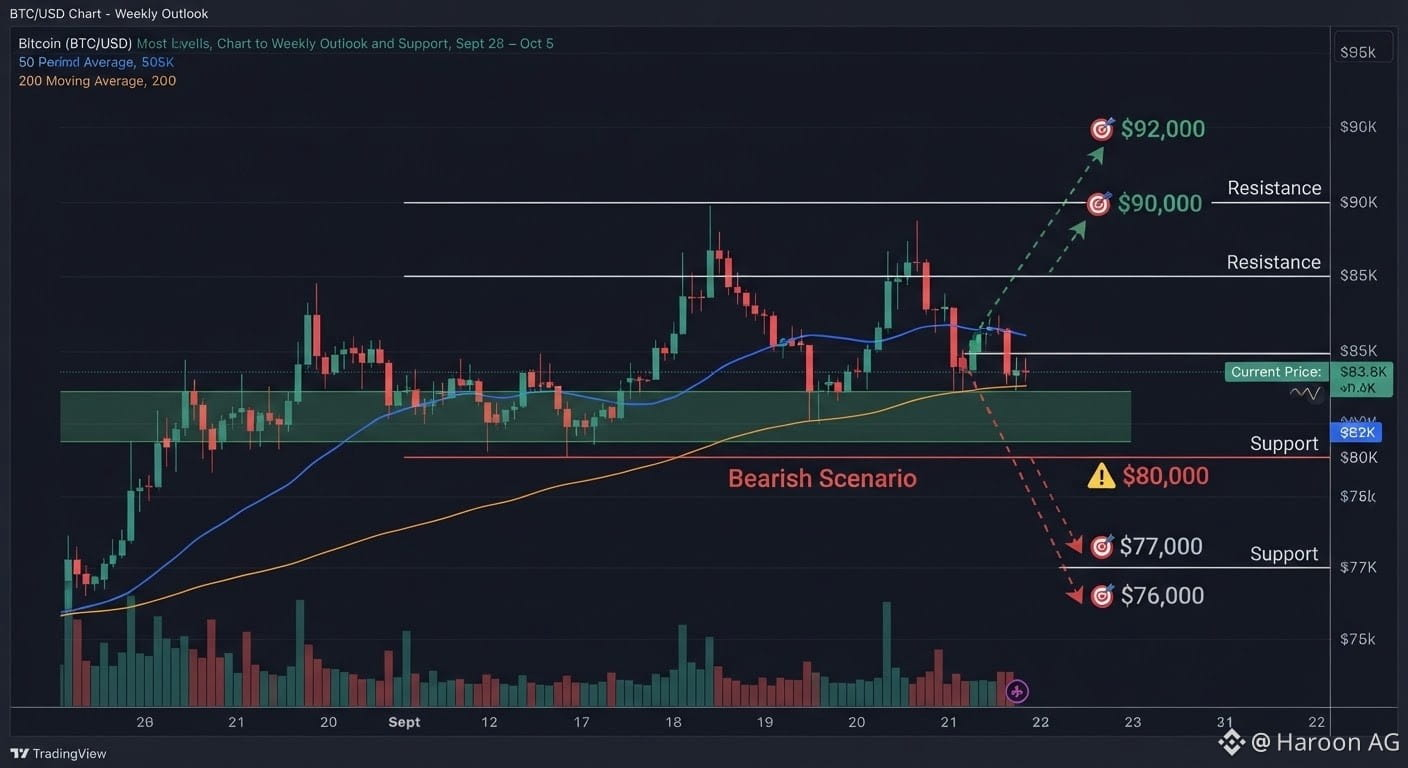
Bitcoin is currently trading around $83.8K following a rejection from the $87K resistance area.
Key Market Scenarios
Bullish Scenario: If the $82K to $81.5K support zone holds, the recovery remains intact. A reclaim of $85K could drive buyers to target $87K, $90K, and $92K. A clean daily close above $87K would strengthen the bullish continuation setup.
Bearish Scenario: If Bitcoin decisively loses $81.5K, $80K becomes the critical support level. A breakdown below $80K would bring the $77K to $76K range into focus.
Fundamental Outlook
The medium-term market structure has improved, supported by strong institutional demand through recent spot ETF inflows. However, elevated U.S. Treasury yields and ongoing tightening expectations continue to pose short-term risks for risk-on assets.
Summary of Key Levels
Resistance Levels: $85K | $87K | $90K
Support Levels: $82K | $80K | $77K
The next major market move depends on whether Bitcoin can reclaim $85K and clear $87K, or break below the $81.5K to $80K support zone.
Disclaimer: Not financial advice. Always manage risk and conduct your own research.
#BTC #bitcoin #crypto #BTCanalysis
$BTC
WEEKLY OUTLOOK | SEPT 28 – OCT 5
Bitcoin is currently trading around $83.8K following a rejection from the $87K resistance area.
Key Market Scenarios
Bullish Scenario: If the $82K to $81.5K support zone holds, the recovery remains intact. A reclaim of $85K could drive buyers to target $87K, $90K, and $92K. A clean daily close above $87K would strengthen the bullish continuation setup.
Bearish Scenario: If Bitcoin decisively loses $81.5K, $80K becomes the critical support level. A breakdown below $80K would bring the $77K to $76K range into focus.
Fundamental Outlook
The medium-term market structure has improved, supported by strong institutional demand through recent spot ETF inflows. However, elevated U.S. Treasury yields and ongoing tightening expectations continue to pose short-term risks for risk-on assets.
Summary of Key Levels
Resistance Levels: $85K | $87K | $90K
Support Levels: $82K | $80K | $77K
The next major market move depends on whether Bitcoin can reclaim $85K and clear $87K, or break below the $81.5K to $80K support zone.
Disclaimer: Not financial advice. Always manage risk and conduct your own research.
#BTC #bitcoin #crypto #BTCanalysis
WEEKLY OUTLOOK | SEPT 28 – OCT 5
Bitcoin is currently trading around $83.8K following a rejection from the $87K resistance area.
Key Market Scenarios
Bullish Scenario: If the $82K to $81.5K support zone holds, the recovery remains intact. A reclaim of $85K could drive buyers to target $87K, $90K, and $92K. A clean daily close above $87K would strengthen the bullish continuation setup.
Bearish Scenario: If Bitcoin decisively loses $81.5K, $80K becomes the critical support level. A breakdown below $80K would bring the $77K to $76K range into focus.
Fundamental Outlook
The medium-term market structure has improved, supported by strong institutional demand through recent spot ETF inflows. However, elevated U.S. Treasury yields and ongoing tightening expectations continue to pose short-term risks for risk-on assets.
Summary of Key Levels
Resistance Levels: $85K | $87K | $90K
Support Levels: $82K | $80K | $77K
The next major market move depends on whether Bitcoin can reclaim $85K and clear $87K, or break below the $81.5K to $80K support zone.
Disclaimer: Not financial advice. Always manage risk and conduct your own research.
#BTC #bitcoin #crypto #BTCanalysis
81
·
--
$BTC
BTC đang giao dịch thấp hơn hôm nay, khoảng $87,000–$89,000 với sự yếu kém trong ngày và áp lực bán gần đây. Điều này phù hợp với sự giảm giá của thị trường crypto rộng hơn do tin tức vĩ mô và việc thanh lý.
Tâm lý thị trường ngắn hạn là kh bearish:
BTC đã bán tháo dưới ~$90,000 và không thể duy trì các mức cao hơn.
Việc thanh lý cưỡng bức và tín hiệu vĩ mô yếu (dữ liệu việc làm hỗn hợp + không có kỳ vọng cắt giảm lãi suất rõ ràng) đang kìm hãm các tài sản rủi ro như crypto.
Các mức kỹ thuật cần theo dõi
Các mức hỗ trợ chính
Khu vực $86,000–$88,000: hỗ trợ địa phương hiện tại nơi mà người mua đã tham gia gần đây.
Các mức hỗ trợ thấp hơn khoảng ~$85,000 — một sự phá vỡ có thể tăng tốc độ giảm.
Các mức kháng cự chính
$90,000 — điểm xoay tâm lý
Khu vực $91,000–$92,000 — băng kháng cự trước đó.
Các tín hiệu kỹ thuật ngắn hạn
Chỉ số RSI và Bollinger cho thấy giá gần các băng dưới / bán quá mức đến vùng trung tính — có thể là khu vực bật lại nhưng cần xác nhận.
Đóng cửa trên $88,500–$90,000 sẽ giúp thay đổi thiên lệch nhẹ sang phía tăng.
Các kịch bản Tăng giá & Giảm giá hôm nay
Tăng giá (nếu được xác nhận): ✔ Bật lại từ hỗ trợ ~$86k–$88k
✔ Đóng cửa hàng ngày trên ~~$90k
Tiềm năng tăng lên $91k–$92k rồi sau đó là kháng cự cao hơn.
Giảm giá (nếu phá vỡ): ✘ Phá vỡ rõ ràng dưới $86k
Có thể thấy sự mở rộng về phía khoảng $80k–$82k nếu người bán tăng tốc.
Các yếu tố Vĩ mô & Tâm lý
Các thị trường crypto yếu trong điều kiện rủi ro rộng hơn khi cổ phiếu dao động.
Dữ liệu việc làm và kỳ vọng cắt giảm lãi suất mờ nhạt từ Fed đang làm tổn thương khẩu vị rủi ro.
Các thanh lý lớn cho thấy rủi ro định vị ngắn hạn cho các trader có đòn bẩy.
Tóm tắt
Quan điểm ngắn hạn: Trung lập đến hơi giảm trừ khi BTC có thể lấy lại và đóng cửa trên $90k–$92k.
Các mức chính cho hôm nay:
Hỗ trợ: ~$86k–$88k
Kháng cự: ~$90k–$92k
#BinanceAlphaAlert #BinanceBlockchainWeek #TrumpTariffs #WriteToEarnUpgrade
{spot}(BTCUSDT)
---
$BTC
BTC đang giao dịch thấp hơn hôm nay, khoảng $87,000–$89,000 với sự yếu kém trong ngày và áp lực bán gần đây. Điều này phù hợp với sự giảm giá của thị trường crypto rộng hơn do tin tức vĩ mô và việc thanh lý.
Tâm lý thị trường ngắn hạn là kh bearish:
BTC đã bán tháo dưới ~$90,000 và không thể duy trì các mức cao hơn.
Việc thanh lý cưỡng bức và tín hiệu vĩ mô yếu (dữ liệu việc làm hỗn hợp + không có kỳ vọng cắt giảm lãi suất rõ ràng) đang kìm hãm các tài sản rủi ro như crypto.
Các mức kỹ thuật cần theo dõi
Các mức hỗ trợ chính
Khu vực $86,000–$88,000: hỗ trợ địa phương hiện tại nơi mà người mua đã tham gia gần đây.
Các mức hỗ trợ thấp hơn khoảng ~$85,000 — một sự phá vỡ có thể tăng tốc độ giảm.
Các mức kháng cự chính
$90,000 — điểm xoay tâm lý
Khu vực $91,000–$92,000 — băng kháng cự trước đó.
Các tín hiệu kỹ thuật ngắn hạn
Chỉ số RSI và Bollinger cho thấy giá gần các băng dưới / bán quá mức đến vùng trung tính — có thể là khu vực bật lại nhưng cần xác nhận.
Đóng cửa trên $88,500–$90,000 sẽ giúp thay đổi thiên lệch nhẹ sang phía tăng.
Các kịch bản Tăng giá & Giảm giá hôm nay
Tăng giá (nếu được xác nhận): ✔ Bật lại từ hỗ trợ ~$86k–$88k
✔ Đóng cửa hàng ngày trên ~~$90k
Tiềm năng tăng lên $91k–$92k rồi sau đó là kháng cự cao hơn.
Giảm giá (nếu phá vỡ): ✘ Phá vỡ rõ ràng dưới $86k
Có thể thấy sự mở rộng về phía khoảng $80k–$82k nếu người bán tăng tốc.
Các yếu tố Vĩ mô & Tâm lý
Các thị trường crypto yếu trong điều kiện rủi ro rộng hơn khi cổ phiếu dao động.
Dữ liệu việc làm và kỳ vọng cắt giảm lãi suất mờ nhạt từ Fed đang làm tổn thương khẩu vị rủi ro.
Các thanh lý lớn cho thấy rủi ro định vị ngắn hạn cho các trader có đòn bẩy.
Tóm tắt
Quan điểm ngắn hạn: Trung lập đến hơi giảm trừ khi BTC có thể lấy lại và đóng cửa trên $90k–$92k.
Các mức chính cho hôm nay:
Hỗ trợ: ~$86k–$88k
Kháng cự: ~$90k–$92k
#BinanceAlphaAlert #BinanceBlockchainWeek #TrumpTariffs #WriteToEarnUpgrade
---
BTC đang giao dịch thấp hơn hôm nay, khoảng $87,000–$89,000 với sự yếu kém trong ngày và áp lực bán gần đây. Điều này phù hợp với sự giảm giá của thị trường crypto rộng hơn do tin tức vĩ mô và việc thanh lý.
Tâm lý thị trường ngắn hạn là kh bearish:
BTC đã bán tháo dưới ~$90,000 và không thể duy trì các mức cao hơn.
Việc thanh lý cưỡng bức và tín hiệu vĩ mô yếu (dữ liệu việc làm hỗn hợp + không có kỳ vọng cắt giảm lãi suất rõ ràng) đang kìm hãm các tài sản rủi ro như crypto.
Các mức kỹ thuật cần theo dõi
Các mức hỗ trợ chính
Khu vực $86,000–$88,000: hỗ trợ địa phương hiện tại nơi mà người mua đã tham gia gần đây.
Các mức hỗ trợ thấp hơn khoảng ~$85,000 — một sự phá vỡ có thể tăng tốc độ giảm.
Các mức kháng cự chính
$90,000 — điểm xoay tâm lý
Khu vực $91,000–$92,000 — băng kháng cự trước đó.
Các tín hiệu kỹ thuật ngắn hạn
Chỉ số RSI và Bollinger cho thấy giá gần các băng dưới / bán quá mức đến vùng trung tính — có thể là khu vực bật lại nhưng cần xác nhận.
Đóng cửa trên $88,500–$90,000 sẽ giúp thay đổi thiên lệch nhẹ sang phía tăng.
Các kịch bản Tăng giá & Giảm giá hôm nay
Tăng giá (nếu được xác nhận): ✔ Bật lại từ hỗ trợ ~$86k–$88k
✔ Đóng cửa hàng ngày trên ~~$90k
Tiềm năng tăng lên $91k–$92k rồi sau đó là kháng cự cao hơn.
Giảm giá (nếu phá vỡ): ✘ Phá vỡ rõ ràng dưới $86k
Có thể thấy sự mở rộng về phía khoảng $80k–$82k nếu người bán tăng tốc.
Các yếu tố Vĩ mô & Tâm lý
Các thị trường crypto yếu trong điều kiện rủi ro rộng hơn khi cổ phiếu dao động.
Dữ liệu việc làm và kỳ vọng cắt giảm lãi suất mờ nhạt từ Fed đang làm tổn thương khẩu vị rủi ro.
Các thanh lý lớn cho thấy rủi ro định vị ngắn hạn cho các trader có đòn bẩy.
Tóm tắt
Quan điểm ngắn hạn: Trung lập đến hơi giảm trừ khi BTC có thể lấy lại và đóng cửa trên $90k–$92k.
Các mức chính cho hôm nay:
Hỗ trợ: ~$86k–$88k
Kháng cự: ~$90k–$92k
#BinanceAlphaAlert #BinanceBlockchainWeek #TrumpTariffs #WriteToEarnUpgrade
---
23
·
--
Xem bản dịch
$BTC
{spot}(BTCUSDT)
$BTC
Here’s the latest Bitcoin (BTC) price & market analysis including a live price chart, key technical levels, and short-term outlook:
Bitcoin (BTC)
$92,438.00
+$2,183.00(+2.42%)Today
1D5D1M6MYTD1Y5Ymax
6:25 AM
📌 Current Market Snapshot (Live BTC Price)
As of right now, Bitcoin (BTC) is trading around ~$92,400 USD, with intraday volatility between roughly ~$89,300 and ~$93,500.
This reflects a choppy market in the $90K–$95K zone recently.
Recent Price Action & News
Here’s what’s happening in the market right now:
Market Drivers
Volatility persists: BTC recently dipped below $90K with renewed risk-off sentiment in global markets. Reuters
Fed monetary outlook: After a rate cut, the cautious tone from the U.S. Federal Reserve tempered bullish expectations. Barron's
Institutional buying still happening: Strategy (MicroStrategy) has continued to accumulate significant BTC. Barron's
Mixed sentiment: Some sessions see rebounds above $92K–$94K as risk appetite returns. The Economic Times
Short-term sentiment: still mixed/neutral–slightly bearish to neutral until a clean breakout or breakdown occurs.
Key Technical Levels (Support & Resistance)
LevelImportance$95,000–$100,000Immediate upside zone & psychological target if BTC breaks higher (bullish) — resistance.
$92,000–$94,000Current trading range/resistance zone — needs solid breakout. $90,000Major psychological support zone — recent pivot
point.
Forbes$86,000–$88,000Stronger lower support — key breakdown line.$80,000–$85,000Deeper support in bear case.
Short-term structure: price has been trapped in a range, forming a symmetrical triangle pattern — typically a breakout signal is coming soon.
#BinanceAlphaAlert #TrumpTariffs $BTC #CPIWatch #WriteToEarnUpgrade
$BTC
$BTC
Here’s the latest Bitcoin (BTC) price & market analysis including a live price chart, key technical levels, and short-term outlook:
Bitcoin (BTC)
$92,438.00
+$2,183.00(+2.42%)Today
1D5D1M6MYTD1Y5Ymax
6:25 AM
📌 Current Market Snapshot (Live BTC Price)
As of right now, Bitcoin (BTC) is trading around ~$92,400 USD, with intraday volatility between roughly ~$89,300 and ~$93,500.
This reflects a choppy market in the $90K–$95K zone recently.
Recent Price Action & News
Here’s what’s happening in the market right now:
Market Drivers
Volatility persists: BTC recently dipped below $90K with renewed risk-off sentiment in global markets. Reuters
Fed monetary outlook: After a rate cut, the cautious tone from the U.S. Federal Reserve tempered bullish expectations. Barron's
Institutional buying still happening: Strategy (MicroStrategy) has continued to accumulate significant BTC. Barron's
Mixed sentiment: Some sessions see rebounds above $92K–$94K as risk appetite returns. The Economic Times
Short-term sentiment: still mixed/neutral–slightly bearish to neutral until a clean breakout or breakdown occurs.
Key Technical Levels (Support & Resistance)
LevelImportance$95,000–$100,000Immediate upside zone & psychological target if BTC breaks higher (bullish) — resistance.
$92,000–$94,000Current trading range/resistance zone — needs solid breakout. $90,000Major psychological support zone — recent pivot
point.
Forbes$86,000–$88,000Stronger lower support — key breakdown line.$80,000–$85,000Deeper support in bear case.
Short-term structure: price has been trapped in a range, forming a symmetrical triangle pattern — typically a breakout signal is coming soon.
#BinanceAlphaAlert #TrumpTariffs $BTC #CPIWatch #WriteToEarnUpgrade
$BTC
Here’s the latest Bitcoin (BTC) price & market analysis including a live price chart, key technical levels, and short-term outlook:
Bitcoin (BTC)
$92,438.00
+$2,183.00(+2.42%)Today
1D5D1M6MYTD1Y5Ymax
6:25 AM
📌 Current Market Snapshot (Live BTC Price)
As of right now, Bitcoin (BTC) is trading around ~$92,400 USD, with intraday volatility between roughly ~$89,300 and ~$93,500.
This reflects a choppy market in the $90K–$95K zone recently.
Recent Price Action & News
Here’s what’s happening in the market right now:
Market Drivers
Volatility persists: BTC recently dipped below $90K with renewed risk-off sentiment in global markets. Reuters
Fed monetary outlook: After a rate cut, the cautious tone from the U.S. Federal Reserve tempered bullish expectations. Barron's
Institutional buying still happening: Strategy (MicroStrategy) has continued to accumulate significant BTC. Barron's
Mixed sentiment: Some sessions see rebounds above $92K–$94K as risk appetite returns. The Economic Times
Short-term sentiment: still mixed/neutral–slightly bearish to neutral until a clean breakout or breakdown occurs.
Key Technical Levels (Support & Resistance)
LevelImportance$95,000–$100,000Immediate upside zone & psychological target if BTC breaks higher (bullish) — resistance.
$92,000–$94,000Current trading range/resistance zone — needs solid breakout. $90,000Major psychological support zone — recent pivot
point.
Forbes$86,000–$88,000Stronger lower support — key breakdown line.$80,000–$85,000Deeper support in bear case.
Short-term structure: price has been trapped in a range, forming a symmetrical triangle pattern — typically a breakout signal is coming soon.
#BinanceAlphaAlert #TrumpTariffs $BTC #CPIWatch #WriteToEarnUpgrade
7
·
--
Xem bản dịch
$BTC
BTC recently jumped back above ~ $93,000, after dipping as low as ~$84,000.
According to technical-models and market commentary, BTC is hovering near its so-called "production cost" area (~ $92,300), which suggests the current price could reflect a local bottom or fair value zone.
Some analysts see a possible breakout rally: a decisive close above the ~$93,000–$94,000 zone could open room toward $96,000–$98,000 in short-term.
On the flip side: volatility remains high. There's risk of a pull-back if bearish pressure returns, especially if macroeconomic signals worsen or institutional inflows slow.
In medium-term view (next few weeks) many predictions place BTC's likely range between ~ $88,500 and $94,500 — unless a breakout triggers stronger momentum.
---
What this means for you as trader
If BTC holds above ~$92–93K and breaks toward ~$96–98K — could be a chance for short-term gains.
But given volatility, consider tight risk management if opening position now — as BTC could oscillate in wide range or drop before next rally.
For your style (you trade binary/short-term setups) — this rebound could offer setups, but only trade with strict stop-loss, and maybe wait for confirmation (price + volume + maybe a chart pattern) before entering.
If you like — I can prepare 3 chart-based BTC trade setups for next 48-72h (with entry, stop-loss, targets) similar to your strategy style. Want me to build them now for you?
{spot}(BTCUSDT)
#BinanceBlockchainWeek #BinanceAlphaAlert #TrumpTariffs
$BTC
BTC recently jumped back above ~ $93,000, after dipping as low as ~$84,000.
According to technical-models and market commentary, BTC is hovering near its so-called "production cost" area (~ $92,300), which suggests the current price could reflect a local bottom or fair value zone.
Some analysts see a possible breakout rally: a decisive close above the ~$93,000–$94,000 zone could open room toward $96,000–$98,000 in short-term.
On the flip side: volatility remains high. There's risk of a pull-back if bearish pressure returns, especially if macroeconomic signals worsen or institutional inflows slow.
In medium-term view (next few weeks) many predictions place BTC's likely range between ~ $88,500 and $94,500 — unless a breakout triggers stronger momentum.
---
What this means for you as trader
If BTC holds above ~$92–93K and breaks toward ~$96–98K — could be a chance for short-term gains.
But given volatility, consider tight risk management if opening position now — as BTC could oscillate in wide range or drop before next rally.
For your style (you trade binary/short-term setups) — this rebound could offer setups, but only trade with strict stop-loss, and maybe wait for confirmation (price + volume + maybe a chart pattern) before entering.
If you like — I can prepare 3 chart-based BTC trade setups for next 48-72h (with entry, stop-loss, targets) similar to your strategy style. Want me to build them now for you?
#BinanceBlockchainWeek #BinanceAlphaAlert #TrumpTariffs
BTC recently jumped back above ~ $93,000, after dipping as low as ~$84,000.
According to technical-models and market commentary, BTC is hovering near its so-called "production cost" area (~ $92,300), which suggests the current price could reflect a local bottom or fair value zone.
Some analysts see a possible breakout rally: a decisive close above the ~$93,000–$94,000 zone could open room toward $96,000–$98,000 in short-term.
On the flip side: volatility remains high. There's risk of a pull-back if bearish pressure returns, especially if macroeconomic signals worsen or institutional inflows slow.
In medium-term view (next few weeks) many predictions place BTC's likely range between ~ $88,500 and $94,500 — unless a breakout triggers stronger momentum.
---
What this means for you as trader
If BTC holds above ~$92–93K and breaks toward ~$96–98K — could be a chance for short-term gains.
But given volatility, consider tight risk management if opening position now — as BTC could oscillate in wide range or drop before next rally.
For your style (you trade binary/short-term setups) — this rebound could offer setups, but only trade with strict stop-loss, and maybe wait for confirmation (price + volume + maybe a chart pattern) before entering.
If you like — I can prepare 3 chart-based BTC trade setups for next 48-72h (with entry, stop-loss, targets) similar to your strategy style. Want me to build them now for you?
#BinanceBlockchainWeek #BinanceAlphaAlert #TrumpTariffs
21
·
--
Tăng giá
Xem bản dịch
$BTC
BTC is trading around ≈ USD 93,300–93,500. CoinMarketCap+1
This marks a rebound after a recent pullback from 2025 highs. StatMuse+2YCharts+2
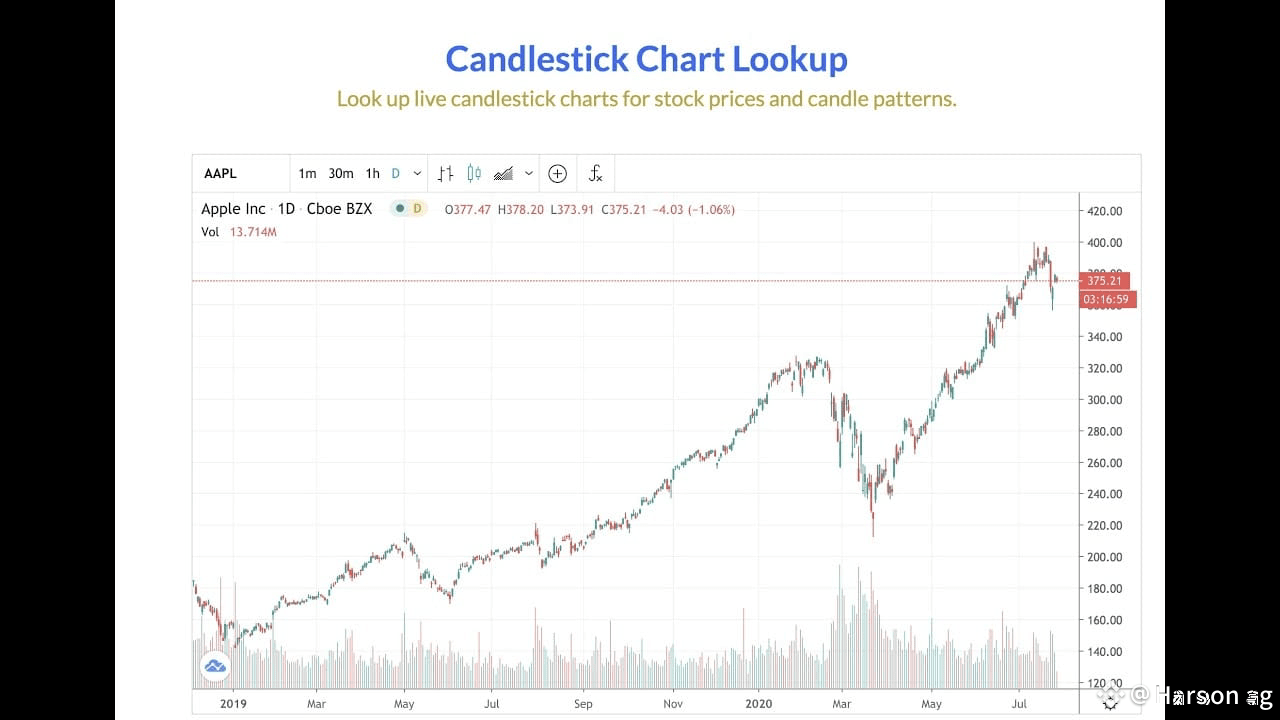
What the Candlesticks Show
Recent daily candlesticks show large green bodies — indicative of renewed buying pressure after consolidation. That hints at short-term bullish sentiment.
The bounce from near-support (around low-90Ks) forming higher lows suggests accumulation rather than panic selling.
However — given that BTC recently dropped from much higher levels (above 100 K) — the chart still warns of potential volatility; a strong reversal candle or a break below support could lead to deeper pullback.
What Looks Potentially Bullish
If BTC maintains support ~ USD 90,000–92,000 and closes daily candles above this zone, the bulls may try pushing toward USD 100,000+ again.
The recent rebound suggests market participants are re-entering — possibly viewing the dip as a buying opportunity.
Risks & What Could Go Wrong
A sharp macroeconomic shock or negative sentiment could easily reverse the current bounce — especially if BTC fails to hold above support.
Given the recent high volatility, false breakouts remain a real risk; traders should watch for confirmation before assuming a new uptrend.
{spot}(BTCUSDT)
$BTC #TrumpTariffs #BinanceAlphaAlert #BinanceAlphaAlert #BinanceBlockchainWeek
$BTC
BTC is trading around ≈ USD 93,300–93,500. CoinMarketCap+1
This marks a rebound after a recent pullback from 2025 highs. StatMuse+2YCharts+2
What the Candlesticks Show
Recent daily candlesticks show large green bodies — indicative of renewed buying pressure after consolidation. That hints at short-term bullish sentiment.
The bounce from near-support (around low-90Ks) forming higher lows suggests accumulation rather than panic selling.
However — given that BTC recently dropped from much higher levels (above 100 K) — the chart still warns of potential volatility; a strong reversal candle or a break below support could lead to deeper pullback.
What Looks Potentially Bullish
If BTC maintains support ~ USD 90,000–92,000 and closes daily candles above this zone, the bulls may try pushing toward USD 100,000+ again.
The recent rebound suggests market participants are re-entering — possibly viewing the dip as a buying opportunity.
Risks & What Could Go Wrong
A sharp macroeconomic shock or negative sentiment could easily reverse the current bounce — especially if BTC fails to hold above support.
Given the recent high volatility, false breakouts remain a real risk; traders should watch for confirmation before assuming a new uptrend.
$BTC #TrumpTariffs #BinanceAlphaAlert #BinanceAlphaAlert #BinanceBlockchainWeek
BTC is trading around ≈ USD 93,300–93,500. CoinMarketCap+1
This marks a rebound after a recent pullback from 2025 highs. StatMuse+2YCharts+2
What the Candlesticks Show
Recent daily candlesticks show large green bodies — indicative of renewed buying pressure after consolidation. That hints at short-term bullish sentiment.
The bounce from near-support (around low-90Ks) forming higher lows suggests accumulation rather than panic selling.
However — given that BTC recently dropped from much higher levels (above 100 K) — the chart still warns of potential volatility; a strong reversal candle or a break below support could lead to deeper pullback.
What Looks Potentially Bullish
If BTC maintains support ~ USD 90,000–92,000 and closes daily candles above this zone, the bulls may try pushing toward USD 100,000+ again.
The recent rebound suggests market participants are re-entering — possibly viewing the dip as a buying opportunity.
Risks & What Could Go Wrong
A sharp macroeconomic shock or negative sentiment could easily reverse the current bounce — especially if BTC fails to hold above support.
Given the recent high volatility, false breakouts remain a real risk; traders should watch for confirmation before assuming a new uptrend.
$BTC #TrumpTariffs #BinanceAlphaAlert #BinanceAlphaAlert #BinanceBlockchainWeek
1
13
·
--
#plasma $XPL
Plasma được ra mắt vào tháng 9 năm 2025 như một blockchain Layer-1 tập trung vào cơ sở hạ tầng stablecoin và thanh toán, định vị mình như một chuỗi “native stablecoin”. Token của nó, XPL, phục vụ như gas, tài sản staking và phần thưởng cho người xác thực.
CoinDesk
+2
CoinDesk
+2
Tại thời điểm ra mắt, XPL đã cho thấy những chỉ số đầy hứa hẹn: kỳ vọng cao, nguồn cung lưu hành lớn (~18% tổng nguồn cung token ban đầu lưu hành), và được hỗ trợ bởi các nhà đầu tư có uy tín.
CoinDesk
+1
Vì lý do đó, nhiều nhà đầu tư sớm đã coi XPL như một cơ hội có tiềm năng dài hạn cho một cơ sở hạ tầng thanh toán stablecoin mới.
#XPL #Plasma
{spot}(XPLUSDT)
#plasma $XPL
Plasma được ra mắt vào tháng 9 năm 2025 như một blockchain Layer-1 tập trung vào cơ sở hạ tầng stablecoin và thanh toán, định vị mình như một chuỗi “native stablecoin”. Token của nó, XPL, phục vụ như gas, tài sản staking và phần thưởng cho người xác thực.
CoinDesk
+2
CoinDesk
+2
Tại thời điểm ra mắt, XPL đã cho thấy những chỉ số đầy hứa hẹn: kỳ vọng cao, nguồn cung lưu hành lớn (~18% tổng nguồn cung token ban đầu lưu hành), và được hỗ trợ bởi các nhà đầu tư có uy tín.
CoinDesk
+1
Vì lý do đó, nhiều nhà đầu tư sớm đã coi XPL như một cơ hội có tiềm năng dài hạn cho một cơ sở hạ tầng thanh toán stablecoin mới.
#XPL #Plasma
Plasma được ra mắt vào tháng 9 năm 2025 như một blockchain Layer-1 tập trung vào cơ sở hạ tầng stablecoin và thanh toán, định vị mình như một chuỗi “native stablecoin”. Token của nó, XPL, phục vụ như gas, tài sản staking và phần thưởng cho người xác thực.
CoinDesk
+2
CoinDesk
+2
Tại thời điểm ra mắt, XPL đã cho thấy những chỉ số đầy hứa hẹn: kỳ vọng cao, nguồn cung lưu hành lớn (~18% tổng nguồn cung token ban đầu lưu hành), và được hỗ trợ bởi các nhà đầu tư có uy tín.
CoinDesk
+1
Vì lý do đó, nhiều nhà đầu tư sớm đã coi XPL như một cơ hội có tiềm năng dài hạn cho một cơ sở hạ tầng thanh toán stablecoin mới.
#XPL #Plasma

9
72
·
--
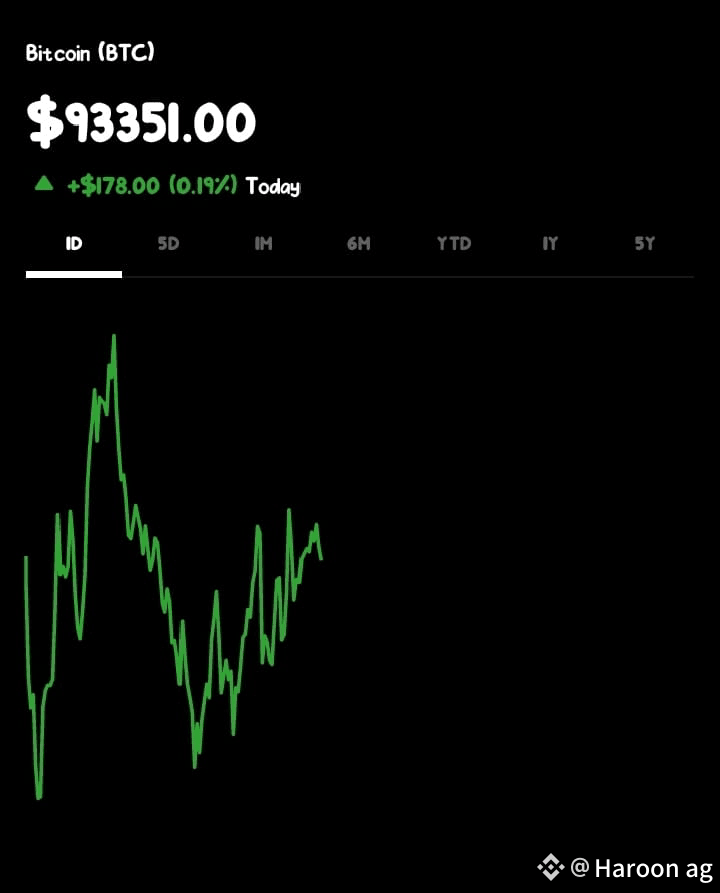
$BTC
$91,398.00
+$170.00(+0.19%)Hôm nay
4H
{spot}(BTCUSDT)
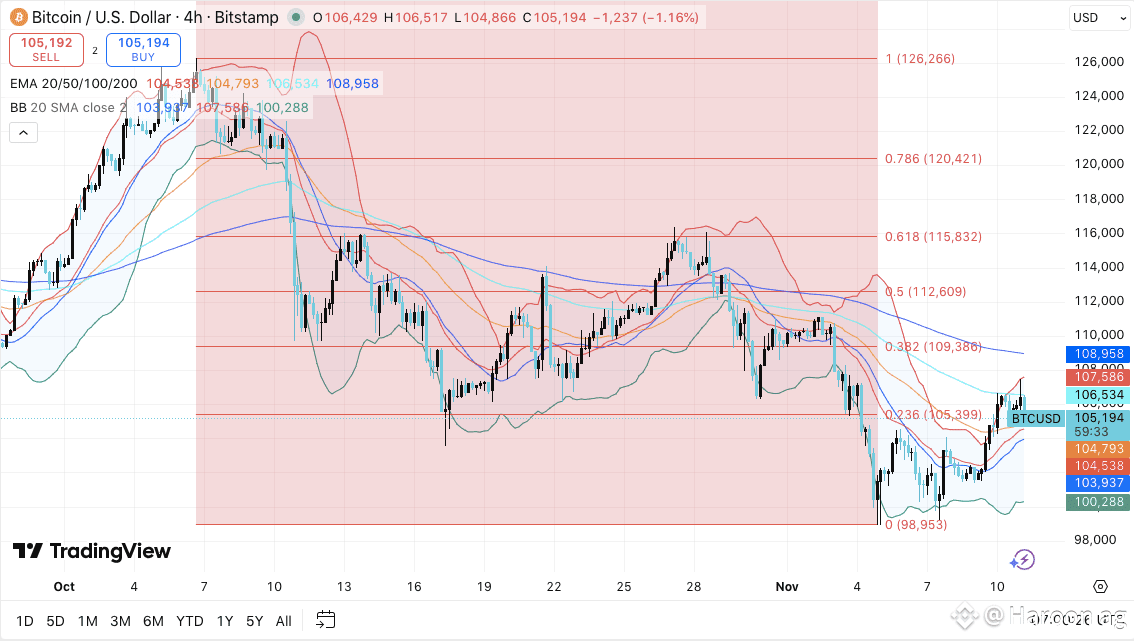
📊 Bitcoin —
Sau khi đạt đỉnh gần ≈ $126,000 vào đầu năm 2025, Bitcoin gần đây đã trải qua một đợt điều chỉnh mạnh, giảm khoảng ≈ 21% vào tháng 11
Sự sụt giảm này được thúc đẩy bởi sự kết hợp của việc chốt lời từ những người nắm giữ lâu dài, thanh lý cưỡng bức và sự chuyển hướng rộng rãi hơn về tâm lý thận trọng trên toàn cầu — khi một số điều kiện kinh tế vĩ mô (ví dụ: sự không chắc chắn về lãi suất) làm giảm sự thèm muốn đối với các tài sản biến động.
Tuy nhiên, gần đây BTC đã phục hồi: nó đã leo lên trên $90,000+, báo hiệu khả năng ổn định hoặc phục hồi ngắn hạn.
#BTCRebound90kNext? #BinanceHODLerAT #CPIWatch #ProjectCrypto
$BTC
$91,398.00
+$170.00(+0.19%)Hôm nay
4H
📊 Bitcoin —
Sau khi đạt đỉnh gần ≈ $126,000 vào đầu năm 2025, Bitcoin gần đây đã trải qua một đợt điều chỉnh mạnh, giảm khoảng ≈ 21% vào tháng 11
Sự sụt giảm này được thúc đẩy bởi sự kết hợp của việc chốt lời từ những người nắm giữ lâu dài, thanh lý cưỡng bức và sự chuyển hướng rộng rãi hơn về tâm lý thận trọng trên toàn cầu — khi một số điều kiện kinh tế vĩ mô (ví dụ: sự không chắc chắn về lãi suất) làm giảm sự thèm muốn đối với các tài sản biến động.
Tuy nhiên, gần đây BTC đã phục hồi: nó đã leo lên trên $90,000+, báo hiệu khả năng ổn định hoặc phục hồi ngắn hạn.
#BTCRebound90kNext? #BinanceHODLerAT #CPIWatch #ProjectCrypto
$91,398.00
+$170.00(+0.19%)Hôm nay
4H
📊 Bitcoin —
Sau khi đạt đỉnh gần ≈ $126,000 vào đầu năm 2025, Bitcoin gần đây đã trải qua một đợt điều chỉnh mạnh, giảm khoảng ≈ 21% vào tháng 11
Sự sụt giảm này được thúc đẩy bởi sự kết hợp của việc chốt lời từ những người nắm giữ lâu dài, thanh lý cưỡng bức và sự chuyển hướng rộng rãi hơn về tâm lý thận trọng trên toàn cầu — khi một số điều kiện kinh tế vĩ mô (ví dụ: sự không chắc chắn về lãi suất) làm giảm sự thèm muốn đối với các tài sản biến động.
Tuy nhiên, gần đây BTC đã phục hồi: nó đã leo lên trên $90,000+, báo hiệu khả năng ổn định hoặc phục hồi ngắn hạn.
#BTCRebound90kNext? #BinanceHODLerAT #CPIWatch #ProjectCrypto
8
8
Đăng nhập để khám phá thêm nội dung
Tham gia cùng người dùng tiền mã hóa toàn cầu trên Binance Square
⚡️ Nhận thông tin mới nhất và hữu ích về tiền mã hóa.
💬 Được tin cậy bởi sàn giao dịch tiền mã hóa lớn nhất thế giới.
👍 Khám phá những thông tin chuyên sâu thực tế từ những nhà sáng tạo đã xác minh.
Email / Số điện thoại
Chủ đề thịnh hành
TheoDõiFOMC
106,980 lượt xem
632 đang thảo luận
#TheoDõiFOMC $BTC $ETH
FOMC không chỉ là một cuộc họp về lãi suất.
Đây là nơi mà hướng đi của “tiền lớn” có thể bắt đầu thay đổi.
Một câu nói từ Fed có thể trở thành tín hiệu cho thị trường.
Lãi suất có thể không đổi, nhưng kỳ vọng của nhà đầu tư có thể thay đổi trước.
Với Bitcoin, câu hỏi thực sự không phải lúc nào cũng là:
“Fed sẽ tăng hay cắt giảm lãi suất?”
Mà là:
“Fed muốn thị trường tin điều gì?”
Trong crypto, giá thường biến động trước cả tin tức.
Vì vậy, trước mỗi kỳ FOMC, đừng chỉ nhìn vào biểu đồ.
Hãy theo dõi kỳ vọng, thanh khoản và tâm lý thị trường.
🌊 Thị trường không chỉ phản ứng với những gì Fed làm.
Mà nó phản ứng với những gì thị trường tin rằng Fed sẽ làm.
#FOMC #Bitcoin #Crypto #Fed #BinanceSquare
Cristore-trading
·1 lượt thích
·107 lượt xem
TinFed
88,928 lượt xem
432 đang thảo luận
EarningsSeason
89,041 lượt xem
842 đang thảo luận