Binance Square
cryptoHenryYT
33 Bài đăng

cryptoHenryYT

0 Đang theo dõi
29 Người theo dõi
16 Đã thích
Bài đăng
·
--
Bài viết
Xem bản dịch
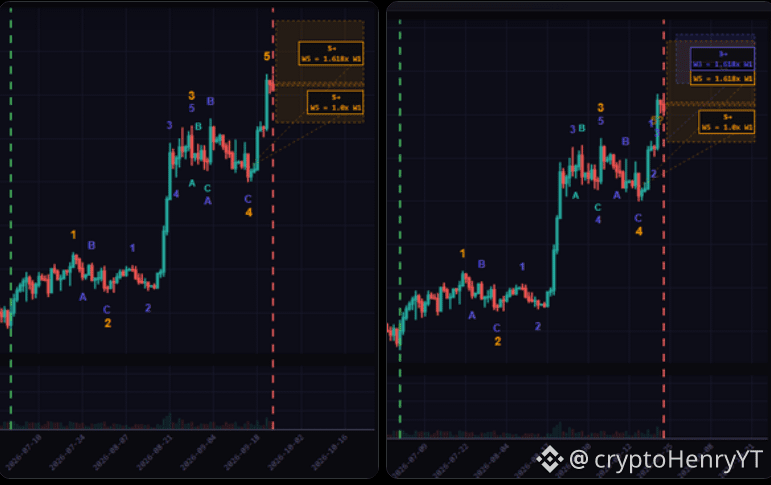
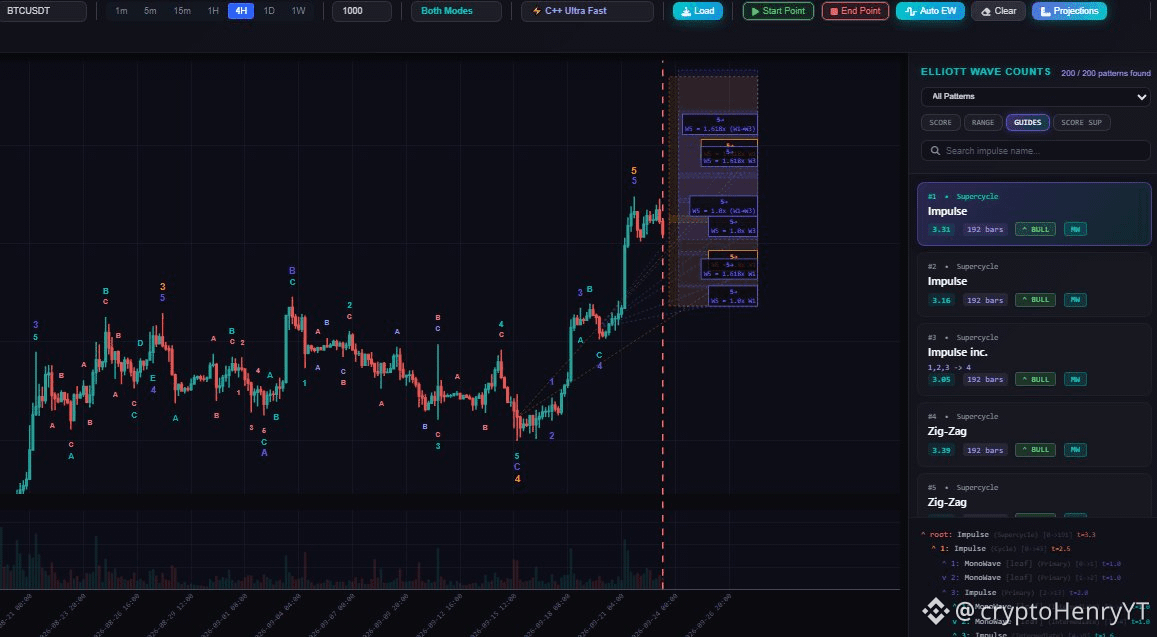
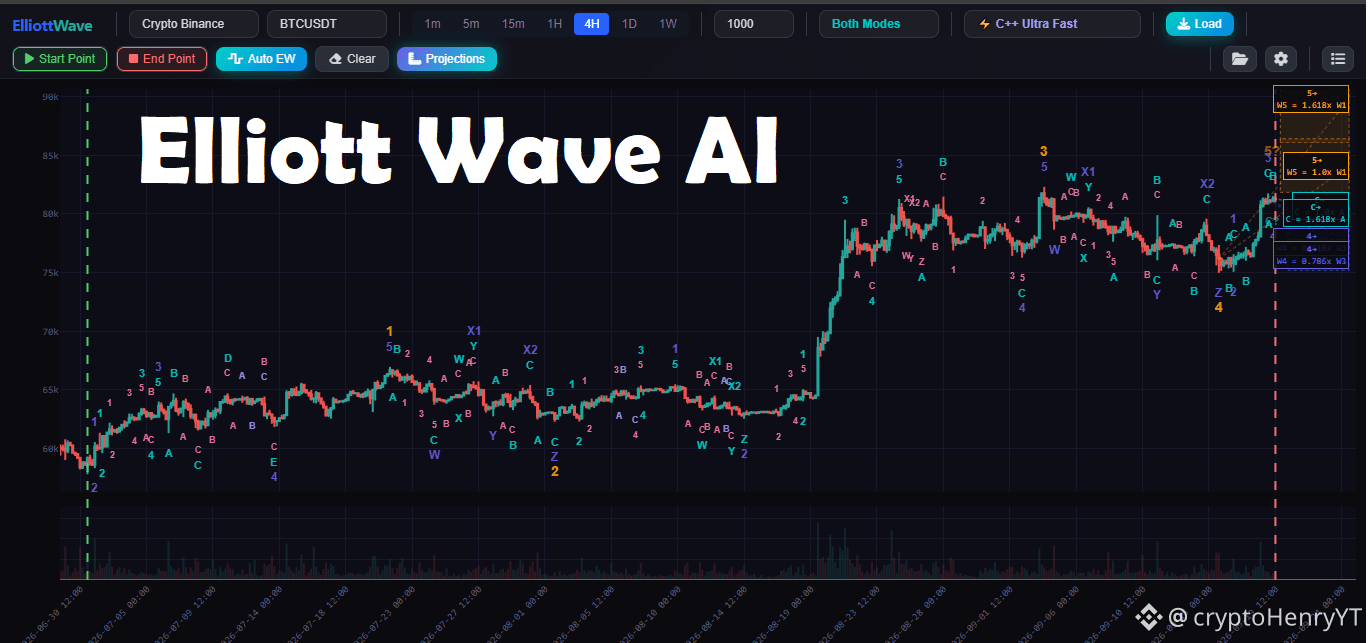
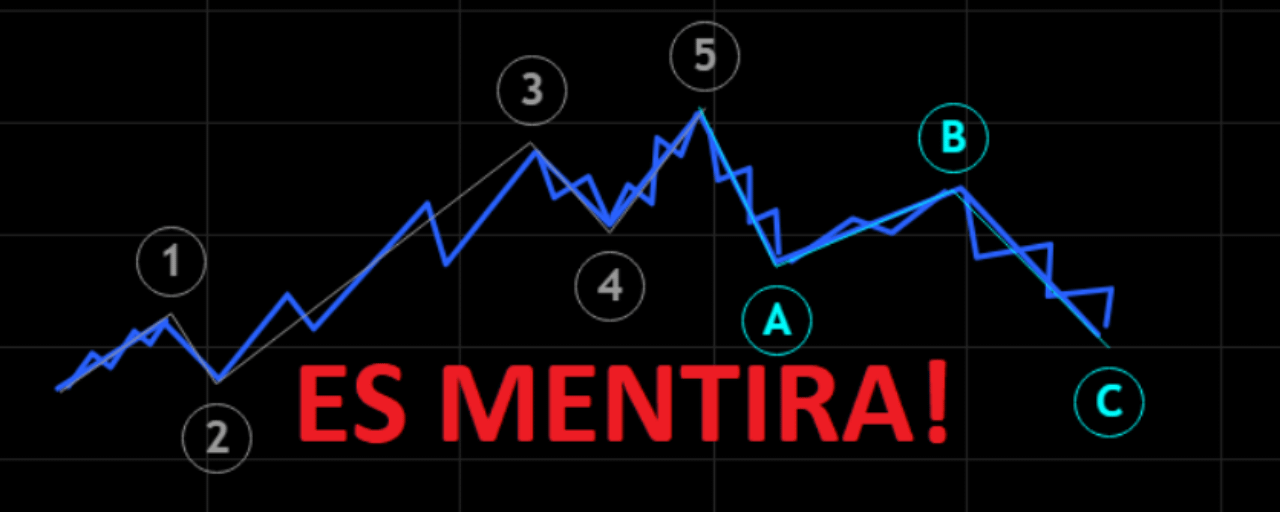
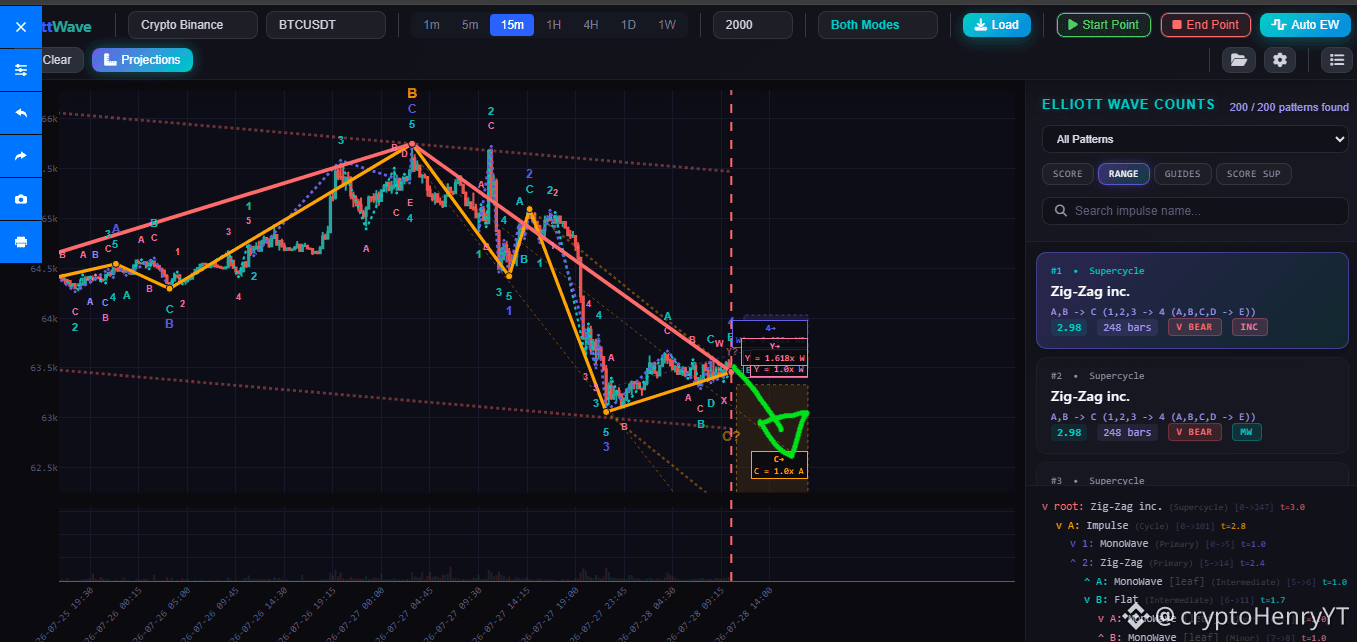
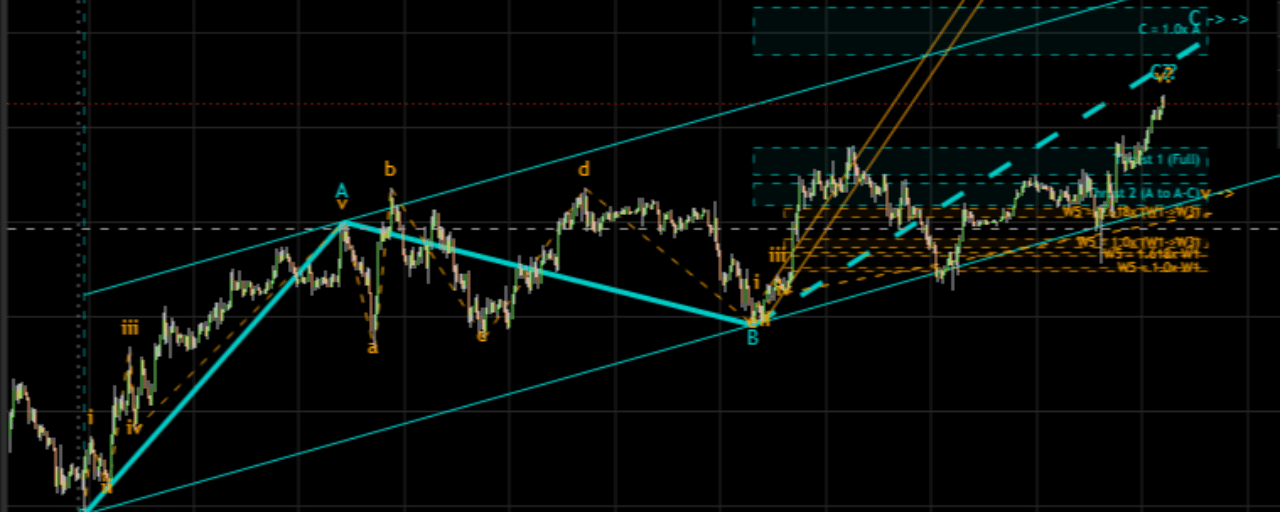
Elliott Wave IndicatorThe Elliott Wave Engine is an automated pattern-recognition and charting assistant for TradingView. It is designed to scan, decompose, and model price structures in real-time based on an adaptation of the rules and guidelines of Elliott Wave Theory. By automating the mechanical calculation of wave structures, the engine assists analysts in identifying potential wave counts. It provides a structured, rule-based approach to mapping alternative scenarios and tracking historical wave proportions, serving as a decision-support utility for price action analysis. KEY FEATURES 1. Multi-Degree Fractal Analysis Analyzes price structures recursively across up to 5 levels of depth (Parent Waves, Sub-waves, Sub-sub-waves, etc.) to give you a complete view of the market's fractal hierarchy based on EW theory. 2. Comprehensive Pattern Decoder Identifies a wide range of Elliott Wave structures: - Impulsive Patterns: Standard Impulses, Contracting Diagonals, and Expanding Diagonals. - Corrective Patterns: Simple Zig-Zags, Regular Flats, Expanded Flats, Contracting Triangles, Running Triangles, Double/Triple Zig-Zags, and complex WXY/WXYXZ Combinations. 3. Automated Scoring & Selection Panel Maintains up to 20 alternate wave counts, sorting them dynamically based on strictness rules . Each count is evaluated against structural behavior guidelines (such Fibonacci proportions), penalizing anomalies and elevating clean structures. 4. Dynamic Fibonacci Projections Automatically calculates and draws color-shaded Fibonacci extension/retracement target boxes on the chart for the current wave's targets (e.g., Wave 5 extensions or Wave C targets). 5. Performance Optimization Toggles (Flats and triangles are disabled by default) Allows the user to enable or disable deep multi-segment scan logic (such as nested corrective triangles and flats inside wave B or wave 4) to ensure instant chart loading and prevent execution limits. USER CONFIGURATION GUIDE The indicator settings panel is divided into four main sections: 1. General & Analysis Settings - Lookback Bars (Default: 200): The number of historical bars used on the last bar to detect swings and construct wave counts. Higher values analyze more history but increase execution load. - Swing Granularity (Default: 1): Adjusts the pivot size window to detect swings. * 1 = High granularity (picks up smaller price swings). * 3 = Medium granularity. * 5 = Low granularity (focuses only on major macro swings). - Max Analysis Degrees (Default: 2): Controls the depth of recursive sub-wave analysis (from 1 = Parent Wave only, up to 5 degrees of depth). - Detect Nested Flats & Triangles (Default: OFF): * When disabled, the engine bypasses highly complex, nested corrective scans. The engine performs faster. * When enabled, the engine performs deeply nested combinatorial searches to scan for complex patterns (e.g., flats/triangles inside wave 4 or wave B). Note: This may cause slowness or runtime limits (>500ms execution times) on complex charts. - Select Count Number (Default: 1): Choose which alternate Elliott Wave count (from 1st best down to 20th) to visualize on the chart. 2. Filtering & Scoring Settings - Analysis Mode (Default: Both): Choose whether to scan for "Complete" counts, "Incomplete" (ongoing) counts, or "Both" types. - Sorting Mode (Default: Score): Choose how alternate counts are ranked and presented in the on-screen panel: * Score: Sorts strictly by rules and guidelines adherence and quality score. * Range: Prioritizes patterns by time range amplitude. * Guides: Prioritizes counts adhering closest to guideline proportions. * Score Sup: Uses a specialized scoring filter for major extensions. - Score Calc Mode (Default: Average): Controls how parent and sub-wave scores are combined: * Average: Computes the average score across all degrees. * Legacy Cumulative: Sums scores with a multiplier. * Rewarding Parent: Rewards counts where sub-waves validate clean structures. 3. Visual & Style Settings - Degree 1 (Parent) to Degree 5 Colors: Custom color tokens for drawing lines and labels of each respective wave degree on your chart. - Parent Wave Line Width: Line thickness for the main parent waves. - Sub-wave Line Width: Line thickness for all nested sub-waves. - Show Wave Circle Backgrounds (Default: OFF): Toggles solid circle background overlays behind labels for higher contrast. - Show Wave Lines (Default: ON): Toggles drawing connecting lines between wave pivots. - Wave Label Size (Default: normal): Adjusts font size of wave labels (tiny, small, normal, large). - Label Spacing Multiplier (Default: 1.5): Multiplier to offset wave labels vertically from swing high/low points to prevent visual overlap. 4. Fibonacci Projections settings - Show Fibonacci Projections (Default: ON): Toggles drawing the shaded Fibonacci target projection boxes on the chart. - Show Projection Labels (Default: ON): Toggles displaying the text label (e.g. "W5 = 1.618x W1") inside the target boxes. Disabling this leaves clean color boxes. - Max Projections to Calculate (Default: 10): Limits projection calculation to the top N ranking alternate counts to optimize performance. - Projection Box Half-Height % (Default: 8.0%): Controls the height of the projection boxes as a percentage of the wave amplitude. --- How to use: 1. First, use a measurement tool to calculate how many bars you want the EW engine to analyze. It is highly recommended to start your analysis from a major high or low point on the chart. Additionally, if you need to analyze 700, 800, or more historical bars, it is standard practice to switch to a higher timeframe and use a lower lookback value instead of running counts over 500+ bars on a lower timeframe. 2. Next, configure that number in the indicator. For example, if your measurement shows 613 bars, you can set it to 620 in the indicator settings (default is 200). 3. Changing the 'Select Count Number' will allow you to cycle through different alternative wave counts. It is the user's responsibility to understand wave guidelines and rules to identify which count best fits the context. 4. By default, the Analysis Mode is set to 'Both', which often ranks a complete count as the top result. However, it is valuable to visualize what would happen if the pattern is still ongoing (incomplete). By switching the Analysis Mode to 'Incomplete', you can discover other interesting alternative counts. In these counts, the final wave label is marked with an arrow (e.g. `->`), indicating that the structure is still in progress under that scenario. 5. Switching between different 'Score Calc Mode' and 'Sorting Mode' configurations provides other powerful ways to explore different alternative counts. TROUBLESHOOTING & COMMON ISSUES If the indicator experiences execution limit errors, timeouts, or fails to render, try adjusting the settings using one or more of the following solutions: Increase the "Swing Granularity" value to reduce the number of minor pivots analyzed.Decrease the number of bars in "Lookback Bars" (closer to 200).Decrease the "Max Analysis Degrees" (e.g. set it to 1 or 2).Ensure "Detect Nested Flats & Triangles" is disabled (unchecked). Major Updates: Incomplete Count Labels at Projection Prices: The final label of incomplete counts ending in "->" (for example, 5->) is now displayed directly at the projection price level. Added 'Done' Column: This column indicates the completion progress of a pattern. Added 'Done 2nd' Column: This column indicates the completion progress of the last wave within a second-level child pattern. Note: The more '+' symbols a 'Done' column has, the stronger the evidence found by the indicator that the pattern is complete. Both "Done" columns can be hidden by toggling the "Hide Done Column" option in the settings. Channeling Updates: Added channeling for Double Zig-Zags, Impulses, and Zig-Zags. While this does not cover all channeling guidelines, it is designed to aid visual understanding and is also used to calculate the "Done" and "Done 2nd" columns. Custom Start Time Input: On startup, the indicator will now prompt you to click on the chart to select exactly where the count should begin. This feature can be disabled via the "Use Custom Start Time" setting. If disabled, the indicator will default to using the "Lookback Bars" setting value. Added 'Enable Price Retracement Penalties' Option: When enabled, stricter price retracement checks (e.g., invalidating <5%, penalties for <23.6%) become active. Added 'Enable Time Duration Penalties' Option: When enabled, time-based duration checks between waves (e.g., A+B vs. C in Zig-Zags, 2 vs. 4 in Impulses) become active. Added 'Allow Wave 4 Triangle Overlap into Wave 1' Option: When enabled, Wave A of a Triangle in Wave 4 is allowed to overlap into the territory of Wave 1 (incurring a -2.0 score penalty). When disabled, any such overlap strictly invalidates the count. Added 'Base Channel Strict Rule (0-2 Line)' Option: When enabled, if the price closes beyond the 0-2 baseline between Wave 2 and Wave 5, the Impulse count is strictly invalidated. When disabled, it only applies a -2.0 score penalty. Added 'Disable Base Channel Guideline' Option: When enabled, the baseline guideline check (0-2 line) is completely disabled, meaning there will be no score penalties and no count invalidations related to it. Post-Triangle Thrust Projections: Added new projections for post-triangle thrusts. IMPORTANT NOTES & DISCLAIMER ----------------------------- This engine calculates wave structures mathematically using hard-coded mathematical rules and guidelines (e.g., Fibonacci ratios, swing pivot relationships, and directional checks). It does not implement all guidelines (such as "The Right Look"). It is designed to assist Elliott Wave analysts and should be used as a decision-support tool, not as standalone financial advice.

Elliott Wave Indicator

The Elliott Wave Engine is an automated pattern-recognition and charting assistant for TradingView. It is designed to scan, decompose, and model price structures in real-time based on an adaptation of the rules and guidelines of Elliott Wave Theory.
By automating the mechanical calculation of wave structures, the engine assists analysts in identifying potential wave counts. It provides a structured, rule-based approach to mapping alternative scenarios and tracking historical wave proportions, serving as a decision-support utility for price action analysis.
KEY FEATURES
1. Multi-Degree Fractal Analysis
Analyzes price structures recursively across up to 5 levels of depth (Parent Waves, Sub-waves, Sub-sub-waves, etc.) to give you a complete view of the market's fractal hierarchy based on EW theory.
2. Comprehensive Pattern Decoder
Identifies a wide range of Elliott Wave structures:
- Impulsive Patterns: Standard Impulses, Contracting Diagonals, and Expanding Diagonals.
- Corrective Patterns: Simple Zig-Zags, Regular Flats, Expanded Flats, Contracting Triangles, Running Triangles, Double/Triple Zig-Zags, and complex WXY/WXYXZ Combinations.
3. Automated Scoring & Selection Panel
Maintains up to 20 alternate wave counts, sorting them dynamically based on strictness rules . Each count is evaluated against structural behavior guidelines (such Fibonacci proportions), penalizing anomalies and elevating clean structures.
4. Dynamic Fibonacci Projections
Automatically calculates and draws color-shaded Fibonacci extension/retracement target boxes on the chart for the current wave's targets (e.g., Wave 5 extensions or Wave C targets).
5. Performance Optimization Toggles (Flats and triangles are disabled by default)
Allows the user to enable or disable deep multi-segment scan logic (such as nested corrective triangles and flats inside wave B or wave 4) to ensure instant chart loading and prevent execution limits.
USER CONFIGURATION GUIDE
The indicator settings panel is divided into four main sections:
1. General & Analysis Settings
- Lookback Bars (Default: 200): The number of historical bars used on the last bar to detect swings and construct wave counts. Higher values analyze more history but increase execution load.
- Swing Granularity (Default: 1): Adjusts the pivot size window to detect swings.
* 1 = High granularity (picks up smaller price swings).
* 3 = Medium granularity.
* 5 = Low granularity (focuses only on major macro swings).
- Max Analysis Degrees (Default: 2): Controls the depth of recursive sub-wave analysis (from 1 = Parent Wave only, up to 5 degrees of depth).
- Detect Nested Flats & Triangles (Default: OFF):
* When disabled, the engine bypasses highly complex, nested corrective scans. The engine performs faster.
* When enabled, the engine performs deeply nested combinatorial searches to scan for complex patterns (e.g., flats/triangles inside wave 4 or wave B). Note: This may cause slowness or runtime limits (>500ms execution times) on complex charts.
- Select Count Number (Default: 1): Choose which alternate Elliott Wave count (from 1st best down to 20th) to visualize on the chart.
2. Filtering & Scoring Settings
- Analysis Mode (Default: Both): Choose whether to scan for "Complete" counts, "Incomplete" (ongoing) counts, or "Both" types.
- Sorting Mode (Default: Score): Choose how alternate counts are ranked and presented in the on-screen panel:
* Score: Sorts strictly by rules and guidelines adherence and quality score.
* Range: Prioritizes patterns by time range amplitude.
* Guides: Prioritizes counts adhering closest to guideline proportions.
* Score Sup: Uses a specialized scoring filter for major extensions.
- Score Calc Mode (Default: Average): Controls how parent and sub-wave scores are combined:
* Average: Computes the average score across all degrees.
* Legacy Cumulative: Sums scores with a multiplier.
* Rewarding Parent: Rewards counts where sub-waves validate clean structures.
3. Visual & Style Settings
- Degree 1 (Parent) to Degree 5 Colors: Custom color tokens for drawing lines and labels of each respective wave degree on your chart.
- Parent Wave Line Width: Line thickness for the main parent waves.
- Sub-wave Line Width: Line thickness for all nested sub-waves.
- Show Wave Circle Backgrounds (Default: OFF): Toggles solid circle background overlays behind labels for higher contrast.
- Show Wave Lines (Default: ON): Toggles drawing connecting lines between wave pivots.
- Wave Label Size (Default: normal): Adjusts font size of wave labels (tiny, small, normal, large).
- Label Spacing Multiplier (Default: 1.5): Multiplier to offset wave labels vertically from swing high/low points to prevent visual overlap.
4. Fibonacci Projections settings
- Show Fibonacci Projections (Default: ON): Toggles drawing the shaded Fibonacci target projection boxes on the chart.
- Show Projection Labels (Default: ON): Toggles displaying the text label (e.g. "W5 = 1.618x W1") inside the target boxes. Disabling this leaves clean color boxes.
- Max Projections to Calculate (Default: 10): Limits projection calculation to the top N ranking alternate counts to optimize performance.
- Projection Box Half-Height % (Default: 8.0%): Controls the height of the projection boxes as a percentage of the wave amplitude.
---
How to use:
1. First, use a measurement tool to calculate how many bars you want the EW engine to analyze. It is highly recommended to start your analysis from a major high or low point on the chart. Additionally, if you need to analyze 700, 800, or more historical bars, it is standard practice to switch to a higher timeframe and use a lower lookback value instead of running counts over 500+ bars on a lower timeframe.
2. Next, configure that number in the indicator. For example, if your measurement shows 613 bars, you can set it to 620 in the indicator settings (default is 200).
3. Changing the 'Select Count Number' will allow you to cycle through different alternative wave counts. It is the user's responsibility to understand wave guidelines and rules to identify which count best fits the context.
4. By default, the Analysis Mode is set to 'Both', which often ranks a complete count as the top result. However, it is valuable to visualize what would happen if the pattern is still ongoing (incomplete). By switching the Analysis Mode to 'Incomplete', you can discover other interesting alternative counts. In these counts, the final wave label is marked with an arrow (e.g. `->`), indicating that the structure is still in progress under that scenario.
5. Switching between different 'Score Calc Mode' and 'Sorting Mode' configurations provides other powerful ways to explore different alternative counts.
TROUBLESHOOTING & COMMON ISSUES
If the indicator experiences execution limit errors, timeouts, or fails to render, try adjusting the settings using one or more of the following solutions:
Increase the "Swing Granularity" value to reduce the number of minor pivots analyzed.Decrease the number of bars in "Lookback Bars" (closer to 200).Decrease the "Max Analysis Degrees" (e.g. set it to 1 or 2).Ensure "Detect Nested Flats & Triangles" is disabled (unchecked).
Major Updates:
Incomplete Count Labels at Projection Prices: The final label of incomplete counts ending in "->" (for example, 5->) is now displayed directly at the projection price level.
Added 'Done' Column: This column indicates the completion progress of a pattern.
Added 'Done 2nd' Column: This column indicates the completion progress of the last wave within a second-level child pattern.
Note: The more '+' symbols a 'Done' column has, the stronger the evidence found by the indicator that the pattern is complete. Both "Done" columns can be hidden by toggling the "Hide Done Column" option in the settings.
Channeling Updates: Added channeling for Double Zig-Zags, Impulses, and Zig-Zags. While this does not cover all channeling guidelines, it is designed to aid visual understanding and is also used to calculate the "Done" and "Done 2nd" columns.
Custom Start Time Input: On startup, the indicator will now prompt you to click on the chart to select exactly where the count should begin. This feature can be disabled via the "Use Custom Start Time" setting. If disabled, the indicator will default to using the "Lookback Bars" setting value.
Added 'Enable Price Retracement Penalties' Option: When enabled, stricter price retracement checks (e.g., invalidating <5%, penalties for <23.6%) become active.
Added 'Enable Time Duration Penalties' Option: When enabled, time-based duration checks between waves (e.g., A+B vs. C in Zig-Zags, 2 vs. 4 in Impulses) become active.
Added 'Allow Wave 4 Triangle Overlap into Wave 1' Option: When enabled, Wave A of a Triangle in Wave 4 is allowed to overlap into the territory of Wave 1 (incurring a -2.0 score penalty). When disabled, any such overlap strictly invalidates the count.
Added 'Base Channel Strict Rule (0-2 Line)' Option: When enabled, if the price closes beyond the 0-2 baseline between Wave 2 and Wave 5, the Impulse count is strictly invalidated. When disabled, it only applies a -2.0 score penalty.
Added 'Disable Base Channel Guideline' Option: When enabled, the baseline guideline check (0-2 line) is completely disabled, meaning there will be no score penalties and no count invalidations related to it.
Post-Triangle Thrust Projections: Added new projections for post-triangle thrusts.
IMPORTANT NOTES & DISCLAIMER
-----------------------------
This engine calculates wave structures mathematically using hard-coded mathematical rules and guidelines (e.g., Fibonacci ratios, swing pivot relationships, and directional checks). It does not implement all guidelines (such as "The Right Look"). It is designed to assist Elliott Wave analysts and should be used as a decision-support tool, not as standalone financial advice.
·
--
Tăng giá
Xem bản dịch
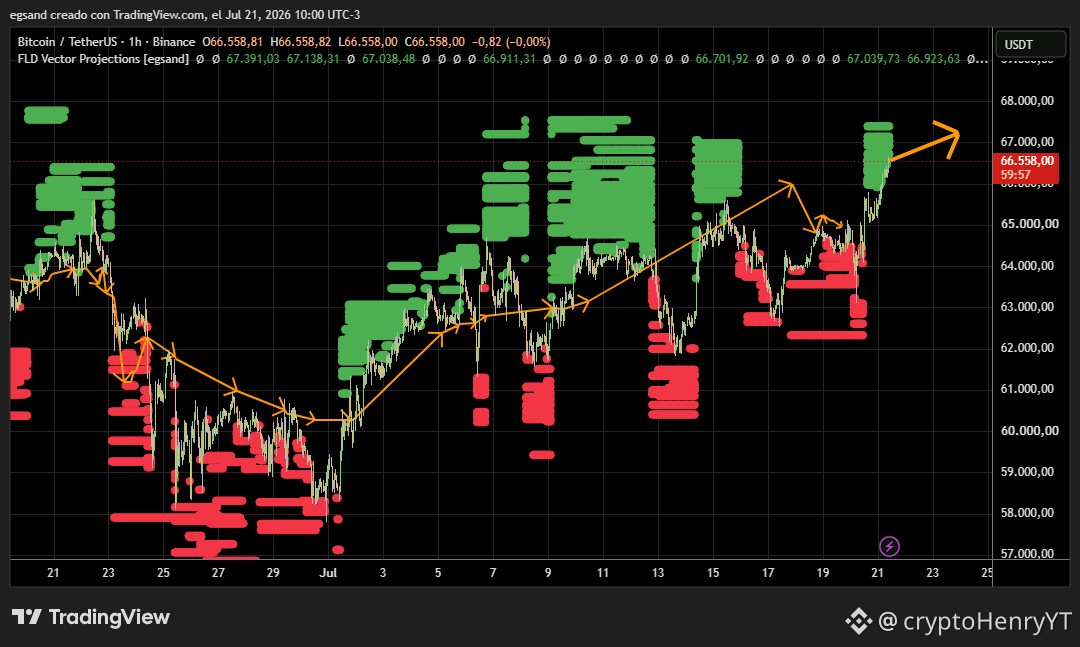
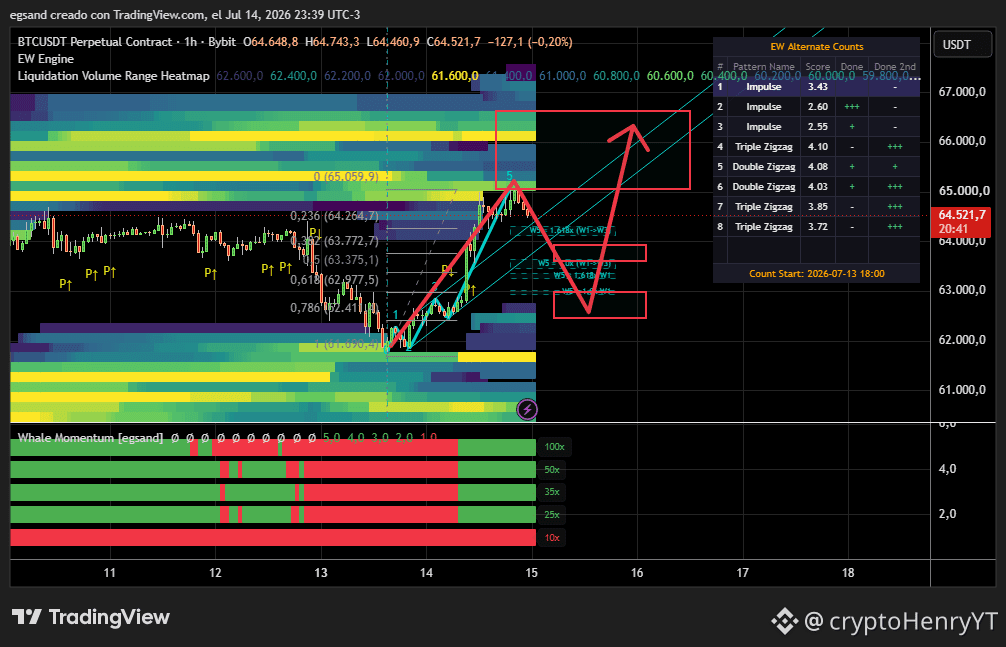
$BTC Rumbo a los 67500 en 1H Whale momentum Alcista {future}(BTCUSDT)
$BTC Rumbo a los 67500 en 1H Whale momentum Alcista
·
--
Tăng giá
Xem bản dịch
·
--
Tăng giá
Xem bản dịch
·
--
Tăng giá
Xem bản dịch
Xem bản dịch
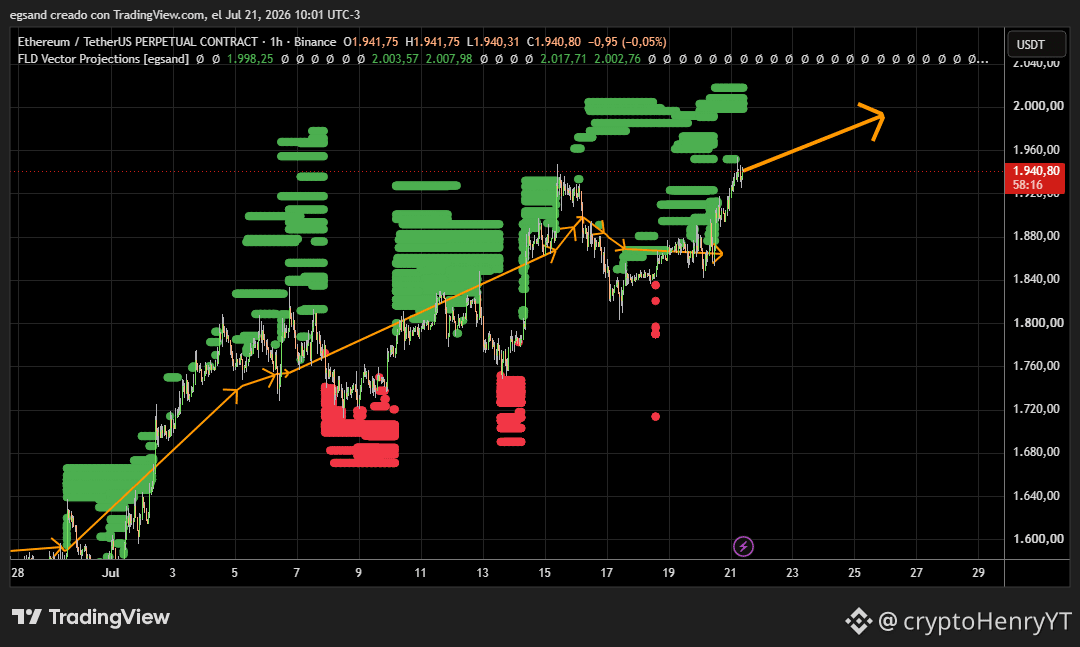
$ETH 1H
$ETH 1H
Xem bản dịch
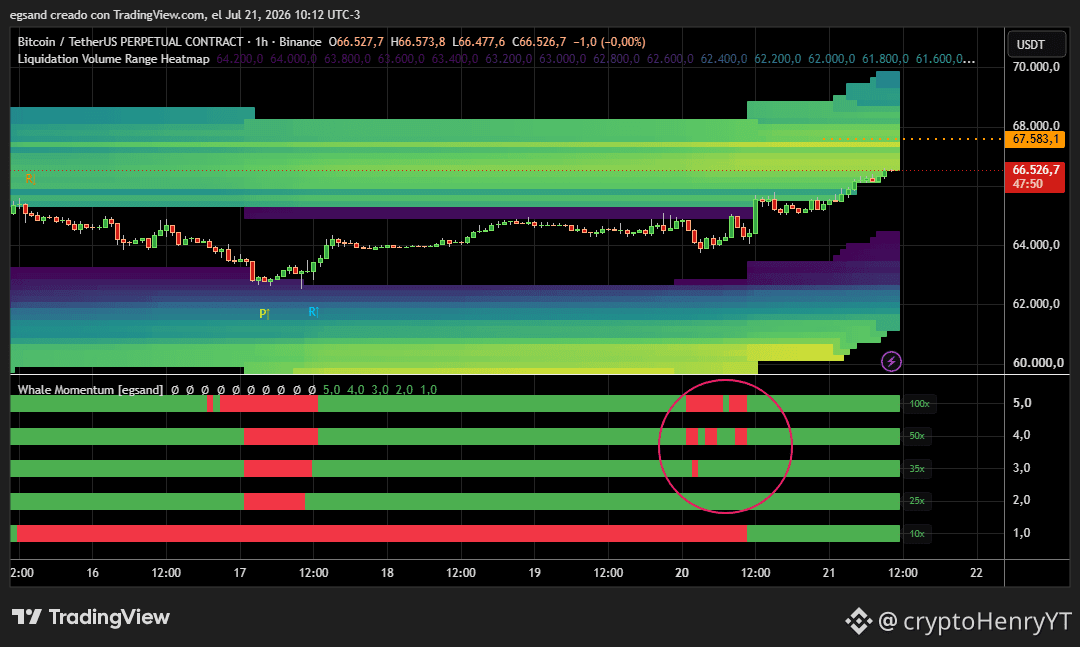
$BTC Bitcoin Zonas de Liquidación Mapa de Calor | Análisis
$BTC Khu vực Thanh lý cho chúng ta biết Bitcoin = Tăng giá {future}(BTCUSDT)
$BTC Khu vực Thanh lý cho chúng ta biết Bitcoin = Tăng giá
$SOL Sự đảo ngược mạnh mẽ của Solana dựa trên một Cụm Fibonacci #ElliottWaveTheory
$SOL Sự đảo ngược mạnh mẽ của Solana dựa trên một Cụm Fibonacci
#ElliottWaveTheory
cryptoHenryYT
·
--
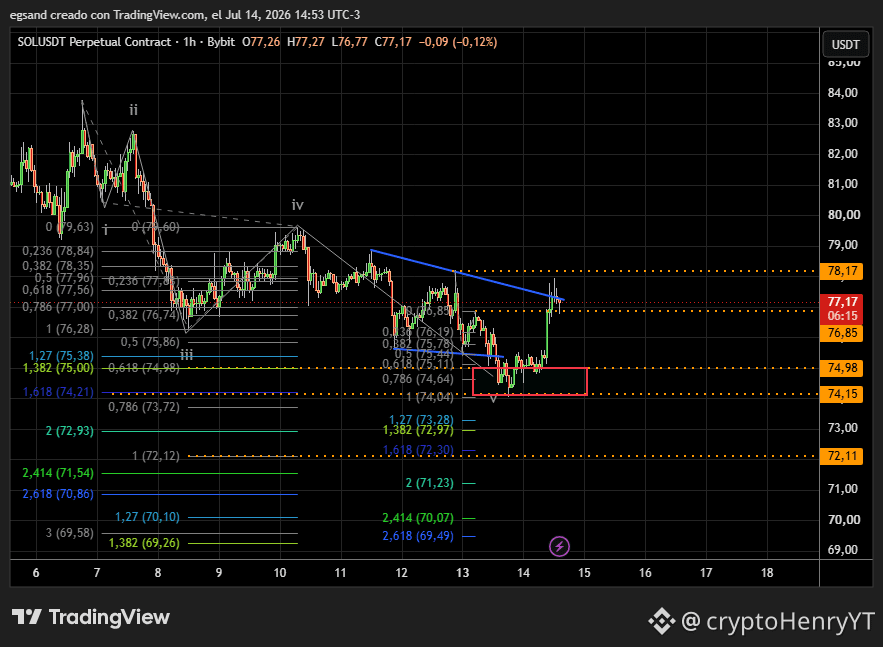
Tinh chỉnh thêm một chút việc đếm Sóng Elliott #Elliottwave #ElliottWaveTheory của $SOL Tạo một Cụm Fibonacci.
·
--
Giảm giá
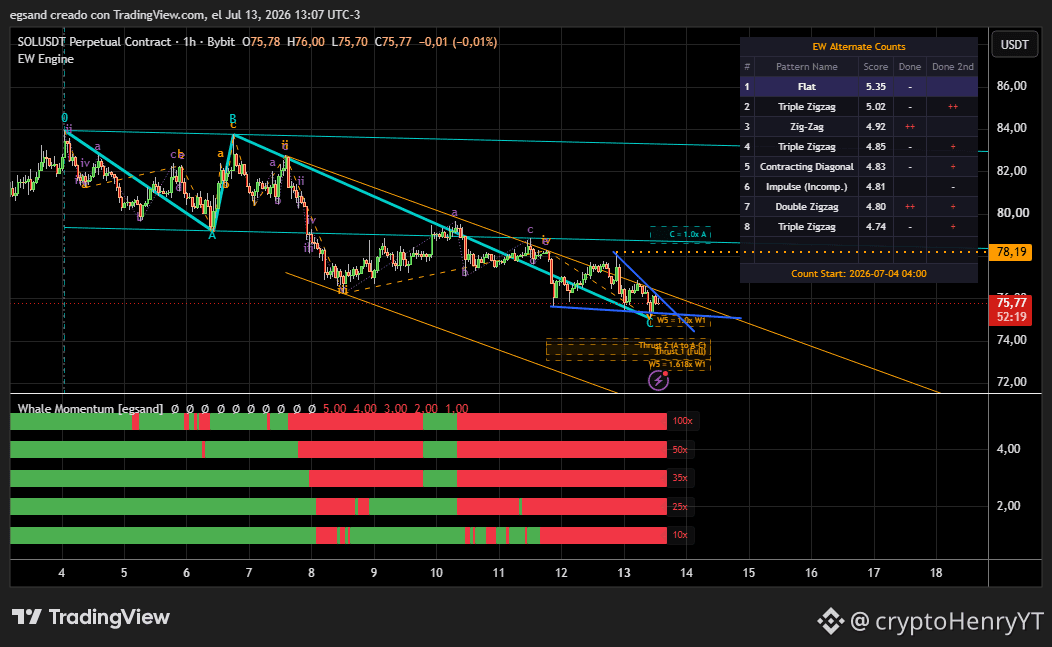
$SOL Rất thú vị, Solana dường như đang tạo ra sóng 5 Đang co lại (Contracting) dạng đường chéo kết thúc, cần thêm bằng chứng trên mức 78.2, nhưng cũng có thể là một chuỗi 1,2 giảm giá và giá sẽ còn giảm thêm. Solana đang ở tình huống then chốt, hành động giá trong vài giờ tới sẽ làm rõ cách đếm đúng. Trong cả hai trường hợp, 78.2 có vẻ là một mức quan trọng cần theo dõi. {future}(SOLUSDT)
$SOL Rất thú vị, Solana dường như đang tạo ra sóng 5 Đang co lại (Contracting) dạng đường chéo kết thúc, cần thêm bằng chứng trên mức 78.2, nhưng cũng có thể là một chuỗi 1,2 giảm giá và giá sẽ còn giảm thêm. Solana đang ở tình huống then chốt, hành động giá trong vài giờ tới sẽ làm rõ cách đếm đúng. Trong cả hai trường hợp, 78.2 có vẻ là một mức quan trọng cần theo dõi.
·
--
Giảm giá
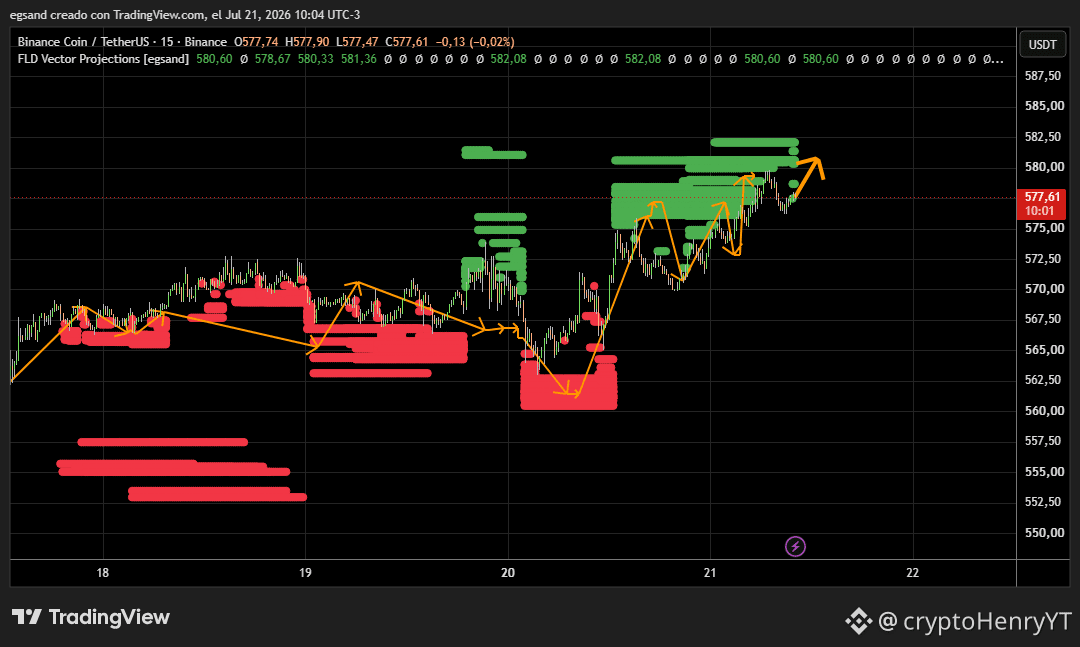
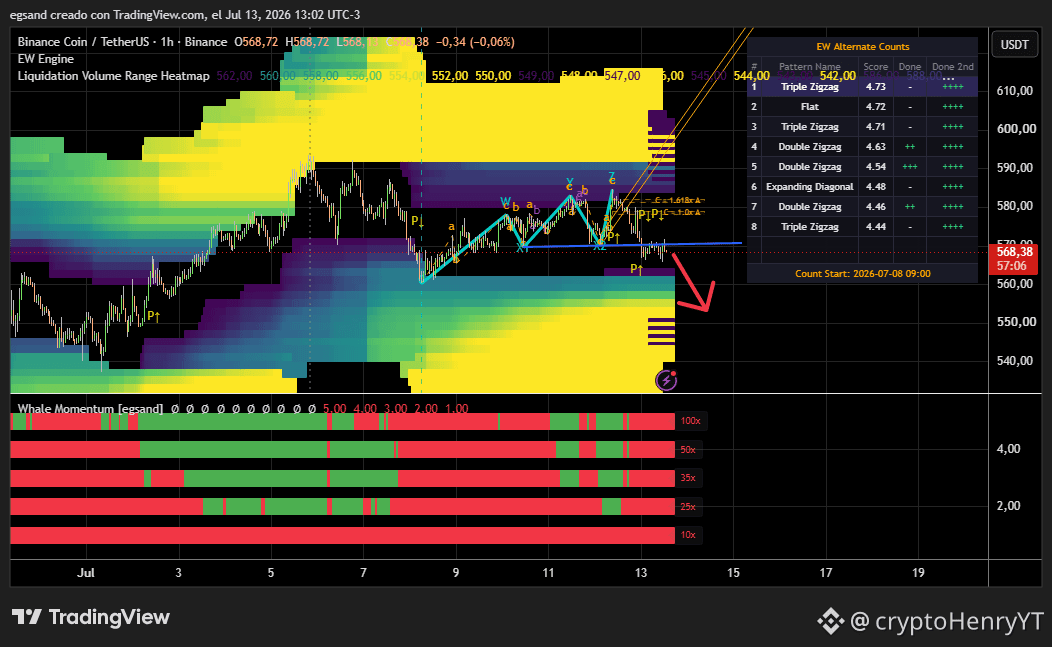
$BNB Chúng ta là những người theo phe giảm giá. Bạn bè. Trông không ổn cho Binance Coin. Có nhiều sự hội tụ theo hướng giảm giá. {future}(BNBUSDT)
$BNB Chúng ta là những người theo phe giảm giá. Bạn bè. Trông không ổn cho Binance Coin. Có nhiều sự hội tụ theo hướng giảm giá.
·
--
Giảm giá
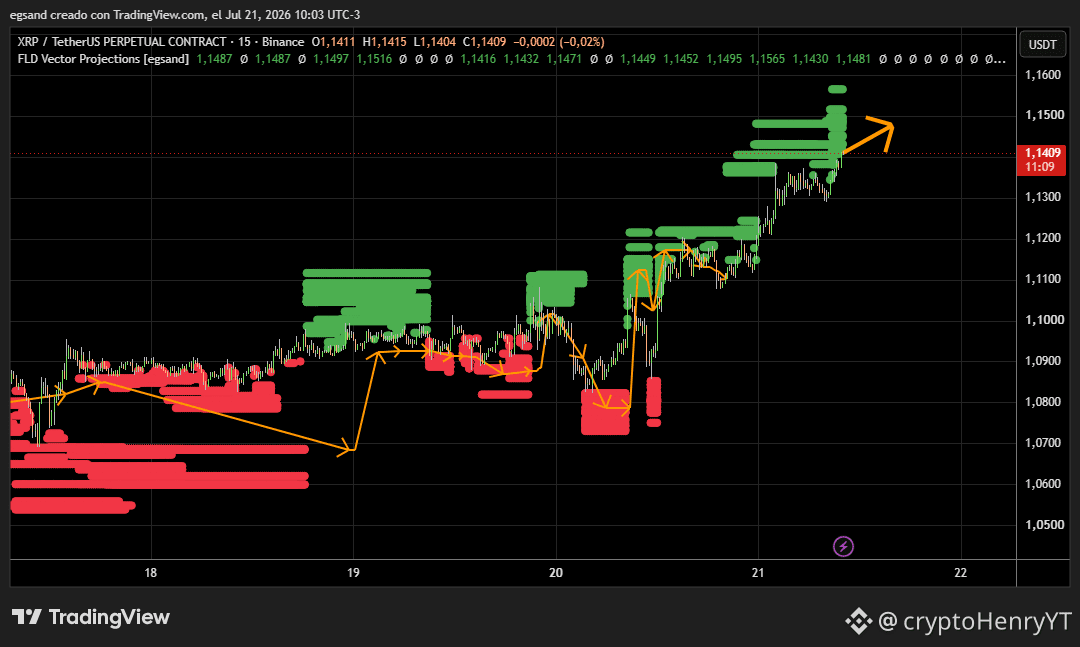
$XRP Đã đến ngày XRPUSDT thanh lý về mức 1.05 và 1.02 ? Sắp tới một mức -5% ? {future}(XRPUSDT)
$XRP
Đã đến ngày XRPUSDT thanh lý về mức 1.05 và 1.02 ? Sắp tới một mức -5% ?
$BTC {future}(BTCUSDT) Bitcoin Vùng thanh lý tăng giá nhưng Whale Momentum lại cho thấy xu hướng giảm.
$BTC
Bitcoin Vùng thanh lý tăng giá nhưng Whale Momentum lại cho thấy xu hướng giảm.
$XRP XRPUSDT Đếm Sóng Elliott
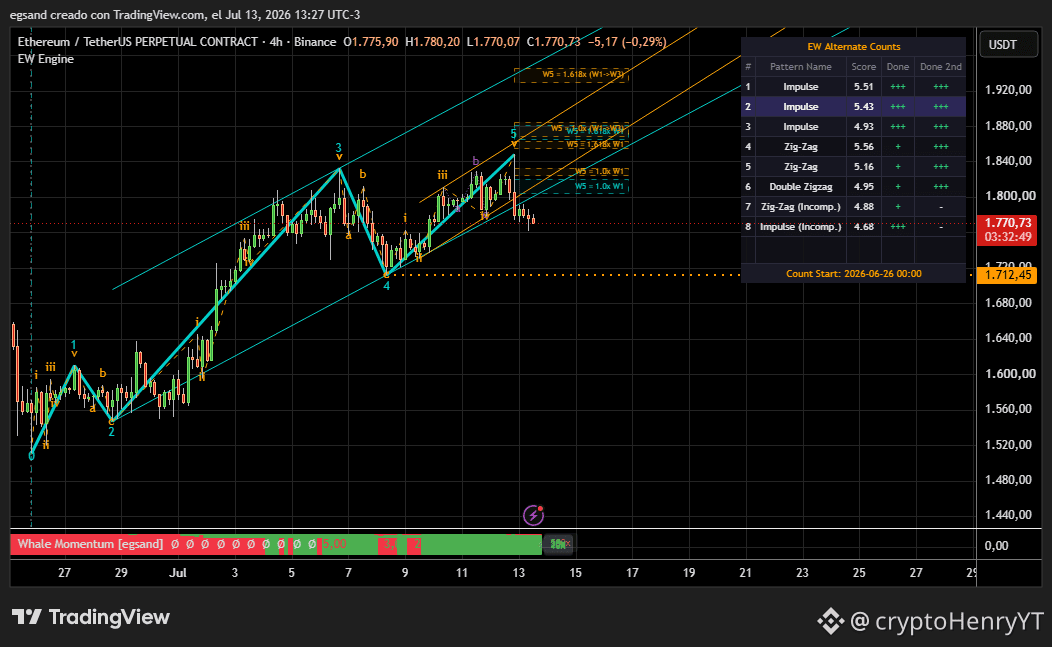
Đếm sóng Elliott ETHUSDT Ethereum Việc phá vỡ bên dưới 1712 có thể cho thấy rằng chúng ta đang ở trong phần đếm zig-zag thay vì xung động
Đếm sóng Elliott ETHUSDT Ethereum

Việc phá vỡ bên dưới 1712 có thể cho thấy rằng chúng ta đang ở trong phần đếm zig-zag thay vì xung động
Đếm Sóng Elliott Bitcoin khung 4 giờ
Phân Tích Sóng Elliott Bitcoin 24-04-2025$BTC  #Elliottwave #indicator BTC-1D Sóng Elliott Sóng Elliott BTC-4H BTC 4H trông như một cái double zigzag gần hoàn thành, nhưng sóng C cuối không giống như sóng xung lực, nên mình sẽ chỉ cho bạn một số tính toán thay thế.Tính toán zigzag BTC-4HMột cái zigzag đang phát triển, nhưng sóng C thì quá dài so với sóng A, nên mình sẽ chỉ cho bạn một tính toán xung lực như là một tính toán có khả năng xảy ra hơn.Tính toán xung lực BTC-4HVì nó vẫn có vẻ là một xung lực năm sóng chưa hoàn chỉnh, một số chuyển động tăng vẫn có thể xảy ra. Nếu phá vỡ dưới mức thấp 73,724 có thể là bằng chứng rằng xung lực đã hoàn thành.

Phân Tích Sóng Elliott Bitcoin 24-04-2025

$BTC #Elliottwave #indicator
BTC-1D Sóng Elliott
Sóng Elliott BTC-4H
BTC 4H trông như một cái double zigzag gần hoàn thành, nhưng sóng C cuối không giống như sóng xung lực, nên mình sẽ chỉ cho bạn một số tính toán thay thế.Tính toán zigzag BTC-4HMột cái zigzag đang phát triển, nhưng sóng C thì quá dài so với sóng A, nên mình sẽ chỉ cho bạn một tính toán xung lực như là một tính toán có khả năng xảy ra hơn.Tính toán xung lực BTC-4HVì nó vẫn có vẻ là một xung lực năm sóng chưa hoàn chỉnh, một số chuyển động tăng vẫn có thể xảy ra. Nếu phá vỡ dưới mức thấp 73,724 có thể là bằng chứng rằng xung lực đã hoàn thành.
Đăng nhập để khám phá thêm nội dung
Tham gia cùng người dùng tiền mã hóa toàn cầu trên Binance Square
⚡️ Nhận thông tin mới nhất và hữu ích về tiền mã hóa.
💬 Được tin cậy bởi sàn giao dịch tiền mã hóa lớn nhất thế giới.
👍 Khám phá những thông tin chuyên sâu thực tế từ những nhà sáng tạo đã xác minh.
Email / Số điện thoại
Sơ đồ trang web
Tùy chọn Cookie
Điều khoản & Điều kiện