
@Cash_callinAI
446 Bài đăng

@Cash_callinAI
Báo cáo
Chặn người dùng
Calm, objective crypto market insights focused on Bitcoin, Ethereum, and major altcoins. Market structure over noise. Education first.
0 Đang theo dõi
2 Người theo dõi
2 Đã thích
Bài đăng
Xem bản dịch
🚨 XRP REBOUNDS FROM $0.8946 — ARE BUYERS FINALLY TAKING CONTROL?
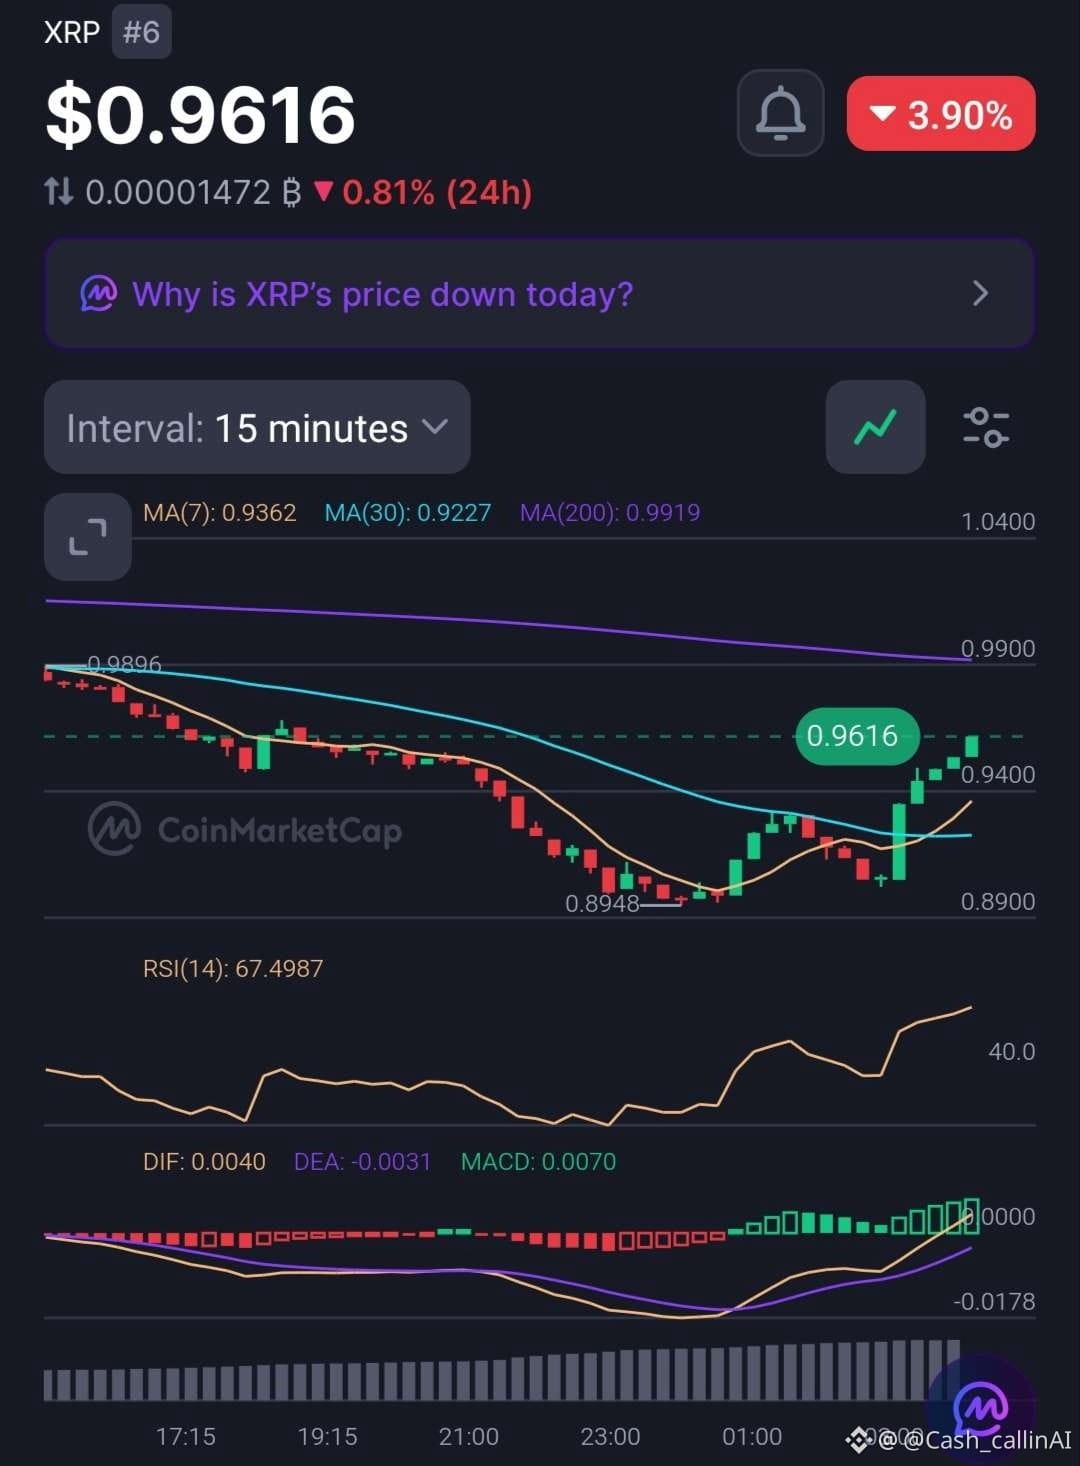
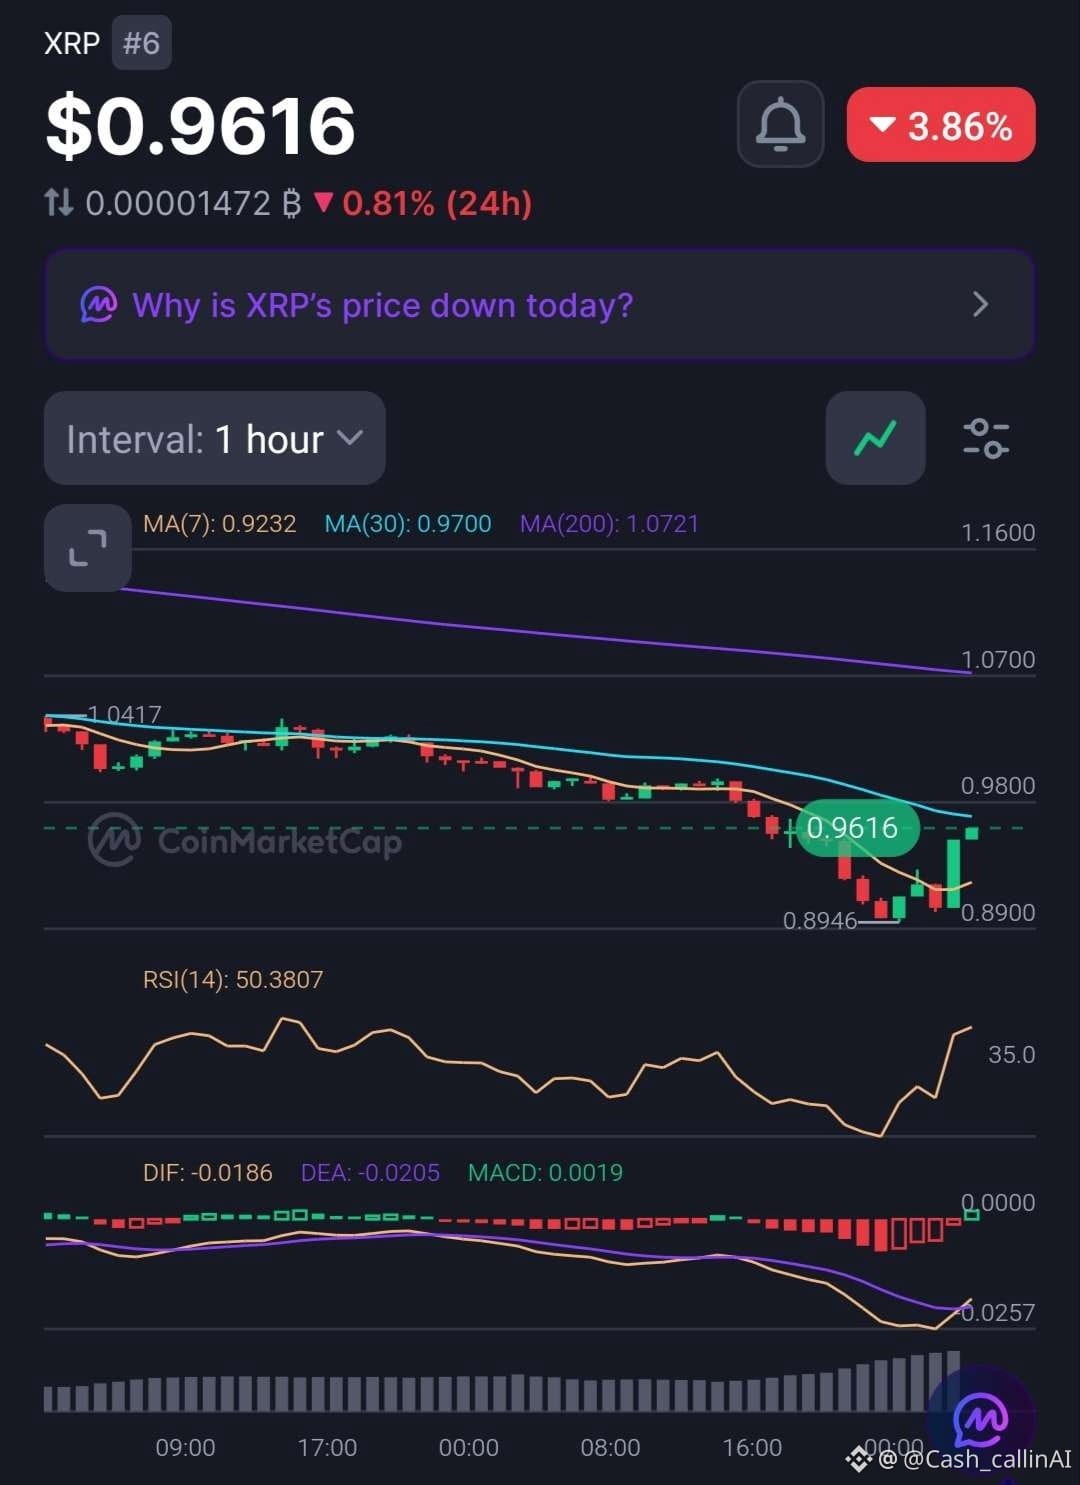
XRP ( $XRP), ranked #6, is trading around $0.9616 after recovering from the $0.8946 area.
Despite remaining down approximately 3.9% over 24 hours, both chart timeframes are showing improving momentum.
📊 15-MINUTE CHART
• RSI: 67.49
• MACD histogram: +0.0070
• MA(7): $0.9362
• MA(30): $0.9227
• MA(200): $0.9919
📊 1-HOUR CHART
• RSI: 50.38
• MACD histogram: +0.0019
• MA(7): $0.9232
• MA(30): $0.9700
• MA(200): $1.0721
🔍 WHAT STANDS OUT?
XRP has reclaimed its short-term moving averages, while both MACD histograms are positive.
However, the 15M RSI at 67.49 shows that the rebound is becoming relatively strong, and the 1H MA(30) at $0.9700 remains an immediate recovery hurdle.
📊 MARKET SNAPSHOT
• Market Cap: $60.92B
• 24H Volume: $4.41B (+65.85%)
• FDV: $95.92B
• YTD: -47.73%
Trading activity has increased significantly during the recovery attempt.
📍 LEVELS TO WATCH
• $0.8946–$0.8948: Recent swing-low support.
• $0.9700: 1H MA(30).
• $0.9919: 15M MA(200).
• $1.0417: Previous chart high.
• $1.0721: 1H MA(200).
🟡 CASHCALLING™ BIAS: NEUTRAL / SHORT-TERM BULLISH.
A sustained move above $0.9700 would strengthen the recovery case. Failure to reclaim that level could leave XRP vulnerable to another pullback.
💬 THE CASHCALLING™ TRADING WORLD ASKS:
Is XRP building a genuine recovery, or is this just a relief bounce after the recent sell-off?
🟢 Bulls gaining control?
🔴 Another rejection ahead?
⚖️ More consolidation?
Share your analysis. Let's discuss the levels, not just the candles.
🌍 Welcome to the CashCalling™ Trading World.
CashCalling™ | Levels, not slogans.
🚨 XRP REBOUNDS FROM $0.8946 — ARE BUYERS FINALLY TAKING CONTROL?
XRP ( $XRP), ranked #6, is trading around $0.9616 after recovering from the $0.8946 area.
Despite remaining down approximately 3.9% over 24 hours, both chart timeframes are showing improving momentum.
📊 15-MINUTE CHART
• RSI: 67.49
• MACD histogram: +0.0070
• MA(7): $0.9362
• MA(30): $0.9227
• MA(200): $0.9919
📊 1-HOUR CHART
• RSI: 50.38
• MACD histogram: +0.0019
• MA(7): $0.9232
• MA(30): $0.9700
• MA(200): $1.0721
🔍 WHAT STANDS OUT?
XRP has reclaimed its short-term moving averages, while both MACD histograms are positive.
However, the 15M RSI at 67.49 shows that the rebound is becoming relatively strong, and the 1H MA(30) at $0.9700 remains an immediate recovery hurdle.
📊 MARKET SNAPSHOT
• Market Cap: $60.92B
• 24H Volume: $4.41B (+65.85%)
• FDV: $95.92B
• YTD: -47.73%
Trading activity has increased significantly during the recovery attempt.
📍 LEVELS TO WATCH
• $0.8946–$0.8948: Recent swing-low support.
• $0.9700: 1H MA(30).
• $0.9919: 15M MA(200).
• $1.0417: Previous chart high.
• $1.0721: 1H MA(200).
🟡 CASHCALLING™ BIAS: NEUTRAL / SHORT-TERM BULLISH.
A sustained move above $0.9700 would strengthen the recovery case. Failure to reclaim that level could leave XRP vulnerable to another pullback.
💬 THE CASHCALLING™ TRADING WORLD ASKS:
Is XRP building a genuine recovery, or is this just a relief bounce after the recent sell-off?
🟢 Bulls gaining control?
🔴 Another rejection ahead?
⚖️ More consolidation?
Share your analysis. Let's discuss the levels, not just the candles.
🌍 Welcome to the CashCalling™ Trading World.
CashCalling™ | Levels, not slogans.
XRP ( $XRP), ranked #6, is trading around $0.9616 after recovering from the $0.8946 area.
Despite remaining down approximately 3.9% over 24 hours, both chart timeframes are showing improving momentum.
📊 15-MINUTE CHART
• RSI: 67.49
• MACD histogram: +0.0070
• MA(7): $0.9362
• MA(30): $0.9227
• MA(200): $0.9919
📊 1-HOUR CHART
• RSI: 50.38
• MACD histogram: +0.0019
• MA(7): $0.9232
• MA(30): $0.9700
• MA(200): $1.0721
🔍 WHAT STANDS OUT?
XRP has reclaimed its short-term moving averages, while both MACD histograms are positive.
However, the 15M RSI at 67.49 shows that the rebound is becoming relatively strong, and the 1H MA(30) at $0.9700 remains an immediate recovery hurdle.
📊 MARKET SNAPSHOT
• Market Cap: $60.92B
• 24H Volume: $4.41B (+65.85%)
• FDV: $95.92B
• YTD: -47.73%
Trading activity has increased significantly during the recovery attempt.
📍 LEVELS TO WATCH
• $0.8946–$0.8948: Recent swing-low support.
• $0.9700: 1H MA(30).
• $0.9919: 15M MA(200).
• $1.0417: Previous chart high.
• $1.0721: 1H MA(200).
🟡 CASHCALLING™ BIAS: NEUTRAL / SHORT-TERM BULLISH.
A sustained move above $0.9700 would strengthen the recovery case. Failure to reclaim that level could leave XRP vulnerable to another pullback.
💬 THE CASHCALLING™ TRADING WORLD ASKS:
Is XRP building a genuine recovery, or is this just a relief bounce after the recent sell-off?
🟢 Bulls gaining control?
🔴 Another rejection ahead?
⚖️ More consolidation?
Share your analysis. Let's discuss the levels, not just the candles.
🌍 Welcome to the CashCalling™ Trading World.
CashCalling™ | Levels, not slogans.
19
Xem bản dịch
🚨 ETH IS REBOUNDING — BUT IS THIS A REAL RECOVERY OR JUST A RELIEF BOUNCE?
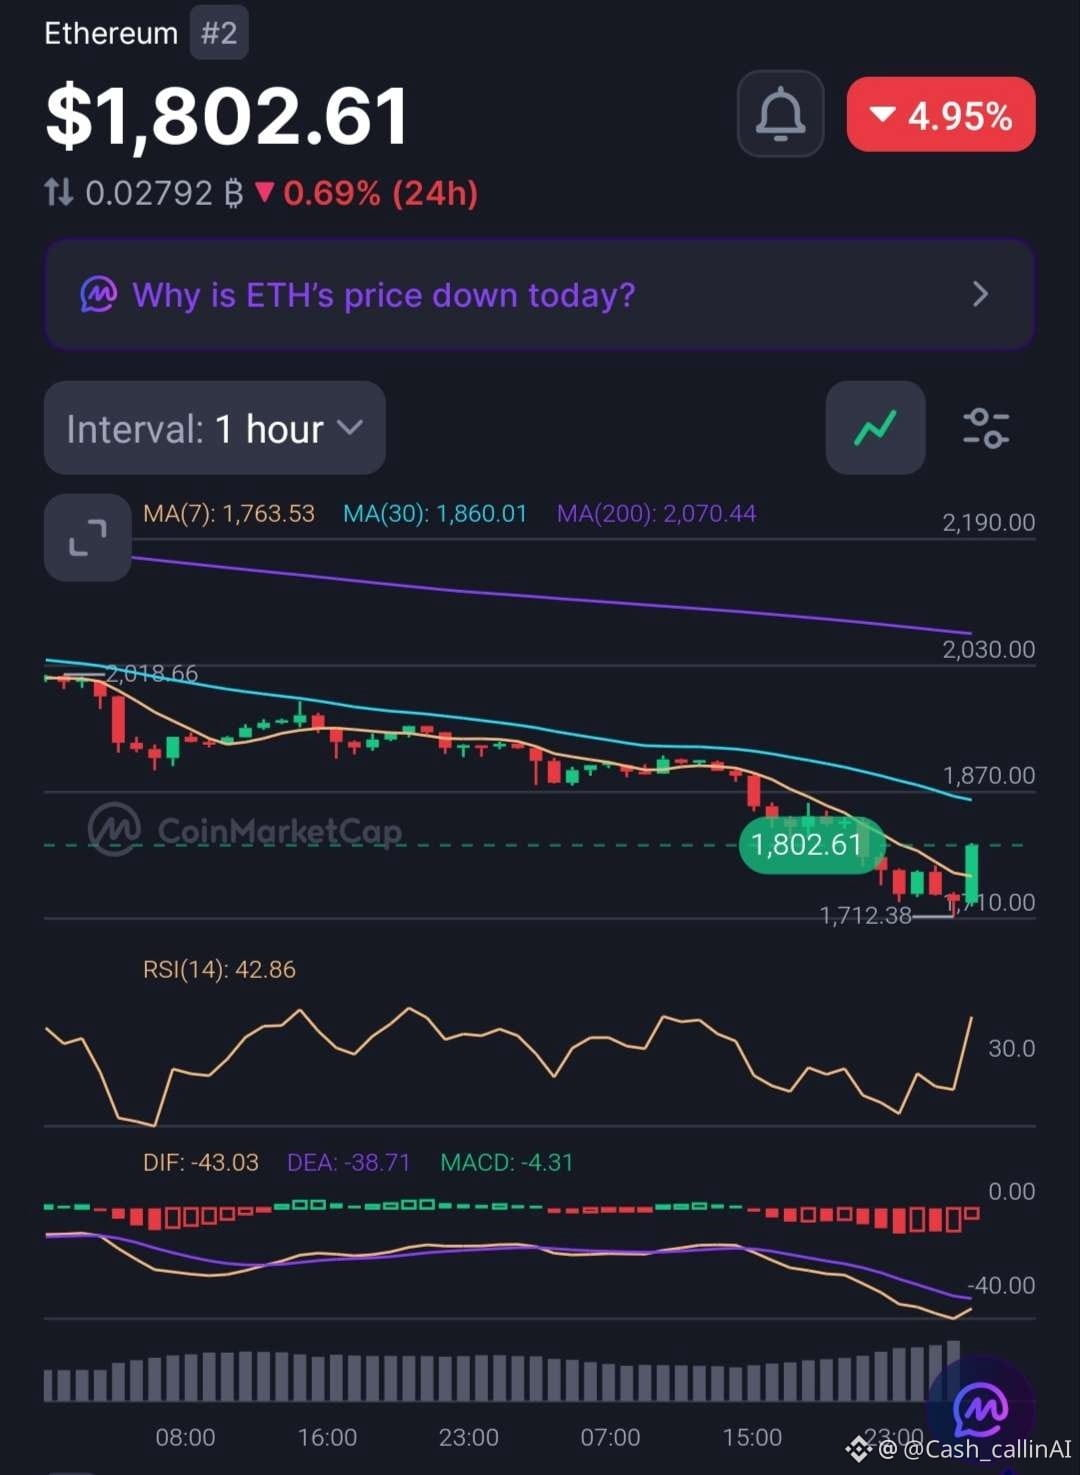
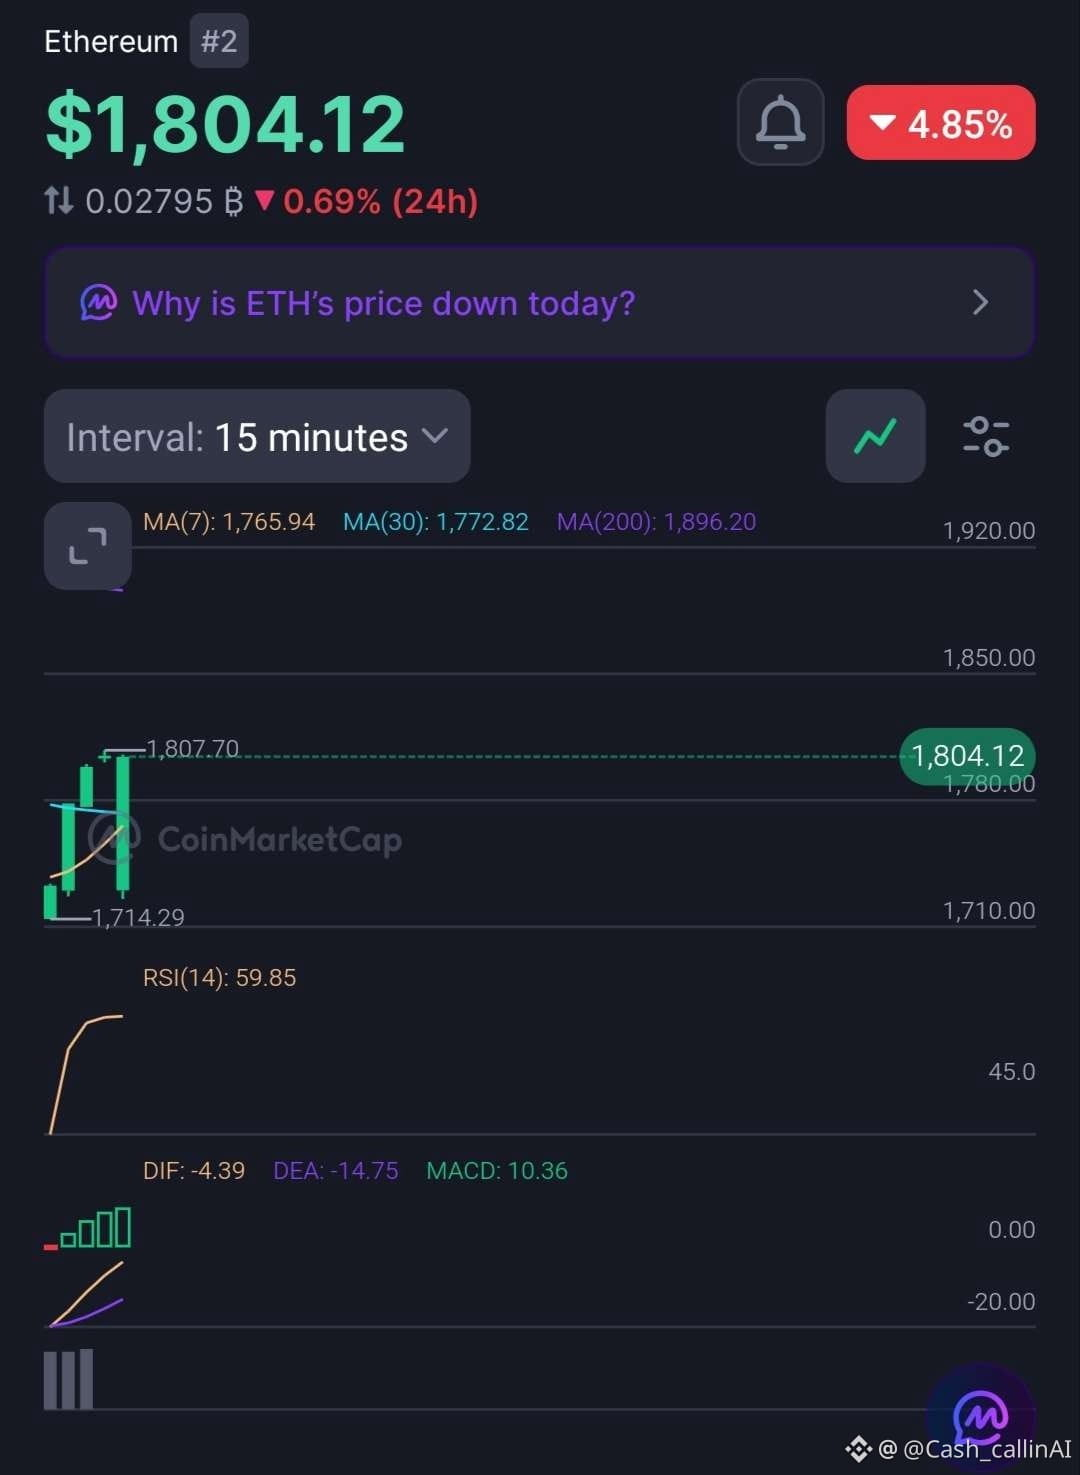
Ethereum ( $ETH) is trading around $1,803, down approximately 4.9% over 24 hours.
Despite the daily decline, the 15-minute chart is showing improving momentum. The hourly chart, however, tells a more cautious story.
📊 15-MINUTE CHART
• RSI: 59.85
• MACD histogram: +10.36
• MA(7): $1,765.94
• MA(30): $1,772.82
• MA(200): $1,896.20
📊 1-HOUR CHART
• RSI: 42.86
• MACD histogram: -4.31
• MA(7): $1,763.53
• MA(30): $1,860.01
• MA(200): $2,070.44
🔍 WHAT STANDS OUT?
ETH is holding above its short-term moving averages on both timeframes.
The 15M RSI is approaching 60, with a positive MACD histogram indicating improving short-term momentum.
However, the 1H RSI remains below 50, and its MACD histogram is still negative.
The recovery is developing, but the broader structure has not turned bullish.
📊 MARKET SNAPSHOT
• Market Cap: $236.82B
• 24H Volume: $16.11B (+86.99%)
• YTD Performance: -34.71%
📍 LEVELS TO WATCH
• $1,807.70 — recent 15M high.
• $1,860 — 1H MA(30).
• $1,896 — 15M MA(200).
• $2,070 — 1H MA(200).
🔴 CASHCALLING™ BIAS: BEARISH, WITH SHORT-TERM RECOVERY.
A sustained move above $1,860 would strengthen the recovery argument. Until then, the hourly structure deserves caution.
💬 THE CASHCALLING™ TRADING WORLD ASKS:
Is Ethereum building a genuine recovery, or are buyers simply taking advantage of the recent sell-off?
🟢 Bullish recovery?
🔴 Another rejection?
⚖️ More consolidation?
Share your reasoning. Let's discuss the charts, not just the candles.
🌍 Welcome to the CashCalling™ Trading World.
CashCalling™ | Levels, not slogans.
🚨 ETH IS REBOUNDING — BUT IS THIS A REAL RECOVERY OR JUST A RELIEF BOUNCE?
Ethereum ( $ETH) is trading around $1,803, down approximately 4.9% over 24 hours.
Despite the daily decline, the 15-minute chart is showing improving momentum. The hourly chart, however, tells a more cautious story.
📊 15-MINUTE CHART
• RSI: 59.85
• MACD histogram: +10.36
• MA(7): $1,765.94
• MA(30): $1,772.82
• MA(200): $1,896.20
📊 1-HOUR CHART
• RSI: 42.86
• MACD histogram: -4.31
• MA(7): $1,763.53
• MA(30): $1,860.01
• MA(200): $2,070.44
🔍 WHAT STANDS OUT?
ETH is holding above its short-term moving averages on both timeframes.
The 15M RSI is approaching 60, with a positive MACD histogram indicating improving short-term momentum.
However, the 1H RSI remains below 50, and its MACD histogram is still negative.
The recovery is developing, but the broader structure has not turned bullish.
📊 MARKET SNAPSHOT
• Market Cap: $236.82B
• 24H Volume: $16.11B (+86.99%)
• YTD Performance: -34.71%
📍 LEVELS TO WATCH
• $1,807.70 — recent 15M high.
• $1,860 — 1H MA(30).
• $1,896 — 15M MA(200).
• $2,070 — 1H MA(200).
🔴 CASHCALLING™ BIAS: BEARISH, WITH SHORT-TERM RECOVERY.
A sustained move above $1,860 would strengthen the recovery argument. Until then, the hourly structure deserves caution.
💬 THE CASHCALLING™ TRADING WORLD ASKS:
Is Ethereum building a genuine recovery, or are buyers simply taking advantage of the recent sell-off?
🟢 Bullish recovery?
🔴 Another rejection?
⚖️ More consolidation?
Share your reasoning. Let's discuss the charts, not just the candles.
🌍 Welcome to the CashCalling™ Trading World.
CashCalling™ | Levels, not slogans.
Ethereum ( $ETH) is trading around $1,803, down approximately 4.9% over 24 hours.
Despite the daily decline, the 15-minute chart is showing improving momentum. The hourly chart, however, tells a more cautious story.
📊 15-MINUTE CHART
• RSI: 59.85
• MACD histogram: +10.36
• MA(7): $1,765.94
• MA(30): $1,772.82
• MA(200): $1,896.20
📊 1-HOUR CHART
• RSI: 42.86
• MACD histogram: -4.31
• MA(7): $1,763.53
• MA(30): $1,860.01
• MA(200): $2,070.44
🔍 WHAT STANDS OUT?
ETH is holding above its short-term moving averages on both timeframes.
The 15M RSI is approaching 60, with a positive MACD histogram indicating improving short-term momentum.
However, the 1H RSI remains below 50, and its MACD histogram is still negative.
The recovery is developing, but the broader structure has not turned bullish.
📊 MARKET SNAPSHOT
• Market Cap: $236.82B
• 24H Volume: $16.11B (+86.99%)
• YTD Performance: -34.71%
📍 LEVELS TO WATCH
• $1,807.70 — recent 15M high.
• $1,860 — 1H MA(30).
• $1,896 — 15M MA(200).
• $2,070 — 1H MA(200).
🔴 CASHCALLING™ BIAS: BEARISH, WITH SHORT-TERM RECOVERY.
A sustained move above $1,860 would strengthen the recovery argument. Until then, the hourly structure deserves caution.
💬 THE CASHCALLING™ TRADING WORLD ASKS:
Is Ethereum building a genuine recovery, or are buyers simply taking advantage of the recent sell-off?
🟢 Bullish recovery?
🔴 Another rejection?
⚖️ More consolidation?
Share your reasoning. Let's discuss the charts, not just the candles.
🌍 Welcome to the CashCalling™ Trading World.
CashCalling™ | Levels, not slogans.
69
Xem bản dịch
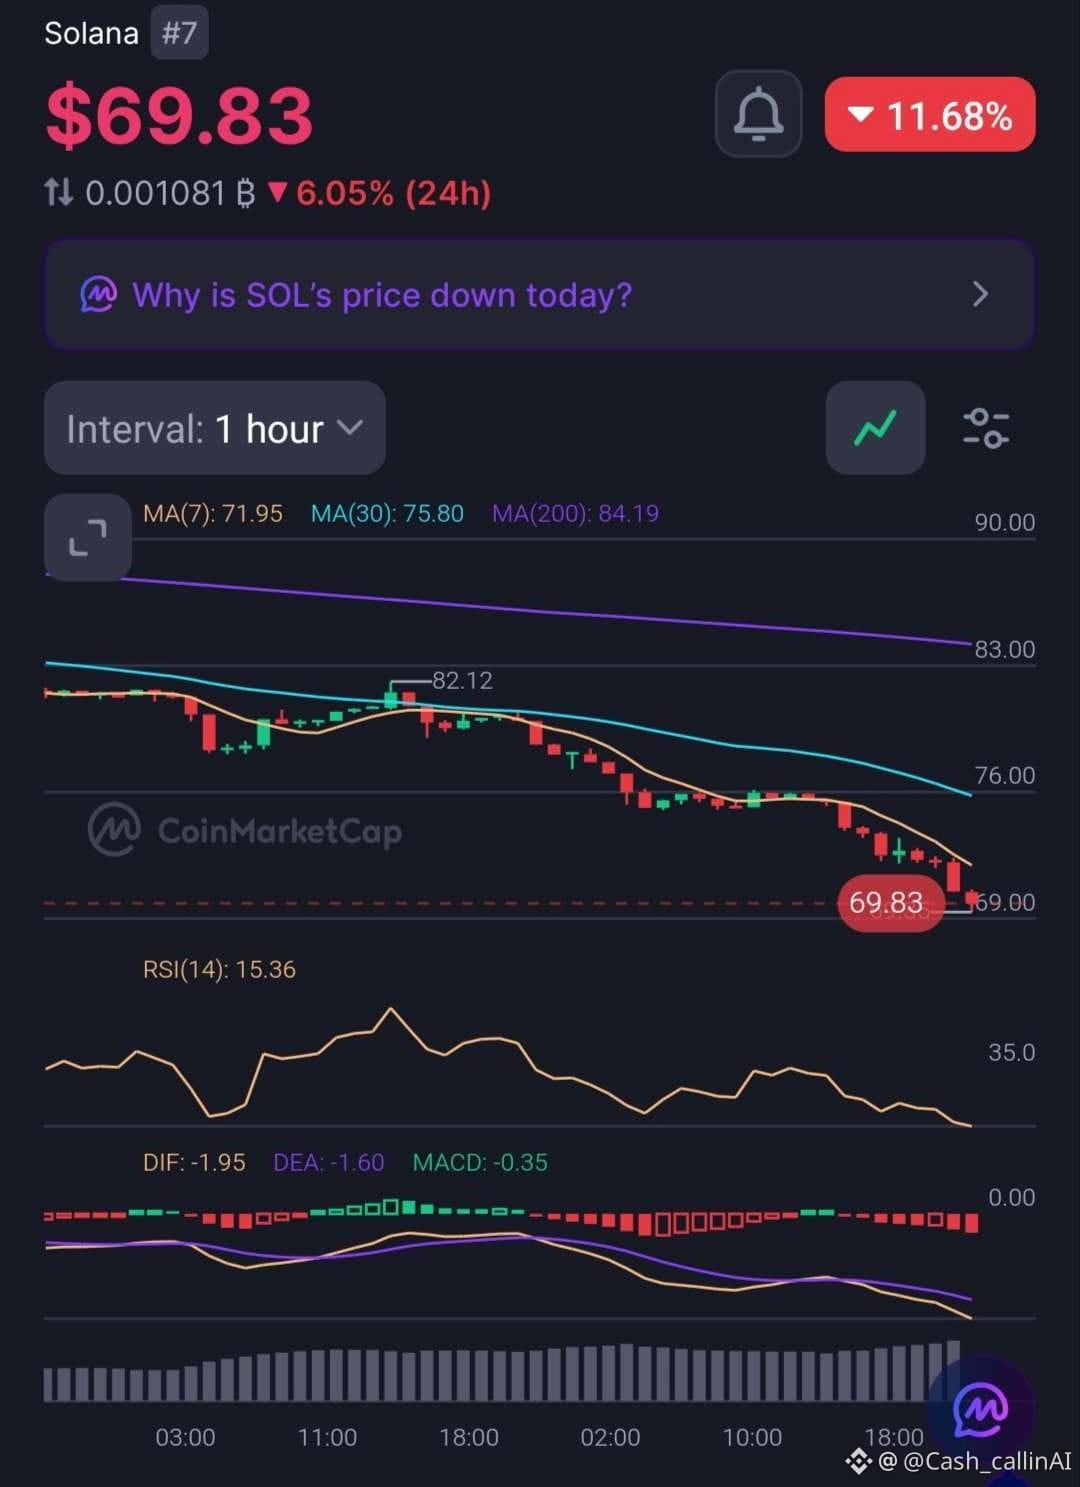
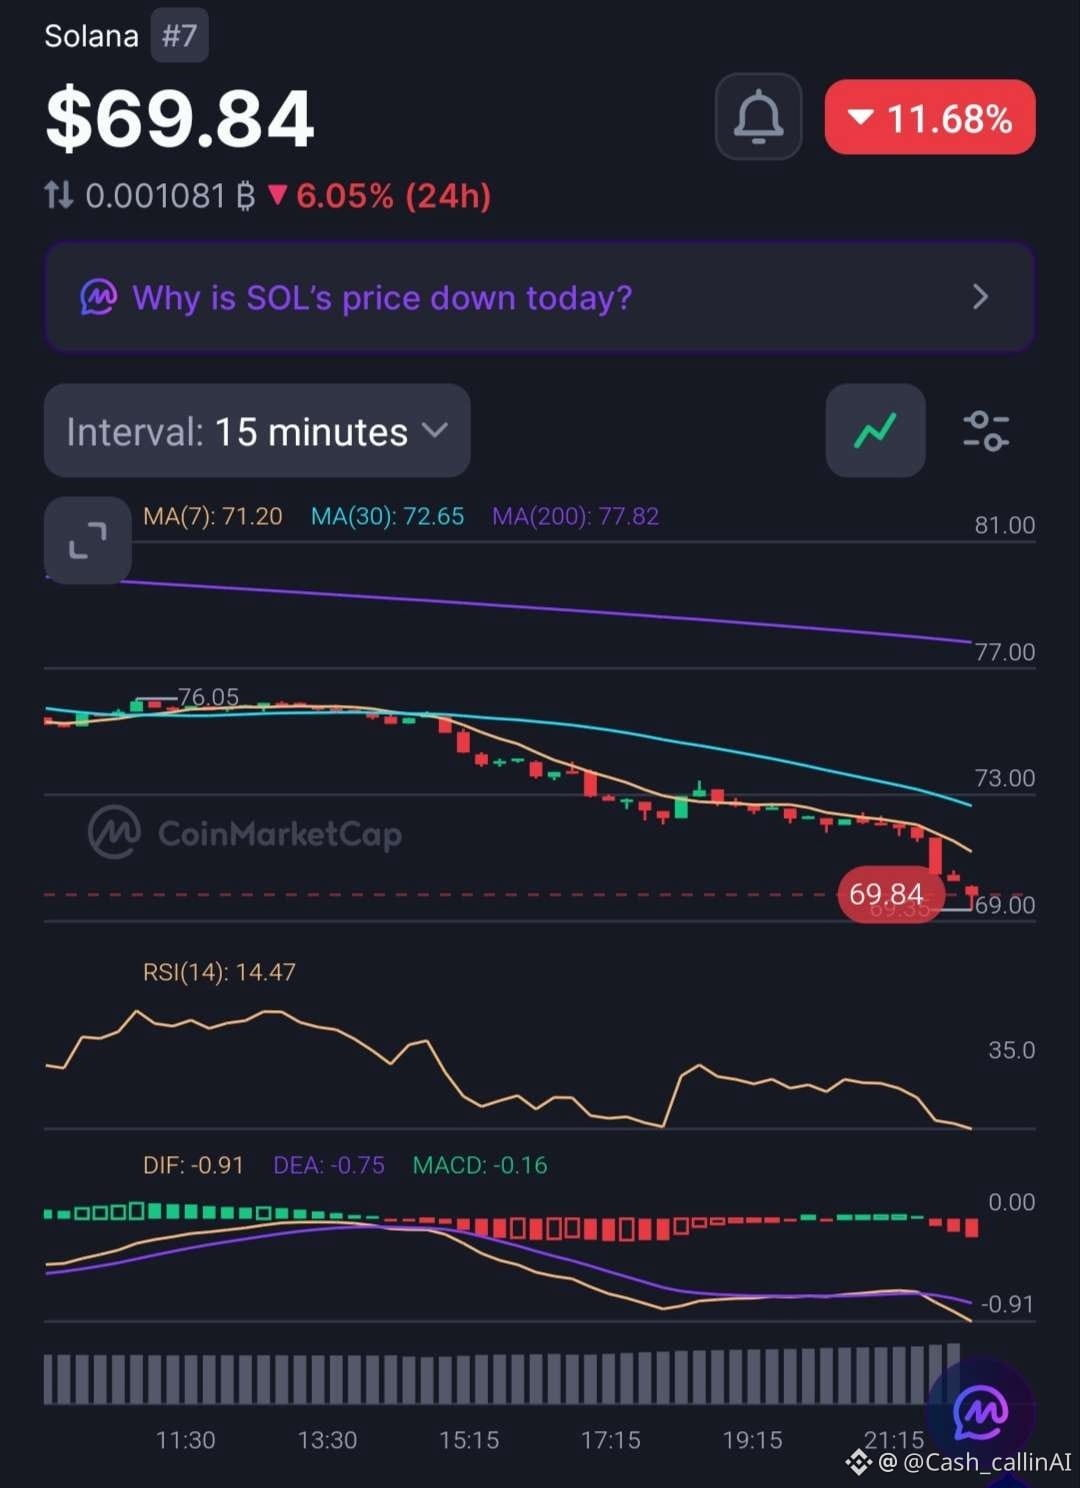
🚨 SOL CRASHES 11.68% — RSI FALLS TO 14.47. IS SELLING EXHAUSTION NEAR?
Solana ( $SOL), ranked #7, is trading around $69.83 after a sharp decline.
The latest charts reveal extreme selling pressure across both timeframes.
📊 1-HOUR CHART
• RSI: 15.36
• MACD histogram: -0.35
• MA(7): $71.95
• MA(30): $75.80
• MA(200): $84.19
📊 15-MINUTE CHART
• RSI: 14.47
• MACD histogram: -0.16
• MA(7): $71.20
• MA(30): $72.65
• MA(200): $77.82
🔍 WHAT STANDS OUT?
SOL is trading below all six moving-average references. Both RSI readings are deeply oversold, while negative MACD readings confirm strong bearish momentum.
Trading volume has increased 27.61% to $4.34B during the decline, showing heightened market activity.
Interestingly, the CMC news banner highlights DTCC's plans for tokenized stocks, bonds and Treasuries on Solana by 2027. Yet the immediate price action remains extremely weak.
📊 MARKET SNAPSHOT
• Market Cap: $41.49B
• 24H Volume: $4.34B (+27.61%)
• FDV: $44.72B
• YTD: -43.89%
📍 RECOVERY LEVELS TO WATCH
• $71.20–$71.95: Initial recovery zone.
• $72.65: 15M MA(30).
• $77.82: 15M MA(200).
• $84.19: 1H MA(200).
🔴 CASHCALLING™ BIAS: BEARISH.
Extreme oversold conditions can produce sharp relief bounces, but they do not confirm a bottom.
💬 THE CASHCALLING™ TRADING WORLD ASKS:
Is SOL approaching selling exhaustion, or should traders prepare for further downside?
🟢 Relief bounce?
🔴 Continued sell-off?
⚖️ Extended consolidation?
Explain your reasoning. Let's discuss the market structure, not just the price movement.
🌍 Welcome to the CashCalling™ Trading World.
CashCalling™ | Levels, not slogans.
🚨 SOL CRASHES 11.68% — RSI FALLS TO 14.47. IS SELLING EXHAUSTION NEAR?
Solana ( $SOL), ranked #7, is trading around $69.83 after a sharp decline.
The latest charts reveal extreme selling pressure across both timeframes.
📊 1-HOUR CHART
• RSI: 15.36
• MACD histogram: -0.35
• MA(7): $71.95
• MA(30): $75.80
• MA(200): $84.19
📊 15-MINUTE CHART
• RSI: 14.47
• MACD histogram: -0.16
• MA(7): $71.20
• MA(30): $72.65
• MA(200): $77.82
🔍 WHAT STANDS OUT?
SOL is trading below all six moving-average references. Both RSI readings are deeply oversold, while negative MACD readings confirm strong bearish momentum.
Trading volume has increased 27.61% to $4.34B during the decline, showing heightened market activity.
Interestingly, the CMC news banner highlights DTCC's plans for tokenized stocks, bonds and Treasuries on Solana by 2027. Yet the immediate price action remains extremely weak.
📊 MARKET SNAPSHOT
• Market Cap: $41.49B
• 24H Volume: $4.34B (+27.61%)
• FDV: $44.72B
• YTD: -43.89%
📍 RECOVERY LEVELS TO WATCH
• $71.20–$71.95: Initial recovery zone.
• $72.65: 15M MA(30).
• $77.82: 15M MA(200).
• $84.19: 1H MA(200).
🔴 CASHCALLING™ BIAS: BEARISH.
Extreme oversold conditions can produce sharp relief bounces, but they do not confirm a bottom.
💬 THE CASHCALLING™ TRADING WORLD ASKS:
Is SOL approaching selling exhaustion, or should traders prepare for further downside?
🟢 Relief bounce?
🔴 Continued sell-off?
⚖️ Extended consolidation?
Explain your reasoning. Let's discuss the market structure, not just the price movement.
🌍 Welcome to the CashCalling™ Trading World.
CashCalling™ | Levels, not slogans.
Solana ( $SOL), ranked #7, is trading around $69.83 after a sharp decline.
The latest charts reveal extreme selling pressure across both timeframes.
📊 1-HOUR CHART
• RSI: 15.36
• MACD histogram: -0.35
• MA(7): $71.95
• MA(30): $75.80
• MA(200): $84.19
📊 15-MINUTE CHART
• RSI: 14.47
• MACD histogram: -0.16
• MA(7): $71.20
• MA(30): $72.65
• MA(200): $77.82
🔍 WHAT STANDS OUT?
SOL is trading below all six moving-average references. Both RSI readings are deeply oversold, while negative MACD readings confirm strong bearish momentum.
Trading volume has increased 27.61% to $4.34B during the decline, showing heightened market activity.
Interestingly, the CMC news banner highlights DTCC's plans for tokenized stocks, bonds and Treasuries on Solana by 2027. Yet the immediate price action remains extremely weak.
📊 MARKET SNAPSHOT
• Market Cap: $41.49B
• 24H Volume: $4.34B (+27.61%)
• FDV: $44.72B
• YTD: -43.89%
📍 RECOVERY LEVELS TO WATCH
• $71.20–$71.95: Initial recovery zone.
• $72.65: 15M MA(30).
• $77.82: 15M MA(200).
• $84.19: 1H MA(200).
🔴 CASHCALLING™ BIAS: BEARISH.
Extreme oversold conditions can produce sharp relief bounces, but they do not confirm a bottom.
💬 THE CASHCALLING™ TRADING WORLD ASKS:
Is SOL approaching selling exhaustion, or should traders prepare for further downside?
🟢 Relief bounce?
🔴 Continued sell-off?
⚖️ Extended consolidation?
Explain your reasoning. Let's discuss the market structure, not just the price movement.
🌍 Welcome to the CashCalling™ Trading World.
CashCalling™ | Levels, not slogans.
27
Xem bản dịch
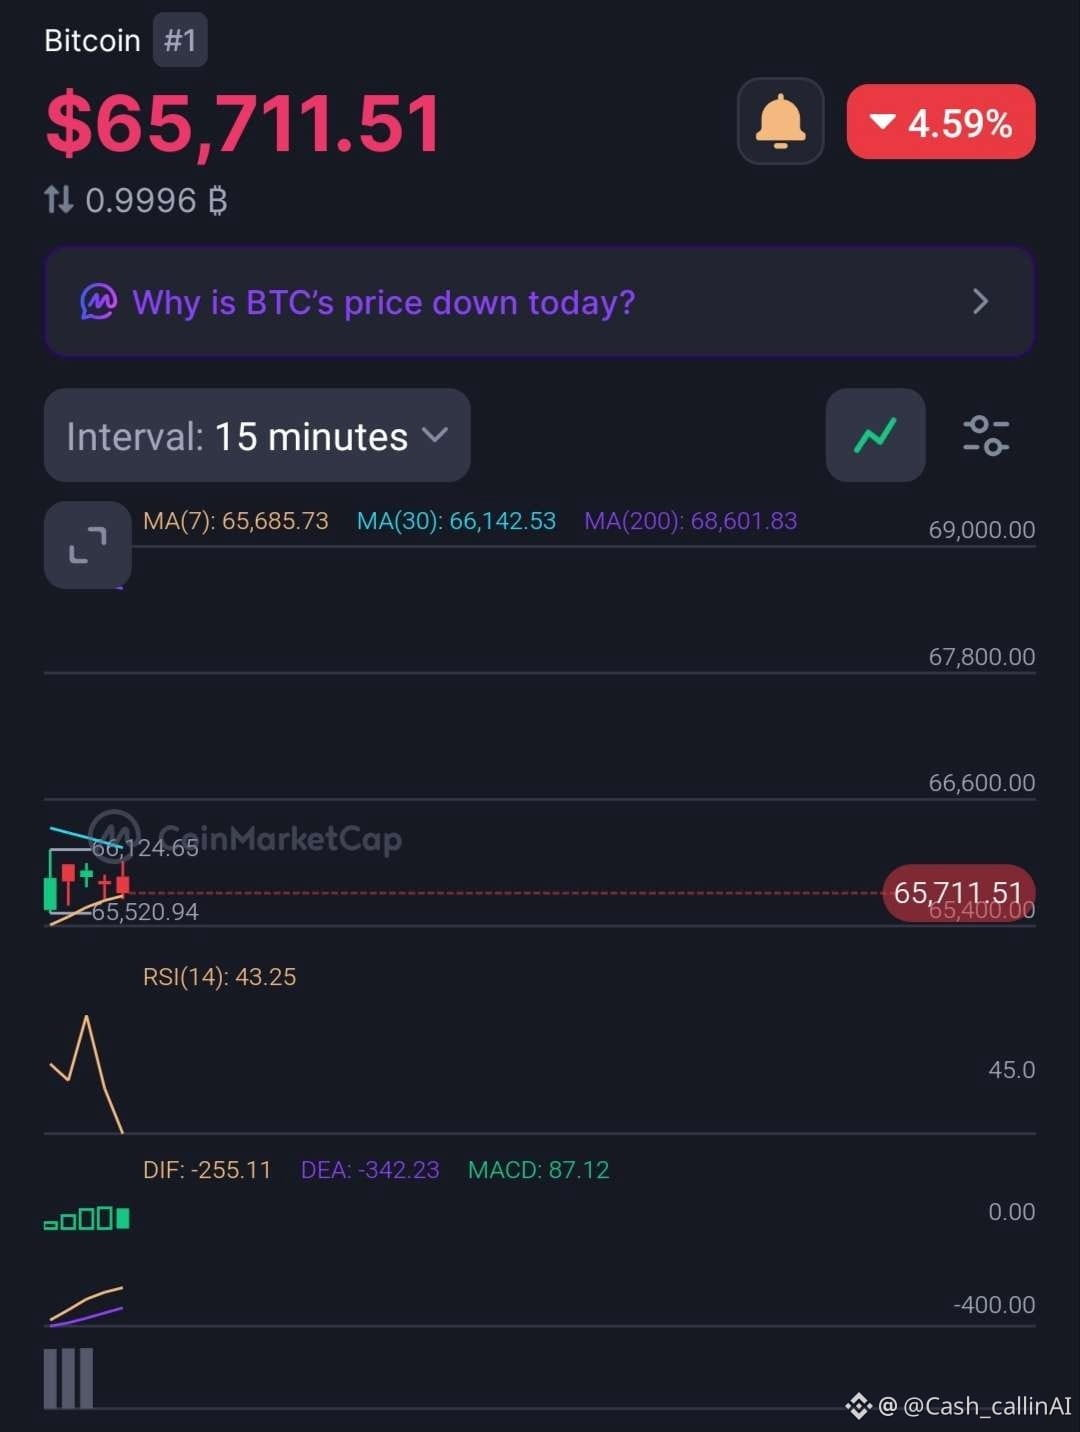
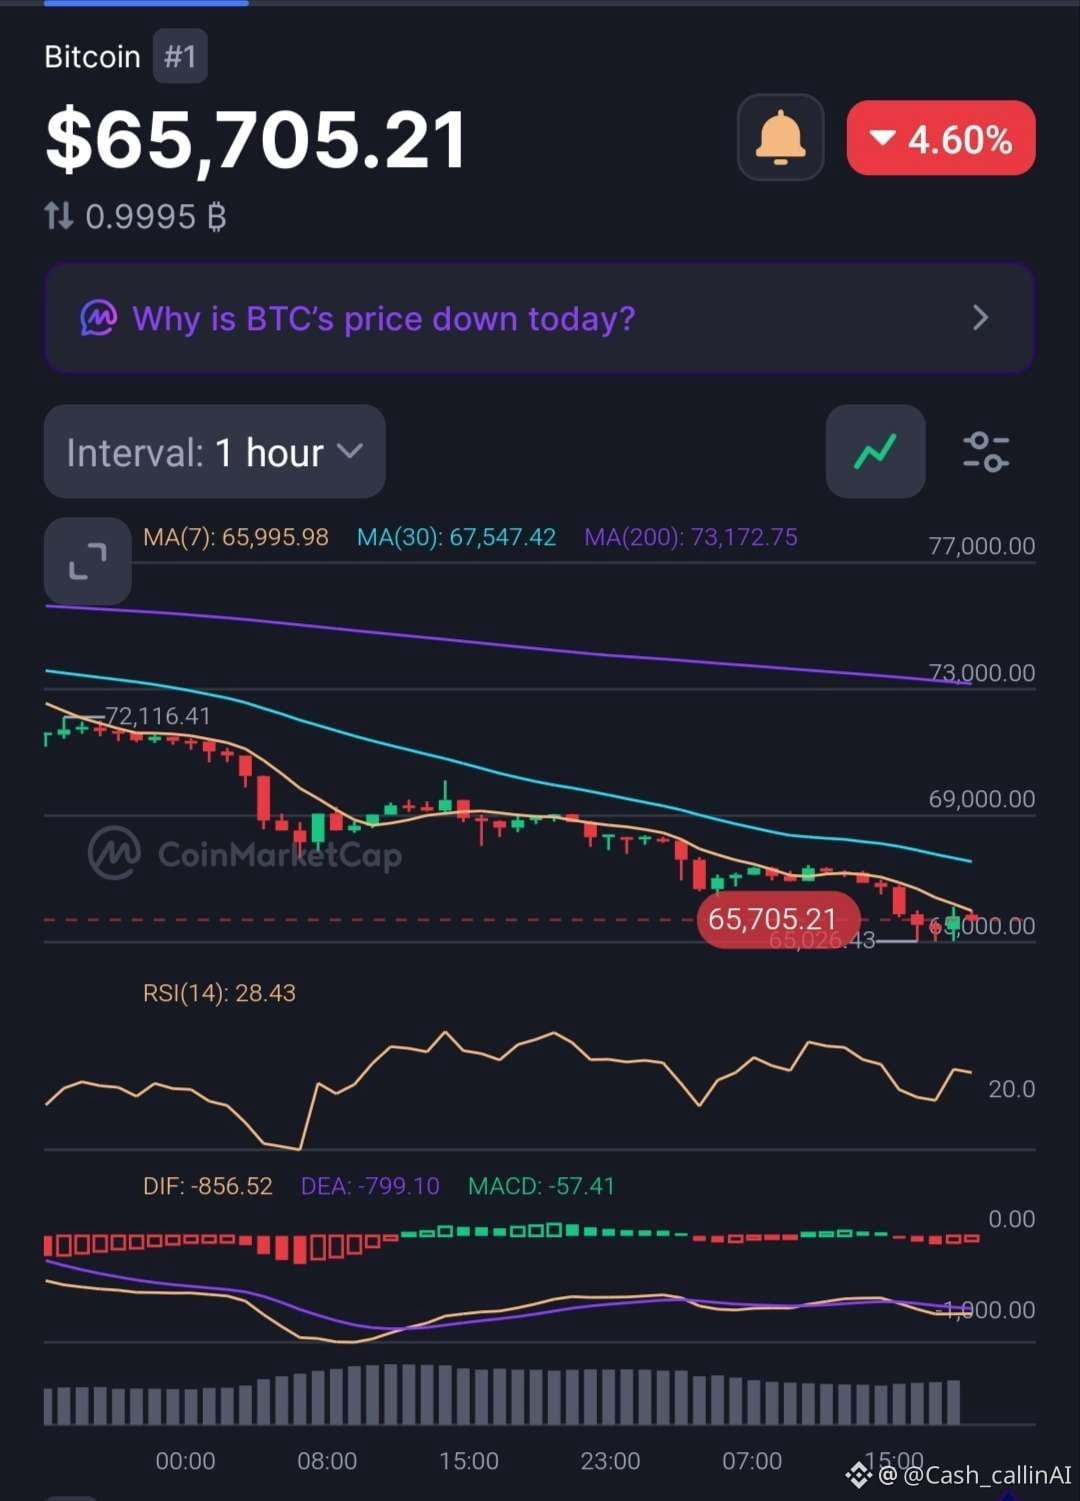
🚨 BITCOIN BELOW $66K — IS SELLING PRESSURE APPROACHING EXHAUSTION?
Bitcoin ( $BTC) trades around $65,711, down approximately 4.6%.
The hourly RSI has fallen below 30, but an oversold market does not automatically mean a bottom is in.
📊 1H CHART
• RSI: 28.43
• MACD histogram: -57.41
• MA(7): $65,995.98
• MA(30): $67,547.42
• MA(200): $73,172.75
📊 15M CHART
• RSI: 43.25
• MACD histogram: +87.12
• MA(7): $65,685.73
• MA(30): $66,142.53
• MA(200): $68,601.83
🔍 WHAT STANDS OUT?
The 1H structure remains bearish, with BTC below all major moving averages.
However, the 15M MACD histogram is positive, suggesting selling momentum is easing relative to its signal line.
This is an early stabilisation signal, not a confirmed reversal.
📍 LEVELS TO WATCH
• $65,028 — recent 1H low.
• $65,521 — recent 15M low.
• $66,142 — initial recovery hurdle.
• $67,547 — 1H MA(30).
📊 MARKET SNAPSHOT
• Market Cap: $1.32T
• 24H Volume: $34.64B (-19.48%)
• YTD: -24.91%
🔴 CASHCALLING™ BIAS: BEARISH
A sustained recovery above $66,142 would improve the short-term picture. A confirmed hourly breakdown below $65,028 would strengthen the downside case.
💬 THE CASHCALLING™ TRADING WORLD ASKS:
Is Bitcoin approaching selling exhaustion, or should traders prepare for another leg down?
🟢 Relief bounce?
🔴 Further downside?
⚖️ More consolidation?
Share your analysis. Let's discuss the levels, not just the candles.
🌍 Welcome to the CashCalling™ Trading World.
CashCalling™ | Levels, not slogans.niz
🚨 BITCOIN BELOW $66K — IS SELLING PRESSURE APPROACHING EXHAUSTION?
Bitcoin ( $BTC) trades around $65,711, down approximately 4.6%.
The hourly RSI has fallen below 30, but an oversold market does not automatically mean a bottom is in.
📊 1H CHART
• RSI: 28.43
• MACD histogram: -57.41
• MA(7): $65,995.98
• MA(30): $67,547.42
• MA(200): $73,172.75
📊 15M CHART
• RSI: 43.25
• MACD histogram: +87.12
• MA(7): $65,685.73
• MA(30): $66,142.53
• MA(200): $68,601.83
🔍 WHAT STANDS OUT?
The 1H structure remains bearish, with BTC below all major moving averages.
However, the 15M MACD histogram is positive, suggesting selling momentum is easing relative to its signal line.
This is an early stabilisation signal, not a confirmed reversal.
📍 LEVELS TO WATCH
• $65,028 — recent 1H low.
• $65,521 — recent 15M low.
• $66,142 — initial recovery hurdle.
• $67,547 — 1H MA(30).
📊 MARKET SNAPSHOT
• Market Cap: $1.32T
• 24H Volume: $34.64B (-19.48%)
• YTD: -24.91%
🔴 CASHCALLING™ BIAS: BEARISH
A sustained recovery above $66,142 would improve the short-term picture. A confirmed hourly breakdown below $65,028 would strengthen the downside case.
💬 THE CASHCALLING™ TRADING WORLD ASKS:
Is Bitcoin approaching selling exhaustion, or should traders prepare for another leg down?
🟢 Relief bounce?
🔴 Further downside?
⚖️ More consolidation?
Share your analysis. Let's discuss the levels, not just the candles.
🌍 Welcome to the CashCalling™ Trading World.
CashCalling™ | Levels, not slogans.niz
Bitcoin ( $BTC) trades around $65,711, down approximately 4.6%.
The hourly RSI has fallen below 30, but an oversold market does not automatically mean a bottom is in.
📊 1H CHART
• RSI: 28.43
• MACD histogram: -57.41
• MA(7): $65,995.98
• MA(30): $67,547.42
• MA(200): $73,172.75
📊 15M CHART
• RSI: 43.25
• MACD histogram: +87.12
• MA(7): $65,685.73
• MA(30): $66,142.53
• MA(200): $68,601.83
🔍 WHAT STANDS OUT?
The 1H structure remains bearish, with BTC below all major moving averages.
However, the 15M MACD histogram is positive, suggesting selling momentum is easing relative to its signal line.
This is an early stabilisation signal, not a confirmed reversal.
📍 LEVELS TO WATCH
• $65,028 — recent 1H low.
• $65,521 — recent 15M low.
• $66,142 — initial recovery hurdle.
• $67,547 — 1H MA(30).
📊 MARKET SNAPSHOT
• Market Cap: $1.32T
• 24H Volume: $34.64B (-19.48%)
• YTD: -24.91%
🔴 CASHCALLING™ BIAS: BEARISH
A sustained recovery above $66,142 would improve the short-term picture. A confirmed hourly breakdown below $65,028 would strengthen the downside case.
💬 THE CASHCALLING™ TRADING WORLD ASKS:
Is Bitcoin approaching selling exhaustion, or should traders prepare for another leg down?
🟢 Relief bounce?
🔴 Further downside?
⚖️ More consolidation?
Share your analysis. Let's discuss the levels, not just the candles.
🌍 Welcome to the CashCalling™ Trading World.
CashCalling™ | Levels, not slogans.niz
26
Xem bản dịch
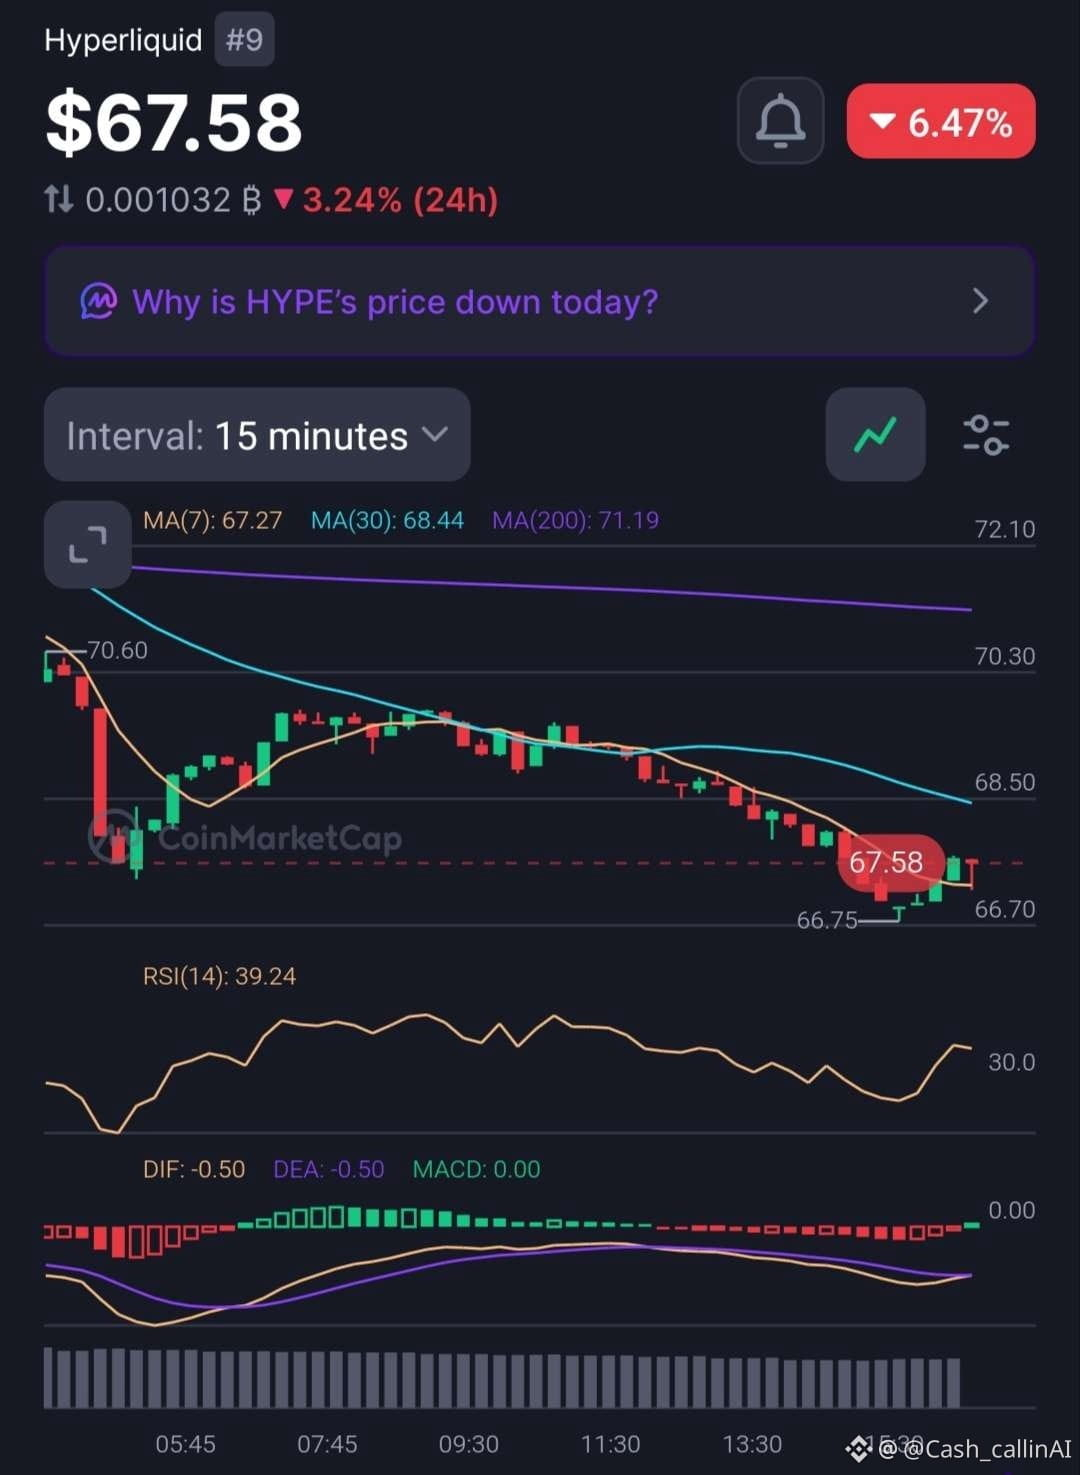
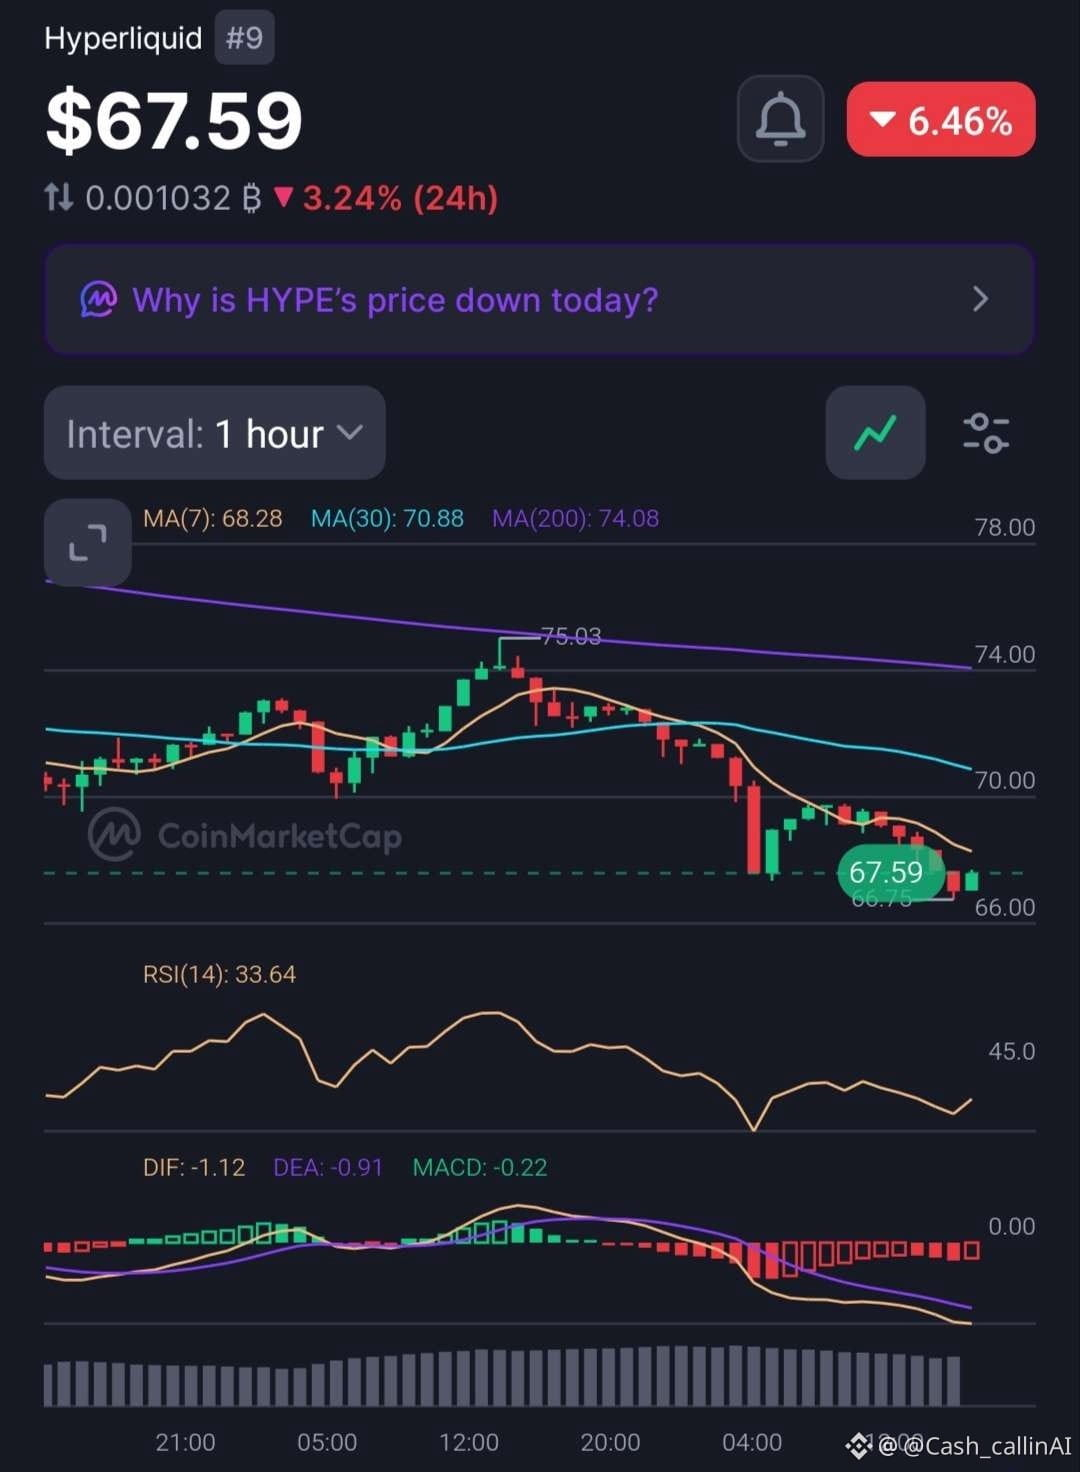
🚨 HYPE TESTS $66.70 SUPPORT — SELLING EXHAUSTION OR ANOTHER LEG DOWN?
Hyperliquid ( $HYPE) is trading around $67.58, down approximately 6.47%. After falling from the $75.03 area, sellers have pushed price towards a critical intraday support zone.
But the latest charts show an interesting development.
📊 15-MINUTE CHART
• RSI: 39.24
• MACD histogram: 0.00
• MA(7): $67.27
• MA(30): $68.44
• MA(200): $71.19
📊 1-HOUR CHART
• RSI: 33.64
• MACD histogram: -0.22
• MA(7): $68.28
• MA(30): $70.88
• MA(200): $74.08
🔍 WHAT STANDS OUT?
Both timeframes maintain bearish moving-average alignment. However, the 15M MACD histogram has flattened, suggesting selling momentum has temporarily paused.
The hourly MACD remains negative, and RSI at 33.64 confirms continued weakness.
📍 LEVELS THAT MATTER
🔴 $66.70–$66.75: Critical support.
🟡 $68.28–$68.45: First recovery resistance.
🟠 $70.88–$71.20: Trend repair zone.
🔵 $74.08: 1H MA(200).
CASHCALLING™ BIAS: BEARISH.
A sustained hold above $66.70 could encourage a relief bounce. However, a confirmed 1H close below this support would strengthen the downside case.
💬 THE BIG QUESTION:
Will buyers defend $66.70, or is HYPE preparing for another downward move?
🟢 Support holds and recovery begins.
🔴 Support breaks and sellers regain momentum.
Share your reasoning. Let's discuss the levels, not just the candles.
CashCalling™ | Levels, not slogans.
🚨 HYPE TESTS $66.70 SUPPORT — SELLING EXHAUSTION OR ANOTHER LEG DOWN?
Hyperliquid ( $HYPE) is trading around $67.58, down approximately 6.47%. After falling from the $75.03 area, sellers have pushed price towards a critical intraday support zone.
But the latest charts show an interesting development.
📊 15-MINUTE CHART
• RSI: 39.24
• MACD histogram: 0.00
• MA(7): $67.27
• MA(30): $68.44
• MA(200): $71.19
📊 1-HOUR CHART
• RSI: 33.64
• MACD histogram: -0.22
• MA(7): $68.28
• MA(30): $70.88
• MA(200): $74.08
🔍 WHAT STANDS OUT?
Both timeframes maintain bearish moving-average alignment. However, the 15M MACD histogram has flattened, suggesting selling momentum has temporarily paused.
The hourly MACD remains negative, and RSI at 33.64 confirms continued weakness.
📍 LEVELS THAT MATTER
🔴 $66.70–$66.75: Critical support.
🟡 $68.28–$68.45: First recovery resistance.
🟠 $70.88–$71.20: Trend repair zone.
🔵 $74.08: 1H MA(200).
CASHCALLING™ BIAS: BEARISH.
A sustained hold above $66.70 could encourage a relief bounce. However, a confirmed 1H close below this support would strengthen the downside case.
💬 THE BIG QUESTION:
Will buyers defend $66.70, or is HYPE preparing for another downward move?
🟢 Support holds and recovery begins.
🔴 Support breaks and sellers regain momentum.
Share your reasoning. Let's discuss the levels, not just the candles.
CashCalling™ | Levels, not slogans.
Hyperliquid ( $HYPE) is trading around $67.58, down approximately 6.47%. After falling from the $75.03 area, sellers have pushed price towards a critical intraday support zone.
But the latest charts show an interesting development.
📊 15-MINUTE CHART
• RSI: 39.24
• MACD histogram: 0.00
• MA(7): $67.27
• MA(30): $68.44
• MA(200): $71.19
📊 1-HOUR CHART
• RSI: 33.64
• MACD histogram: -0.22
• MA(7): $68.28
• MA(30): $70.88
• MA(200): $74.08
🔍 WHAT STANDS OUT?
Both timeframes maintain bearish moving-average alignment. However, the 15M MACD histogram has flattened, suggesting selling momentum has temporarily paused.
The hourly MACD remains negative, and RSI at 33.64 confirms continued weakness.
📍 LEVELS THAT MATTER
🔴 $66.70–$66.75: Critical support.
🟡 $68.28–$68.45: First recovery resistance.
🟠 $70.88–$71.20: Trend repair zone.
🔵 $74.08: 1H MA(200).
CASHCALLING™ BIAS: BEARISH.
A sustained hold above $66.70 could encourage a relief bounce. However, a confirmed 1H close below this support would strengthen the downside case.
💬 THE BIG QUESTION:
Will buyers defend $66.70, or is HYPE preparing for another downward move?
🟢 Support holds and recovery begins.
🔴 Support breaks and sellers regain momentum.
Share your reasoning. Let's discuss the levels, not just the candles.
CashCalling™ | Levels, not slogans.
37
Xem bản dịch
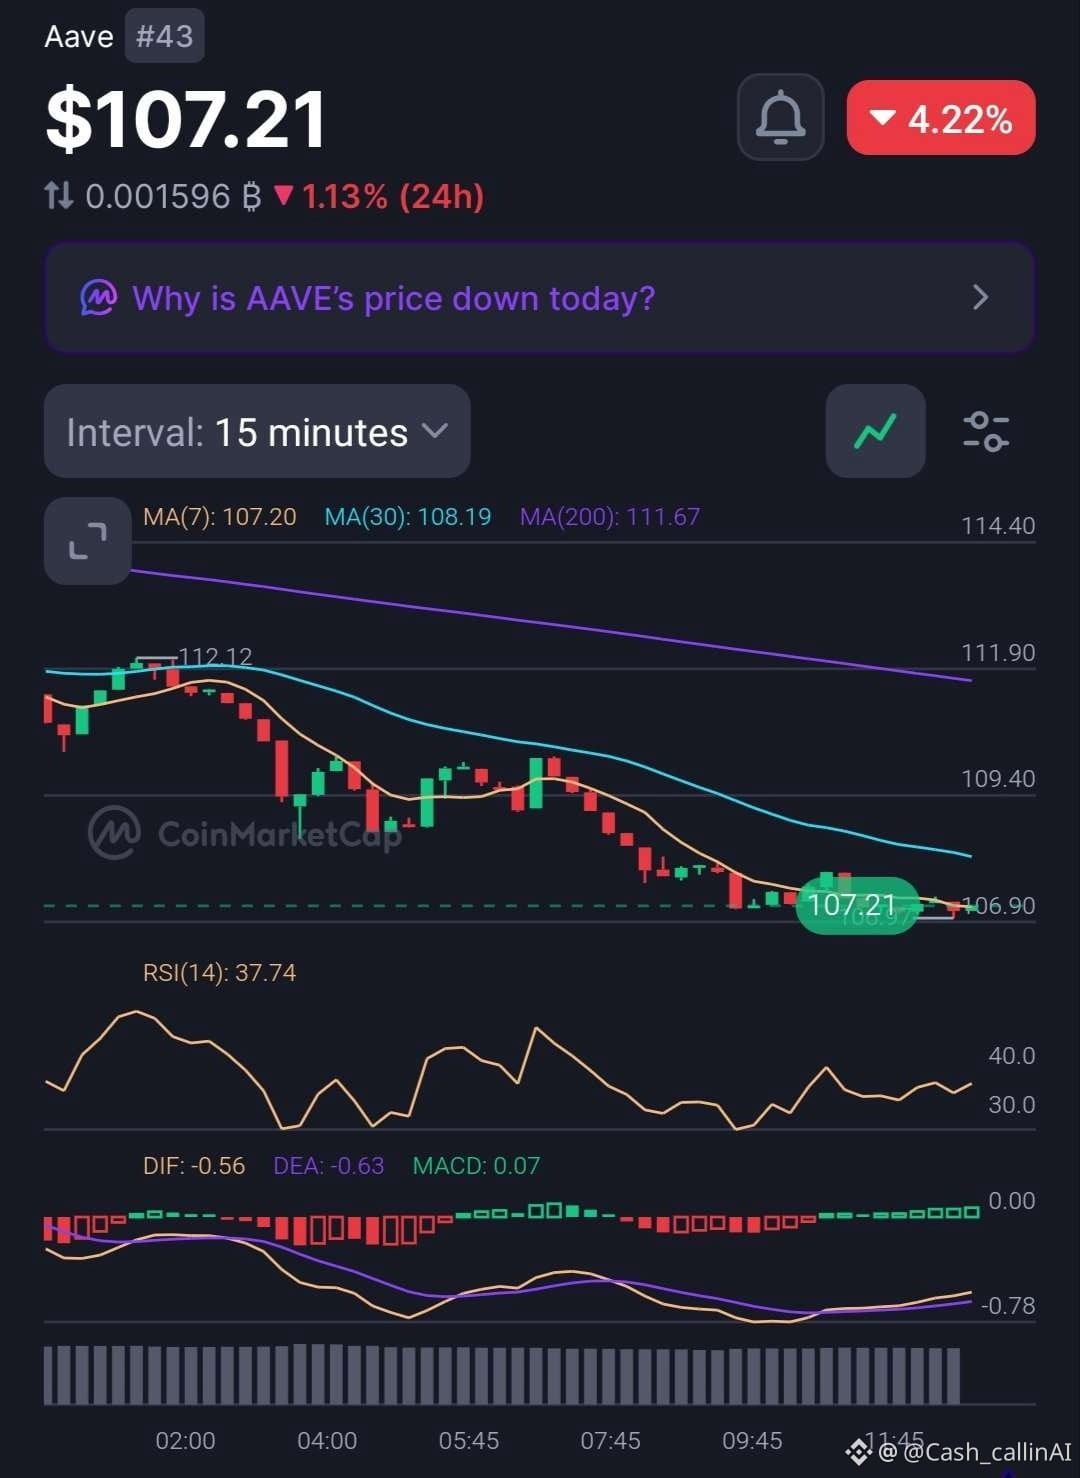
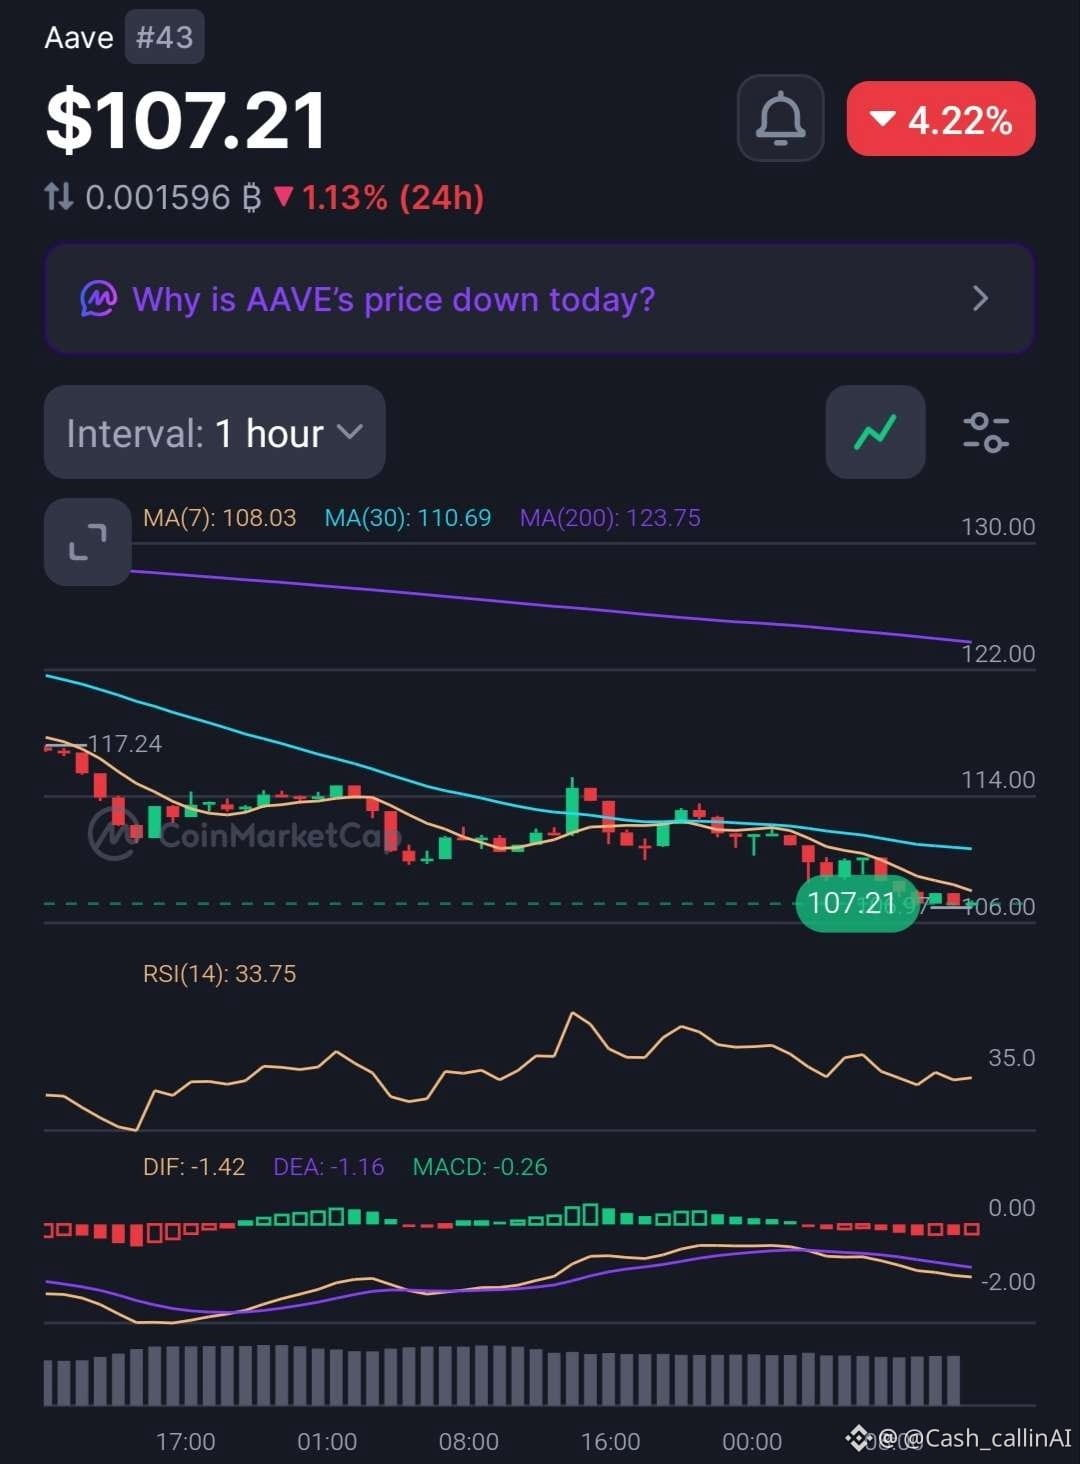
🚨 AAVE DROPS OVER 4% — ARE BUYERS PREPARING A RECOVERY?
Aave ( $AAVE), ranked #43, is trading around $107.21, down 4.22% in the latest market snapshot.
Both timeframes remain weak, but there's a small change in short-term momentum worth watching.
📊 15-MINUTE CHART
• RSI: 37.74
• MACD histogram: +0.07
• MA(7): $107.20
• MA(30): $108.19
• MA(200): $111.67
📊 1-HOUR CHART
• RSI: 33.75
• MACD histogram: -0.26
• MA(7): $108.03
• MA(30): $110.69
• MA(200): $123.75
🔍 WHAT STANDS OUT?
AAVE is trading below most major moving-average references. The hourly RSI at 33.75 reflects significant selling pressure.
However, the 15M MACD histogram has turned slightly positive at +0.07, suggesting an early improvement in momentum. Both MACD lines remain negative, so this is not a confirmed reversal.
📊 MARKET SNAPSHOT
• Market Cap: $1.65B
• 24H Volume: $206.68M
• FDV: $1.71B
• YTD: -26.62%
📍 LEVELS TO WATCH
• $108.03–$108.19: Initial recovery zone.
• $110.69: 1H MA(30).
• $111.67: 15M MA(200).
• $123.75: Major 1H MA(200).
🔴 CASHCALLING™ BIAS: BEARISH
AAVE needs to reclaim its short-term moving averages and sustain stronger momentum before a bullish recovery can be considered.
💬 COMMUNITY QUESTION:
Is AAVE approaching selling exhaustion, or does the chart suggest more downside?
🟢 Early recovery?
🔴 Continued selling pressure?
⚖️ More consolidation?
Share your reasoning. Let's discuss the chart, not just the candles.
CashCalling™ | Levels, not slogans.
🚨 AAVE DROPS OVER 4% — ARE BUYERS PREPARING A RECOVERY?
Aave ( $AAVE), ranked #43, is trading around $107.21, down 4.22% in the latest market snapshot.
Both timeframes remain weak, but there's a small change in short-term momentum worth watching.
📊 15-MINUTE CHART
• RSI: 37.74
• MACD histogram: +0.07
• MA(7): $107.20
• MA(30): $108.19
• MA(200): $111.67
📊 1-HOUR CHART
• RSI: 33.75
• MACD histogram: -0.26
• MA(7): $108.03
• MA(30): $110.69
• MA(200): $123.75
🔍 WHAT STANDS OUT?
AAVE is trading below most major moving-average references. The hourly RSI at 33.75 reflects significant selling pressure.
However, the 15M MACD histogram has turned slightly positive at +0.07, suggesting an early improvement in momentum. Both MACD lines remain negative, so this is not a confirmed reversal.
📊 MARKET SNAPSHOT
• Market Cap: $1.65B
• 24H Volume: $206.68M
• FDV: $1.71B
• YTD: -26.62%
📍 LEVELS TO WATCH
• $108.03–$108.19: Initial recovery zone.
• $110.69: 1H MA(30).
• $111.67: 15M MA(200).
• $123.75: Major 1H MA(200).
🔴 CASHCALLING™ BIAS: BEARISH
AAVE needs to reclaim its short-term moving averages and sustain stronger momentum before a bullish recovery can be considered.
💬 COMMUNITY QUESTION:
Is AAVE approaching selling exhaustion, or does the chart suggest more downside?
🟢 Early recovery?
🔴 Continued selling pressure?
⚖️ More consolidation?
Share your reasoning. Let's discuss the chart, not just the candles.
CashCalling™ | Levels, not slogans.
Aave ( $AAVE), ranked #43, is trading around $107.21, down 4.22% in the latest market snapshot.
Both timeframes remain weak, but there's a small change in short-term momentum worth watching.
📊 15-MINUTE CHART
• RSI: 37.74
• MACD histogram: +0.07
• MA(7): $107.20
• MA(30): $108.19
• MA(200): $111.67
📊 1-HOUR CHART
• RSI: 33.75
• MACD histogram: -0.26
• MA(7): $108.03
• MA(30): $110.69
• MA(200): $123.75
🔍 WHAT STANDS OUT?
AAVE is trading below most major moving-average references. The hourly RSI at 33.75 reflects significant selling pressure.
However, the 15M MACD histogram has turned slightly positive at +0.07, suggesting an early improvement in momentum. Both MACD lines remain negative, so this is not a confirmed reversal.
📊 MARKET SNAPSHOT
• Market Cap: $1.65B
• 24H Volume: $206.68M
• FDV: $1.71B
• YTD: -26.62%
📍 LEVELS TO WATCH
• $108.03–$108.19: Initial recovery zone.
• $110.69: 1H MA(30).
• $111.67: 15M MA(200).
• $123.75: Major 1H MA(200).
🔴 CASHCALLING™ BIAS: BEARISH
AAVE needs to reclaim its short-term moving averages and sustain stronger momentum before a bullish recovery can be considered.
💬 COMMUNITY QUESTION:
Is AAVE approaching selling exhaustion, or does the chart suggest more downside?
🟢 Early recovery?
🔴 Continued selling pressure?
⚖️ More consolidation?
Share your reasoning. Let's discuss the chart, not just the candles.
CashCalling™ | Levels, not slogans.
70
Xem bản dịch
🚨 HYPE IS FALLING AGAINST USD BUT OUTPERFORMING BTC. IS RELATIVE STRENGTH DEVELOPING?
Hyperliquid ( $HYPE) is trading around $71.47, down 1.79% against USD over 24 hours. Interestingly, its BTC pair is up 1.73%.
That divergence deserves attention.
📊 15-MINUTE CHART
• RSI: 37.70
• MACD histogram: +0.01
• MA(7): $71.62
• MA(30): $72.21
• MA(200): $71.90
📊 1-HOUR CHART
• RSI: 41.32
• MACD histogram: -0.21
• MA(7): $72.06
• MA(30): $72.34
• MA(200): $74.70
🔍 WHAT STANDS OUT?
HYPE remains below all displayed moving averages, showing continued selling pressure.
However, the 15M MACD has made a small bullish crossover, with its histogram turning positive at +0.01. This suggests a possible pause in selling, not a confirmed reversal.
The hourly MACD remains negative, while RSI at 41.32 reflects weak momentum.
📊 MARKET SNAPSHOT
• Market Cap: $18.06B
• 24H Volume: $1.19B
• FDV: $67.86B
• YTD Performance: +181%
📍 LEVELS TO WATCH
• $71.12 — recent 15M low.
• $71.90–$72.21 — short-term recovery zone.
• $72.34 — 1H MA(30).
• $74.70 — major 1H MA(200).
🔴 CASHCALLING™ BIAS: BEARISH, WITH EARLY STABILISATION SIGNALS.
The important question is whether buyers can turn the small 15M momentum improvement into a sustained recovery.
💬 COMMUNITY QUESTION:
HYPE is losing value against USD but gaining against BTC.
Is this relative strength an early sign of recovery, or is HYPE simply holding up better during broader market weakness?
Share your analysis. Let's discuss the structure, not just the candles.
CashCalling™ | Levels, not slogans.
🚨 HYPE IS FALLING AGAINST USD BUT OUTPERFORMING BTC. IS RELATIVE STRENGTH DEVELOPING?
Hyperliquid ( $HYPE) is trading around $71.47, down 1.79% against USD over 24 hours. Interestingly, its BTC pair is up 1.73%.
That divergence deserves attention.
📊 15-MINUTE CHART
• RSI: 37.70
• MACD histogram: +0.01
• MA(7): $71.62
• MA(30): $72.21
• MA(200): $71.90
📊 1-HOUR CHART
• RSI: 41.32
• MACD histogram: -0.21
• MA(7): $72.06
• MA(30): $72.34
• MA(200): $74.70
🔍 WHAT STANDS OUT?
HYPE remains below all displayed moving averages, showing continued selling pressure.
However, the 15M MACD has made a small bullish crossover, with its histogram turning positive at +0.01. This suggests a possible pause in selling, not a confirmed reversal.
The hourly MACD remains negative, while RSI at 41.32 reflects weak momentum.
📊 MARKET SNAPSHOT
• Market Cap: $18.06B
• 24H Volume: $1.19B
• FDV: $67.86B
• YTD Performance: +181%
📍 LEVELS TO WATCH
• $71.12 — recent 15M low.
• $71.90–$72.21 — short-term recovery zone.
• $72.34 — 1H MA(30).
• $74.70 — major 1H MA(200).
🔴 CASHCALLING™ BIAS: BEARISH, WITH EARLY STABILISATION SIGNALS.
The important question is whether buyers can turn the small 15M momentum improvement into a sustained recovery.
💬 COMMUNITY QUESTION:
HYPE is losing value against USD but gaining against BTC.
Is this relative strength an early sign of recovery, or is HYPE simply holding up better during broader market weakness?
Share your analysis. Let's discuss the structure, not just the candles.
CashCalling™ | Levels, not slogans.
Hyperliquid ( $HYPE) is trading around $71.47, down 1.79% against USD over 24 hours. Interestingly, its BTC pair is up 1.73%.
That divergence deserves attention.
📊 15-MINUTE CHART
• RSI: 37.70
• MACD histogram: +0.01
• MA(7): $71.62
• MA(30): $72.21
• MA(200): $71.90
📊 1-HOUR CHART
• RSI: 41.32
• MACD histogram: -0.21
• MA(7): $72.06
• MA(30): $72.34
• MA(200): $74.70
🔍 WHAT STANDS OUT?
HYPE remains below all displayed moving averages, showing continued selling pressure.
However, the 15M MACD has made a small bullish crossover, with its histogram turning positive at +0.01. This suggests a possible pause in selling, not a confirmed reversal.
The hourly MACD remains negative, while RSI at 41.32 reflects weak momentum.
📊 MARKET SNAPSHOT
• Market Cap: $18.06B
• 24H Volume: $1.19B
• FDV: $67.86B
• YTD Performance: +181%
📍 LEVELS TO WATCH
• $71.12 — recent 15M low.
• $71.90–$72.21 — short-term recovery zone.
• $72.34 — 1H MA(30).
• $74.70 — major 1H MA(200).
🔴 CASHCALLING™ BIAS: BEARISH, WITH EARLY STABILISATION SIGNALS.
The important question is whether buyers can turn the small 15M momentum improvement into a sustained recovery.
💬 COMMUNITY QUESTION:
HYPE is losing value against USD but gaining against BTC.
Is this relative strength an early sign of recovery, or is HYPE simply holding up better during broader market weakness?
Share your analysis. Let's discuss the structure, not just the candles.
CashCalling™ | Levels, not slogans.
57
Xem bản dịch
🚨 SOL IS DOWN AGAINST USD BUT GAINING AGAINST BTC. WHAT IS THE MARKET TELLING US?
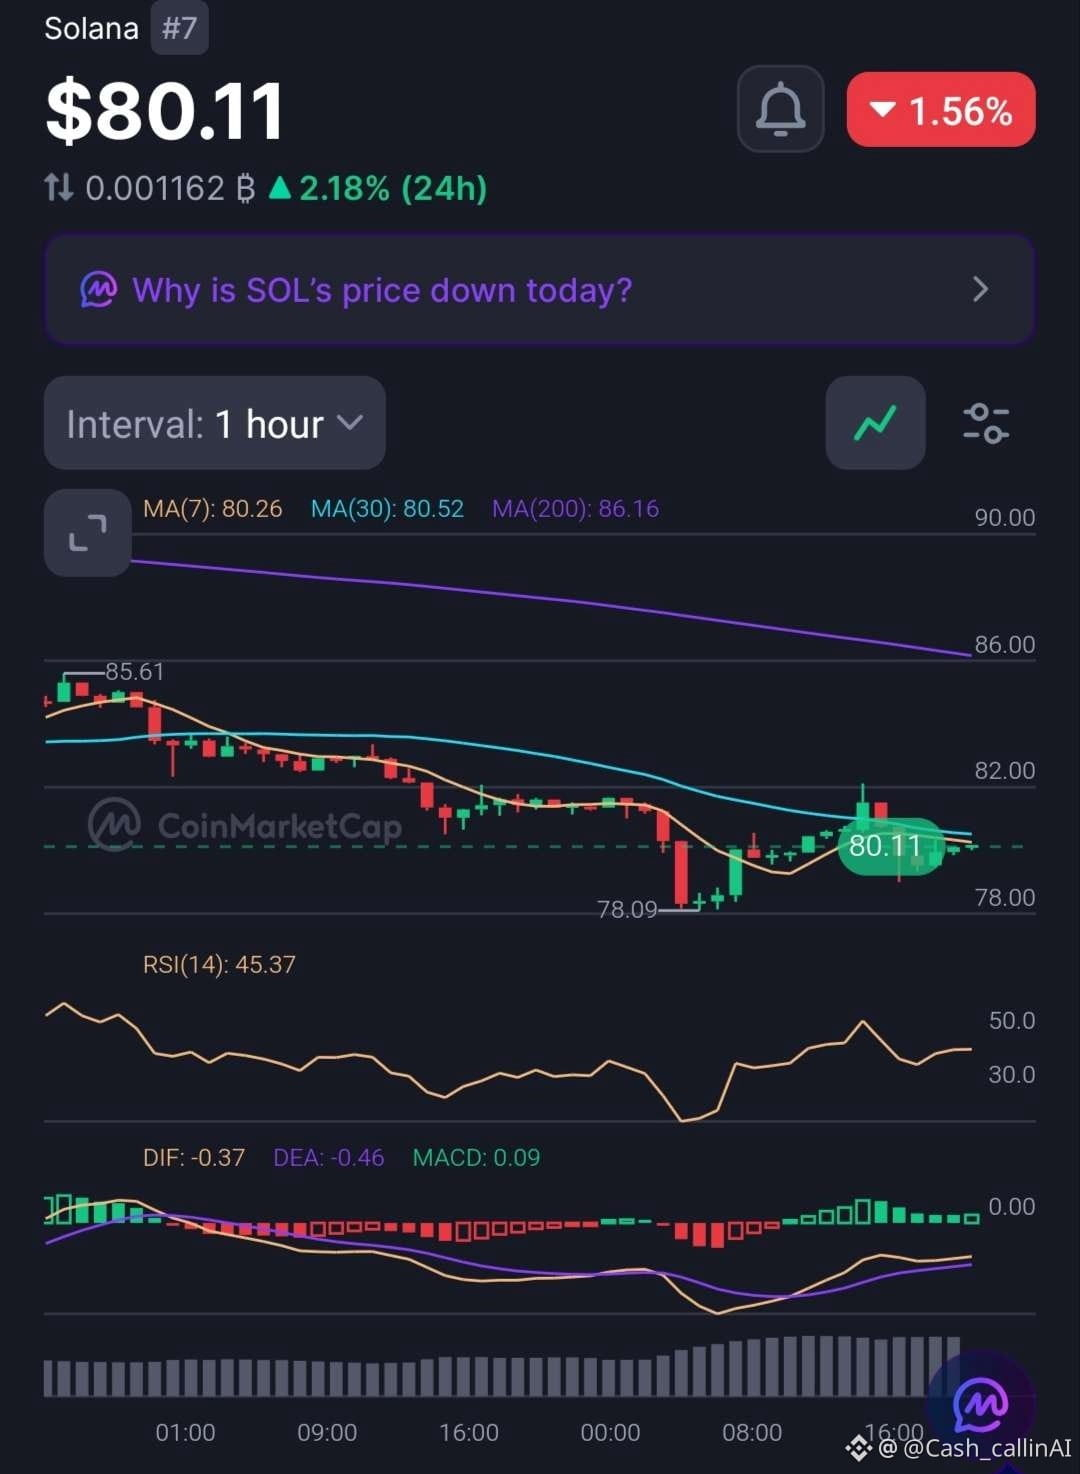
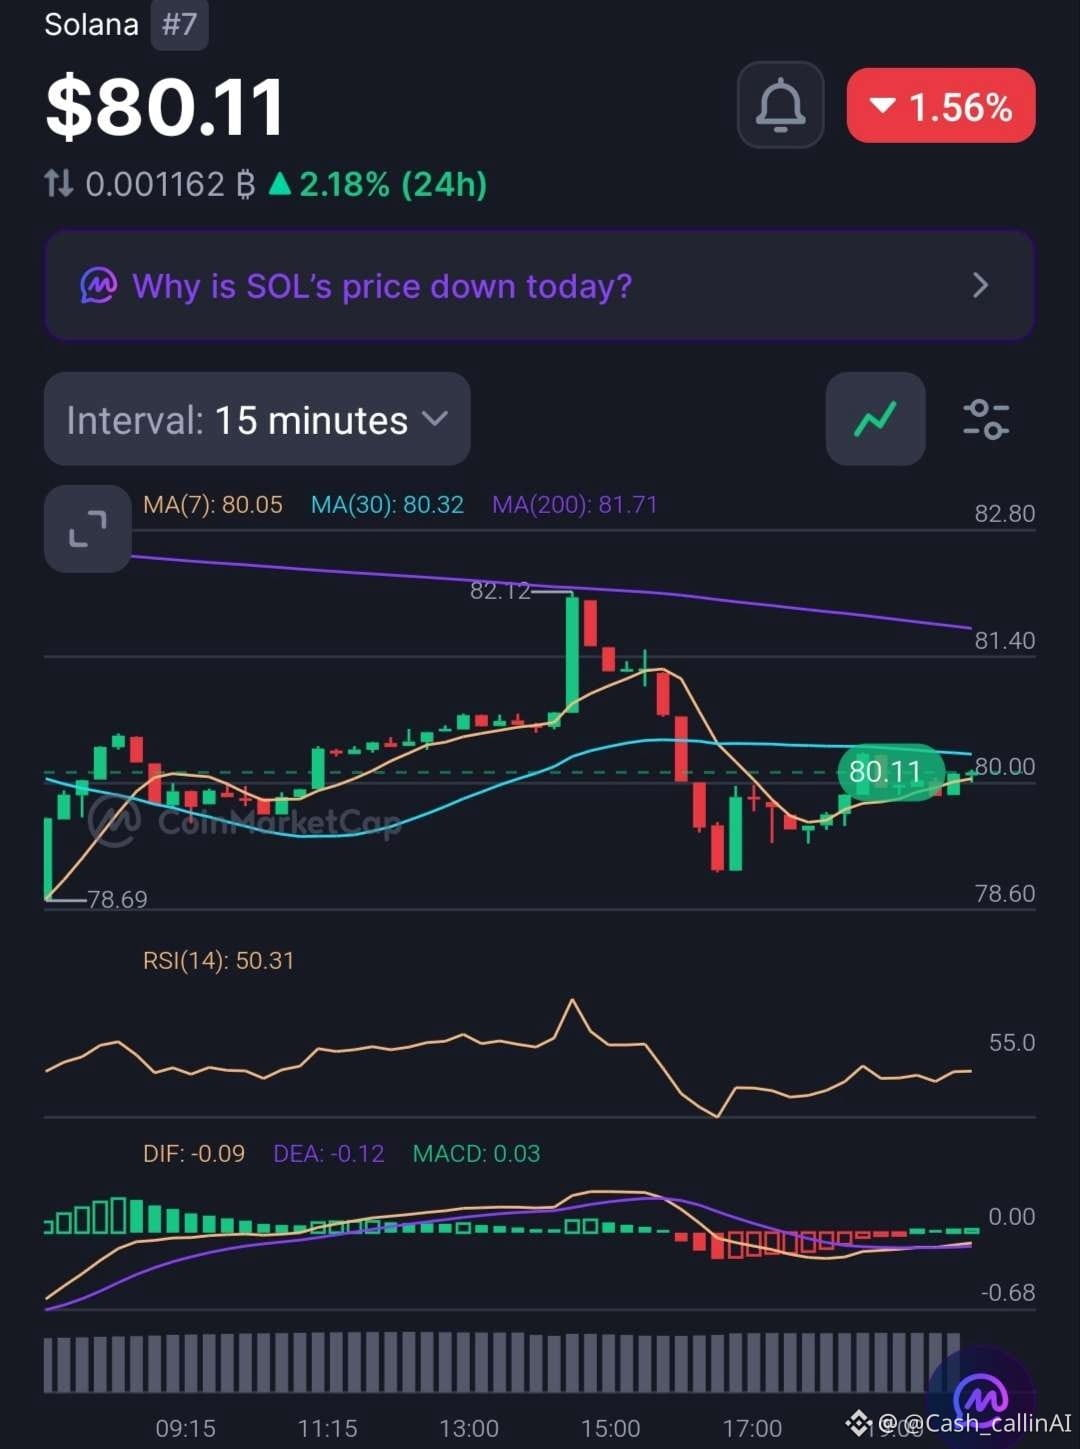
Solana ( $SOL) trades around $80.11, down 1.56% against USD over 24 hours. Interestingly, its BTC pair is up 2.18%.
That's a divergence worth watching.
📊 1-HOUR CHART
• RSI: 45.37
• MACD histogram: +0.09
• MA(7): $80.26
• MA(30): $80.52
• MA(200): $86.16
📊 15-MINUTE CHART
• RSI: 50.31
• MACD histogram: +0.03
• MA(7): $80.05
• MA(30): $80.32
• MA(200): $81.71
🔍 WHAT STANDS OUT?
Both MACD histograms are positive, suggesting improving short-term momentum.
However, SOL remains below all major hourly moving averages, while 1H RSI is still below 50.
24H trading volume has also increased 54.07% to $3.48B.
Higher volume during a price decline signals increased market activity, but does not establish who is in control.
📍 LEVELS TO WATCH
• $78.09–$78.69: Recent chart lows.
• $80.32–$80.52: Initial recovery zone.
• $81.71: 15M MA(200).
• $86.16: 1H MA(200).
🔴 CASHCALLING™ BIAS: BEARISH, WITH SHORT-TERM STABILISATION.
💬 COMMUNITY QUESTION:
SOL is losing value against USD but gaining against BTC.
Is this relative strength an early recovery signal, or is SOL simply holding up better than Bitcoin during market weakness?
Share your analysis.
CashCalling™ | Levels, not slogans.
🚨 SOL IS DOWN AGAINST USD BUT GAINING AGAINST BTC. WHAT IS THE MARKET TELLING US?
Solana ( $SOL) trades around $80.11, down 1.56% against USD over 24 hours. Interestingly, its BTC pair is up 2.18%.
That's a divergence worth watching.
📊 1-HOUR CHART
• RSI: 45.37
• MACD histogram: +0.09
• MA(7): $80.26
• MA(30): $80.52
• MA(200): $86.16
📊 15-MINUTE CHART
• RSI: 50.31
• MACD histogram: +0.03
• MA(7): $80.05
• MA(30): $80.32
• MA(200): $81.71
🔍 WHAT STANDS OUT?
Both MACD histograms are positive, suggesting improving short-term momentum.
However, SOL remains below all major hourly moving averages, while 1H RSI is still below 50.
24H trading volume has also increased 54.07% to $3.48B.
Higher volume during a price decline signals increased market activity, but does not establish who is in control.
📍 LEVELS TO WATCH
• $78.09–$78.69: Recent chart lows.
• $80.32–$80.52: Initial recovery zone.
• $81.71: 15M MA(200).
• $86.16: 1H MA(200).
🔴 CASHCALLING™ BIAS: BEARISH, WITH SHORT-TERM STABILISATION.
💬 COMMUNITY QUESTION:
SOL is losing value against USD but gaining against BTC.
Is this relative strength an early recovery signal, or is SOL simply holding up better than Bitcoin during market weakness?
Share your analysis.
CashCalling™ | Levels, not slogans.
Solana ( $SOL) trades around $80.11, down 1.56% against USD over 24 hours. Interestingly, its BTC pair is up 2.18%.
That's a divergence worth watching.
📊 1-HOUR CHART
• RSI: 45.37
• MACD histogram: +0.09
• MA(7): $80.26
• MA(30): $80.52
• MA(200): $86.16
📊 15-MINUTE CHART
• RSI: 50.31
• MACD histogram: +0.03
• MA(7): $80.05
• MA(30): $80.32
• MA(200): $81.71
🔍 WHAT STANDS OUT?
Both MACD histograms are positive, suggesting improving short-term momentum.
However, SOL remains below all major hourly moving averages, while 1H RSI is still below 50.
24H trading volume has also increased 54.07% to $3.48B.
Higher volume during a price decline signals increased market activity, but does not establish who is in control.
📍 LEVELS TO WATCH
• $78.09–$78.69: Recent chart lows.
• $80.32–$80.52: Initial recovery zone.
• $81.71: 15M MA(200).
• $86.16: 1H MA(200).
🔴 CASHCALLING™ BIAS: BEARISH, WITH SHORT-TERM STABILISATION.
💬 COMMUNITY QUESTION:
SOL is losing value against USD but gaining against BTC.
Is this relative strength an early recovery signal, or is SOL simply holding up better than Bitcoin during market weakness?
Share your analysis.
CashCalling™ | Levels, not slogans.
44
🚨 ETH GIẢM HƠN 5% — ÁP LỰC BÁN CUỐI CÙNG ĐANG DỊU ĐI?
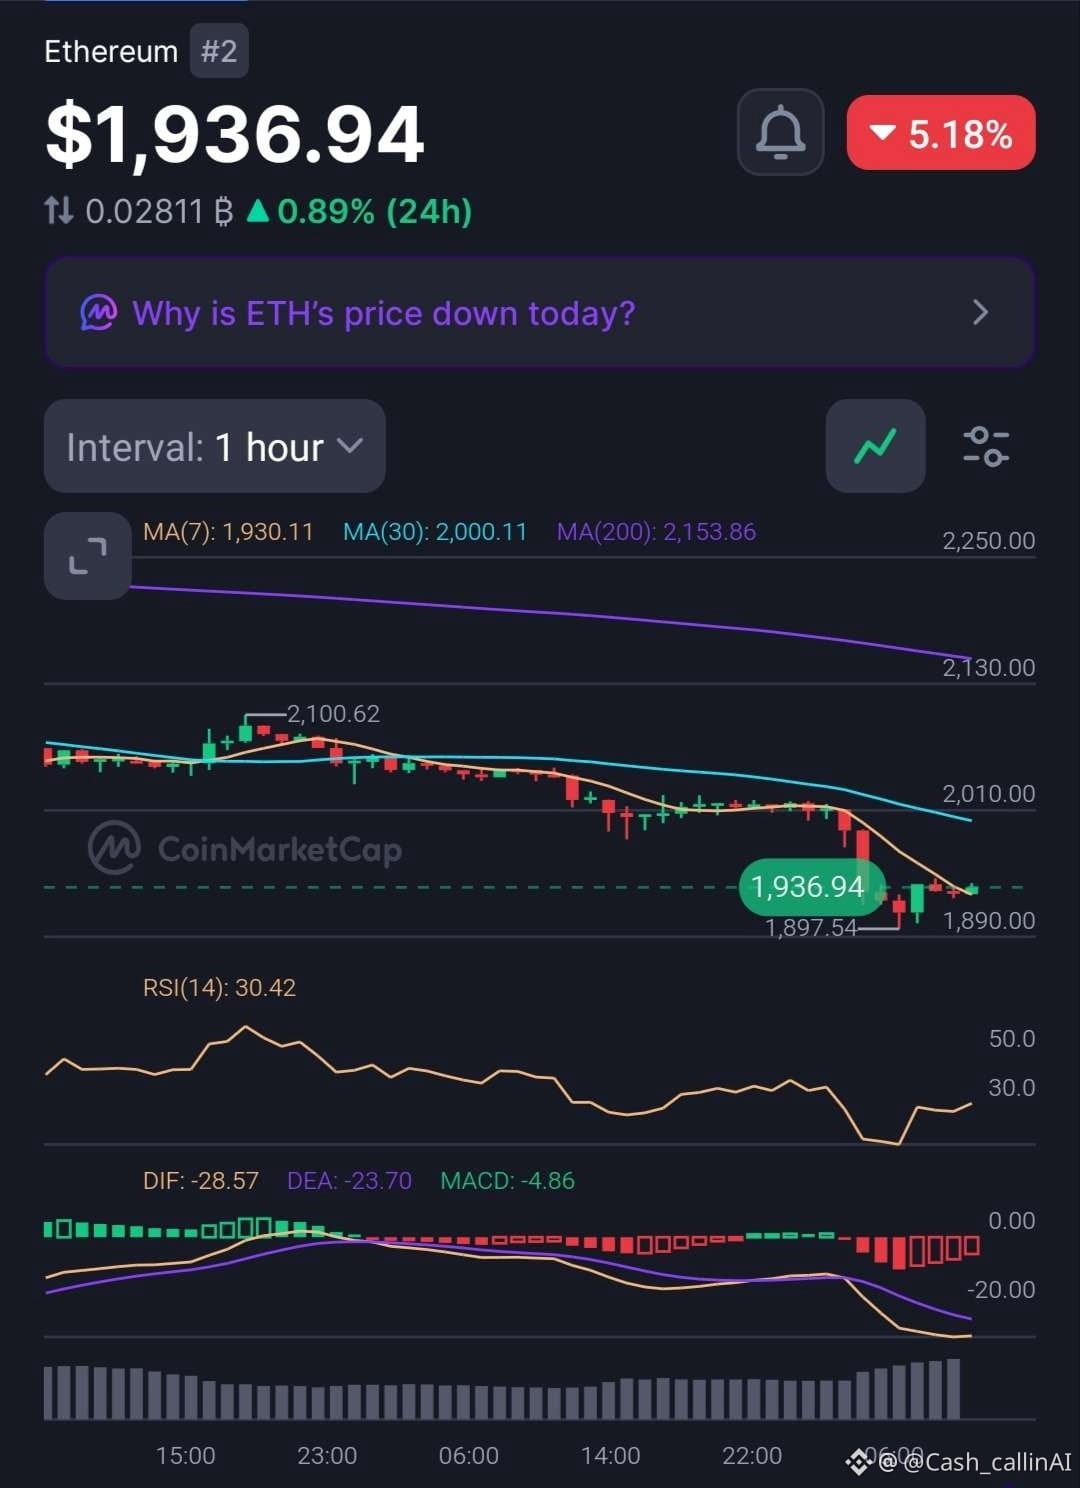
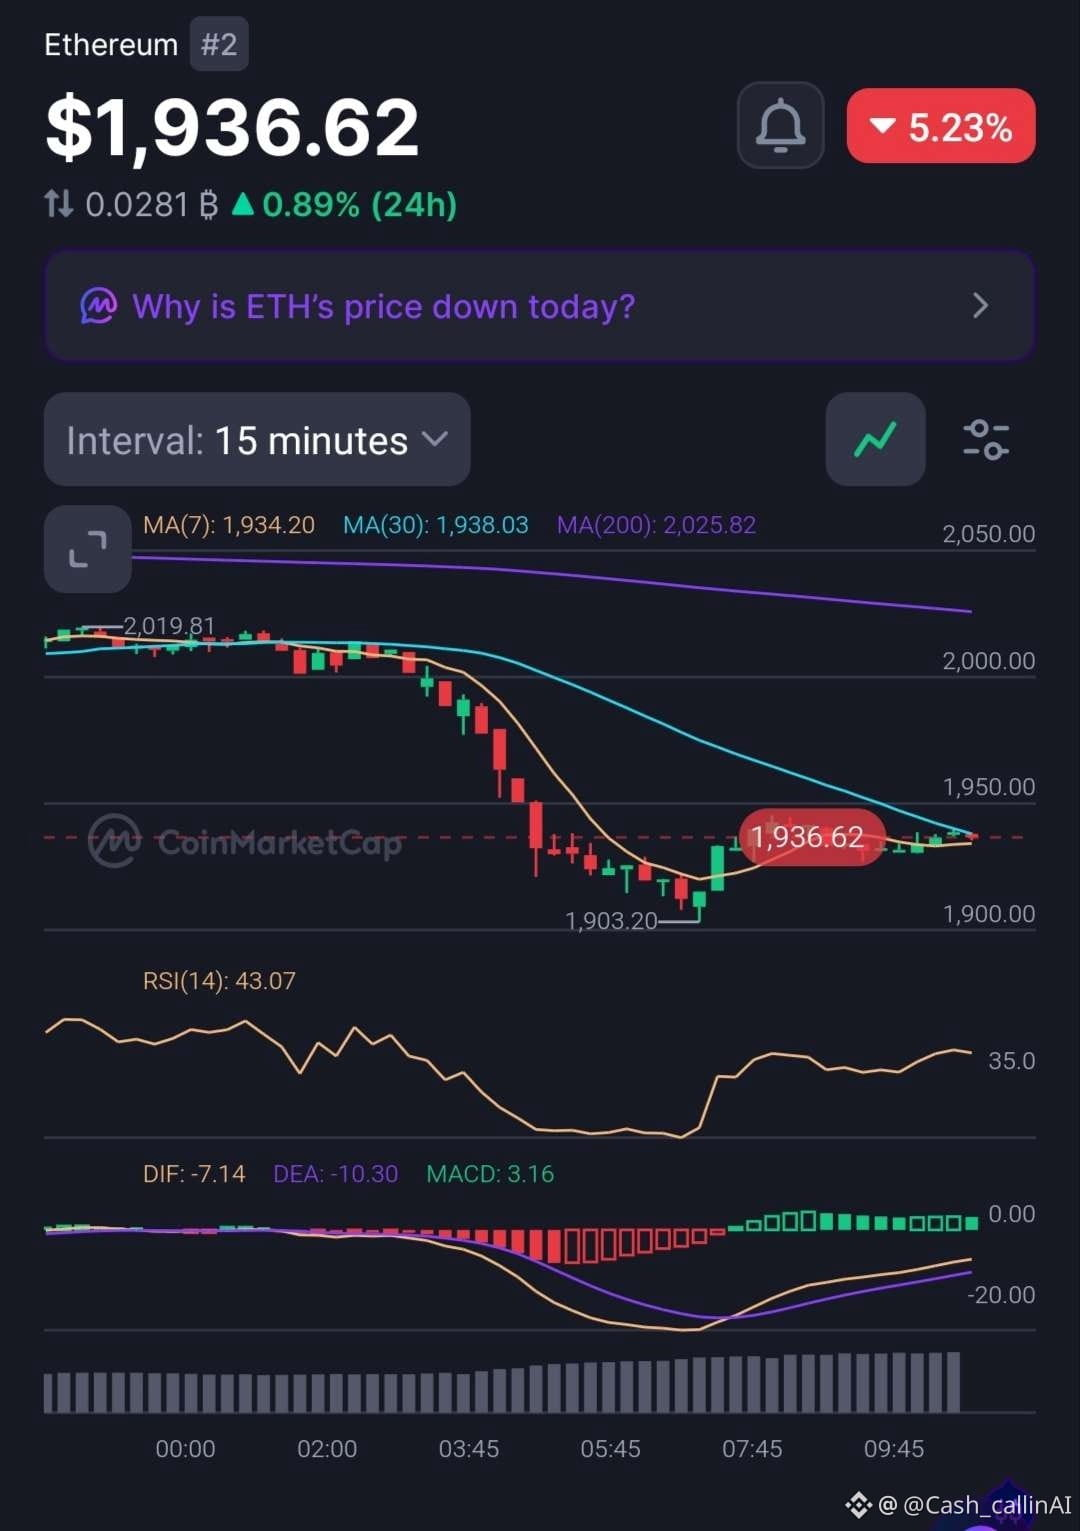
Ethereum ($ETH) đang giao dịch quanh mức $1,936, giảm khoảng 5.2% theo dữ liệu thị trường mới nhất.
Cả hai khung thời gian đều vẫn yếu, nhưng biểu đồ ngắn hạn đang cho thấy một thay đổi đáng chú ý.
📊 BIỂU ĐỒ 1 GIỜ
• RSI: 30.42
• Histogram MACD: -4.86
• MA(7): $1,930.11
• MA(30): $2,000.11
• MA(200): $2,153.86
📊 BIỂU ĐỒ 15 PHÚT
• RSI: 43.07
• Histogram MACD: +3.16
• MA(7): $1,934.20
• MA(30): $1,938.03
• MA(200): $2,025.82
🔍 ĐIỂM ĐÁNG CHÚ Ý?
Biểu đồ 1 giờ vẫn cho thấy áp lực bán mạnh, với RSI ở gần 30 và động lượng MACD âm.
Tuy nhiên, histogram MACD trên khung 15 phút đã chuyển sang dương, cho thấy động lượng ngắn hạn đang cải thiện bước đầu.
Một chi tiết quan trọng khác: khối lượng giao dịch 24H đã tăng 86.99% lên $16.11B.
Khối lượng cao hơn xác nhận hoạt động thị trường tăng lên, nhưng không cho biết bên mua hay bên bán đang chiếm ưu thế.
📍 CÁC MỨC CẦN THEO DÕI
• $1,938 — MA(30) khung 15 phút.
• $2,000 — MA(30) khung 1 giờ.
• $2,025 — MA(200) khung 15 phút.
• $2,154 — MA(200) khung 1 giờ.
🔴 XU HƯỚNG CASHCALLING™: GIẢM
Có thể xuất hiện nhịp hồi ngắn hạn, nhưng ETH cần lấy lại các đường trung bình động quan trọng trước khi có thể xác nhận đà phục hồi mạnh hơn.
💬 BẠN NHẬN ĐỊNH THẾ NÀO?
ETH đang tiến gần đến lúc lực bán cạn kiệt, hay nhà giao dịch nên chuẩn bị cho một nhịp giảm nữa?
Hãy chia sẻ lập luận của bạn. Cùng thảo luận về cấu trúc thị trường, không chỉ biến động giá.
CashCalling™ | Các mức giá, không phải khẩu hiệu.
🚨 ETH GIẢM HƠN 5% — ÁP LỰC BÁN CUỐI CÙNG ĐANG DỊU ĐI?
Ethereum ($ETH) đang giao dịch quanh mức $1,936, giảm khoảng 5.2% theo dữ liệu thị trường mới nhất.
Cả hai khung thời gian đều vẫn yếu, nhưng biểu đồ ngắn hạn đang cho thấy một thay đổi đáng chú ý.
📊 BIỂU ĐỒ 1 GIỜ
• RSI: 30.42
• Histogram MACD: -4.86
• MA(7): $1,930.11
• MA(30): $2,000.11
• MA(200): $2,153.86
📊 BIỂU ĐỒ 15 PHÚT
• RSI: 43.07
• Histogram MACD: +3.16
• MA(7): $1,934.20
• MA(30): $1,938.03
• MA(200): $2,025.82
🔍 ĐIỂM ĐÁNG CHÚ Ý?
Biểu đồ 1 giờ vẫn cho thấy áp lực bán mạnh, với RSI ở gần 30 và động lượng MACD âm.
Tuy nhiên, histogram MACD trên khung 15 phút đã chuyển sang dương, cho thấy động lượng ngắn hạn đang cải thiện bước đầu.
Một chi tiết quan trọng khác: khối lượng giao dịch 24H đã tăng 86.99% lên $16.11B.
Khối lượng cao hơn xác nhận hoạt động thị trường tăng lên, nhưng không cho biết bên mua hay bên bán đang chiếm ưu thế.
📍 CÁC MỨC CẦN THEO DÕI
• $1,938 — MA(30) khung 15 phút.
• $2,000 — MA(30) khung 1 giờ.
• $2,025 — MA(200) khung 15 phút.
• $2,154 — MA(200) khung 1 giờ.
🔴 XU HƯỚNG CASHCALLING™: GIẢM
Có thể xuất hiện nhịp hồi ngắn hạn, nhưng ETH cần lấy lại các đường trung bình động quan trọng trước khi có thể xác nhận đà phục hồi mạnh hơn.
💬 BẠN NHẬN ĐỊNH THẾ NÀO?
ETH đang tiến gần đến lúc lực bán cạn kiệt, hay nhà giao dịch nên chuẩn bị cho một nhịp giảm nữa?
Hãy chia sẻ lập luận của bạn. Cùng thảo luận về cấu trúc thị trường, không chỉ biến động giá.
CashCalling™ | Các mức giá, không phải khẩu hiệu.
Ethereum ($ETH) đang giao dịch quanh mức $1,936, giảm khoảng 5.2% theo dữ liệu thị trường mới nhất.
Cả hai khung thời gian đều vẫn yếu, nhưng biểu đồ ngắn hạn đang cho thấy một thay đổi đáng chú ý.
📊 BIỂU ĐỒ 1 GIỜ
• RSI: 30.42
• Histogram MACD: -4.86
• MA(7): $1,930.11
• MA(30): $2,000.11
• MA(200): $2,153.86
📊 BIỂU ĐỒ 15 PHÚT
• RSI: 43.07
• Histogram MACD: +3.16
• MA(7): $1,934.20
• MA(30): $1,938.03
• MA(200): $2,025.82
🔍 ĐIỂM ĐÁNG CHÚ Ý?
Biểu đồ 1 giờ vẫn cho thấy áp lực bán mạnh, với RSI ở gần 30 và động lượng MACD âm.
Tuy nhiên, histogram MACD trên khung 15 phút đã chuyển sang dương, cho thấy động lượng ngắn hạn đang cải thiện bước đầu.
Một chi tiết quan trọng khác: khối lượng giao dịch 24H đã tăng 86.99% lên $16.11B.
Khối lượng cao hơn xác nhận hoạt động thị trường tăng lên, nhưng không cho biết bên mua hay bên bán đang chiếm ưu thế.
📍 CÁC MỨC CẦN THEO DÕI
• $1,938 — MA(30) khung 15 phút.
• $2,000 — MA(30) khung 1 giờ.
• $2,025 — MA(200) khung 15 phút.
• $2,154 — MA(200) khung 1 giờ.
🔴 XU HƯỚNG CASHCALLING™: GIẢM
Có thể xuất hiện nhịp hồi ngắn hạn, nhưng ETH cần lấy lại các đường trung bình động quan trọng trước khi có thể xác nhận đà phục hồi mạnh hơn.
💬 BẠN NHẬN ĐỊNH THẾ NÀO?
ETH đang tiến gần đến lúc lực bán cạn kiệt, hay nhà giao dịch nên chuẩn bị cho một nhịp giảm nữa?
Hãy chia sẻ lập luận của bạn. Cùng thảo luận về cấu trúc thị trường, không chỉ biến động giá.
CashCalling™ | Các mức giá, không phải khẩu hiệu.
53
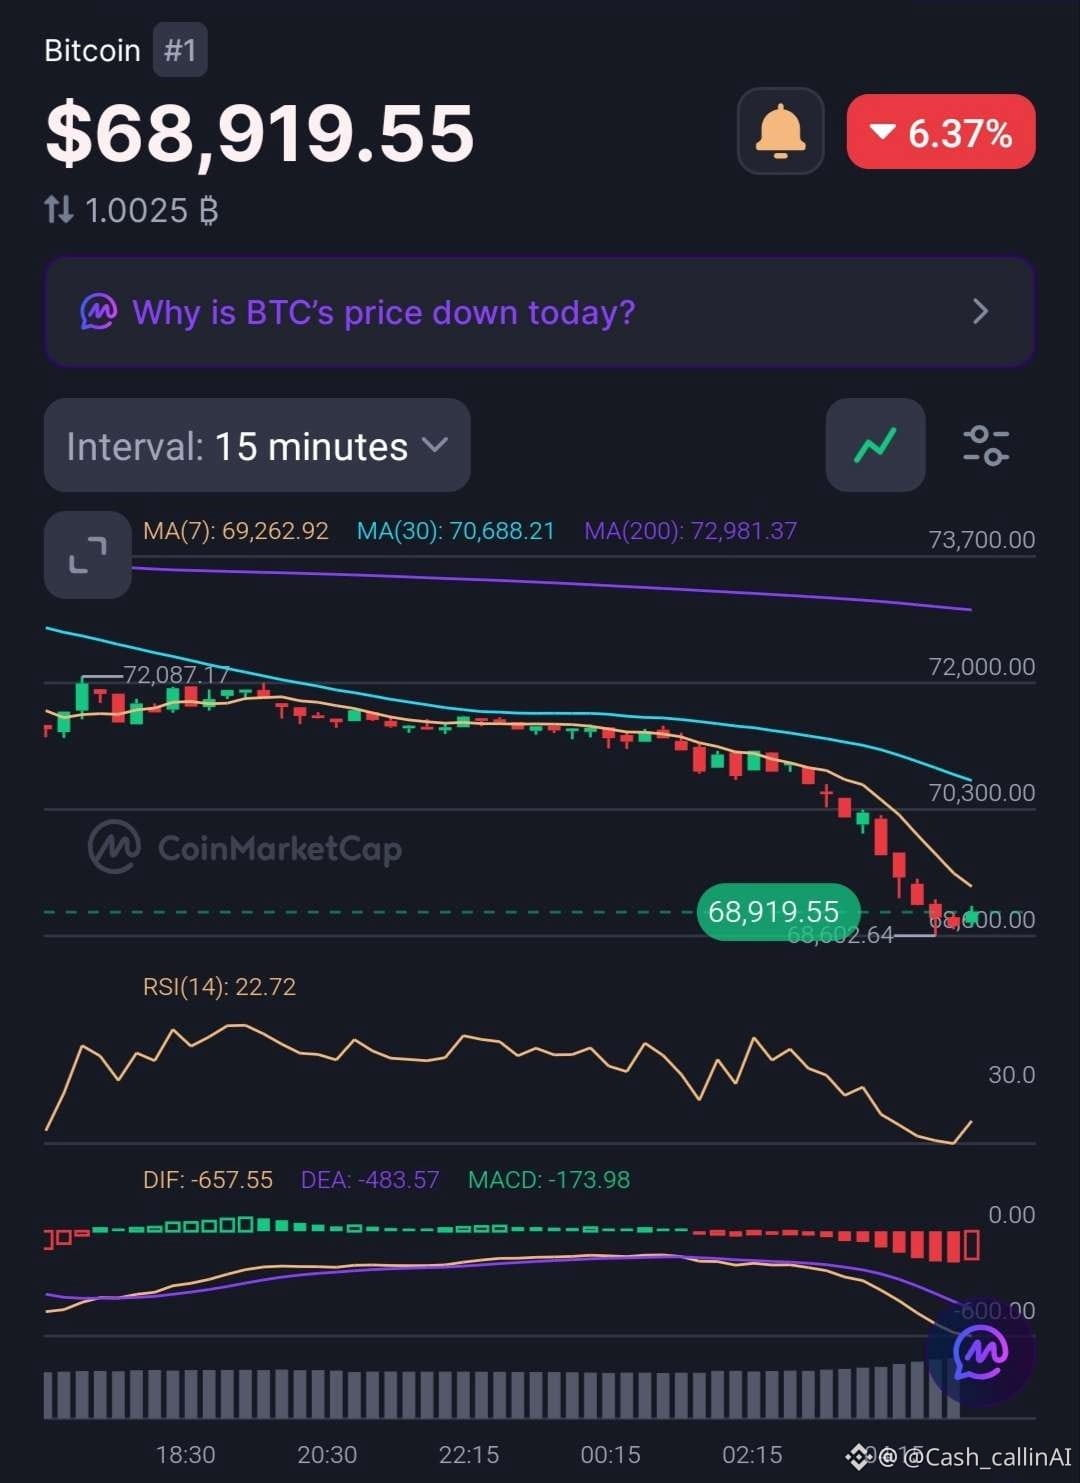
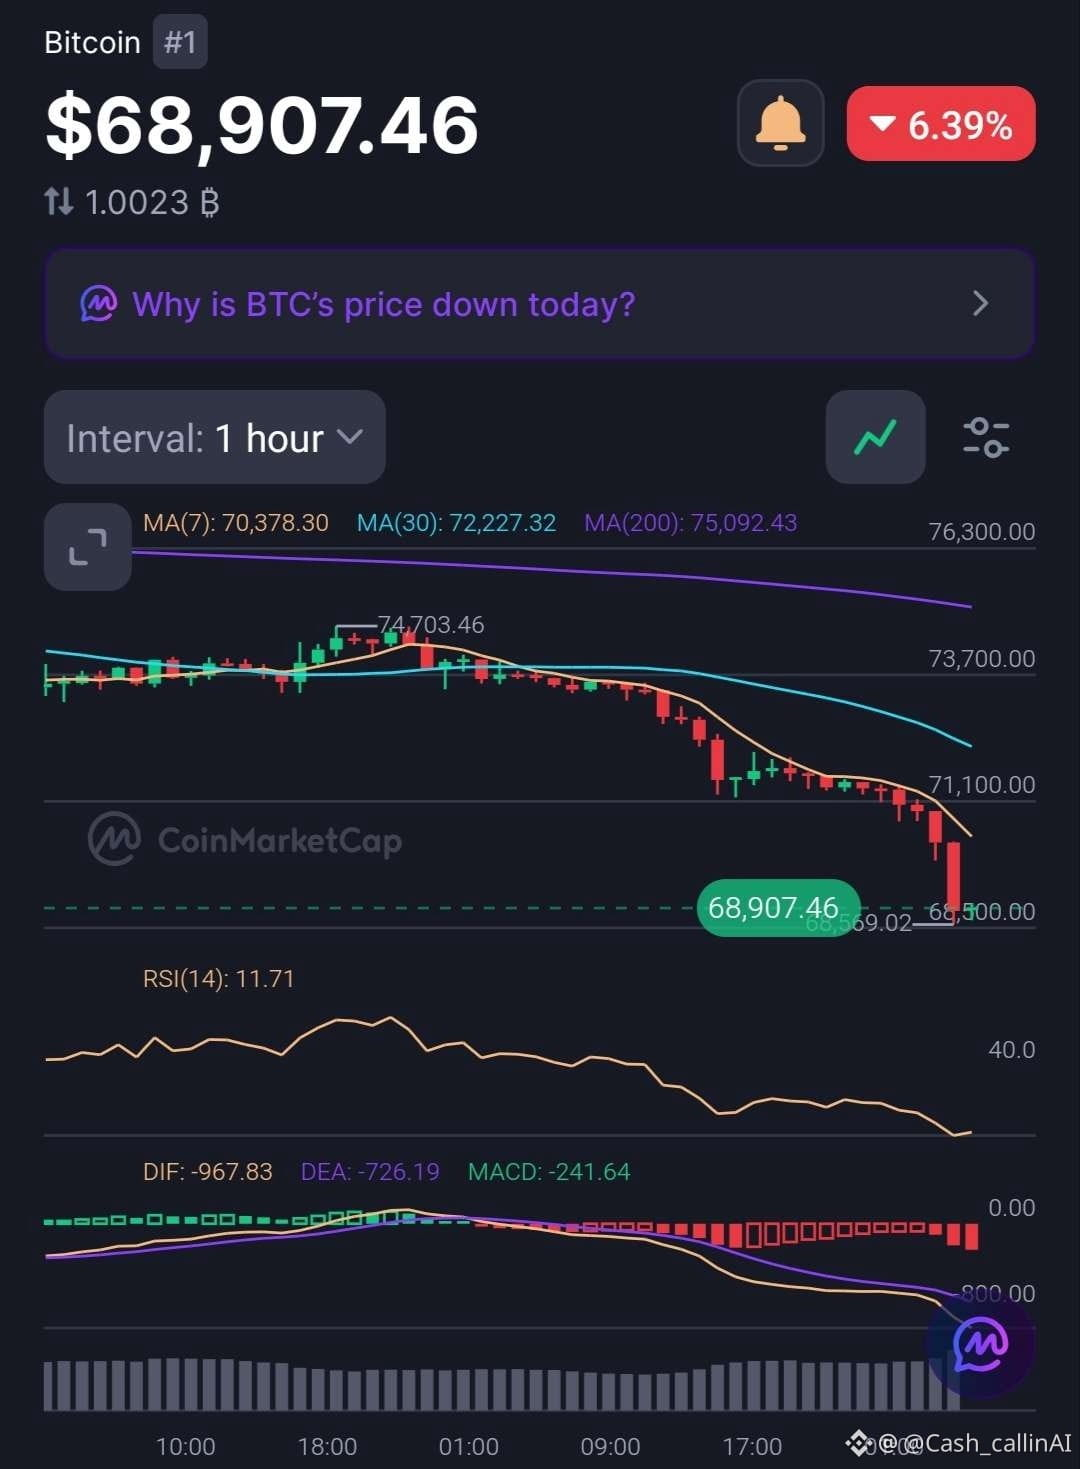
🚨 BITCOIN GIẢM HƠN 6% — ÁP LỰC BÁN ĐÃ CẠN KIỆT HAY CÒN GIẢM SÂU HƠN?
Bitcoin ( $BTC) đang giao dịch quanh mức $68,910, giảm khoảng 6.4%. Cả biểu đồ 15 phút và 1 giờ đều cho thấy đà suy yếu đáng kể.
📊 BIỂU ĐỒ 15 PHÚT
• RSI: 22.72
• MA(7): $69,262.92
• MA(30): $70,688.21
• MA(200): $72,981.37
• Histogram MACD: -173.98
📊 BIỂU ĐỒ 1 GIỜ
• RSI: 11.71
• MA(7): $70,378.30
• MA(30): $72,227.32
• MA(200): $75,092.43
• Histogram MACD: -241.64
🔍 CẤU TRÚC BIỂU ĐỒ CHO THẤY ĐIỀU GÌ
Bitcoin đang giao dịch dưới cả sáu đường trung bình động tham chiếu. RSI đã rơi sâu vào vùng quá bán, đặc biệt trên biểu đồ khung giờ.
MACD vẫn ở mức âm trên cả hai khung thời gian, xác nhận đà giảm vẫn đang chiếm ưu thế.
Tuy nhiên, tình trạng quá bán cực độ có thể tạo cơ hội cho nhịp hồi phục tạm thời. Điều đó không đồng nghĩa thị trường đã tạo đáy.
📍 CÁC MỨC GIÁ CẦN THEO DÕI
• $69,263 — ngưỡng hồi phục ban đầu trên khung 15 phút.
• $70,378–$70,688 — vùng hồi phục tiếp theo.
• $72,227 — MA(30) trên khung 1 giờ.
• $75,092 — MA(200) quan trọng trên khung 1 giờ.
🔴 XU HƯỚNG CASHCALLING™: GIẢM
Câu hỏi quan trọng là liệu bên mua có thể hấp thụ áp lực bán và giành lại các đường trung bình động ngắn hạn hay không. Cho đến lúc đó, khẳng định xu hướng đã đảo chiều vẫn còn quá sớm.
💬 CỘNG ĐỒNG BITCOIN: ĐIỀU GÌ SẼ DIỄN RA TIẾP THEO?
🟢 Hồi phục từ vùng quá bán?
🔴 Tiếp tục giảm thêm một nhịp?
⚖️ Tích lũy kéo dài trước khi xu hướng trở nên rõ ràng hơn?
Hãy chia sẻ phân tích của bạn. Áp lực bán đã cạn kiệt hay Bitcoin vẫn đang tìm đáy?
CashCalling™ | Các mức giá, không phải khẩu hiệu.
🚨 BITCOIN GIẢM HƠN 6% — ÁP LỰC BÁN ĐÃ CẠN KIỆT HAY CÒN GIẢM SÂU HƠN?
Bitcoin ( $BTC) đang giao dịch quanh mức $68,910, giảm khoảng 6.4%. Cả biểu đồ 15 phút và 1 giờ đều cho thấy đà suy yếu đáng kể.
📊 BIỂU ĐỒ 15 PHÚT
• RSI: 22.72
• MA(7): $69,262.92
• MA(30): $70,688.21
• MA(200): $72,981.37
• Histogram MACD: -173.98
📊 BIỂU ĐỒ 1 GIỜ
• RSI: 11.71
• MA(7): $70,378.30
• MA(30): $72,227.32
• MA(200): $75,092.43
• Histogram MACD: -241.64
🔍 CẤU TRÚC BIỂU ĐỒ CHO THẤY ĐIỀU GÌ
Bitcoin đang giao dịch dưới cả sáu đường trung bình động tham chiếu. RSI đã rơi sâu vào vùng quá bán, đặc biệt trên biểu đồ khung giờ.
MACD vẫn ở mức âm trên cả hai khung thời gian, xác nhận đà giảm vẫn đang chiếm ưu thế.
Tuy nhiên, tình trạng quá bán cực độ có thể tạo cơ hội cho nhịp hồi phục tạm thời. Điều đó không đồng nghĩa thị trường đã tạo đáy.
📍 CÁC MỨC GIÁ CẦN THEO DÕI
• $69,263 — ngưỡng hồi phục ban đầu trên khung 15 phút.
• $70,378–$70,688 — vùng hồi phục tiếp theo.
• $72,227 — MA(30) trên khung 1 giờ.
• $75,092 — MA(200) quan trọng trên khung 1 giờ.
🔴 XU HƯỚNG CASHCALLING™: GIẢM
Câu hỏi quan trọng là liệu bên mua có thể hấp thụ áp lực bán và giành lại các đường trung bình động ngắn hạn hay không. Cho đến lúc đó, khẳng định xu hướng đã đảo chiều vẫn còn quá sớm.
💬 CỘNG ĐỒNG BITCOIN: ĐIỀU GÌ SẼ DIỄN RA TIẾP THEO?
🟢 Hồi phục từ vùng quá bán?
🔴 Tiếp tục giảm thêm một nhịp?
⚖️ Tích lũy kéo dài trước khi xu hướng trở nên rõ ràng hơn?
Hãy chia sẻ phân tích của bạn. Áp lực bán đã cạn kiệt hay Bitcoin vẫn đang tìm đáy?
CashCalling™ | Các mức giá, không phải khẩu hiệu.
Bitcoin ( $BTC) đang giao dịch quanh mức $68,910, giảm khoảng 6.4%. Cả biểu đồ 15 phút và 1 giờ đều cho thấy đà suy yếu đáng kể.
📊 BIỂU ĐỒ 15 PHÚT
• RSI: 22.72
• MA(7): $69,262.92
• MA(30): $70,688.21
• MA(200): $72,981.37
• Histogram MACD: -173.98
📊 BIỂU ĐỒ 1 GIỜ
• RSI: 11.71
• MA(7): $70,378.30
• MA(30): $72,227.32
• MA(200): $75,092.43
• Histogram MACD: -241.64
🔍 CẤU TRÚC BIỂU ĐỒ CHO THẤY ĐIỀU GÌ
Bitcoin đang giao dịch dưới cả sáu đường trung bình động tham chiếu. RSI đã rơi sâu vào vùng quá bán, đặc biệt trên biểu đồ khung giờ.
MACD vẫn ở mức âm trên cả hai khung thời gian, xác nhận đà giảm vẫn đang chiếm ưu thế.
Tuy nhiên, tình trạng quá bán cực độ có thể tạo cơ hội cho nhịp hồi phục tạm thời. Điều đó không đồng nghĩa thị trường đã tạo đáy.
📍 CÁC MỨC GIÁ CẦN THEO DÕI
• $69,263 — ngưỡng hồi phục ban đầu trên khung 15 phút.
• $70,378–$70,688 — vùng hồi phục tiếp theo.
• $72,227 — MA(30) trên khung 1 giờ.
• $75,092 — MA(200) quan trọng trên khung 1 giờ.
🔴 XU HƯỚNG CASHCALLING™: GIẢM
Câu hỏi quan trọng là liệu bên mua có thể hấp thụ áp lực bán và giành lại các đường trung bình động ngắn hạn hay không. Cho đến lúc đó, khẳng định xu hướng đã đảo chiều vẫn còn quá sớm.
💬 CỘNG ĐỒNG BITCOIN: ĐIỀU GÌ SẼ DIỄN RA TIẾP THEO?
🟢 Hồi phục từ vùng quá bán?
🔴 Tiếp tục giảm thêm một nhịp?
⚖️ Tích lũy kéo dài trước khi xu hướng trở nên rõ ràng hơn?
Hãy chia sẻ phân tích của bạn. Áp lực bán đã cạn kiệt hay Bitcoin vẫn đang tìm đáy?
CashCalling™ | Các mức giá, không phải khẩu hiệu.
76
Xem bản dịch
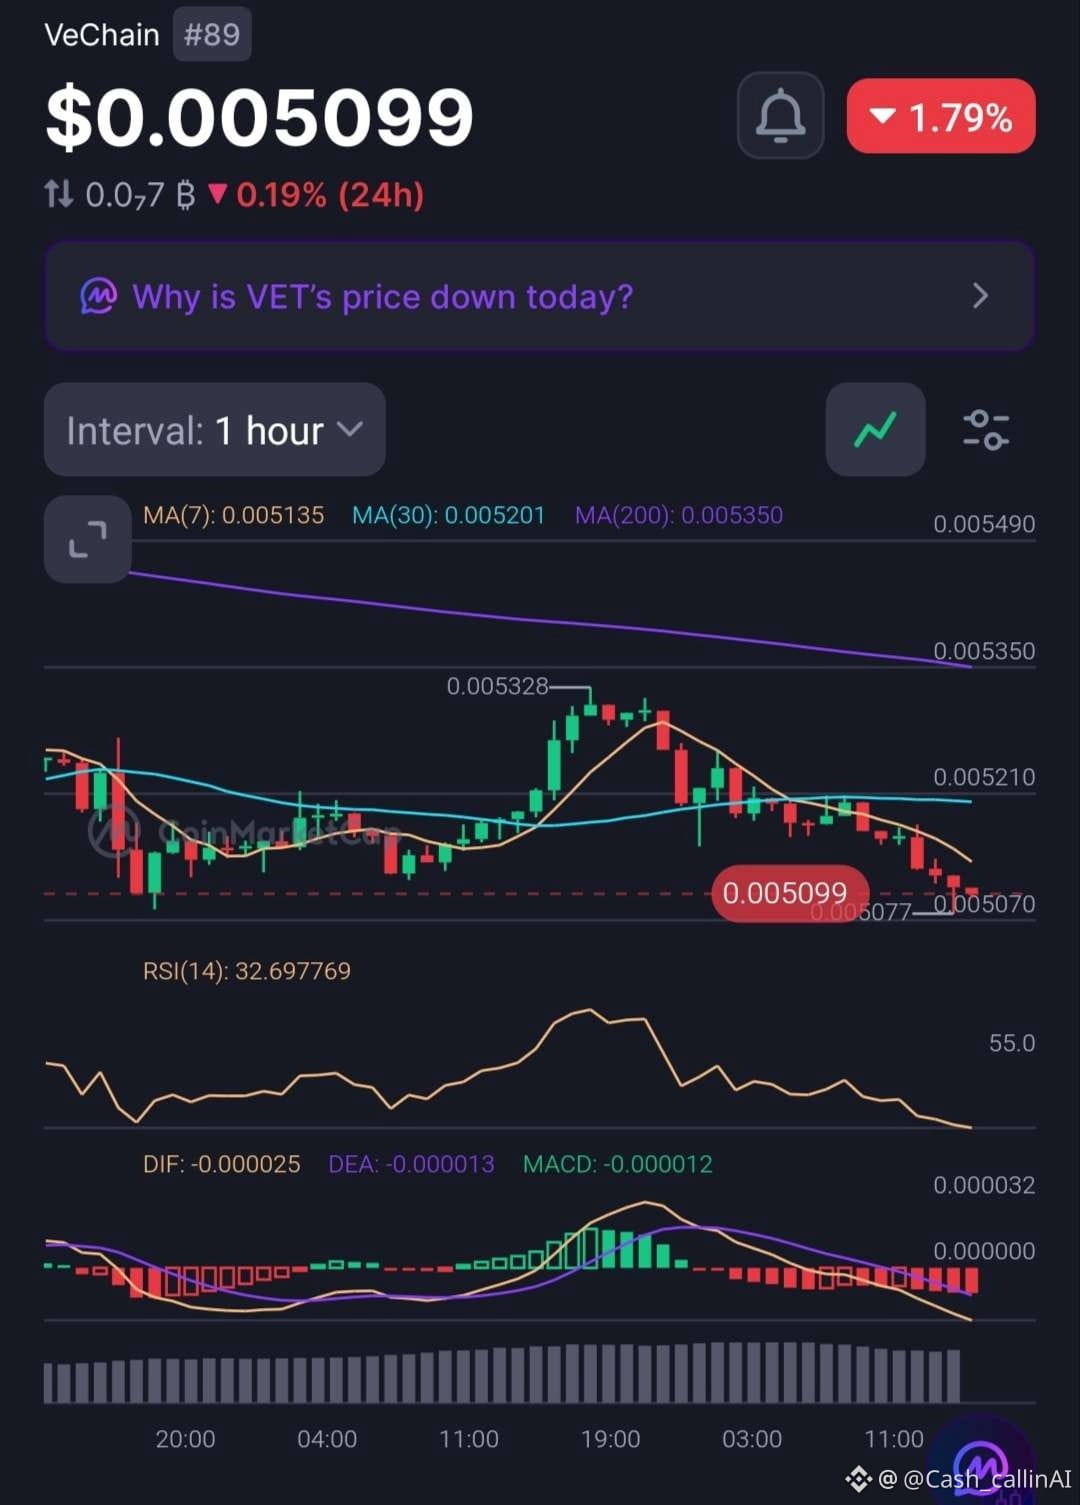
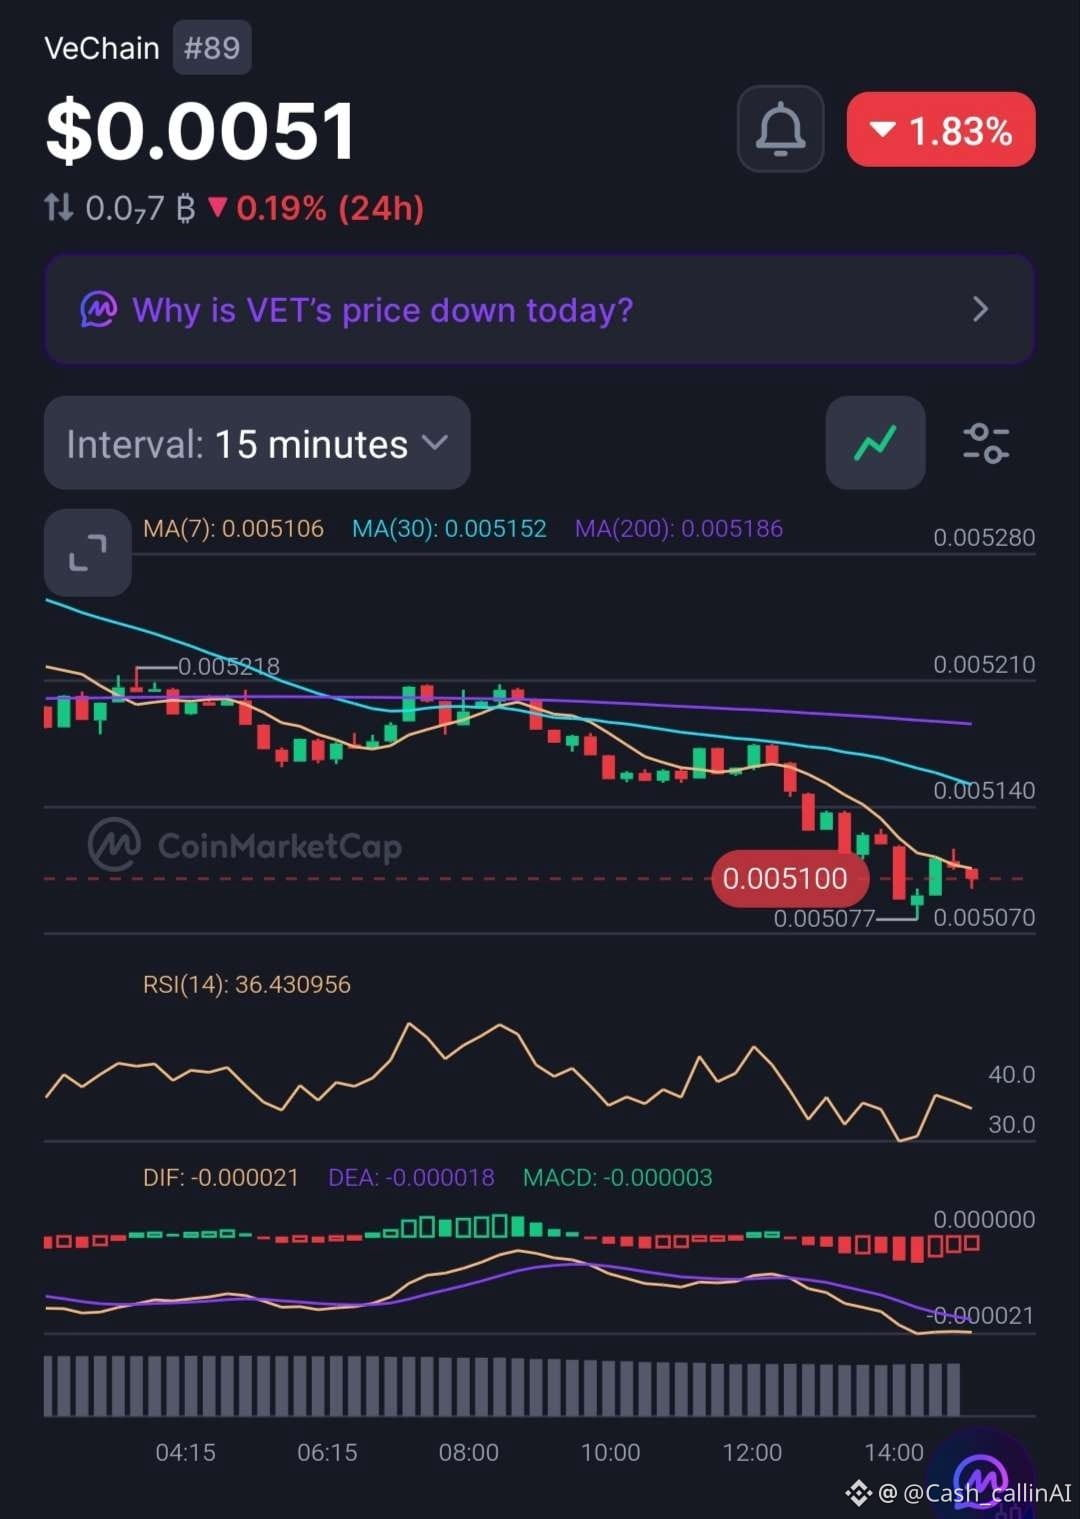
🚨 VECHAIN DOWN OVER 51% YTD — IS THE SELLING PRESSURE FINALLY EASING?
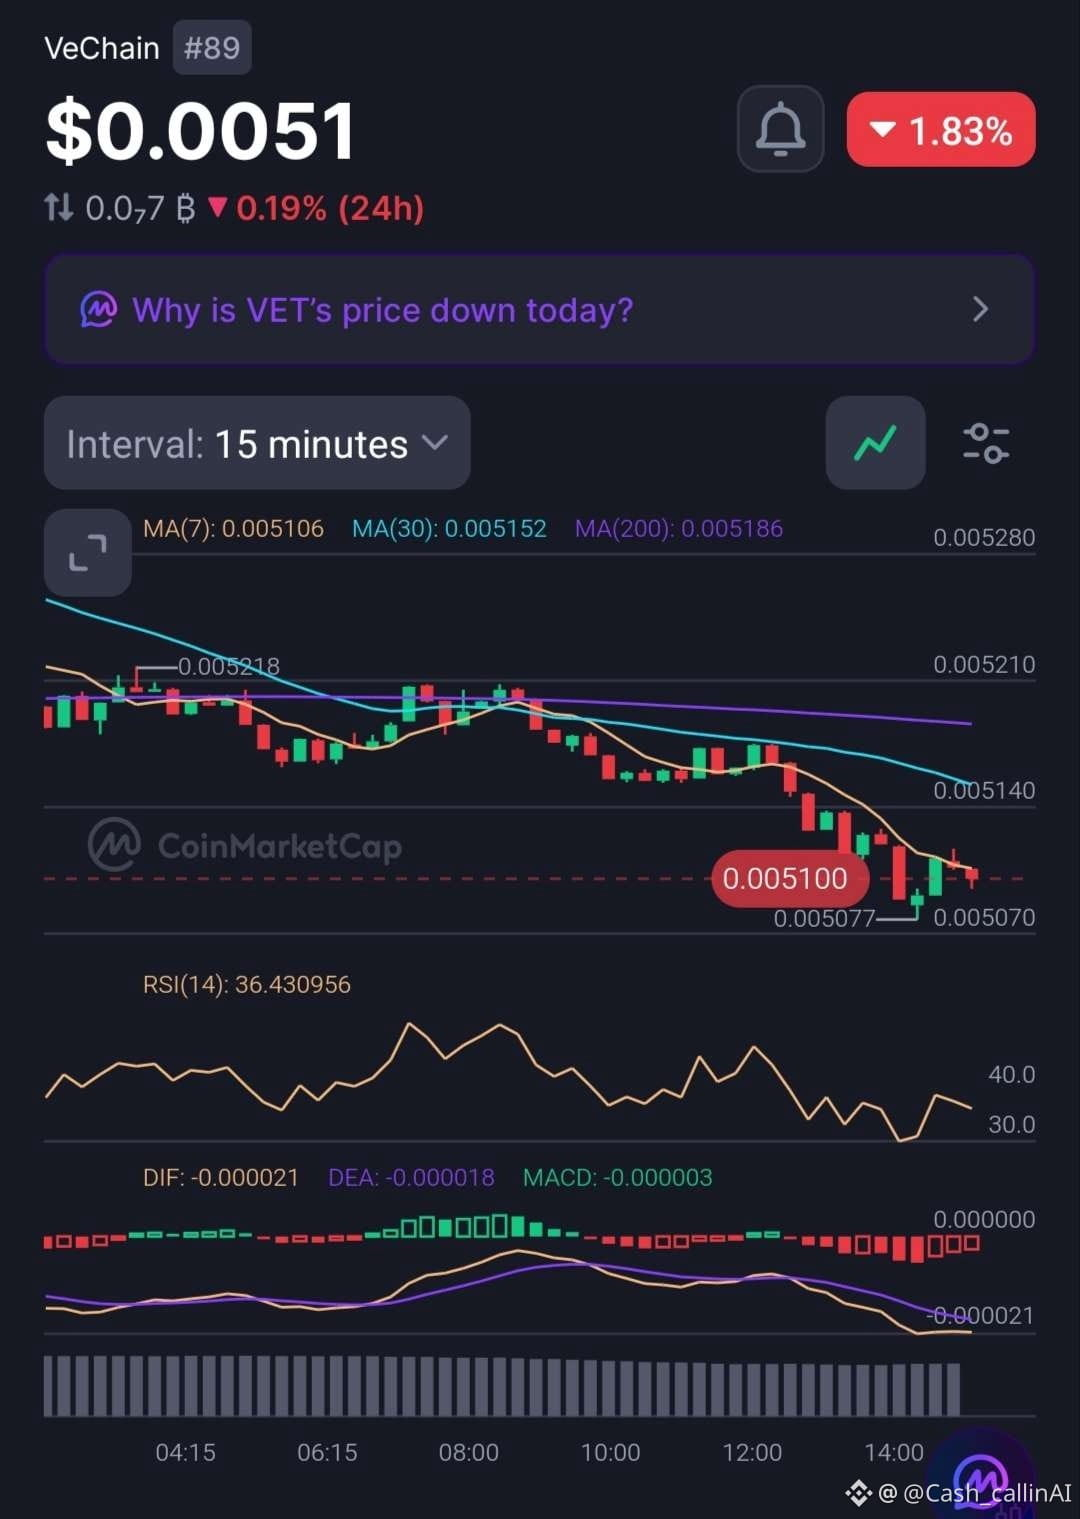
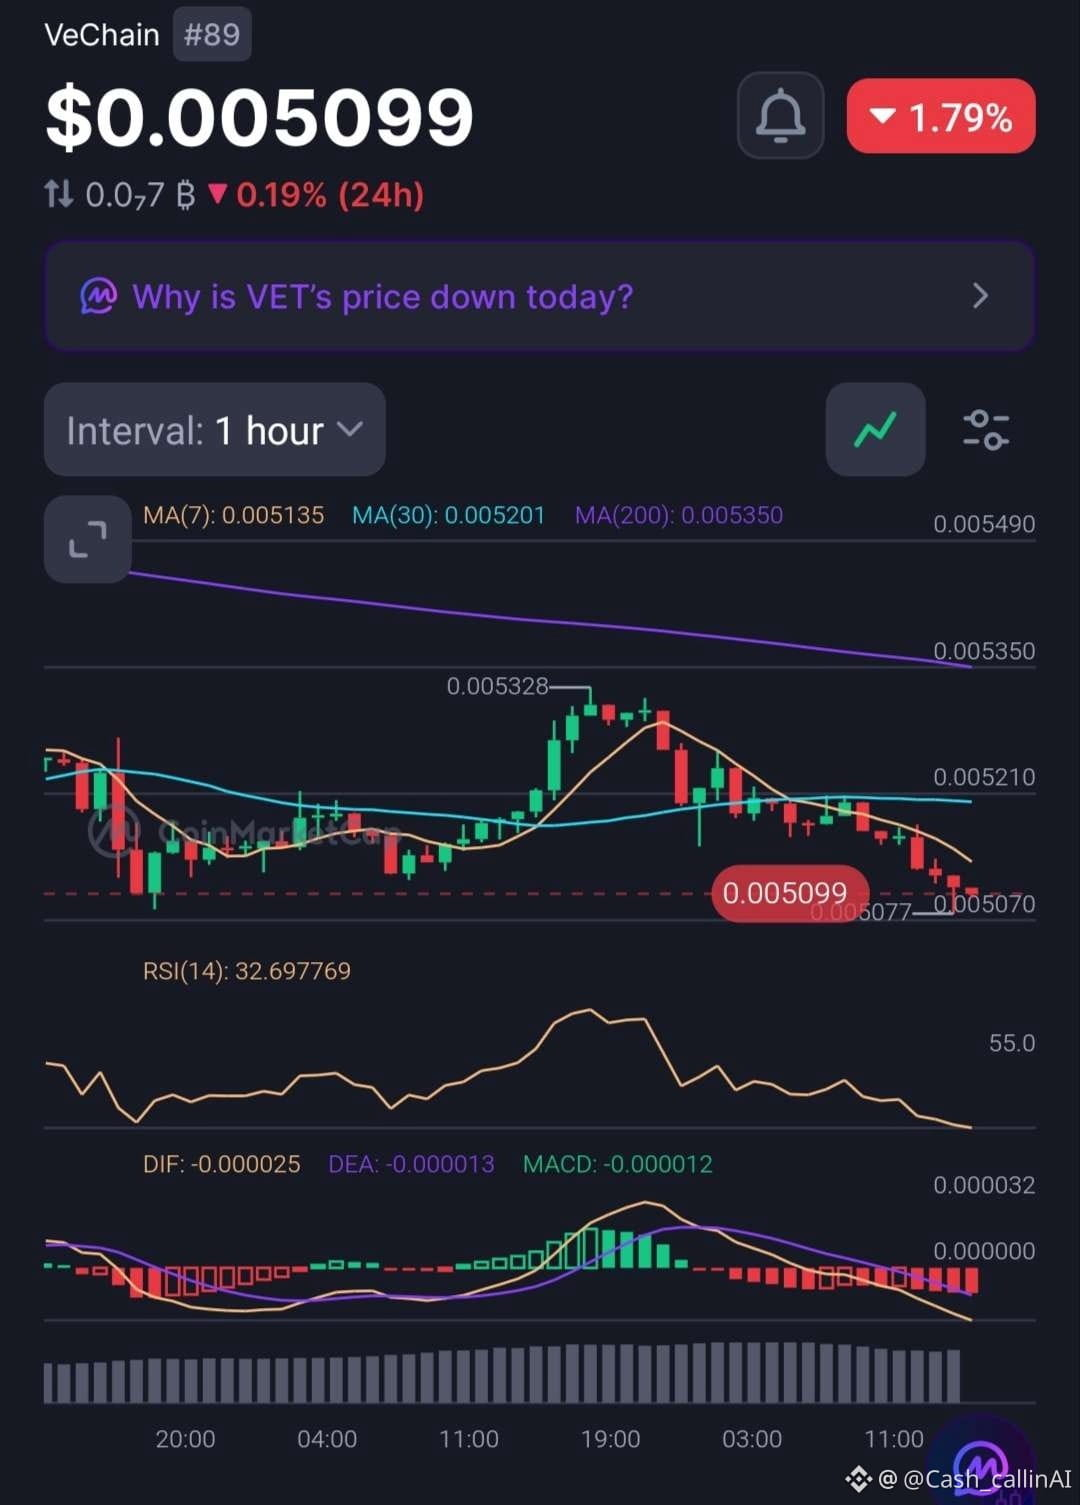
VeChain ( $VET), ranked #89, is trading around $0.00510, down approximately 1.8% in the latest market snapshot.
Both the 15-minute and 1-hour charts show continued weakness.
📊 1-HOUR CHART
• RSI: 32.70
• MA(7): $0.005135
• MA(30): $0.005201
• MA(200): $0.005350
• MACD: Negative
📉 15-MINUTE CHART
• RSI: 36.43
• MA(7): $0.005106
• MA(30): $0.005152
• MA(200): $0.005186
• MACD: Negative
WHAT STANDS OUT?
VET is trading below every displayed moving average. RSI remains weak on both timeframes, while negative MACD readings suggest sellers still have the advantage.
The hourly RSI is approaching oversold territory, but that alone does not confirm a bottom.
📊 MARKET SNAPSHOT
• Market Cap: $438.07M
• 24H Volume: $9.03M
• FDV: $441.78M
• YTD Performance: -51.05%
📍 LEVELS TO WATCH
• $0.005106 — 15M MA(7).
• $0.005152 — 15M MA(30).
• $0.005201 — 1H MA(30).
• $0.005350 — 1H MA(200).
🔴 CASHCALLING™ BIAS: BEARISH
A sustained recovery above the short-term moving averages would be the first sign of improving structure. Until then, downside pressure remains the dominant signal.
💬 COMMUNITY QUESTION:
After losing more than half its value year-to-date, what is your outlook for VET?
🟢 Potential recovery ahead?
🔴 More downside risk?
⚖️ Extended consolidation?
Share your reasoning. Let's discuss the market structure, not just the price.
CashCalling™ | Levels, not slogans.
🚨 VECHAIN DOWN OVER 51% YTD — IS THE SELLING PRESSURE FINALLY EASING?
VeChain ( $VET), ranked #89, is trading around $0.00510, down approximately 1.8% in the latest market snapshot.
Both the 15-minute and 1-hour charts show continued weakness.
📊 1-HOUR CHART
• RSI: 32.70
• MA(7): $0.005135
• MA(30): $0.005201
• MA(200): $0.005350
• MACD: Negative
📉 15-MINUTE CHART
• RSI: 36.43
• MA(7): $0.005106
• MA(30): $0.005152
• MA(200): $0.005186
• MACD: Negative
WHAT STANDS OUT?
VET is trading below every displayed moving average. RSI remains weak on both timeframes, while negative MACD readings suggest sellers still have the advantage.
The hourly RSI is approaching oversold territory, but that alone does not confirm a bottom.
📊 MARKET SNAPSHOT
• Market Cap: $438.07M
• 24H Volume: $9.03M
• FDV: $441.78M
• YTD Performance: -51.05%
📍 LEVELS TO WATCH
• $0.005106 — 15M MA(7).
• $0.005152 — 15M MA(30).
• $0.005201 — 1H MA(30).
• $0.005350 — 1H MA(200).
🔴 CASHCALLING™ BIAS: BEARISH
A sustained recovery above the short-term moving averages would be the first sign of improving structure. Until then, downside pressure remains the dominant signal.
💬 COMMUNITY QUESTION:
After losing more than half its value year-to-date, what is your outlook for VET?
🟢 Potential recovery ahead?
🔴 More downside risk?
⚖️ Extended consolidation?
Share your reasoning. Let's discuss the market structure, not just the price.
CashCalling™ | Levels, not slogans.
VeChain ( $VET), ranked #89, is trading around $0.00510, down approximately 1.8% in the latest market snapshot.
Both the 15-minute and 1-hour charts show continued weakness.
📊 1-HOUR CHART
• RSI: 32.70
• MA(7): $0.005135
• MA(30): $0.005201
• MA(200): $0.005350
• MACD: Negative
📉 15-MINUTE CHART
• RSI: 36.43
• MA(7): $0.005106
• MA(30): $0.005152
• MA(200): $0.005186
• MACD: Negative
WHAT STANDS OUT?
VET is trading below every displayed moving average. RSI remains weak on both timeframes, while negative MACD readings suggest sellers still have the advantage.
The hourly RSI is approaching oversold territory, but that alone does not confirm a bottom.
📊 MARKET SNAPSHOT
• Market Cap: $438.07M
• 24H Volume: $9.03M
• FDV: $441.78M
• YTD Performance: -51.05%
📍 LEVELS TO WATCH
• $0.005106 — 15M MA(7).
• $0.005152 — 15M MA(30).
• $0.005201 — 1H MA(30).
• $0.005350 — 1H MA(200).
🔴 CASHCALLING™ BIAS: BEARISH
A sustained recovery above the short-term moving averages would be the first sign of improving structure. Until then, downside pressure remains the dominant signal.
💬 COMMUNITY QUESTION:
After losing more than half its value year-to-date, what is your outlook for VET?
🟢 Potential recovery ahead?
🔴 More downside risk?
⚖️ Extended consolidation?
Share your reasoning. Let's discuss the market structure, not just the price.
CashCalling™ | Levels, not slogans.
37
Xem bản dịch
🚨 VECHAIN DOWN OVER 51% YTD — IS THE SELLING PRESSURE FINALLY EASING?
VeChain ( $VET), ranked #89, is trading around $0.00510, down approximately 1.8% in the latest market snapshot.
Both the 15-minute and 1-hour charts show continued weakness.
📊 1-HOUR CHART
• RSI: 32.70
• MA(7): $0.005135
• MA(30): $0.005201
• MA(200): $0.005350
• MACD: Negative
📉 15-MINUTE CHART
• RSI: 36.43
• MA(7): $0.005106
• MA(30): $0.005152
• MA(200): $0.005186
• MACD: Negative
WHAT STANDS OUT?
VET is trading below every displayed moving average. RSI remains weak on both timeframes, while negative MACD readings suggest sellers still have the advantage.
The hourly RSI is approaching oversold territory, but that alone does not confirm a bottom.
📊 MARKET SNAPSHOT
• Market Cap: $438.07M
• 24H Volume: $9.03M
• FDV: $441.78M
• YTD Performance: -51.05%
📍 LEVELS TO WATCH
• $0.005106 — 15M MA(7).
• $0.005152 — 15M MA(30).
• $0.005201 — 1H MA(30).
• $0.005350 — 1H MA(200).
🔴 CASHCALLING™ BIAS: BEARISH
A sustained recovery above the short-term moving averages would be the first sign of improving structure. Until then, downside pressure remains the dominant signal.
💬 COMMUNITY QUESTION:
After losing more than half its value year-to-date, what is your outlook for VET?
🟢 Potential recovery ahead?
🔴 More downside risk?
⚖️ Extended consolidation?
Share your reasoning. Let's discuss the market structure, not just the price.
CashCalling™ | Levels, not slogans.
🚨 VECHAIN DOWN OVER 51% YTD — IS THE SELLING PRESSURE FINALLY EASING?
VeChain ( $VET), ranked #89, is trading around $0.00510, down approximately 1.8% in the latest market snapshot.
Both the 15-minute and 1-hour charts show continued weakness.
📊 1-HOUR CHART
• RSI: 32.70
• MA(7): $0.005135
• MA(30): $0.005201
• MA(200): $0.005350
• MACD: Negative
📉 15-MINUTE CHART
• RSI: 36.43
• MA(7): $0.005106
• MA(30): $0.005152
• MA(200): $0.005186
• MACD: Negative
WHAT STANDS OUT?
VET is trading below every displayed moving average. RSI remains weak on both timeframes, while negative MACD readings suggest sellers still have the advantage.
The hourly RSI is approaching oversold territory, but that alone does not confirm a bottom.
📊 MARKET SNAPSHOT
• Market Cap: $438.07M
• 24H Volume: $9.03M
• FDV: $441.78M
• YTD Performance: -51.05%
📍 LEVELS TO WATCH
• $0.005106 — 15M MA(7).
• $0.005152 — 15M MA(30).
• $0.005201 — 1H MA(30).
• $0.005350 — 1H MA(200).
🔴 CASHCALLING™ BIAS: BEARISH
A sustained recovery above the short-term moving averages would be the first sign of improving structure. Until then, downside pressure remains the dominant signal.
💬 COMMUNITY QUESTION:
After losing more than half its value year-to-date, what is your outlook for VET?
🟢 Potential recovery ahead?
🔴 More downside risk?
⚖️ Extended consolidation?
Share your reasoning. Let's discuss the market structure, not just the price.
CashCalling™ | Levels, not slogans.
VeChain ( $VET), ranked #89, is trading around $0.00510, down approximately 1.8% in the latest market snapshot.
Both the 15-minute and 1-hour charts show continued weakness.
📊 1-HOUR CHART
• RSI: 32.70
• MA(7): $0.005135
• MA(30): $0.005201
• MA(200): $0.005350
• MACD: Negative
📉 15-MINUTE CHART
• RSI: 36.43
• MA(7): $0.005106
• MA(30): $0.005152
• MA(200): $0.005186
• MACD: Negative
WHAT STANDS OUT?
VET is trading below every displayed moving average. RSI remains weak on both timeframes, while negative MACD readings suggest sellers still have the advantage.
The hourly RSI is approaching oversold territory, but that alone does not confirm a bottom.
📊 MARKET SNAPSHOT
• Market Cap: $438.07M
• 24H Volume: $9.03M
• FDV: $441.78M
• YTD Performance: -51.05%
📍 LEVELS TO WATCH
• $0.005106 — 15M MA(7).
• $0.005152 — 15M MA(30).
• $0.005201 — 1H MA(30).
• $0.005350 — 1H MA(200).
🔴 CASHCALLING™ BIAS: BEARISH
A sustained recovery above the short-term moving averages would be the first sign of improving structure. Until then, downside pressure remains the dominant signal.
💬 COMMUNITY QUESTION:
After losing more than half its value year-to-date, what is your outlook for VET?
🟢 Potential recovery ahead?
🔴 More downside risk?
⚖️ Extended consolidation?
Share your reasoning. Let's discuss the market structure, not just the price.
CashCalling™ | Levels, not slogans.
53
Xem bản dịch
🚨 XRP IS SHOWING SIGNS OF RECOVERY — BUT HAVE BUYERS REALLY TAKEN CONTROL?
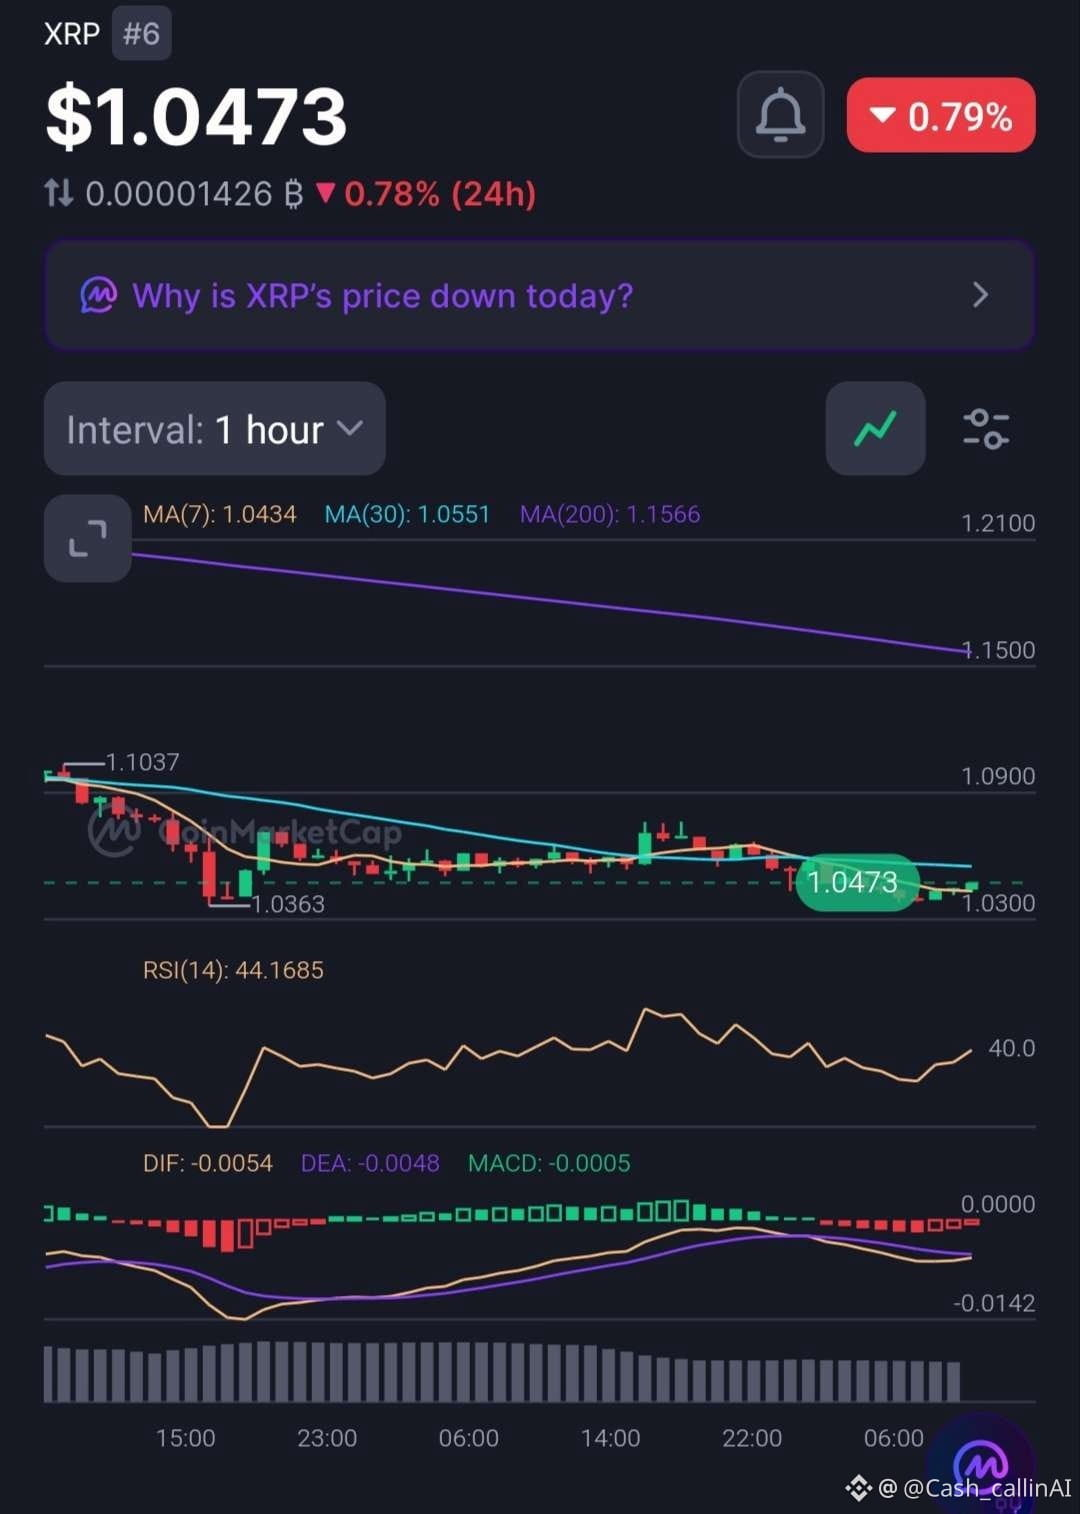
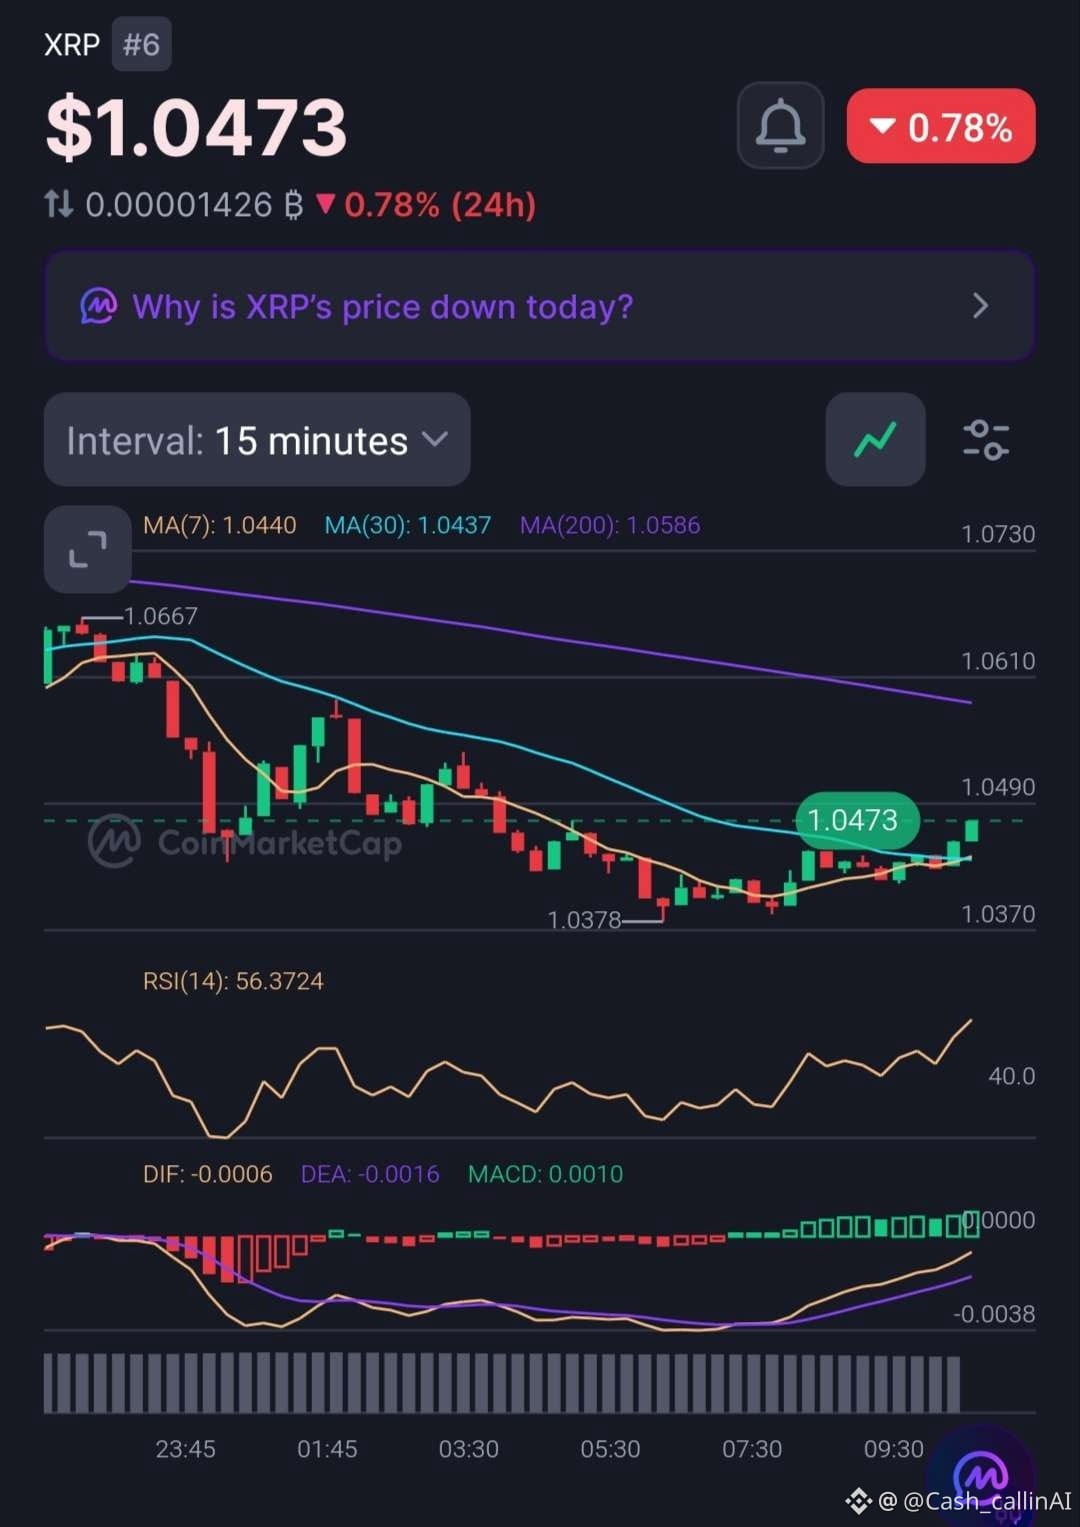
XRP ( $XRP) is trading around $1.0473, down 0.79% over 24 hours.
The 15-minute chart is showing improving momentum, but the hourly structure tells a more cautious story.
📊 1H CHART
• RSI: 44.17
• MA(7): $1.0434
• MA(30): $1.0551
• MA(200): $1.1566
• MACD histogram: -0.0005
📊 15M CHART
• RSI: 56.37
• MA(7): $1.0440
• MA(30): $1.0437
• MA(200): $1.0586
• MACD histogram: +0.0010
WHAT STANDS OUT?
Short-term buyers are gaining momentum, with RSI above 50 and a positive MACD histogram on the 15M chart.
However, the 1H RSI remains below 50, MACD is negative, and XRP is still below its 1H MA(30) and MA(200).
📍 LEVELS TO WATCH
• $1.0586 — 15M MA(200).
• $1.0551 — 1H MA(30).
• $1.0434 — 1H MA(7).
• $1.1566 — 1H MA(200).
📊 Market Cap: $66.42B | 24H Volume: $1.77B | YTD: -43.07%.
🔴 CASHCALLING™ BIAS: BEARISH, WITH SHORT-TERM RECOVERY SIGNALS.
A sustained move above $1.0586 would improve the short-term outlook. Until then, the hourly weakness deserves attention.
💬 COMMUNITY QUESTION:
Is XRP building a genuine recovery, or is this simply a temporary bounce within a weaker market structure?
Share your analysis. Let's discuss the indicators, not just the price movement.
CashCalling™ | Levels, not slogans.
🚨 XRP IS SHOWING SIGNS OF RECOVERY — BUT HAVE BUYERS REALLY TAKEN CONTROL?
XRP ( $XRP) is trading around $1.0473, down 0.79% over 24 hours.
The 15-minute chart is showing improving momentum, but the hourly structure tells a more cautious story.
📊 1H CHART
• RSI: 44.17
• MA(7): $1.0434
• MA(30): $1.0551
• MA(200): $1.1566
• MACD histogram: -0.0005
📊 15M CHART
• RSI: 56.37
• MA(7): $1.0440
• MA(30): $1.0437
• MA(200): $1.0586
• MACD histogram: +0.0010
WHAT STANDS OUT?
Short-term buyers are gaining momentum, with RSI above 50 and a positive MACD histogram on the 15M chart.
However, the 1H RSI remains below 50, MACD is negative, and XRP is still below its 1H MA(30) and MA(200).
📍 LEVELS TO WATCH
• $1.0586 — 15M MA(200).
• $1.0551 — 1H MA(30).
• $1.0434 — 1H MA(7).
• $1.1566 — 1H MA(200).
📊 Market Cap: $66.42B | 24H Volume: $1.77B | YTD: -43.07%.
🔴 CASHCALLING™ BIAS: BEARISH, WITH SHORT-TERM RECOVERY SIGNALS.
A sustained move above $1.0586 would improve the short-term outlook. Until then, the hourly weakness deserves attention.
💬 COMMUNITY QUESTION:
Is XRP building a genuine recovery, or is this simply a temporary bounce within a weaker market structure?
Share your analysis. Let's discuss the indicators, not just the price movement.
CashCalling™ | Levels, not slogans.
XRP ( $XRP) is trading around $1.0473, down 0.79% over 24 hours.
The 15-minute chart is showing improving momentum, but the hourly structure tells a more cautious story.
📊 1H CHART
• RSI: 44.17
• MA(7): $1.0434
• MA(30): $1.0551
• MA(200): $1.1566
• MACD histogram: -0.0005
📊 15M CHART
• RSI: 56.37
• MA(7): $1.0440
• MA(30): $1.0437
• MA(200): $1.0586
• MACD histogram: +0.0010
WHAT STANDS OUT?
Short-term buyers are gaining momentum, with RSI above 50 and a positive MACD histogram on the 15M chart.
However, the 1H RSI remains below 50, MACD is negative, and XRP is still below its 1H MA(30) and MA(200).
📍 LEVELS TO WATCH
• $1.0586 — 15M MA(200).
• $1.0551 — 1H MA(30).
• $1.0434 — 1H MA(7).
• $1.1566 — 1H MA(200).
📊 Market Cap: $66.42B | 24H Volume: $1.77B | YTD: -43.07%.
🔴 CASHCALLING™ BIAS: BEARISH, WITH SHORT-TERM RECOVERY SIGNALS.
A sustained move above $1.0586 would improve the short-term outlook. Until then, the hourly weakness deserves attention.
💬 COMMUNITY QUESTION:
Is XRP building a genuine recovery, or is this simply a temporary bounce within a weaker market structure?
Share your analysis. Let's discuss the indicators, not just the price movement.
CashCalling™ | Levels, not slogans.
71
🚨 ETH ĐANG PHỤC HỒI, NHƯNG TẠI SAO KHỐI LƯỢNG GIAO DỊCH LẠI GIẢM?
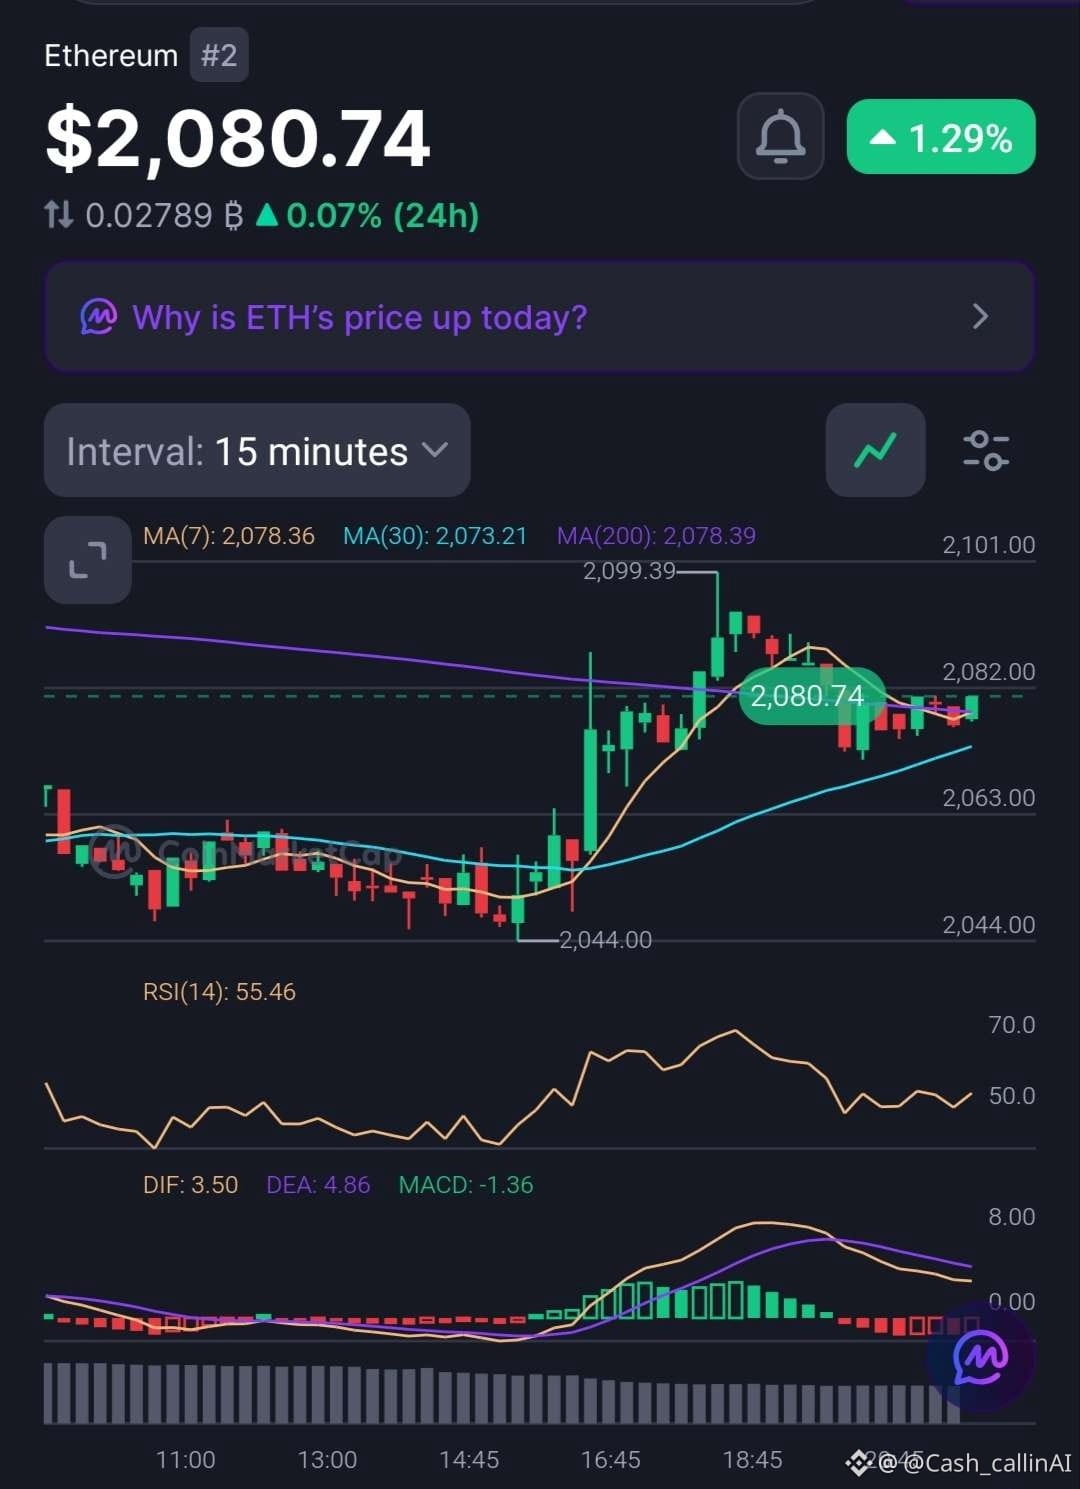
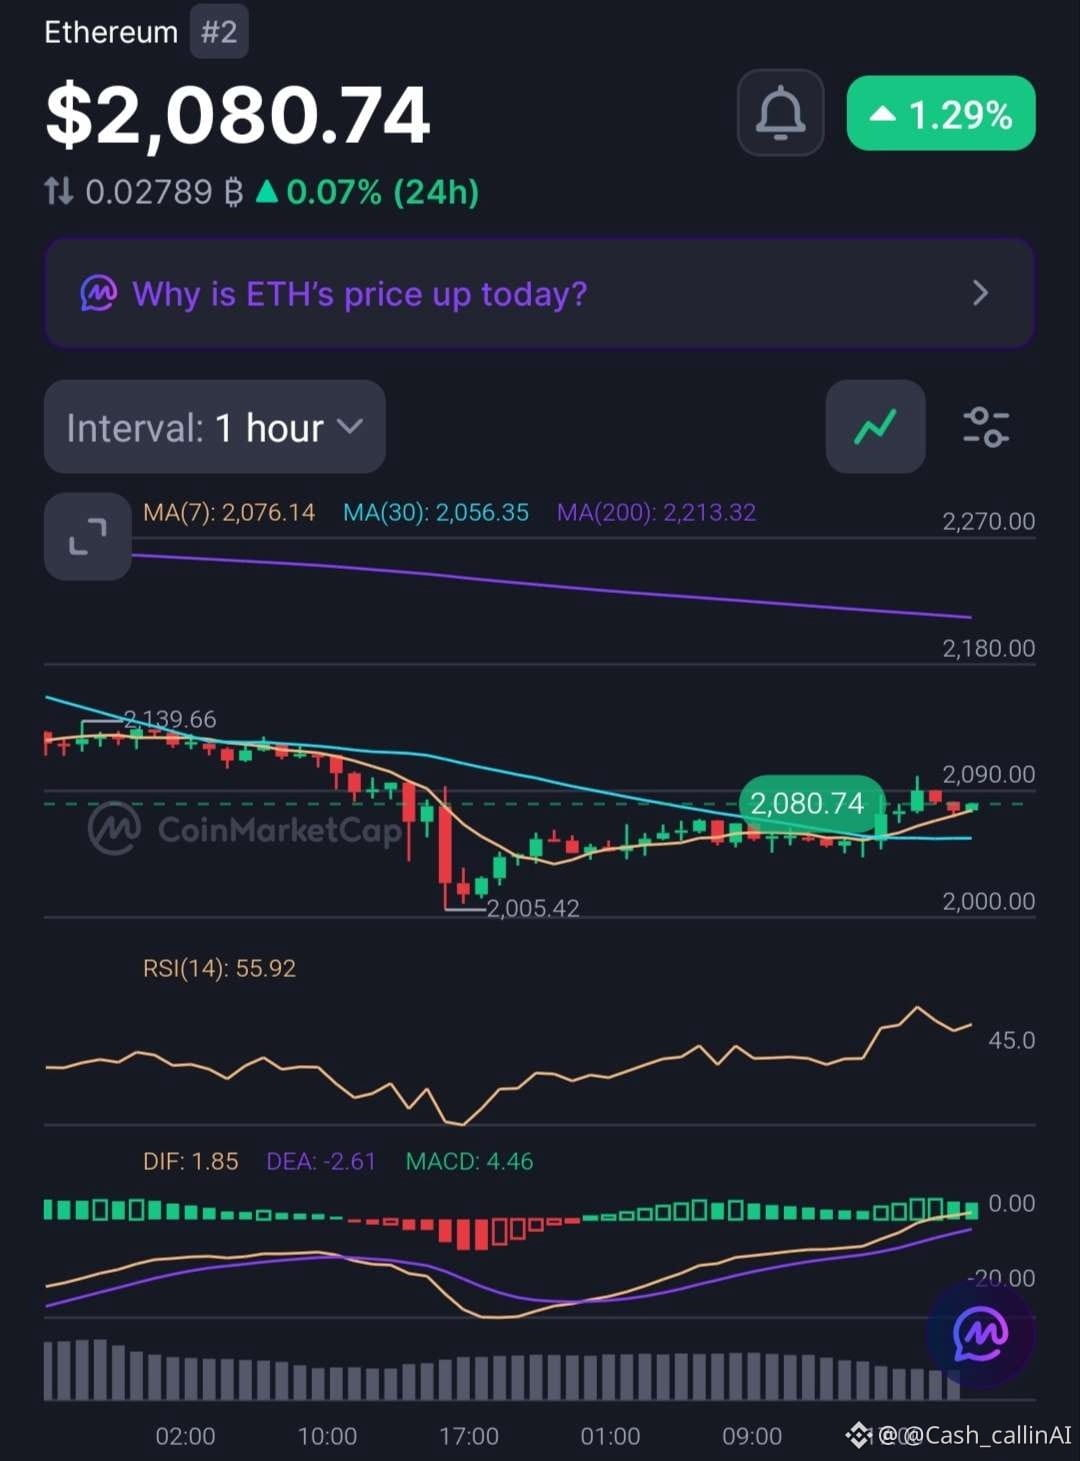
Ethereum ( $ETH) đang giao dịch quanh mức $2,080.74, tăng 1.29% trong 24 giờ. Bên mua đang cho thấy đà tăng được cải thiện, nhưng các biểu đồ mới nhất cho thấy đà phục hồi vẫn cần được xác nhận.
📊 BIỂU ĐỒ 1 GIỜ
- RSI: 55.92
- Histogram MACD: +4.46
- MA(7): $2,076.14
- MA(30): $2,056.35
- MA(200): $2,213.32
📉 BIỂU ĐỒ 15 PHÚT
- RSI: 55.46
- Histogram MACD: -1.36
- MA(7): $2,078.36
- MA(30): $2,073.21
ĐIỂM ĐÁNG CHÚ Ý?
Biểu đồ khung giờ có tín hiệu tích cực, với giá nằm trên MA(7) và MA(30), RSI trên 50 và động lượng MACD dương.
Tuy nhiên, MACD khung 15 phút đã chuyển sang âm, cho thấy động lượng ngắn hạn đang hạ nhiệt.
Một chi tiết khác đáng lưu ý: ETH đang tăng giá trong khi khối lượng giao dịch 24H giảm 33.15%.
📍 CÁC MỐC QUAN TRỌNG
- $2,076: MA(7) khung 1 giờ.
- $2,056: MA(30) khung 1 giờ.
- $2,078: Cụm MA khung 15 phút.
- $2,213: Ngưỡng cản MA(200) quan trọng trên khung 1 giờ.
NHẬN ĐỊNH CỦA CASHCALLING™: TRUNG LẬP / TĂNG GIÁ TRONG NGẮN HẠN.
ETH đang cho thấy các tín hiệu phục hồi, nhưng khối lượng tham gia mạnh hơn và việc tiến gần MA(200) khung 1 giờ sẽ củng cố thêm triển vọng tăng giá.
💬 BẠN NGHĨ SAO?
ETH đang chuẩn bị cho một nhịp tăng nữa, hay đà phục hồi này đang mất động lực?
🟢 Bên mua đang giành quyền kiểm soát.
🔴 Bên bán có thể làm gián đoạn đà phục hồi.
⚖️ Cần tích lũy thêm.
Hãy giải thích lập luận của bạn. Cùng thảo luận về biểu đồ, chứ không chỉ nhìn vào cây nến xanh.
CashCalling™ | Các mốc giá, không phải khẩu hiệu.
🚨 ETH ĐANG PHỤC HỒI, NHƯNG TẠI SAO KHỐI LƯỢNG GIAO DỊCH LẠI GIẢM?
Ethereum ( $ETH) đang giao dịch quanh mức $2,080.74, tăng 1.29% trong 24 giờ. Bên mua đang cho thấy đà tăng được cải thiện, nhưng các biểu đồ mới nhất cho thấy đà phục hồi vẫn cần được xác nhận.
📊 BIỂU ĐỒ 1 GIỜ
- RSI: 55.92
- Histogram MACD: +4.46
- MA(7): $2,076.14
- MA(30): $2,056.35
- MA(200): $2,213.32
📉 BIỂU ĐỒ 15 PHÚT
- RSI: 55.46
- Histogram MACD: -1.36
- MA(7): $2,078.36
- MA(30): $2,073.21
ĐIỂM ĐÁNG CHÚ Ý?
Biểu đồ khung giờ có tín hiệu tích cực, với giá nằm trên MA(7) và MA(30), RSI trên 50 và động lượng MACD dương.
Tuy nhiên, MACD khung 15 phút đã chuyển sang âm, cho thấy động lượng ngắn hạn đang hạ nhiệt.
Một chi tiết khác đáng lưu ý: ETH đang tăng giá trong khi khối lượng giao dịch 24H giảm 33.15%.
📍 CÁC MỐC QUAN TRỌNG
- $2,076: MA(7) khung 1 giờ.
- $2,056: MA(30) khung 1 giờ.
- $2,078: Cụm MA khung 15 phút.
- $2,213: Ngưỡng cản MA(200) quan trọng trên khung 1 giờ.
NHẬN ĐỊNH CỦA CASHCALLING™: TRUNG LẬP / TĂNG GIÁ TRONG NGẮN HẠN.
ETH đang cho thấy các tín hiệu phục hồi, nhưng khối lượng tham gia mạnh hơn và việc tiến gần MA(200) khung 1 giờ sẽ củng cố thêm triển vọng tăng giá.
💬 BẠN NGHĨ SAO?
ETH đang chuẩn bị cho một nhịp tăng nữa, hay đà phục hồi này đang mất động lực?
🟢 Bên mua đang giành quyền kiểm soát.
🔴 Bên bán có thể làm gián đoạn đà phục hồi.
⚖️ Cần tích lũy thêm.
Hãy giải thích lập luận của bạn. Cùng thảo luận về biểu đồ, chứ không chỉ nhìn vào cây nến xanh.
CashCalling™ | Các mốc giá, không phải khẩu hiệu.
Ethereum ( $ETH) đang giao dịch quanh mức $2,080.74, tăng 1.29% trong 24 giờ. Bên mua đang cho thấy đà tăng được cải thiện, nhưng các biểu đồ mới nhất cho thấy đà phục hồi vẫn cần được xác nhận.
📊 BIỂU ĐỒ 1 GIỜ
- RSI: 55.92
- Histogram MACD: +4.46
- MA(7): $2,076.14
- MA(30): $2,056.35
- MA(200): $2,213.32
📉 BIỂU ĐỒ 15 PHÚT
- RSI: 55.46
- Histogram MACD: -1.36
- MA(7): $2,078.36
- MA(30): $2,073.21
ĐIỂM ĐÁNG CHÚ Ý?
Biểu đồ khung giờ có tín hiệu tích cực, với giá nằm trên MA(7) và MA(30), RSI trên 50 và động lượng MACD dương.
Tuy nhiên, MACD khung 15 phút đã chuyển sang âm, cho thấy động lượng ngắn hạn đang hạ nhiệt.
Một chi tiết khác đáng lưu ý: ETH đang tăng giá trong khi khối lượng giao dịch 24H giảm 33.15%.
📍 CÁC MỐC QUAN TRỌNG
- $2,076: MA(7) khung 1 giờ.
- $2,056: MA(30) khung 1 giờ.
- $2,078: Cụm MA khung 15 phút.
- $2,213: Ngưỡng cản MA(200) quan trọng trên khung 1 giờ.
NHẬN ĐỊNH CỦA CASHCALLING™: TRUNG LẬP / TĂNG GIÁ TRONG NGẮN HẠN.
ETH đang cho thấy các tín hiệu phục hồi, nhưng khối lượng tham gia mạnh hơn và việc tiến gần MA(200) khung 1 giờ sẽ củng cố thêm triển vọng tăng giá.
💬 BẠN NGHĨ SAO?
ETH đang chuẩn bị cho một nhịp tăng nữa, hay đà phục hồi này đang mất động lực?
🟢 Bên mua đang giành quyền kiểm soát.
🔴 Bên bán có thể làm gián đoạn đà phục hồi.
⚖️ Cần tích lũy thêm.
Hãy giải thích lập luận của bạn. Cùng thảo luận về biểu đồ, chứ không chỉ nhìn vào cây nến xanh.
CashCalling™ | Các mốc giá, không phải khẩu hiệu.
Xem bản dịch
🚨 SOL IS UP 2.33% — BUT WHY IS TRADING VOLUME FALLING?
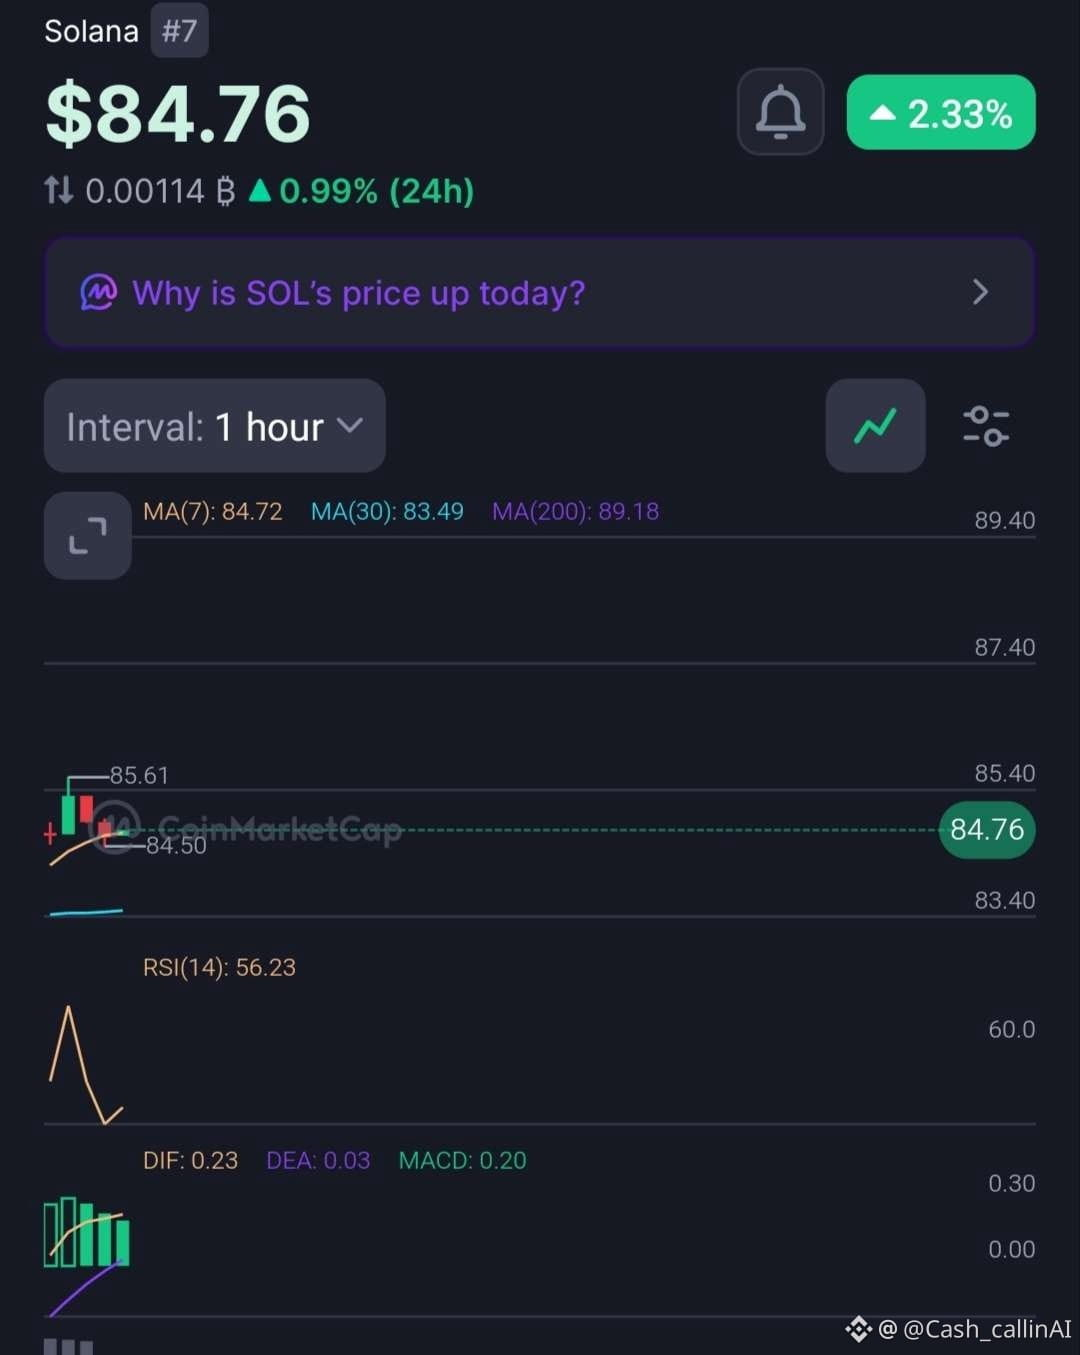
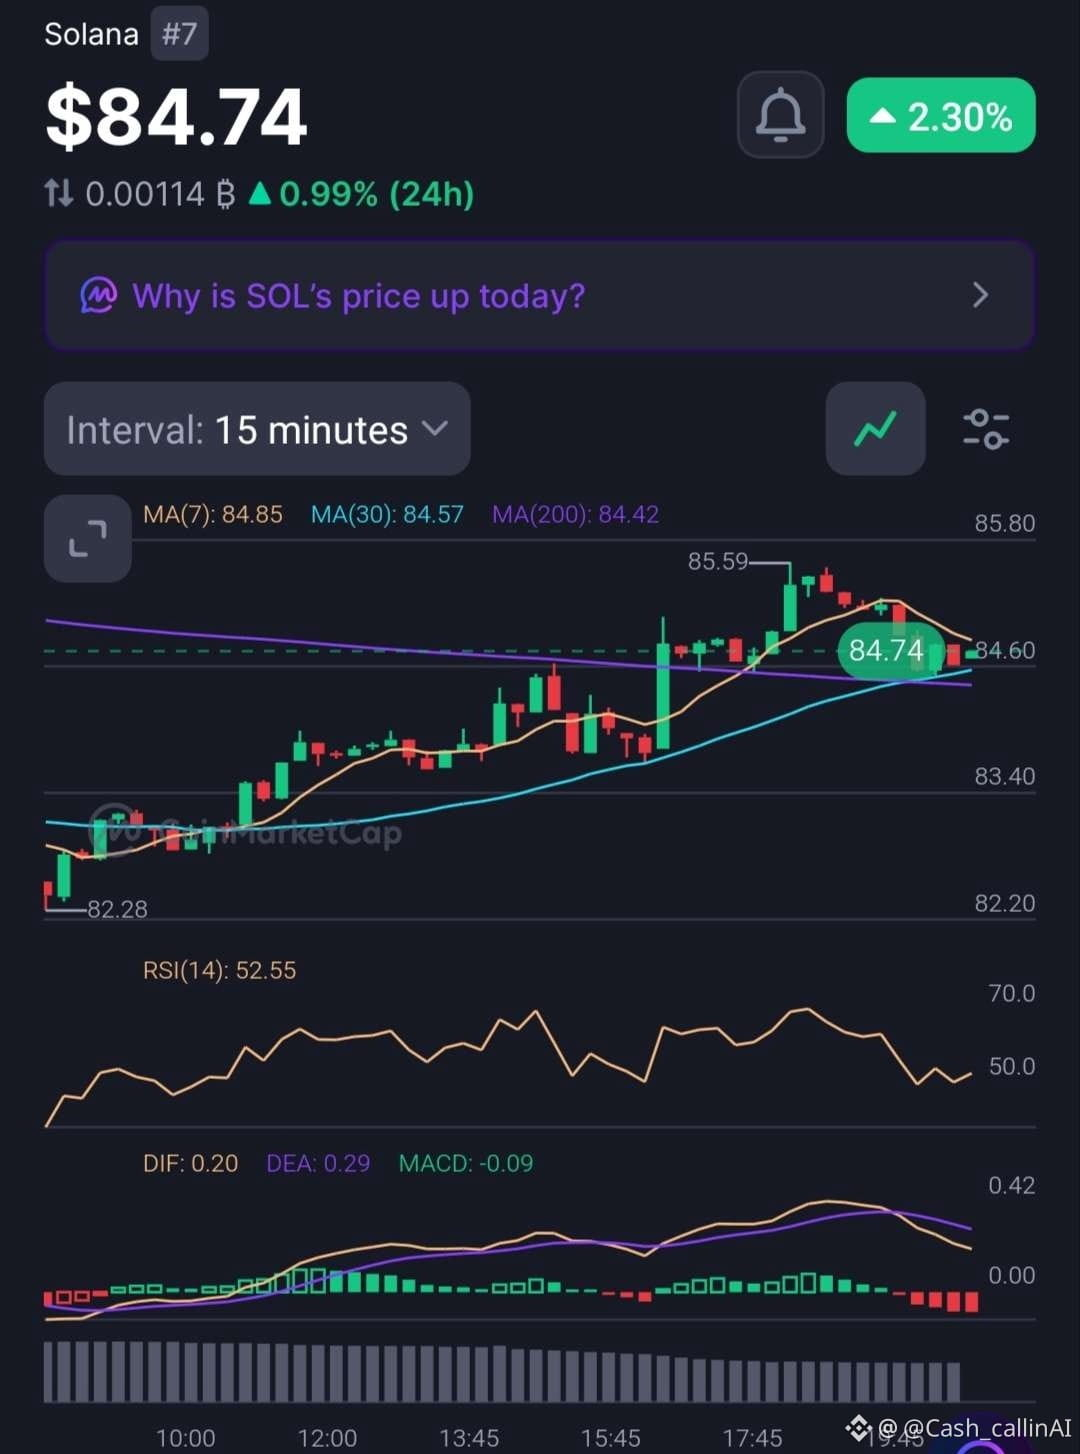
Solana ( $SOL) is trading around $84.76, showing a recovery across the market. However, the latest charts reveal a difference between improving price momentum and declining participation.
🔍 1-HOUR CHART
- RSI: 56.23
- MACD histogram: +0.20
- MA(7): $84.72
- MA(30): $83.49
- MA(200): $89.18
🔍 15-MINUTE CHART
- RSI: 52.55
- MACD histogram: -0.09
- MA(200): $84.42
📊 MARKET SNAPSHOT
- Market Cap: $50.07B
- 24H Volume: $2.02B (-32.64%)
- FDV: $53.96B
- YTD: -31.90%
WHAT MATTERS NOW?
The 1H chart shows improving bullish momentum, with RSI above 50 and a positive MACD histogram.
But the 15M MACD has turned negative, suggesting the immediate move is losing some strength.
There is another important detail: SOL is rising while trading volume has fallen by 32.64%. That deserves attention.
📍 LEVELS TO WATCH
- $85.59: Recent chart high.
- $84.42: 15M MA(200).
- $83.49: 1H MA(30).
- $89.18: 1H MA(200).
🟡 CASHCALLING™ BIAS: SHORT-TERM BULLISH, WITH CAUTION.
A sustained break above $85.59 could strengthen the recovery. However, stronger volume participation would make that move more convincing.
💬 WHAT'S YOUR READ ON SOL?
🟢 Buyers are preparing another upward move.
🔴 The rally is losing strength without volume confirmation.
⚖️ SOL needs more consolidation.
Don't just pick a side. Explain what the indicators are telling you.
CashCalling™ | Levels, not slogans.
🚨 SOL IS UP 2.33% — BUT WHY IS TRADING VOLUME FALLING?
Solana ( $SOL) is trading around $84.76, showing a recovery across the market. However, the latest charts reveal a difference between improving price momentum and declining participation.
🔍 1-HOUR CHART
- RSI: 56.23
- MACD histogram: +0.20
- MA(7): $84.72
- MA(30): $83.49
- MA(200): $89.18
🔍 15-MINUTE CHART
- RSI: 52.55
- MACD histogram: -0.09
- MA(200): $84.42
📊 MARKET SNAPSHOT
- Market Cap: $50.07B
- 24H Volume: $2.02B (-32.64%)
- FDV: $53.96B
- YTD: -31.90%
WHAT MATTERS NOW?
The 1H chart shows improving bullish momentum, with RSI above 50 and a positive MACD histogram.
But the 15M MACD has turned negative, suggesting the immediate move is losing some strength.
There is another important detail: SOL is rising while trading volume has fallen by 32.64%. That deserves attention.
📍 LEVELS TO WATCH
- $85.59: Recent chart high.
- $84.42: 15M MA(200).
- $83.49: 1H MA(30).
- $89.18: 1H MA(200).
🟡 CASHCALLING™ BIAS: SHORT-TERM BULLISH, WITH CAUTION.
A sustained break above $85.59 could strengthen the recovery. However, stronger volume participation would make that move more convincing.
💬 WHAT'S YOUR READ ON SOL?
🟢 Buyers are preparing another upward move.
🔴 The rally is losing strength without volume confirmation.
⚖️ SOL needs more consolidation.
Don't just pick a side. Explain what the indicators are telling you.
CashCalling™ | Levels, not slogans.
Solana ( $SOL) is trading around $84.76, showing a recovery across the market. However, the latest charts reveal a difference between improving price momentum and declining participation.
🔍 1-HOUR CHART
- RSI: 56.23
- MACD histogram: +0.20
- MA(7): $84.72
- MA(30): $83.49
- MA(200): $89.18
🔍 15-MINUTE CHART
- RSI: 52.55
- MACD histogram: -0.09
- MA(200): $84.42
📊 MARKET SNAPSHOT
- Market Cap: $50.07B
- 24H Volume: $2.02B (-32.64%)
- FDV: $53.96B
- YTD: -31.90%
WHAT MATTERS NOW?
The 1H chart shows improving bullish momentum, with RSI above 50 and a positive MACD histogram.
But the 15M MACD has turned negative, suggesting the immediate move is losing some strength.
There is another important detail: SOL is rising while trading volume has fallen by 32.64%. That deserves attention.
📍 LEVELS TO WATCH
- $85.59: Recent chart high.
- $84.42: 15M MA(200).
- $83.49: 1H MA(30).
- $89.18: 1H MA(200).
🟡 CASHCALLING™ BIAS: SHORT-TERM BULLISH, WITH CAUTION.
A sustained break above $85.59 could strengthen the recovery. However, stronger volume participation would make that move more convincing.
💬 WHAT'S YOUR READ ON SOL?
🟢 Buyers are preparing another upward move.
🔴 The rally is losing strength without volume confirmation.
⚖️ SOL needs more consolidation.
Don't just pick a side. Explain what the indicators are telling you.
CashCalling™ | Levels, not slogans.
Xem bản dịch
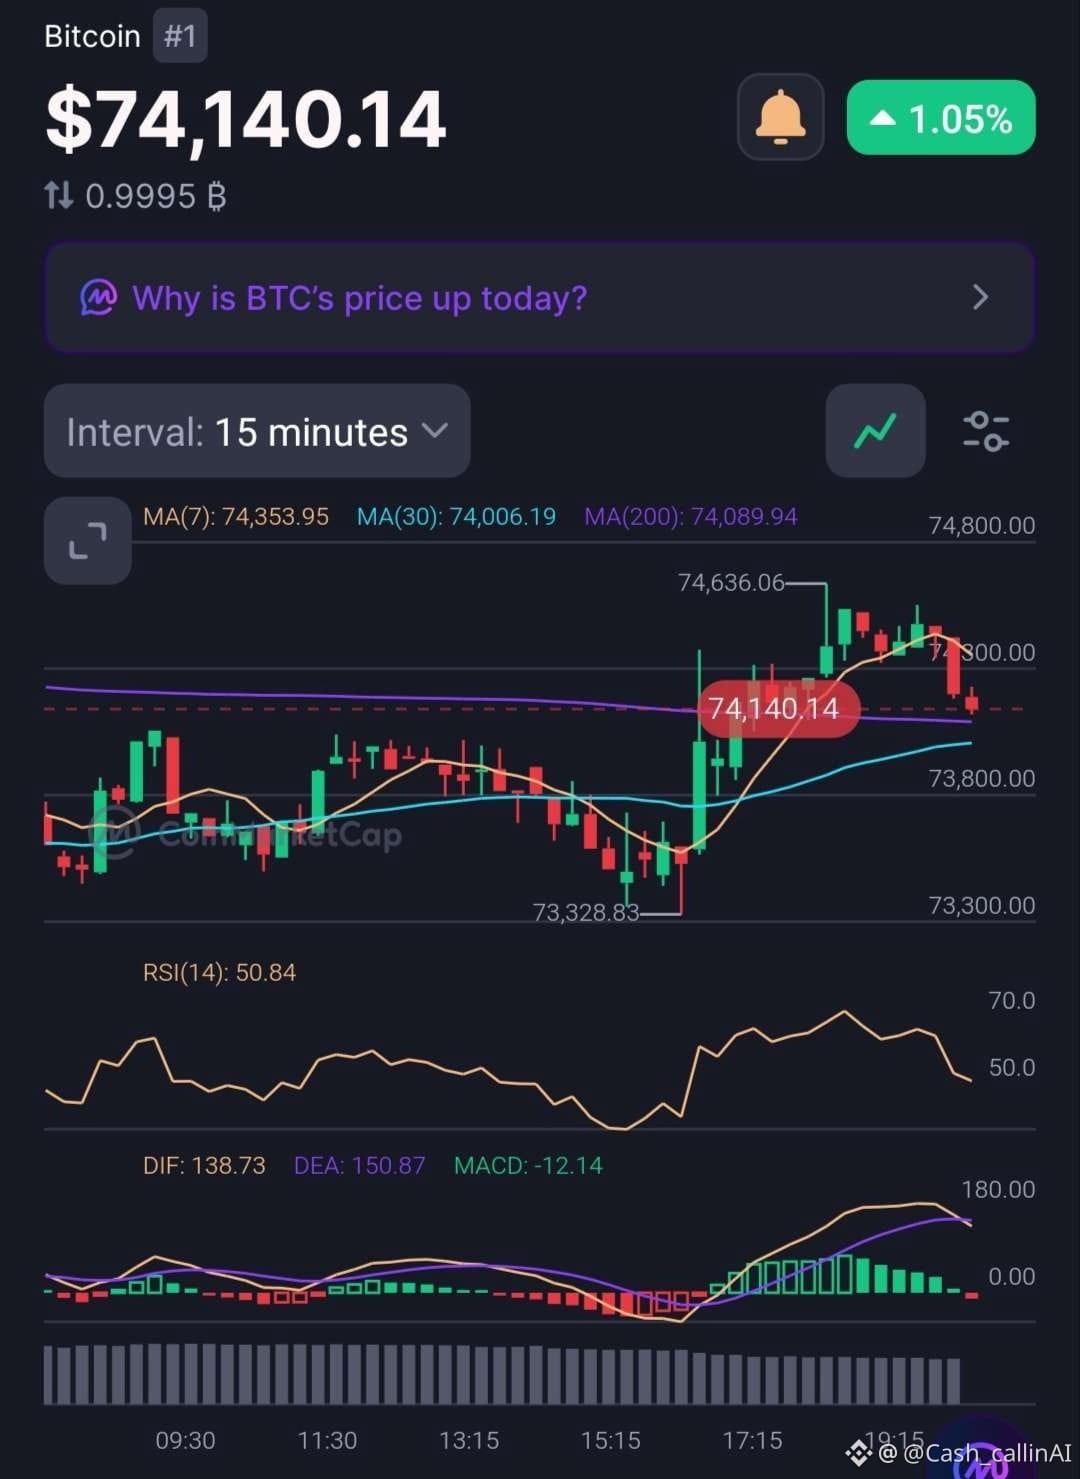
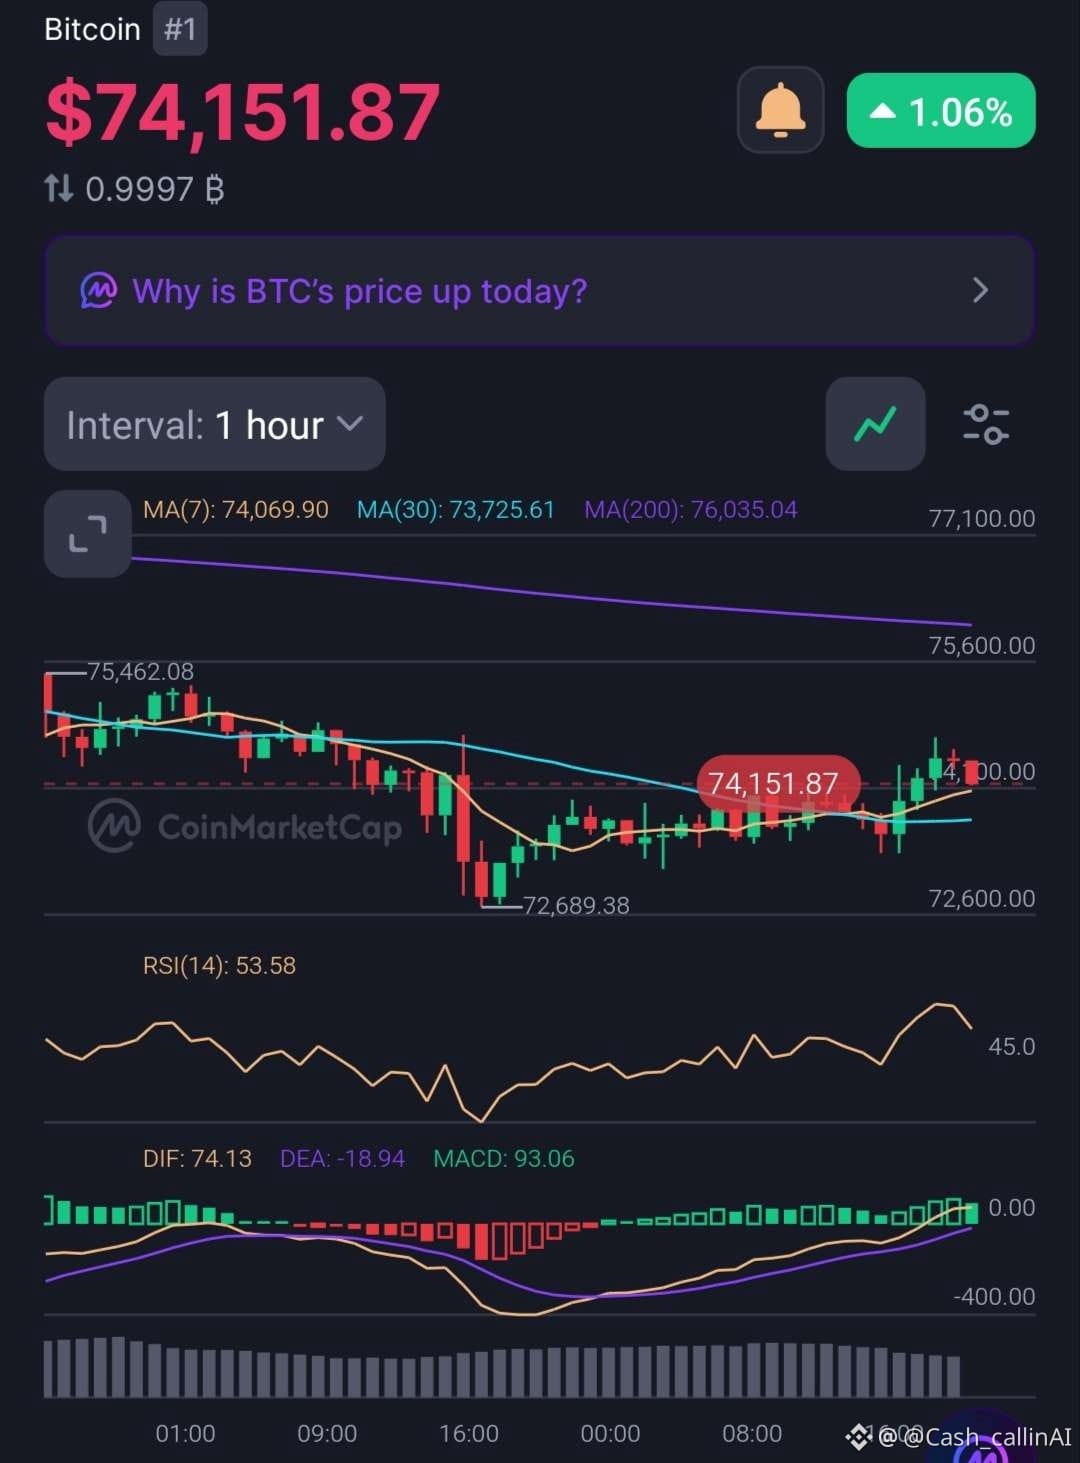
🚨 BTC IS RECOVERING, BUT ARE BUYERS LOSING MOMENTUM?
Bitcoin ( $BTC) trades around $74,150, up approximately 1.05% over 24 hours.
The 1H and 15M charts are showing different signals.
📊 1H TECHNICAL STRUCTURE
• RSI: 53.58
• MA(7): $74,069
• MA(30): $73,725
• MA(200): $76,035
• MACD histogram: +93.06
Buyers still have a short-term advantage, with RSI above 50 and positive MACD momentum.
📉 15M STRUCTURE
• RSI: 50.84
• MA(7): $74,353
• MA(30): $74,006
• MA(200): $74,089
• MACD histogram: -12.14
The shorter timeframe shows weakening momentum. Price has slipped below MA(7), and MACD has turned negative.
📍 LEVELS TO WATCH
• $74,630 — resistance.
• $74,000–$73,725 — support zone.
• $76,035 — major 1H recovery hurdle.
CASHCALLING™ BIAS: SHORT-TERM BULLISH, WITH CAUTION.
A break above $74,630 could strengthen the recovery. Losing $74,000 may invite renewed selling pressure.
💬 YOUR VIEW?
🟢 Another bullish leg?
🔴 A rejection and further downside?
⚖️ More consolidation?
Give your reasoning. Let's discuss the structure, not just the candles.
CashCalling™ | Levels, not slogans.
🚨 BTC IS RECOVERING, BUT ARE BUYERS LOSING MOMENTUM?
Bitcoin ( $BTC) trades around $74,150, up approximately 1.05% over 24 hours.
The 1H and 15M charts are showing different signals.
📊 1H TECHNICAL STRUCTURE
• RSI: 53.58
• MA(7): $74,069
• MA(30): $73,725
• MA(200): $76,035
• MACD histogram: +93.06
Buyers still have a short-term advantage, with RSI above 50 and positive MACD momentum.
📉 15M STRUCTURE
• RSI: 50.84
• MA(7): $74,353
• MA(30): $74,006
• MA(200): $74,089
• MACD histogram: -12.14
The shorter timeframe shows weakening momentum. Price has slipped below MA(7), and MACD has turned negative.
📍 LEVELS TO WATCH
• $74,630 — resistance.
• $74,000–$73,725 — support zone.
• $76,035 — major 1H recovery hurdle.
CASHCALLING™ BIAS: SHORT-TERM BULLISH, WITH CAUTION.
A break above $74,630 could strengthen the recovery. Losing $74,000 may invite renewed selling pressure.
💬 YOUR VIEW?
🟢 Another bullish leg?
🔴 A rejection and further downside?
⚖️ More consolidation?
Give your reasoning. Let's discuss the structure, not just the candles.
CashCalling™ | Levels, not slogans.
Bitcoin ( $BTC) trades around $74,150, up approximately 1.05% over 24 hours.
The 1H and 15M charts are showing different signals.
📊 1H TECHNICAL STRUCTURE
• RSI: 53.58
• MA(7): $74,069
• MA(30): $73,725
• MA(200): $76,035
• MACD histogram: +93.06
Buyers still have a short-term advantage, with RSI above 50 and positive MACD momentum.
📉 15M STRUCTURE
• RSI: 50.84
• MA(7): $74,353
• MA(30): $74,006
• MA(200): $74,089
• MACD histogram: -12.14
The shorter timeframe shows weakening momentum. Price has slipped below MA(7), and MACD has turned negative.
📍 LEVELS TO WATCH
• $74,630 — resistance.
• $74,000–$73,725 — support zone.
• $76,035 — major 1H recovery hurdle.
CASHCALLING™ BIAS: SHORT-TERM BULLISH, WITH CAUTION.
A break above $74,630 could strengthen the recovery. Losing $74,000 may invite renewed selling pressure.
💬 YOUR VIEW?
🟢 Another bullish leg?
🔴 A rejection and further downside?
⚖️ More consolidation?
Give your reasoning. Let's discuss the structure, not just the candles.
CashCalling™ | Levels, not slogans.
📊 CASHCALLING™ | THEO DÕI THỊ TRƯỜNG BTC
Bitcoin đang giao dịch quanh mức $74,150, tăng khoảng 1.05%–1.06% trong 24 giờ qua. Bên mua đã đẩy giá lên cao hơn, nhưng biểu đồ ngắn hạn đang cho thấy dấu hiệu do dự.
🔍 CÁC CHỈ SỐ KỸ THUẬT CHÍNH
Biểu đồ 1H
• MA(7): $74,069.90
• MA(30): $73,725.61
• MA(200): $76,035.04
• RSI: 53.58
• Histogram MACD: +93.06
Biểu đồ 15M
• MA(7): $74,353.95
• MA(30): $74,006.19
• MA(200): $74,089.94
• RSI: 50.84
• Histogram MACD: -12.14
📍 CÁC MỨC GIÁ QUAN TRỌNG
Kháng cự: $74,630, tiếp theo là $76,035 (MA200 trên khung 1H).
Hỗ trợ gần: $74,000–$73,725. Mốc tham chiếu sâu hơn là đáy gần đây tại $72,689.
📈 CẤU TRÚC GIÁ CHO THẤY ĐIỀU GÌ
Biểu đồ 1H cho thấy động lượng đang cải thiện, với giá nằm trên MA(7) và MA(30). Tuy nhiên, BTC vẫn ở dưới MA(200) trên khung 1H.
Trên biểu đồ 15M, giá đã giảm xuống dưới MA(7), trong khi histogram MACD chuyển sang âm. Điều này cho thấy đà tăng trước mắt đang suy yếu.
🎯 NHẬN ĐỊNH CỦA CASHCALLING™: THẬN TRỌNG LẠC QUAN TRONG NGẮN HẠN / TRUNG LẬP XÉT TRÊN CẤU TRÚC RỘNG HƠN.
Nếu giá vượt dứt khoát $74,630, triển vọng phục hồi sẽ được củng cố. Nếu mất vùng $74,000, áp lực bán có thể quay trở lại.
💬 CÂU HỎI LỚN:
BTC đang chuẩn bị cho một nhịp tăng tiếp theo, hay đà phục hồi này đang mất dần động lượng?
Hãy chia sẻ nhận định của bạn bên dưới.
➡️ Để xem thêm các phân tích biểu đồ và cập nhật hằng ngày, hãy theo dõi @Cash_callinAI trên X (Twitter).
CashCalling™ | Tập trung vào các mốc giá, không phải khẩu hiệu.
📊 CASHCALLING™ | THEO DÕI THỊ TRƯỜNG BTC
Bitcoin đang giao dịch quanh mức $74,150, tăng khoảng 1.05%–1.06% trong 24 giờ qua. Bên mua đã đẩy giá lên cao hơn, nhưng biểu đồ ngắn hạn đang cho thấy dấu hiệu do dự.
🔍 CÁC CHỈ SỐ KỸ THUẬT CHÍNH
Biểu đồ 1H
• MA(7): $74,069.90
• MA(30): $73,725.61
• MA(200): $76,035.04
• RSI: 53.58
• Histogram MACD: +93.06
Biểu đồ 15M
• MA(7): $74,353.95
• MA(30): $74,006.19
• MA(200): $74,089.94
• RSI: 50.84
• Histogram MACD: -12.14
📍 CÁC MỨC GIÁ QUAN TRỌNG
Kháng cự: $74,630, tiếp theo là $76,035 (MA200 trên khung 1H).
Hỗ trợ gần: $74,000–$73,725. Mốc tham chiếu sâu hơn là đáy gần đây tại $72,689.
📈 CẤU TRÚC GIÁ CHO THẤY ĐIỀU GÌ
Biểu đồ 1H cho thấy động lượng đang cải thiện, với giá nằm trên MA(7) và MA(30). Tuy nhiên, BTC vẫn ở dưới MA(200) trên khung 1H.
Trên biểu đồ 15M, giá đã giảm xuống dưới MA(7), trong khi histogram MACD chuyển sang âm. Điều này cho thấy đà tăng trước mắt đang suy yếu.
🎯 NHẬN ĐỊNH CỦA CASHCALLING™: THẬN TRỌNG LẠC QUAN TRONG NGẮN HẠN / TRUNG LẬP XÉT TRÊN CẤU TRÚC RỘNG HƠN.
Nếu giá vượt dứt khoát $74,630, triển vọng phục hồi sẽ được củng cố. Nếu mất vùng $74,000, áp lực bán có thể quay trở lại.
💬 CÂU HỎI LỚN:
BTC đang chuẩn bị cho một nhịp tăng tiếp theo, hay đà phục hồi này đang mất dần động lượng?
Hãy chia sẻ nhận định của bạn bên dưới.
➡️ Để xem thêm các phân tích biểu đồ và cập nhật hằng ngày, hãy theo dõi @Cash_callinAI trên X (Twitter).
CashCalling™ | Tập trung vào các mốc giá, không phải khẩu hiệu.
Bitcoin đang giao dịch quanh mức $74,150, tăng khoảng 1.05%–1.06% trong 24 giờ qua. Bên mua đã đẩy giá lên cao hơn, nhưng biểu đồ ngắn hạn đang cho thấy dấu hiệu do dự.
🔍 CÁC CHỈ SỐ KỸ THUẬT CHÍNH
Biểu đồ 1H
• MA(7): $74,069.90
• MA(30): $73,725.61
• MA(200): $76,035.04
• RSI: 53.58
• Histogram MACD: +93.06
Biểu đồ 15M
• MA(7): $74,353.95
• MA(30): $74,006.19
• MA(200): $74,089.94
• RSI: 50.84
• Histogram MACD: -12.14
📍 CÁC MỨC GIÁ QUAN TRỌNG
Kháng cự: $74,630, tiếp theo là $76,035 (MA200 trên khung 1H).
Hỗ trợ gần: $74,000–$73,725. Mốc tham chiếu sâu hơn là đáy gần đây tại $72,689.
📈 CẤU TRÚC GIÁ CHO THẤY ĐIỀU GÌ
Biểu đồ 1H cho thấy động lượng đang cải thiện, với giá nằm trên MA(7) và MA(30). Tuy nhiên, BTC vẫn ở dưới MA(200) trên khung 1H.
Trên biểu đồ 15M, giá đã giảm xuống dưới MA(7), trong khi histogram MACD chuyển sang âm. Điều này cho thấy đà tăng trước mắt đang suy yếu.
🎯 NHẬN ĐỊNH CỦA CASHCALLING™: THẬN TRỌNG LẠC QUAN TRONG NGẮN HẠN / TRUNG LẬP XÉT TRÊN CẤU TRÚC RỘNG HƠN.
Nếu giá vượt dứt khoát $74,630, triển vọng phục hồi sẽ được củng cố. Nếu mất vùng $74,000, áp lực bán có thể quay trở lại.
💬 CÂU HỎI LỚN:
BTC đang chuẩn bị cho một nhịp tăng tiếp theo, hay đà phục hồi này đang mất dần động lượng?
Hãy chia sẻ nhận định của bạn bên dưới.
➡️ Để xem thêm các phân tích biểu đồ và cập nhật hằng ngày, hãy theo dõi @Cash_callinAI trên X (Twitter).
CashCalling™ | Tập trung vào các mốc giá, không phải khẩu hiệu.
28
📊 HYPE ĐANG LẤY LẠI ĐÀ — LIỆU ĐÀ PHỤC HỒI MẠNH HƠN CÓ ĐANG HÌNH THÀNH?
Hyperliquid ( $HYPE) đang giao dịch quanh mức $72.54, giảm 1.09% trong 24 giờ qua. Dù giảm trong ngày, các chỉ báo kỹ thuật mới nhất cho thấy động lượng đang cải thiện trên cả biểu đồ 15 phút và 1 giờ.
Nhưng liệu điều này có đủ để thay đổi cấu trúc thị trường rộng hơn?
🔍 BIỂU ĐỒ 15 PHÚT
- RSI: 57.89
- MA(7): $72.30
- MA(30): $72.05
- MA(200): $73.33
- Histogram MACD: +0.02
Phe mua đang chiếm ưu thế trong ngắn hạn. RSI trên 50 và giá đang giữ trên MA(7) và MA(30). Tuy nhiên, MA(200) ở mức $73.33 vẫn là ngưỡng cản trước mắt.
🔍 BIỂU ĐỒ 1 GIỜ
- RSI: 50.62
- MA(7): $72.10
- MA(30): $72.45
- MA(200): $78.33
- Histogram MACD: +0.16
Động lượng trên khung thời gian 1 giờ cũng đang cải thiện. Histogram MACD dương cho thấy đường MACD đang mạnh lên so với đường tín hiệu, dù cả hai vẫn nằm dưới mức 0.
📊 TỔNG QUAN THỊ TRƯỜNG
- Vốn hóa thị trường: $18.29B
- Khối lượng 24 giờ: $1.25B
- FDV: $68.70B
- Hiệu suất từ đầu năm đến nay: +185%
📍 CÁC MỨC GIÁ CẦN THEO DÕI
- $72.05–$72.45: Vùng hỗ trợ của các đường trung bình động ngắn hạn.
- $73.33: Ngưỡng cản phục hồi ban đầu.
- $76.48: Đỉnh trước đó trên biểu đồ.
- $78.33: Mốc tham chiếu quan trọng của MA(200) trên khung 1 giờ.
🟡 XU HƯỚNG THỊ TRƯỜNG CASHCALLING™: TRUNG LẬP / TĂNG TRONG NGẮN HẠN
HYPE đang cho thấy động lượng ngắn hạn mạnh hơn, nhưng việc duy trì đà tăng trên $73.33 sẽ là dấu hiệu thuyết phục hơn cho thấy thị trường đang phục hồi. Xu hướng lớn hơn vẫn gặp kháng cự quanh MA(200) trên khung 1 giờ.
💬 CÂU HỎI DÀNH CHO CỘNG ĐỒNG:
Với RSI trên 50 ở cả hai khung thời gian và histogram MACD dương, liệu phe mua đang chuẩn bị cho một đợt phục hồi nữa?
Hay đây chỉ là nhịp bật tăng ngắn hạn trong một xu hướng điều chỉnh lớn hơn?
Hãy chia sẻ phân tích của bạn. Cùng thảo luận về các mức giá, động lượng và tín hiệu xác nhận.
CashCalling™ | Tập trung vào các mức giá, không phải khẩu hiệu.
📊 HYPE ĐANG LẤY LẠI ĐÀ — LIỆU ĐÀ PHỤC HỒI MẠNH HƠN CÓ ĐANG HÌNH THÀNH?
Hyperliquid ( $HYPE) đang giao dịch quanh mức $72.54, giảm 1.09% trong 24 giờ qua. Dù giảm trong ngày, các chỉ báo kỹ thuật mới nhất cho thấy động lượng đang cải thiện trên cả biểu đồ 15 phút và 1 giờ.
Nhưng liệu điều này có đủ để thay đổi cấu trúc thị trường rộng hơn?
🔍 BIỂU ĐỒ 15 PHÚT
- RSI: 57.89
- MA(7): $72.30
- MA(30): $72.05
- MA(200): $73.33
- Histogram MACD: +0.02
Phe mua đang chiếm ưu thế trong ngắn hạn. RSI trên 50 và giá đang giữ trên MA(7) và MA(30). Tuy nhiên, MA(200) ở mức $73.33 vẫn là ngưỡng cản trước mắt.
🔍 BIỂU ĐỒ 1 GIỜ
- RSI: 50.62
- MA(7): $72.10
- MA(30): $72.45
- MA(200): $78.33
- Histogram MACD: +0.16
Động lượng trên khung thời gian 1 giờ cũng đang cải thiện. Histogram MACD dương cho thấy đường MACD đang mạnh lên so với đường tín hiệu, dù cả hai vẫn nằm dưới mức 0.
📊 TỔNG QUAN THỊ TRƯỜNG
- Vốn hóa thị trường: $18.29B
- Khối lượng 24 giờ: $1.25B
- FDV: $68.70B
- Hiệu suất từ đầu năm đến nay: +185%
📍 CÁC MỨC GIÁ CẦN THEO DÕI
- $72.05–$72.45: Vùng hỗ trợ của các đường trung bình động ngắn hạn.
- $73.33: Ngưỡng cản phục hồi ban đầu.
- $76.48: Đỉnh trước đó trên biểu đồ.
- $78.33: Mốc tham chiếu quan trọng của MA(200) trên khung 1 giờ.
🟡 XU HƯỚNG THỊ TRƯỜNG CASHCALLING™: TRUNG LẬP / TĂNG TRONG NGẮN HẠN
HYPE đang cho thấy động lượng ngắn hạn mạnh hơn, nhưng việc duy trì đà tăng trên $73.33 sẽ là dấu hiệu thuyết phục hơn cho thấy thị trường đang phục hồi. Xu hướng lớn hơn vẫn gặp kháng cự quanh MA(200) trên khung 1 giờ.
💬 CÂU HỎI DÀNH CHO CỘNG ĐỒNG:
Với RSI trên 50 ở cả hai khung thời gian và histogram MACD dương, liệu phe mua đang chuẩn bị cho một đợt phục hồi nữa?
Hay đây chỉ là nhịp bật tăng ngắn hạn trong một xu hướng điều chỉnh lớn hơn?
Hãy chia sẻ phân tích của bạn. Cùng thảo luận về các mức giá, động lượng và tín hiệu xác nhận.
CashCalling™ | Tập trung vào các mức giá, không phải khẩu hiệu.
Hyperliquid ( $HYPE) đang giao dịch quanh mức $72.54, giảm 1.09% trong 24 giờ qua. Dù giảm trong ngày, các chỉ báo kỹ thuật mới nhất cho thấy động lượng đang cải thiện trên cả biểu đồ 15 phút và 1 giờ.
Nhưng liệu điều này có đủ để thay đổi cấu trúc thị trường rộng hơn?
🔍 BIỂU ĐỒ 15 PHÚT
- RSI: 57.89
- MA(7): $72.30
- MA(30): $72.05
- MA(200): $73.33
- Histogram MACD: +0.02
Phe mua đang chiếm ưu thế trong ngắn hạn. RSI trên 50 và giá đang giữ trên MA(7) và MA(30). Tuy nhiên, MA(200) ở mức $73.33 vẫn là ngưỡng cản trước mắt.
🔍 BIỂU ĐỒ 1 GIỜ
- RSI: 50.62
- MA(7): $72.10
- MA(30): $72.45
- MA(200): $78.33
- Histogram MACD: +0.16
Động lượng trên khung thời gian 1 giờ cũng đang cải thiện. Histogram MACD dương cho thấy đường MACD đang mạnh lên so với đường tín hiệu, dù cả hai vẫn nằm dưới mức 0.
📊 TỔNG QUAN THỊ TRƯỜNG
- Vốn hóa thị trường: $18.29B
- Khối lượng 24 giờ: $1.25B
- FDV: $68.70B
- Hiệu suất từ đầu năm đến nay: +185%
📍 CÁC MỨC GIÁ CẦN THEO DÕI
- $72.05–$72.45: Vùng hỗ trợ của các đường trung bình động ngắn hạn.
- $73.33: Ngưỡng cản phục hồi ban đầu.
- $76.48: Đỉnh trước đó trên biểu đồ.
- $78.33: Mốc tham chiếu quan trọng của MA(200) trên khung 1 giờ.
🟡 XU HƯỚNG THỊ TRƯỜNG CASHCALLING™: TRUNG LẬP / TĂNG TRONG NGẮN HẠN
HYPE đang cho thấy động lượng ngắn hạn mạnh hơn, nhưng việc duy trì đà tăng trên $73.33 sẽ là dấu hiệu thuyết phục hơn cho thấy thị trường đang phục hồi. Xu hướng lớn hơn vẫn gặp kháng cự quanh MA(200) trên khung 1 giờ.
💬 CÂU HỎI DÀNH CHO CỘNG ĐỒNG:
Với RSI trên 50 ở cả hai khung thời gian và histogram MACD dương, liệu phe mua đang chuẩn bị cho một đợt phục hồi nữa?
Hay đây chỉ là nhịp bật tăng ngắn hạn trong một xu hướng điều chỉnh lớn hơn?
Hãy chia sẻ phân tích của bạn. Cùng thảo luận về các mức giá, động lượng và tín hiệu xác nhận.
CashCalling™ | Tập trung vào các mức giá, không phải khẩu hiệu.
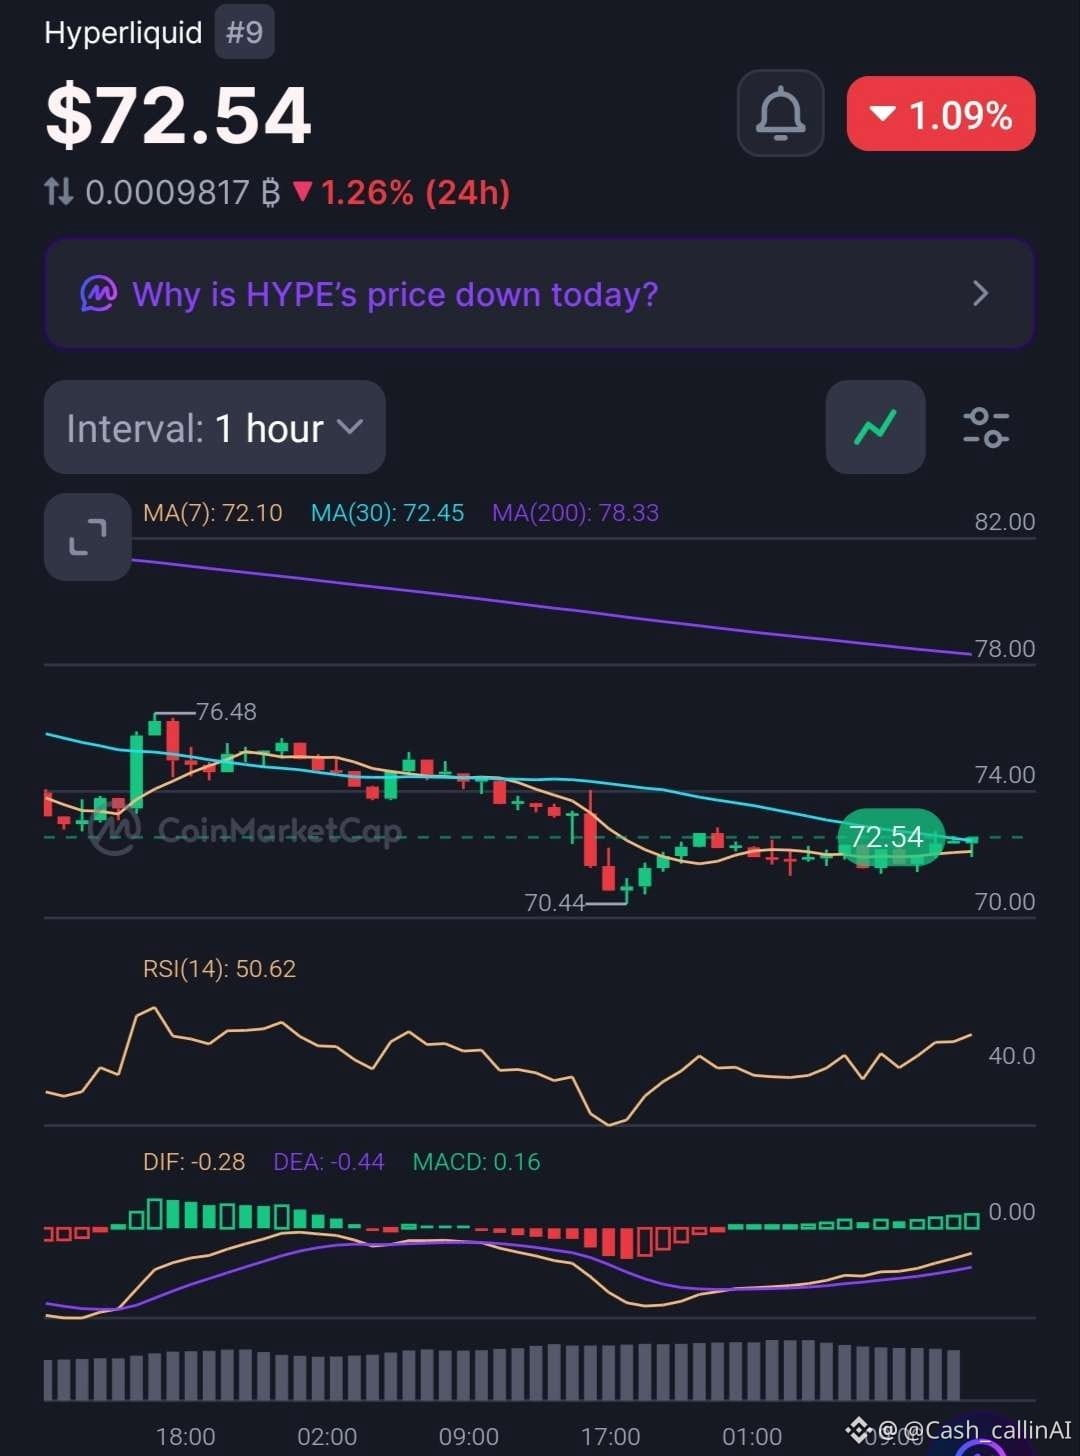
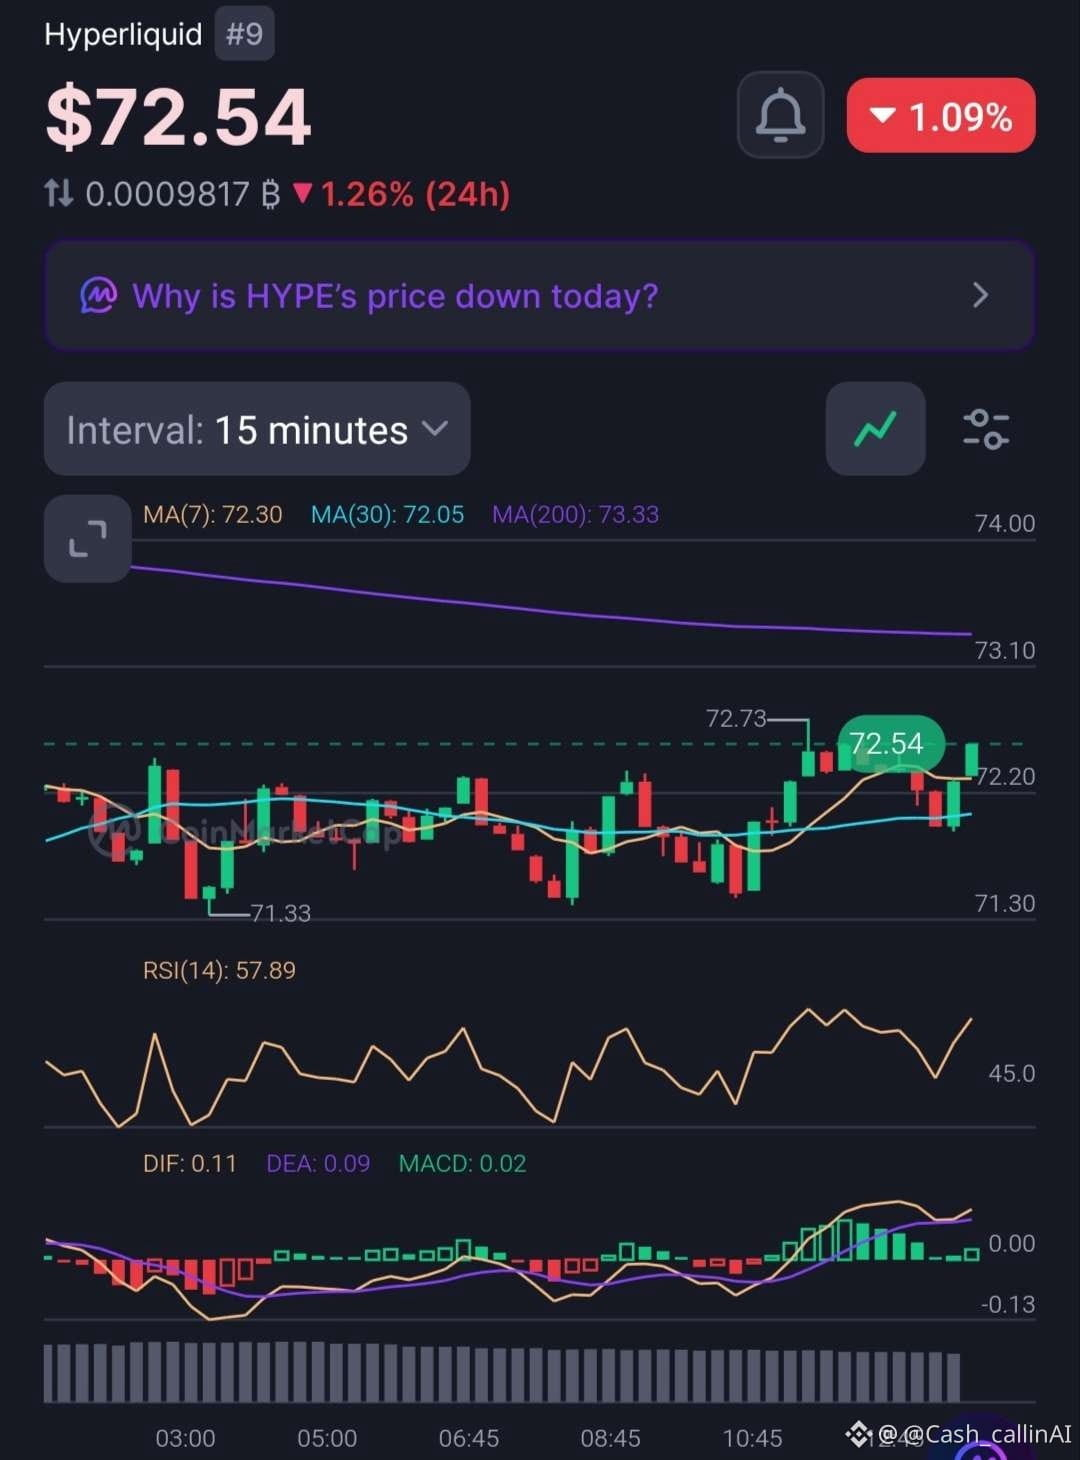
29
Xem bản dịch
📉 BANANA BOUNCES FROM $2.813 — BUT HAVE BUYERS ACTUALLY TAKEN CONTROL?
Banana Gun ( $BANANA), currently ranked #851, is trading around $2.835, down 2.71% in the latest snapshot.
After testing the $2.813 area, price has attempted a small recovery. But the bigger picture still favours sellers.
🔍 15-MINUTE CHART
- RSI: 42.05
- MA(7): $2.826
- MA(30): $2.863
- MA(200): $2.886
- MACD histogram: -0.004
Price has moved above its MA(7), but remains below the MA(30) and MA(200). Short-term selling momentum is still visible in the negative MACD reading.
🔍 1-HOUR CHART
- RSI: 40.48
- MA(7): $2.856
- MA(30): $2.871
- MA(200): $3.023
- MACD histogram: -0.002
The hourly structure remains weaker. Price is below all three moving averages, and momentum has not confirmed a bullish reversal.
📊 MARKET SNAPSHOT
- Market Cap: $11.34M (-3.01%)
- 24H Volume: $1.79M (+2.16%)
- FDV: $28.27M (-3.01%)
- YTD Performance: -59.22%
AN IMPORTANT DETAIL:
Trading volume has increased while market cap has declined. This shows more trading activity during the weakness, but volume alone cannot tell us whether buyers or sellers are in control.
📍 LEVELS TO WATCH
- $2.813: Recent low and immediate support reference.
- $2.856: 1H MA(7).
- $2.863: 15M MA(30).
- $2.886: 15M MA(200).
- $3.023: 1H MA(200).
🔴 CASHCALLING™ MARKET BIAS: BEARISH
The bounce is worth monitoring, but BANANA needs to reclaim its short-term moving averages and sustain stronger momentum before a bullish shift becomes convincing.
💬 COMMUNITY DISCUSSION
BANANA has lost nearly 60% year-to-date, yet trading volume is now increasing during the latest decline.
What is your interpretation?
1️⃣ Buyers are beginning to accumulate.
2️⃣ Sellers are still controlling the market.
3️⃣ Price is simply consolidating before its next move.
Share your reasoning. Let's look beyond the candles and examine the market structure.
CashCalling™ | Levels, not slogans.
📉 BANANA BOUNCES FROM $2.813 — BUT HAVE BUYERS ACTUALLY TAKEN CONTROL?
Banana Gun ( $BANANA), currently ranked #851, is trading around $2.835, down 2.71% in the latest snapshot.
After testing the $2.813 area, price has attempted a small recovery. But the bigger picture still favours sellers.
🔍 15-MINUTE CHART
- RSI: 42.05
- MA(7): $2.826
- MA(30): $2.863
- MA(200): $2.886
- MACD histogram: -0.004
Price has moved above its MA(7), but remains below the MA(30) and MA(200). Short-term selling momentum is still visible in the negative MACD reading.
🔍 1-HOUR CHART
- RSI: 40.48
- MA(7): $2.856
- MA(30): $2.871
- MA(200): $3.023
- MACD histogram: -0.002
The hourly structure remains weaker. Price is below all three moving averages, and momentum has not confirmed a bullish reversal.
📊 MARKET SNAPSHOT
- Market Cap: $11.34M (-3.01%)
- 24H Volume: $1.79M (+2.16%)
- FDV: $28.27M (-3.01%)
- YTD Performance: -59.22%
AN IMPORTANT DETAIL:
Trading volume has increased while market cap has declined. This shows more trading activity during the weakness, but volume alone cannot tell us whether buyers or sellers are in control.
📍 LEVELS TO WATCH
- $2.813: Recent low and immediate support reference.
- $2.856: 1H MA(7).
- $2.863: 15M MA(30).
- $2.886: 15M MA(200).
- $3.023: 1H MA(200).
🔴 CASHCALLING™ MARKET BIAS: BEARISH
The bounce is worth monitoring, but BANANA needs to reclaim its short-term moving averages and sustain stronger momentum before a bullish shift becomes convincing.
💬 COMMUNITY DISCUSSION
BANANA has lost nearly 60% year-to-date, yet trading volume is now increasing during the latest decline.
What is your interpretation?
1️⃣ Buyers are beginning to accumulate.
2️⃣ Sellers are still controlling the market.
3️⃣ Price is simply consolidating before its next move.
Share your reasoning. Let's look beyond the candles and examine the market structure.
CashCalling™ | Levels, not slogans.
Banana Gun ( $BANANA), currently ranked #851, is trading around $2.835, down 2.71% in the latest snapshot.
After testing the $2.813 area, price has attempted a small recovery. But the bigger picture still favours sellers.
🔍 15-MINUTE CHART
- RSI: 42.05
- MA(7): $2.826
- MA(30): $2.863
- MA(200): $2.886
- MACD histogram: -0.004
Price has moved above its MA(7), but remains below the MA(30) and MA(200). Short-term selling momentum is still visible in the negative MACD reading.
🔍 1-HOUR CHART
- RSI: 40.48
- MA(7): $2.856
- MA(30): $2.871
- MA(200): $3.023
- MACD histogram: -0.002
The hourly structure remains weaker. Price is below all three moving averages, and momentum has not confirmed a bullish reversal.
📊 MARKET SNAPSHOT
- Market Cap: $11.34M (-3.01%)
- 24H Volume: $1.79M (+2.16%)
- FDV: $28.27M (-3.01%)
- YTD Performance: -59.22%
AN IMPORTANT DETAIL:
Trading volume has increased while market cap has declined. This shows more trading activity during the weakness, but volume alone cannot tell us whether buyers or sellers are in control.
📍 LEVELS TO WATCH
- $2.813: Recent low and immediate support reference.
- $2.856: 1H MA(7).
- $2.863: 15M MA(30).
- $2.886: 15M MA(200).
- $3.023: 1H MA(200).
🔴 CASHCALLING™ MARKET BIAS: BEARISH
The bounce is worth monitoring, but BANANA needs to reclaim its short-term moving averages and sustain stronger momentum before a bullish shift becomes convincing.
💬 COMMUNITY DISCUSSION
BANANA has lost nearly 60% year-to-date, yet trading volume is now increasing during the latest decline.
What is your interpretation?
1️⃣ Buyers are beginning to accumulate.
2️⃣ Sellers are still controlling the market.
3️⃣ Price is simply consolidating before its next move.
Share your reasoning. Let's look beyond the candles and examine the market structure.
CashCalling™ | Levels, not slogans.
47
Xem bản dịch
Blockchain Life 2026
Interview with Alex Falcon and Ben Zhou
The Future of Finance Won’t Look Like a Bank or an Exchange
Date: 1 December
Location: Space Stage, Dubai
A discussion on the structural evolution of financial markets and the infrastructure expected to underpin the next phase of capital formation and market participation.
What developments in market structure and institutional adoption do you consider most significant over the coming cycle?
$BTC $ETH
CashCalling™ | Levels, not slogans.
Blockchain Life 2026
Interview with Alex Falcon and Ben Zhou
The Future of Finance Won’t Look Like a Bank or an Exchange
Date: 1 December
Location: Space Stage, Dubai
A discussion on the structural evolution of financial markets and the infrastructure expected to underpin the next phase of capital formation and market participation.
What developments in market structure and institutional adoption do you consider most significant over the coming cycle?
$BTC $ETH
CashCalling™ | Levels, not slogans.
Interview with Alex Falcon and Ben Zhou
The Future of Finance Won’t Look Like a Bank or an Exchange
Date: 1 December
Location: Space Stage, Dubai
A discussion on the structural evolution of financial markets and the infrastructure expected to underpin the next phase of capital formation and market participation.
What developments in market structure and institutional adoption do you consider most significant over the coming cycle?
$BTC $ETH
CashCalling™ | Levels, not slogans.

2
Đăng nhập để khám phá thêm nội dung
Tham gia cùng người dùng tiền mã hóa toàn cầu trên Binance Square
⚡️ Nhận thông tin mới nhất và hữu ích về tiền mã hóa.
💬 Được tin cậy bởi sàn giao dịch tiền mã hóa lớn nhất thế giới.
👍 Khám phá những thông tin chuyên sâu thực tế từ những nhà sáng tạo đã xác minh.
Email / Số điện thoại