

ProTrader365
164 Bài đăng

ProTrader365
Báo cáo
Chặn người dùng
"Over 8 years in crypto have taught us one thing: winning isn’t luck; it’s strategy. We're here to help you master yours." ProTrader | Investor | Content Creator | Analyzer
0 Đang theo dõi
1 Người theo dõi
6 Đã thích
Bài đăng
·
--
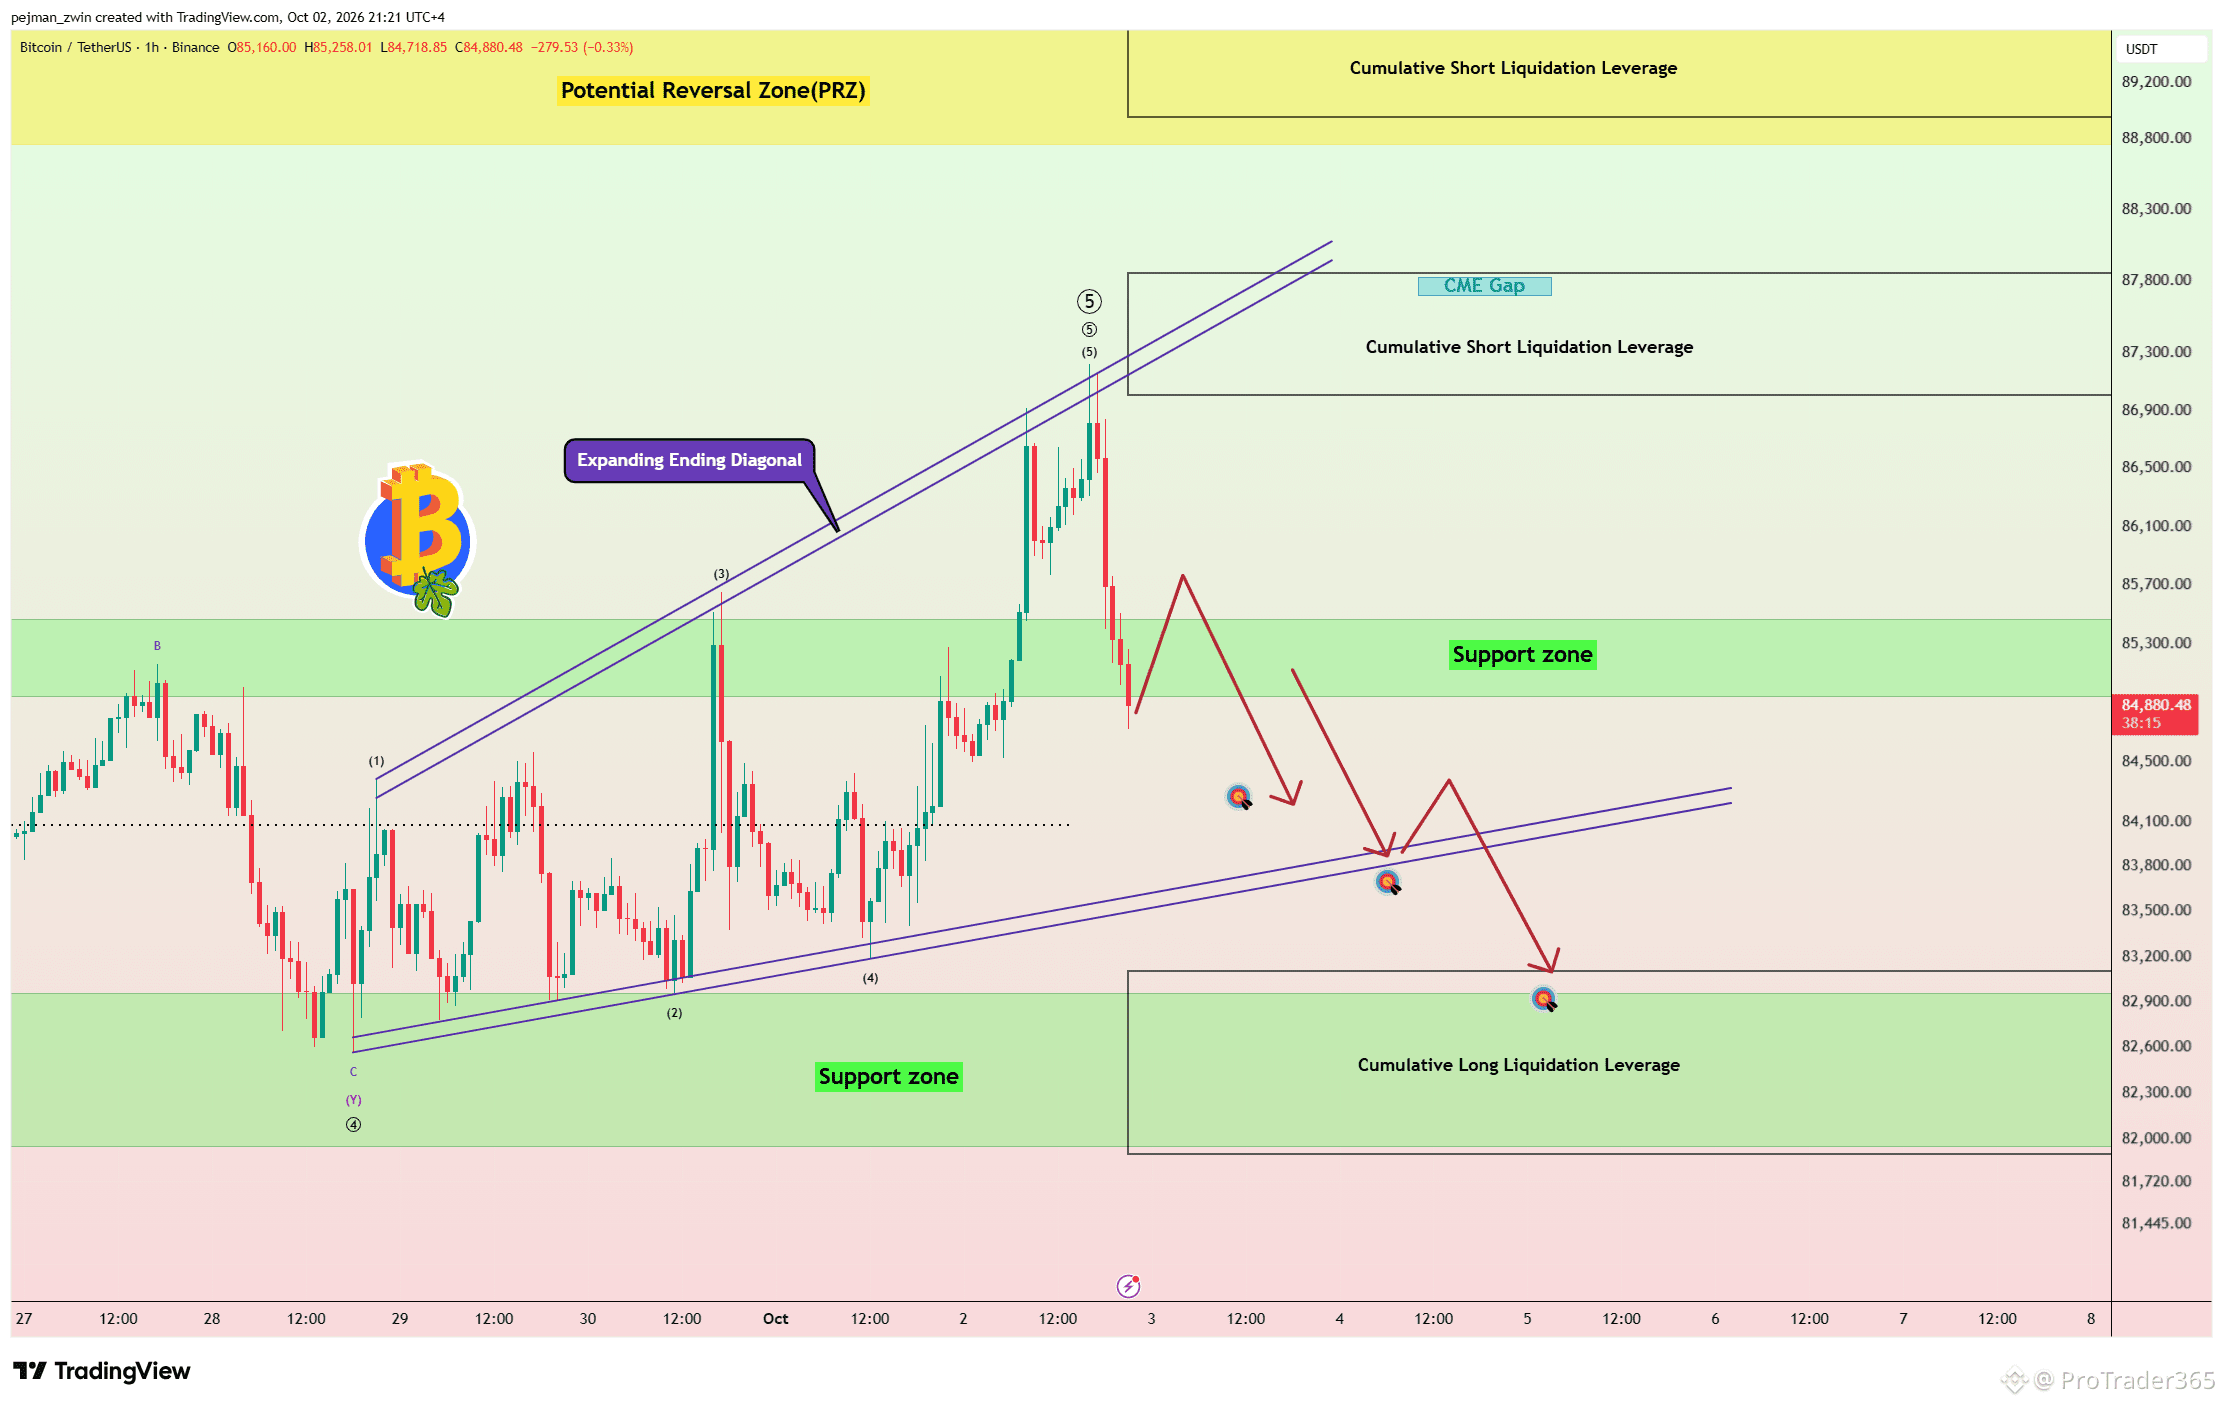
$BTC Kiểm Tra Hỗ Trợ Lớn — Liệu Sẽ Có Một Đợt Điều Chỉnh Sâu Hướng Tới $83,000 Bắt Đầu? Bitcoin đã bắt đầu giảm với động lượng giảm mạnh và hiện đang cố gắng phá vỡ Vùng Hỗ Trợ ($84,940-$85,460), trong khi USDT Dominance% cũng đang ủng hộ kịch bản giảm giá. Xét theo quan điểm Elliott Wave, Bitcoin dường như đã hoàn tất Sóng Ngũ (Primary Wave 5) thông qua một Đường chéo kết thúc mở rộng (Expanding Ending Diagonal). Xét theo phân tích kỹ thuật cổ điển, cấu trúc cũng tương tự như Mô Hình Nêm Nở Rộng Tăng (Ascending Broadening Wedge Pattern). Tôi kỳ vọng Bitcoin sẽ phá vỡ Vùng Hỗ Trợ và giảm về $84,240, sau đó là $83,840 và có thể là $83,120 nếu động lượng giảm tiếp diễn. Đòn bẩy Thanh Lý Long Tích Lũy (Cumulative Long Liquidation Leverage) ($81,900-$83,100) có thể trở thành mục tiêu giảm quan trọng. Cắt lỗ (SL): $87,000 (Tệ nhất) Bitcoin có bảo vệ được Vùng Hỗ Trợ hay đợt điều chỉnh sẽ kéo dài về $83,000?
$BTC Kiểm Tra Hỗ Trợ Lớn — Liệu Sẽ Có Một Đợt Điều Chỉnh Sâu Hướng Tới $83,000 Bắt Đầu? Bitcoin đã bắt đầu giảm với động lượng giảm mạnh và hiện đang cố gắng phá vỡ Vùng Hỗ Trợ ($84,940-$85,460), trong khi USDT Dominance% cũng đang ủng hộ kịch bản giảm giá. Xét theo quan điểm Elliott Wave, Bitcoin dường như đã hoàn tất Sóng Ngũ (Primary Wave 5) thông qua một Đường chéo kết thúc mở rộng (Expanding Ending Diagonal). Xét theo phân tích kỹ thuật cổ điển, cấu trúc cũng tương tự như Mô Hình Nêm Nở Rộng Tăng (Ascending Broadening Wedge Pattern). Tôi kỳ vọng Bitcoin sẽ phá vỡ Vùng Hỗ Trợ và giảm về $84,240, sau đó là $83,840 và có thể là $83,120 nếu động lượng giảm tiếp diễn. Đòn bẩy Thanh Lý Long Tích Lũy (Cumulative Long Liquidation Leverage) ($81,900-$83,100) có thể trở thành mục tiêu giảm quan trọng. Cắt lỗ (SL): $87,000 (Tệ nhất) Bitcoin có bảo vệ được Vùng Hỗ Trợ hay đợt điều chỉnh sẽ kéo dài về $83,000?
46
·
--
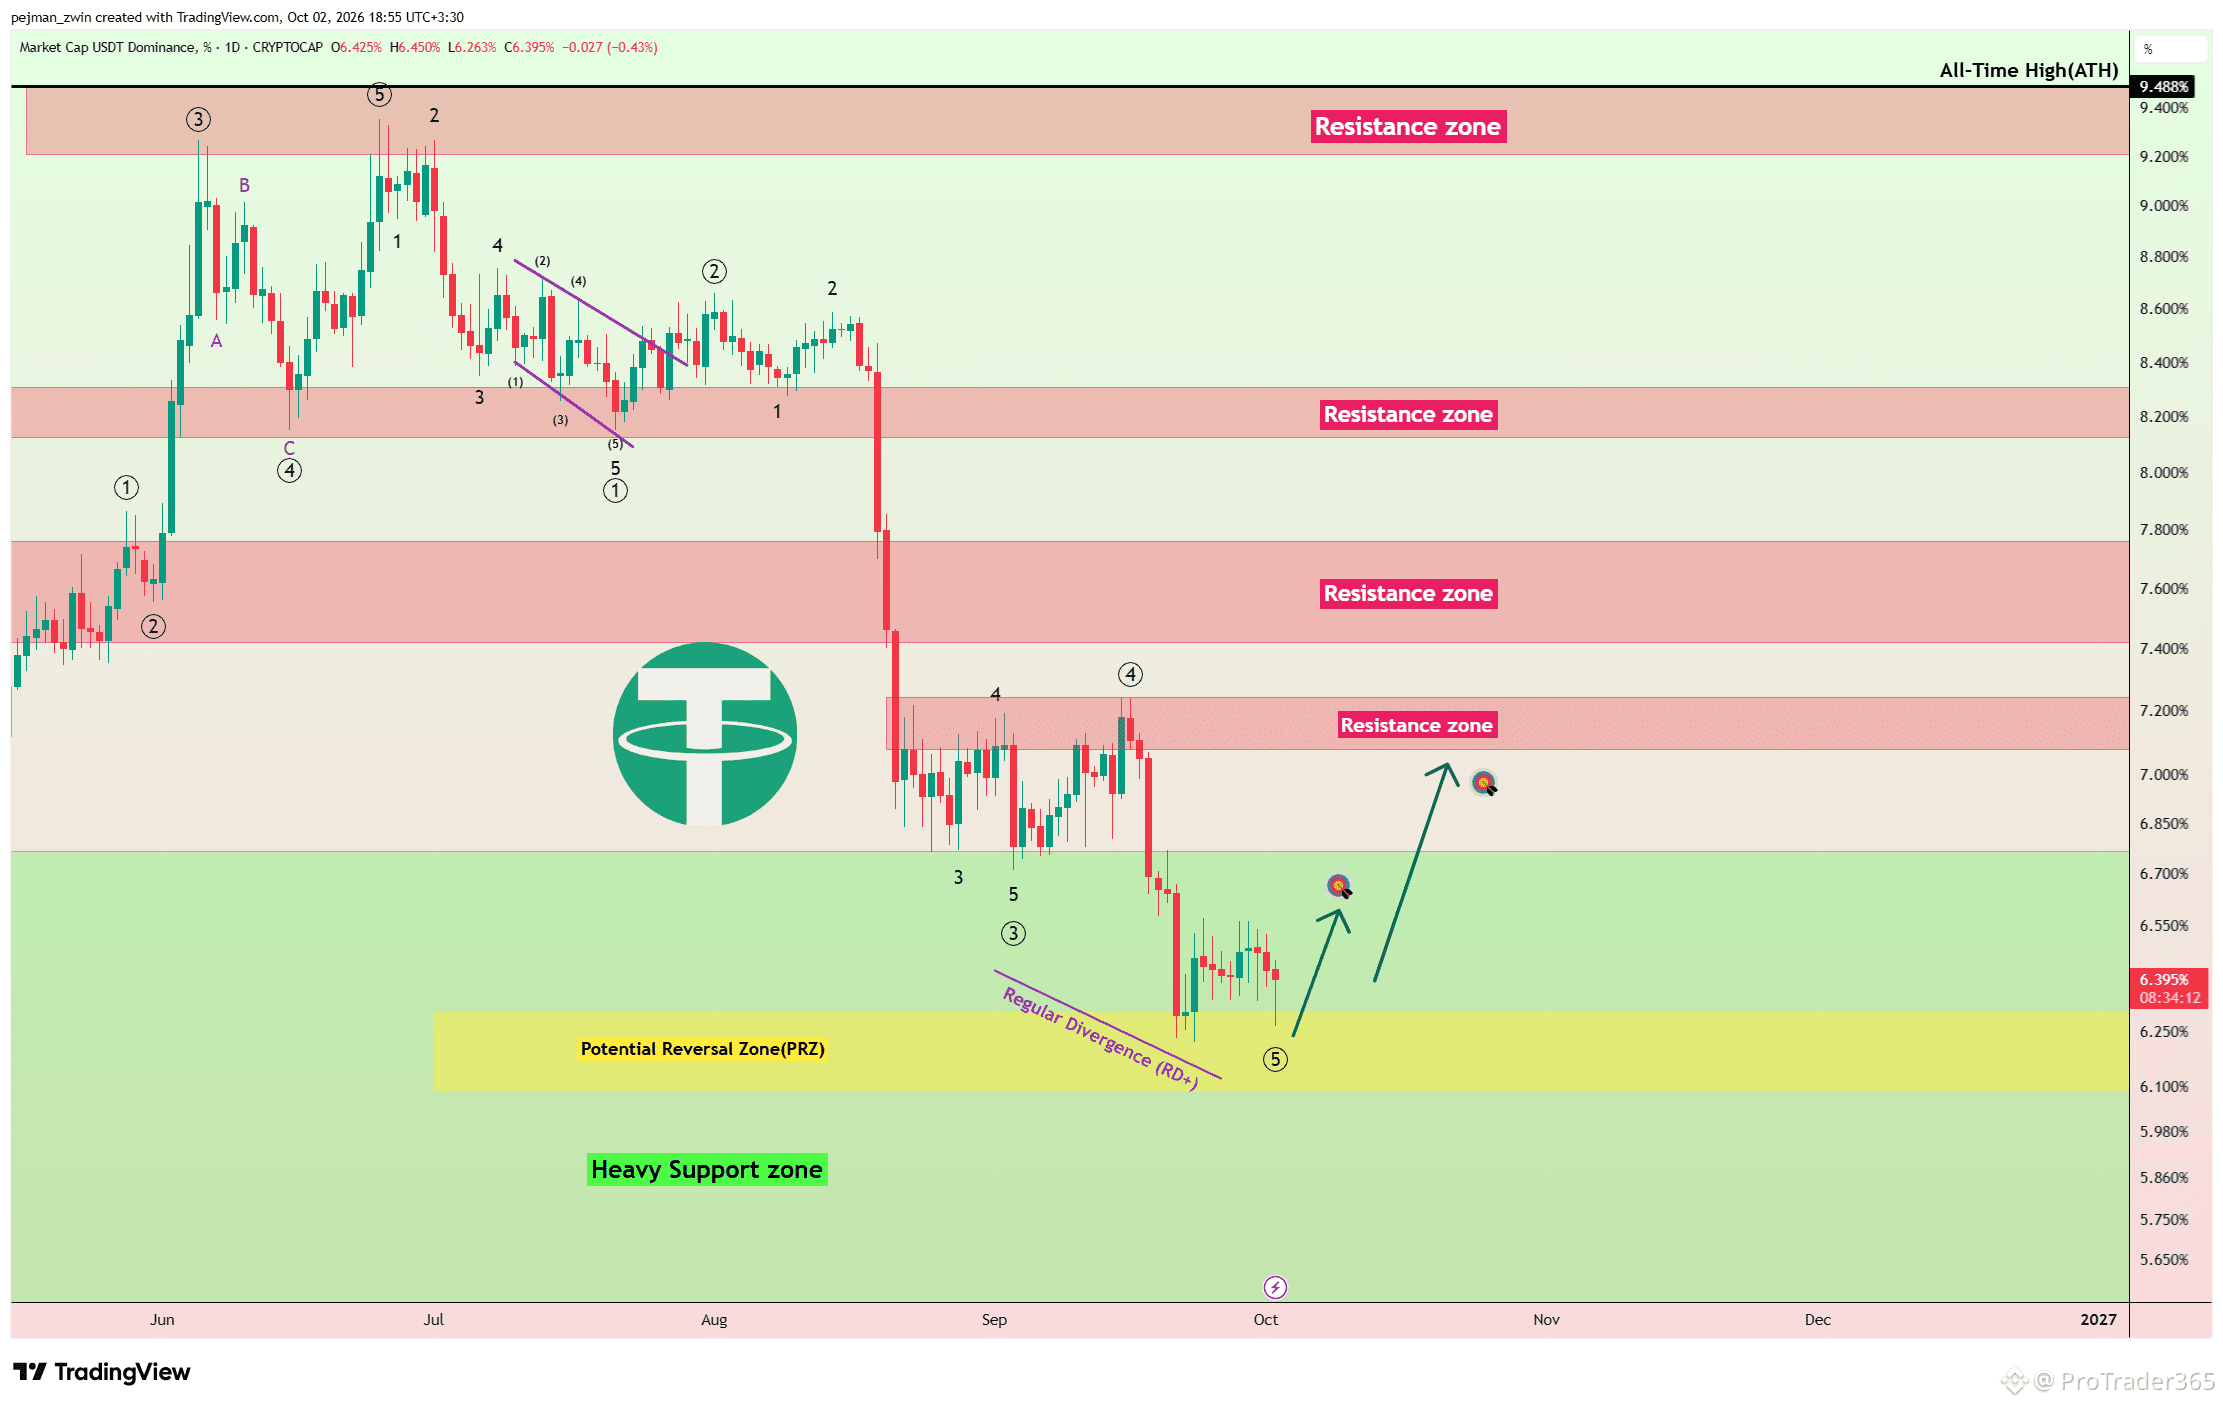
$USDT Thiết lập đảo chiều thống trị — Liệu Crypto có đối mặt lại áp lực mới? Hiện tại, USDT.D% đang giao dịch trong một Vùng Hỗ trợ lớn và đã phản ứng rất tốt với Vùng Đảo Chiều Tiềm Năng (PRZ). Dưới góc nhìn Elliott Wave, Sóng 5 chính dường như đang tiến gần đến việc hoàn tất trong PRZ, làm tăng xác suất cho một đợt đảo chiều ngắn hạn. Một Phân kỳ Tăng Giá Chuẩn Rõ (RD+) cũng đang hiện hữu giữa hai đáy liên tiếp, củng cố thêm cho kịch bản tăng. Tôi kỳ vọng USDT.D% sẽ bắt đầu một nhịp tăng khác, ít nhất là trong ngắn hạn. Nếu kịch bản này diễn ra, nó có thể tạo ra áp lực bán gia tăng trên toàn thị trường tiền mã hóa, đặc biệt là đối với $BTC và $ETH , khi dòng vốn chuyển sang stablecoin. Bạn nghĩ USDT.D% có thể tiếp tục đi lên từ khu vực này, hay Vùng Hỗ trợ hiện tại rồi sẽ thất bại? #Tether
$USDT Thiết lập đảo chiều thống trị — Liệu Crypto có đối mặt lại áp lực mới? Hiện tại, USDT.D% đang giao dịch trong một Vùng Hỗ trợ lớn và đã phản ứng rất tốt với Vùng Đảo Chiều Tiềm Năng (PRZ). Dưới góc nhìn Elliott Wave, Sóng 5 chính dường như đang tiến gần đến việc hoàn tất trong PRZ, làm tăng xác suất cho một đợt đảo chiều ngắn hạn. Một Phân kỳ Tăng Giá Chuẩn Rõ (RD+) cũng đang hiện hữu giữa hai đáy liên tiếp, củng cố thêm cho kịch bản tăng. Tôi kỳ vọng USDT.D% sẽ bắt đầu một nhịp tăng khác, ít nhất là trong ngắn hạn. Nếu kịch bản này diễn ra, nó có thể tạo ra áp lực bán gia tăng trên toàn thị trường tiền mã hóa, đặc biệt là đối với $BTC và $ETH , khi dòng vốn chuyển sang stablecoin. Bạn nghĩ USDT.D% có thể tiếp tục đi lên từ khu vực này, hay Vùng Hỗ trợ hiện tại rồi sẽ thất bại? #Tether
69
·
--
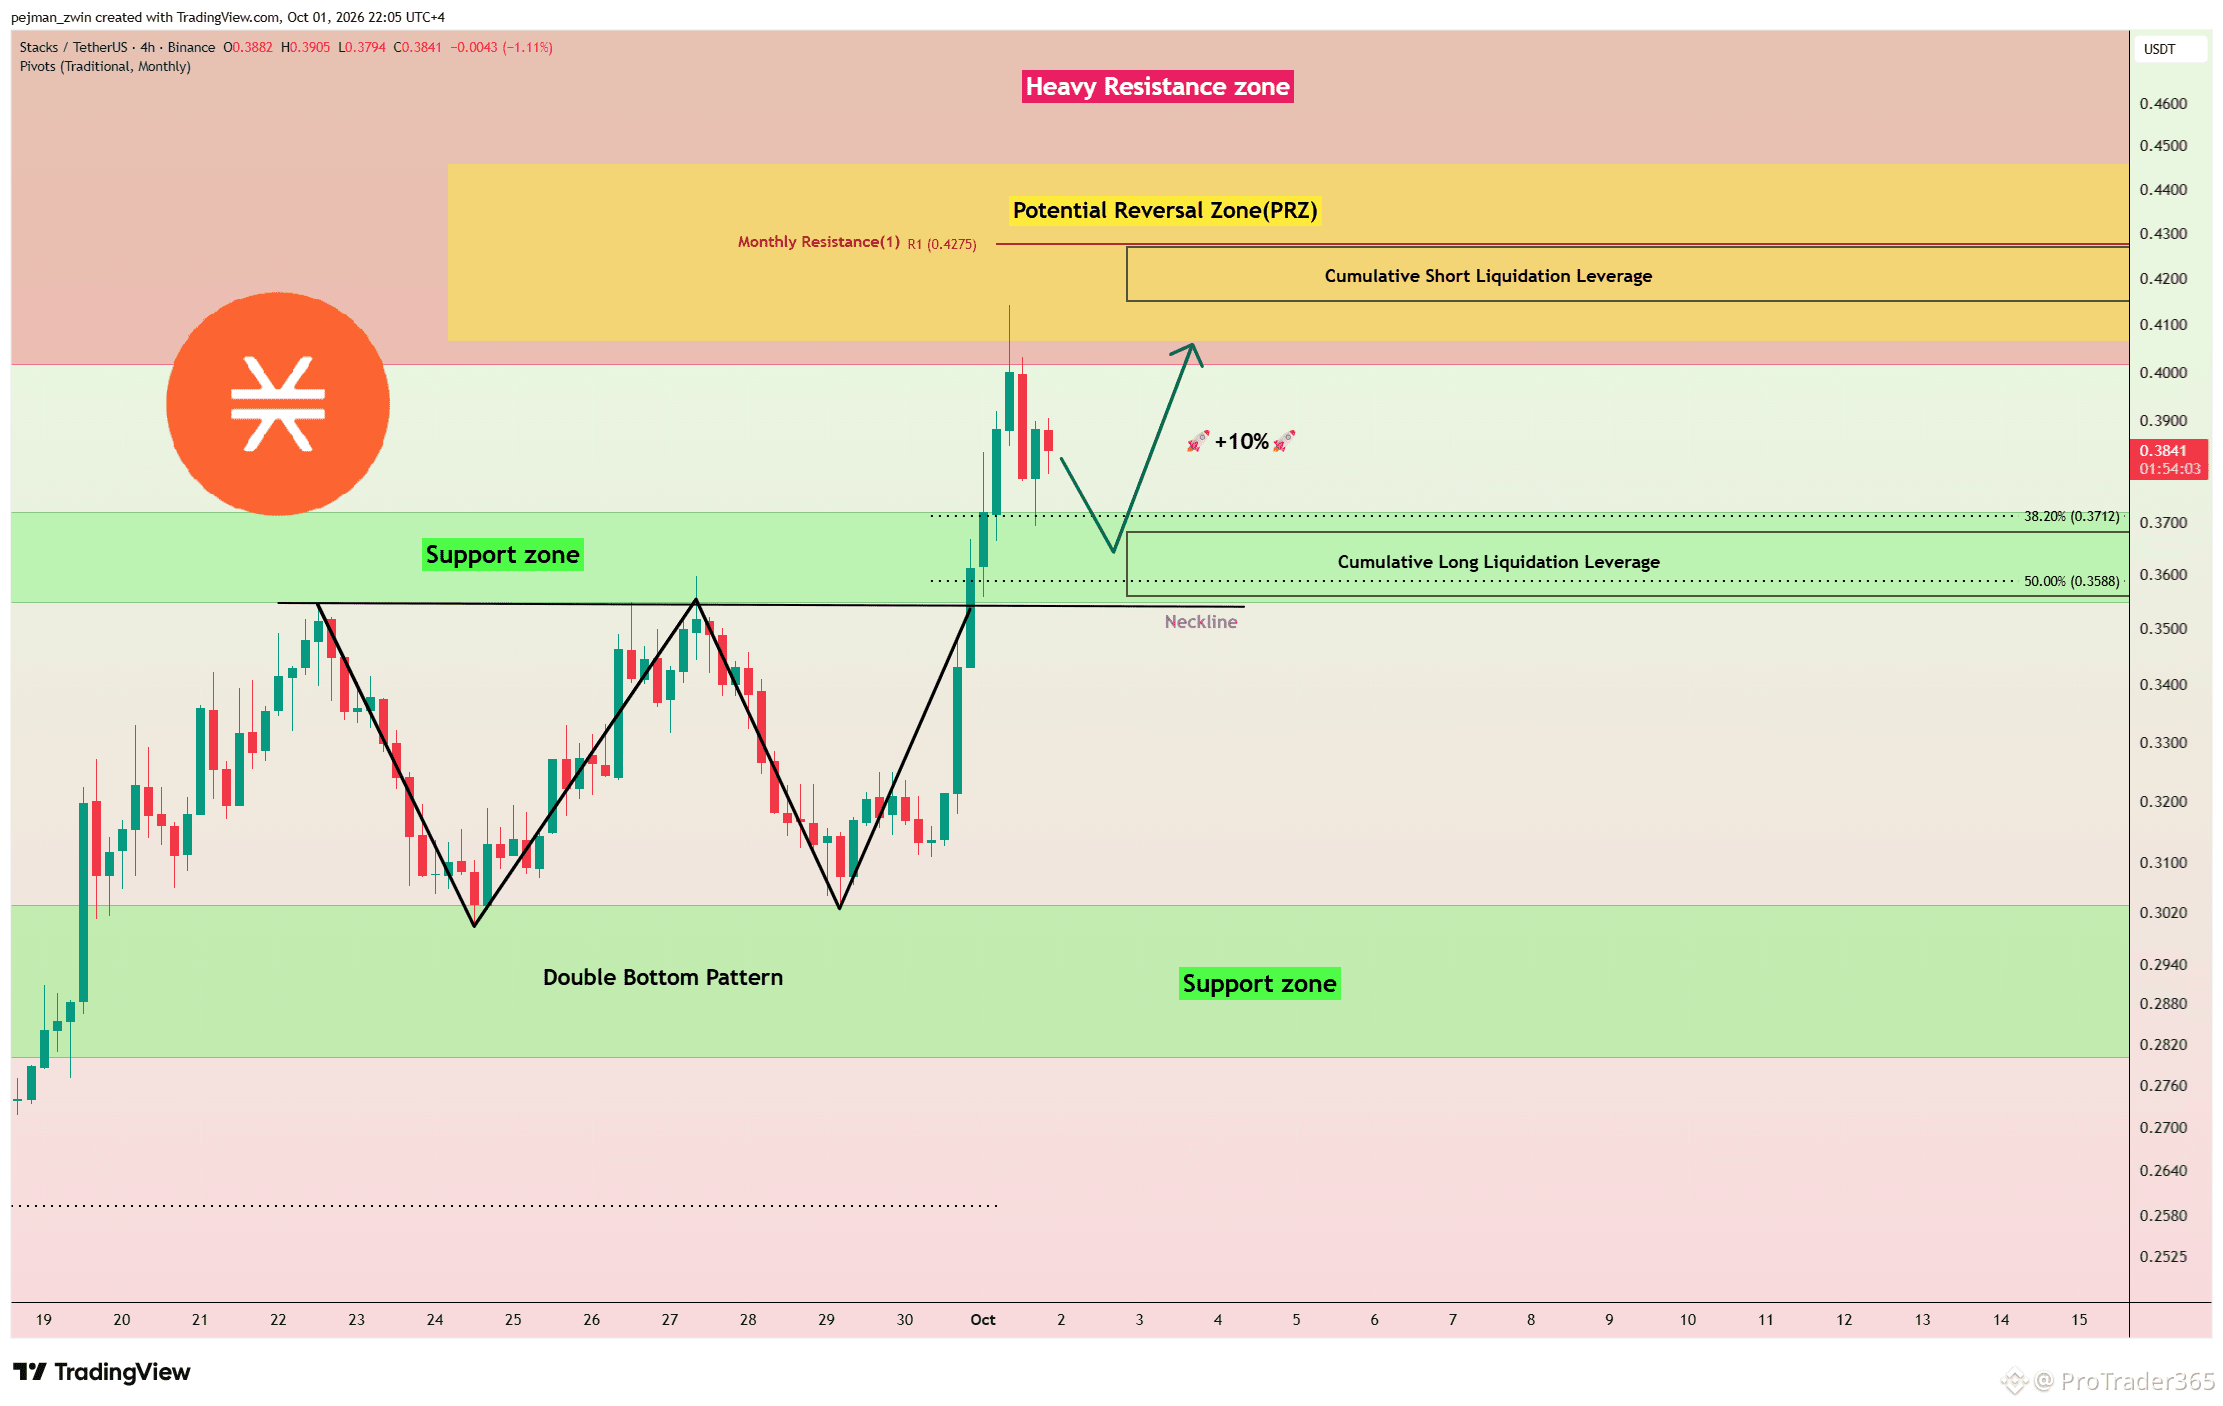
$STX Điều chỉnh sau đợt tăng 30% — Cấu trúc tăng giá có giữ được không? Stacks đã tăng hơn 30% trong 2–3 ngày qua, nhưng đợt tăng đã gặp áp lực bán mạnh bên trong Khu Vực Kháng Cự Mạnh($0.596-$0.410) và Khu Vực Có Khả Năng Đảo Chiều (Potential Reversal Zone - PRZ)[$0.446-$0.410]. Phân tích kỹ thuật Theo góc nhìn phân tích kỹ thuật cổ điển, STX có vẻ đã hình thành Mẫu Hai Đáy (Double Bottom) gần Khu Vực Hỗ Trợ. Sau khi vượt lên trên Đường Viền Cổ (Neckline), giá hiện đang điều chỉnh ngược lại về khu vực bứt phá. Tôi kỳ vọng sẽ có thêm một nhịp tăng nếu người mua bảo vệ được Khu Vực Hỗ Trợ($0.372-$0.355) và Đòn Bẩy Thanh Lý Long Tích Lũy (Cumulative Long Liquidation Leverage)($0.368-$0.356). Phản ứng thành công có thể hỗ trợ ít nhất thêm 10% tăng nữa và một lần thử mới hướng lên các mức kháng cự phía trên. Một Đòn Bẩy Thanh Lý Long Tích Lũy khác nằm tại $0.4270-$0.415. Liệu STX có bảo vệ được vùng hỗ trợ và vượt lên trên $0.45, hay một đợt điều chỉnh khác sẽ đến trước? #Macro Insights#
$STX Điều chỉnh sau đợt tăng 30% — Cấu trúc tăng giá có giữ được không? Stacks đã tăng hơn 30% trong 2–3 ngày qua, nhưng đợt tăng đã gặp áp lực bán mạnh bên trong Khu Vực Kháng Cự Mạnh($0.596-$0.410) và Khu Vực Có Khả Năng Đảo Chiều (Potential Reversal Zone - PRZ)[$0.446-$0.410]. Phân tích kỹ thuật Theo góc nhìn phân tích kỹ thuật cổ điển, STX có vẻ đã hình thành Mẫu Hai Đáy (Double Bottom) gần Khu Vực Hỗ Trợ. Sau khi vượt lên trên Đường Viền Cổ (Neckline), giá hiện đang điều chỉnh ngược lại về khu vực bứt phá. Tôi kỳ vọng sẽ có thêm một nhịp tăng nếu người mua bảo vệ được Khu Vực Hỗ Trợ($0.372-$0.355) và Đòn Bẩy Thanh Lý Long Tích Lũy (Cumulative Long Liquidation Leverage)($0.368-$0.356). Phản ứng thành công có thể hỗ trợ ít nhất thêm 10% tăng nữa và một lần thử mới hướng lên các mức kháng cự phía trên. Một Đòn Bẩy Thanh Lý Long Tích Lũy khác nằm tại $0.4270-$0.415. Liệu STX có bảo vệ được vùng hỗ trợ và vượt lên trên $0.45, hay một đợt điều chỉnh khác sẽ đến trước? #Macro Insights#
39
·
--
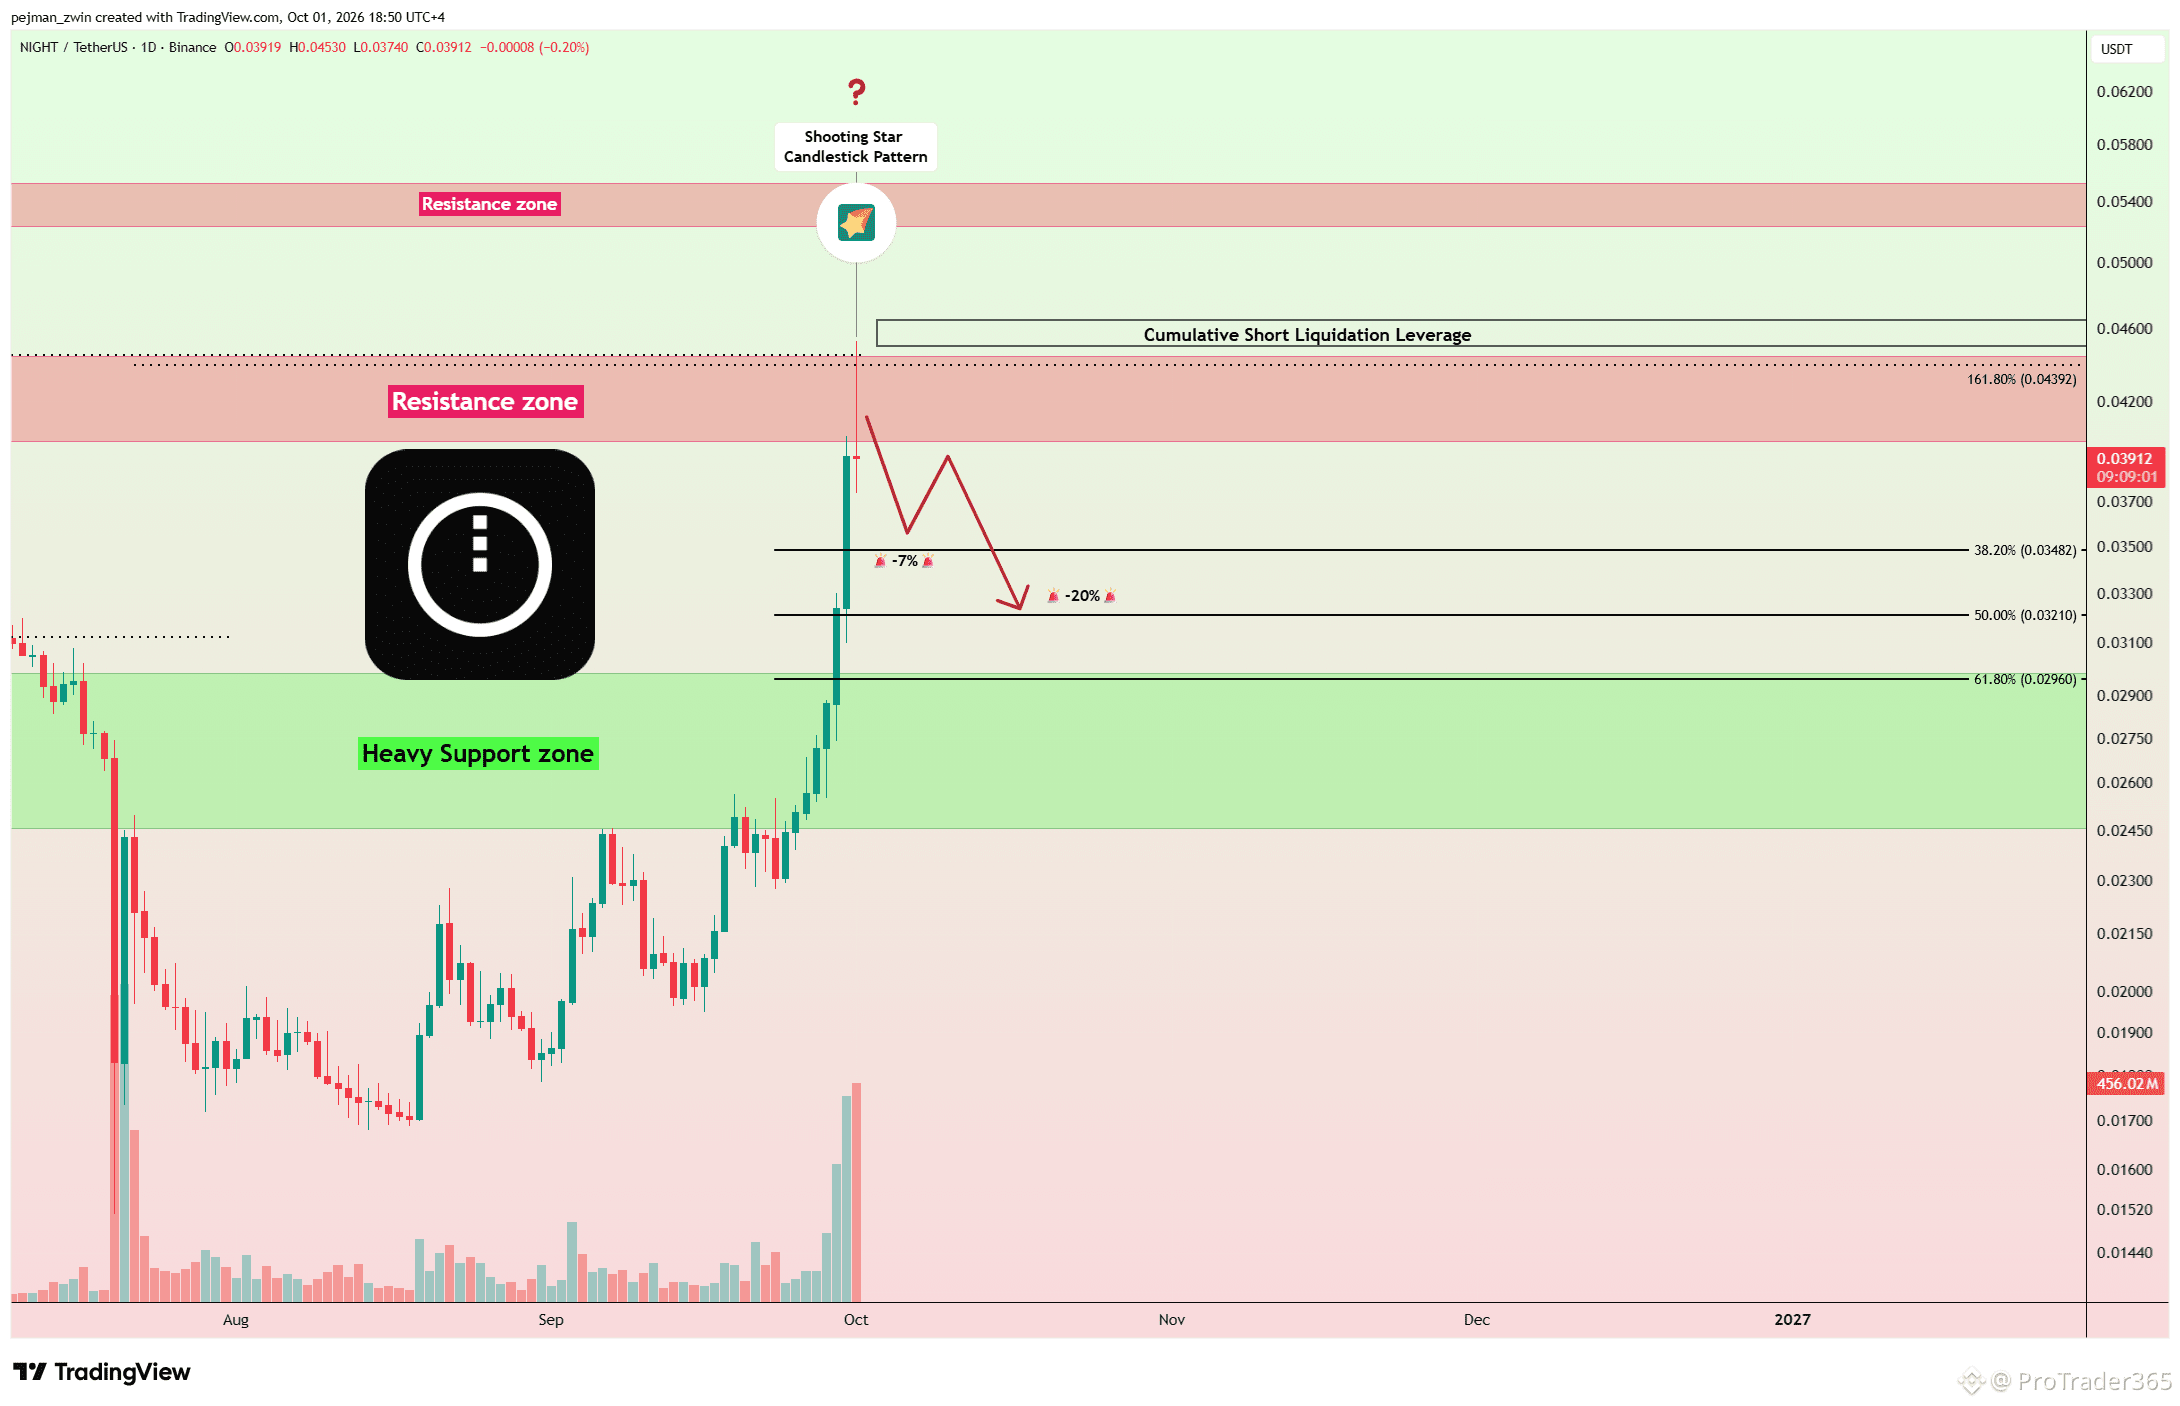
$NIGHT Đối mặt với khả năng đảo chiều sau đợt tăng 70% Nửa đêm đã tăng hơn 70% trong bảy ngày qua, được hỗ trợ bởi nhu cầu từ khu vực tư nhân, sự quan tâm từ các tổ chức, sự hỗ trợ hạ tầng Google Cloud, Monument Bank thử nghiệm các khoản tiền gửi được mã hóa, khối lượng giao ngay tăng lên và việc thanh lý lệnh short. Phân Tích Kỹ Thuật Trên khung thời gian hằng ngày, NIGHT đã không thể vượt lên trên Vùng Kháng Cự và mức giao dịch quan trọng $0.0445, và giá bắt đầu có xu hướng đi xuống. Nến hằng ngày hiện tại có thể tiềm năng đóng cửa dưới dạng mô hình Nến Sao Băng, trong khi khối lượng giao dịch tương đối cao có thể củng cố tín hiệu đảo chiều này. Tôi kỳ vọng bên bán có thể tiếp tục nắm quyền kiểm soát trong ngắn hạn. NIGHT có thể ban đầu giảm khoảng 7%, trong khi áp lực giảm giá mạnh hơn có thể kéo đợt điều chỉnh lan tới khoảng 20%. Đòn bẩy Thanh Lý Lệnh Short Lũy Kế: $0.0450-$0.0465 Các Mức Giao Dịch Quan Trọng: $0.0445 _ $0.0312 Liệu NIGHT có thể lấy lại $0.0445 hay những người bán sẽ đẩy đợt điều chỉnh sâu hơn trước? #Altcoin Season#
$NIGHT Đối mặt với khả năng đảo chiều sau đợt tăng 70% Nửa đêm đã tăng hơn 70% trong bảy ngày qua, được hỗ trợ bởi nhu cầu từ khu vực tư nhân, sự quan tâm từ các tổ chức, sự hỗ trợ hạ tầng Google Cloud, Monument Bank thử nghiệm các khoản tiền gửi được mã hóa, khối lượng giao ngay tăng lên và việc thanh lý lệnh short. Phân Tích Kỹ Thuật Trên khung thời gian hằng ngày, NIGHT đã không thể vượt lên trên Vùng Kháng Cự và mức giao dịch quan trọng $0.0445, và giá bắt đầu có xu hướng đi xuống. Nến hằng ngày hiện tại có thể tiềm năng đóng cửa dưới dạng mô hình Nến Sao Băng, trong khi khối lượng giao dịch tương đối cao có thể củng cố tín hiệu đảo chiều này. Tôi kỳ vọng bên bán có thể tiếp tục nắm quyền kiểm soát trong ngắn hạn. NIGHT có thể ban đầu giảm khoảng 7%, trong khi áp lực giảm giá mạnh hơn có thể kéo đợt điều chỉnh lan tới khoảng 20%. Đòn bẩy Thanh Lý Lệnh Short Lũy Kế: $0.0450-$0.0465 Các Mức Giao Dịch Quan Trọng: $0.0445 _ $0.0312 Liệu NIGHT có thể lấy lại $0.0445 hay những người bán sẽ đẩy đợt điều chỉnh sâu hơn trước? #Altcoin Season#
58
·
--
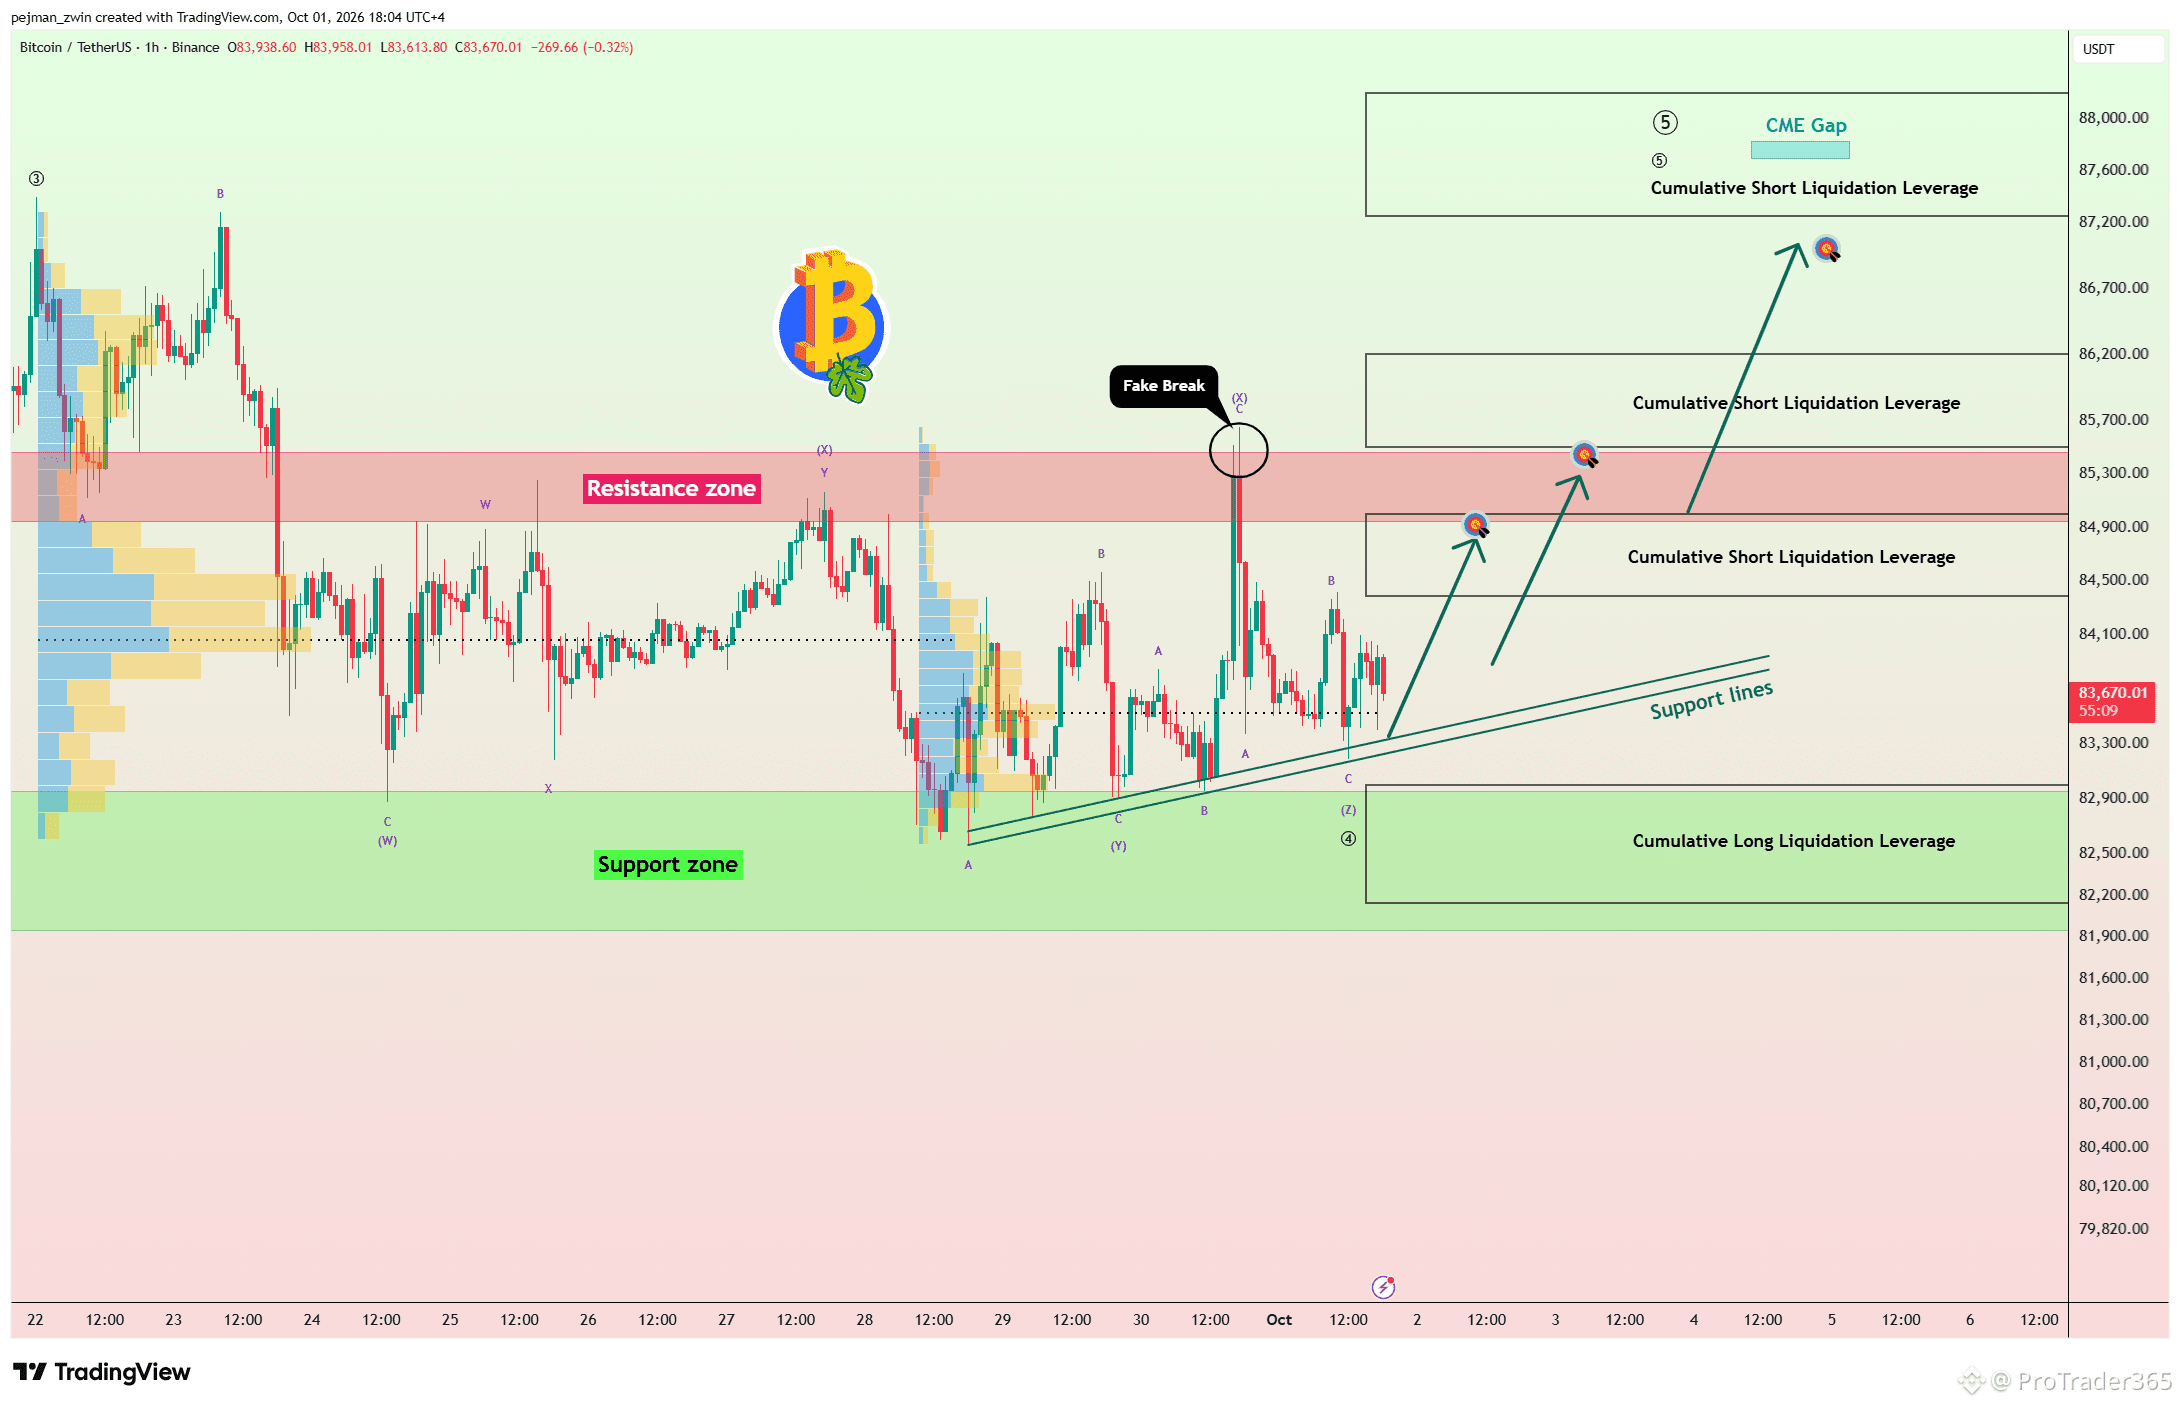
$BTC Kiểm Tra Vùng Hỗ Trợ — Bitcoin Cuối Cùng Có Thể Vượt Trên $86,000? Bitcoin đã giao dịch trong khoảng giữa Vùng Hỗ Trợ và Vùng Kháng Cự suốt tám ngày qua, tạo ra một thị trường đi ngang (range-bound) không có xu hướng rõ ràng. Hiện tại, BTC đang kiểm tra Vùng Hỗ Trợ, Tổng Đòn Bẩy Thanh Lỏng Long Tích Lũy($83,000-$82,140) và các Đường Hỗ Trợ. Xét theo góc nhìn Elliott Wave, Bitcoin có vẻ như đang hoàn tất Sóng Chính 4 dưới dạng Mẫu Điều Chỉnh Triple Three (W-X-Y-X-Z). Tôi kỳ vọng Bitcoin sẽ bắt đầu tăng trở lại từ các Đường Hỗ Trợ và mốc giao dịch quan trọng $83,540. Việc phá vỡ trên $84,100 có thể mở đường hướng tới Tổng Đòn Bẩy Thanh Lỏng Short Tích Lũy($85,000-$84,390). Nếu động lực tăng vẫn duy trì mạnh, Vùng Kháng Cự cuối cùng có thể bị phá vỡ, mở đường tới $85,430 và $87,180. Cắt Lỗ(SL): $82,400 (Kịch bản xấu nhất) Bitcoin có thể quay lại và vượt lên trên $86,000 để cuối cùng phá vỡ phạm vi giao dịch trong tám ngày không? #Phân Tích Giá BTC# #BTC #Dự Đoán Giá Bitcoin Của Bạn Là Gì?#
$BTC Kiểm Tra Vùng Hỗ Trợ — Bitcoin Cuối Cùng Có Thể Vượt Trên $86,000? Bitcoin đã giao dịch trong khoảng giữa Vùng Hỗ Trợ và Vùng Kháng Cự suốt tám ngày qua, tạo ra một thị trường đi ngang (range-bound) không có xu hướng rõ ràng. Hiện tại, BTC đang kiểm tra Vùng Hỗ Trợ, Tổng Đòn Bẩy Thanh Lỏng Long Tích Lũy($83,000-$82,140) và các Đường Hỗ Trợ. Xét theo góc nhìn Elliott Wave, Bitcoin có vẻ như đang hoàn tất Sóng Chính 4 dưới dạng Mẫu Điều Chỉnh Triple Three (W-X-Y-X-Z). Tôi kỳ vọng Bitcoin sẽ bắt đầu tăng trở lại từ các Đường Hỗ Trợ và mốc giao dịch quan trọng $83,540. Việc phá vỡ trên $84,100 có thể mở đường hướng tới Tổng Đòn Bẩy Thanh Lỏng Short Tích Lũy($85,000-$84,390). Nếu động lực tăng vẫn duy trì mạnh, Vùng Kháng Cự cuối cùng có thể bị phá vỡ, mở đường tới $85,430 và $87,180. Cắt Lỗ(SL): $82,400 (Kịch bản xấu nhất) Bitcoin có thể quay lại và vượt lên trên $86,000 để cuối cùng phá vỡ phạm vi giao dịch trong tám ngày không? #Phân Tích Giá BTC# #BTC #Dự Đoán Giá Bitcoin Của Bạn Là Gì?#
67
·
--
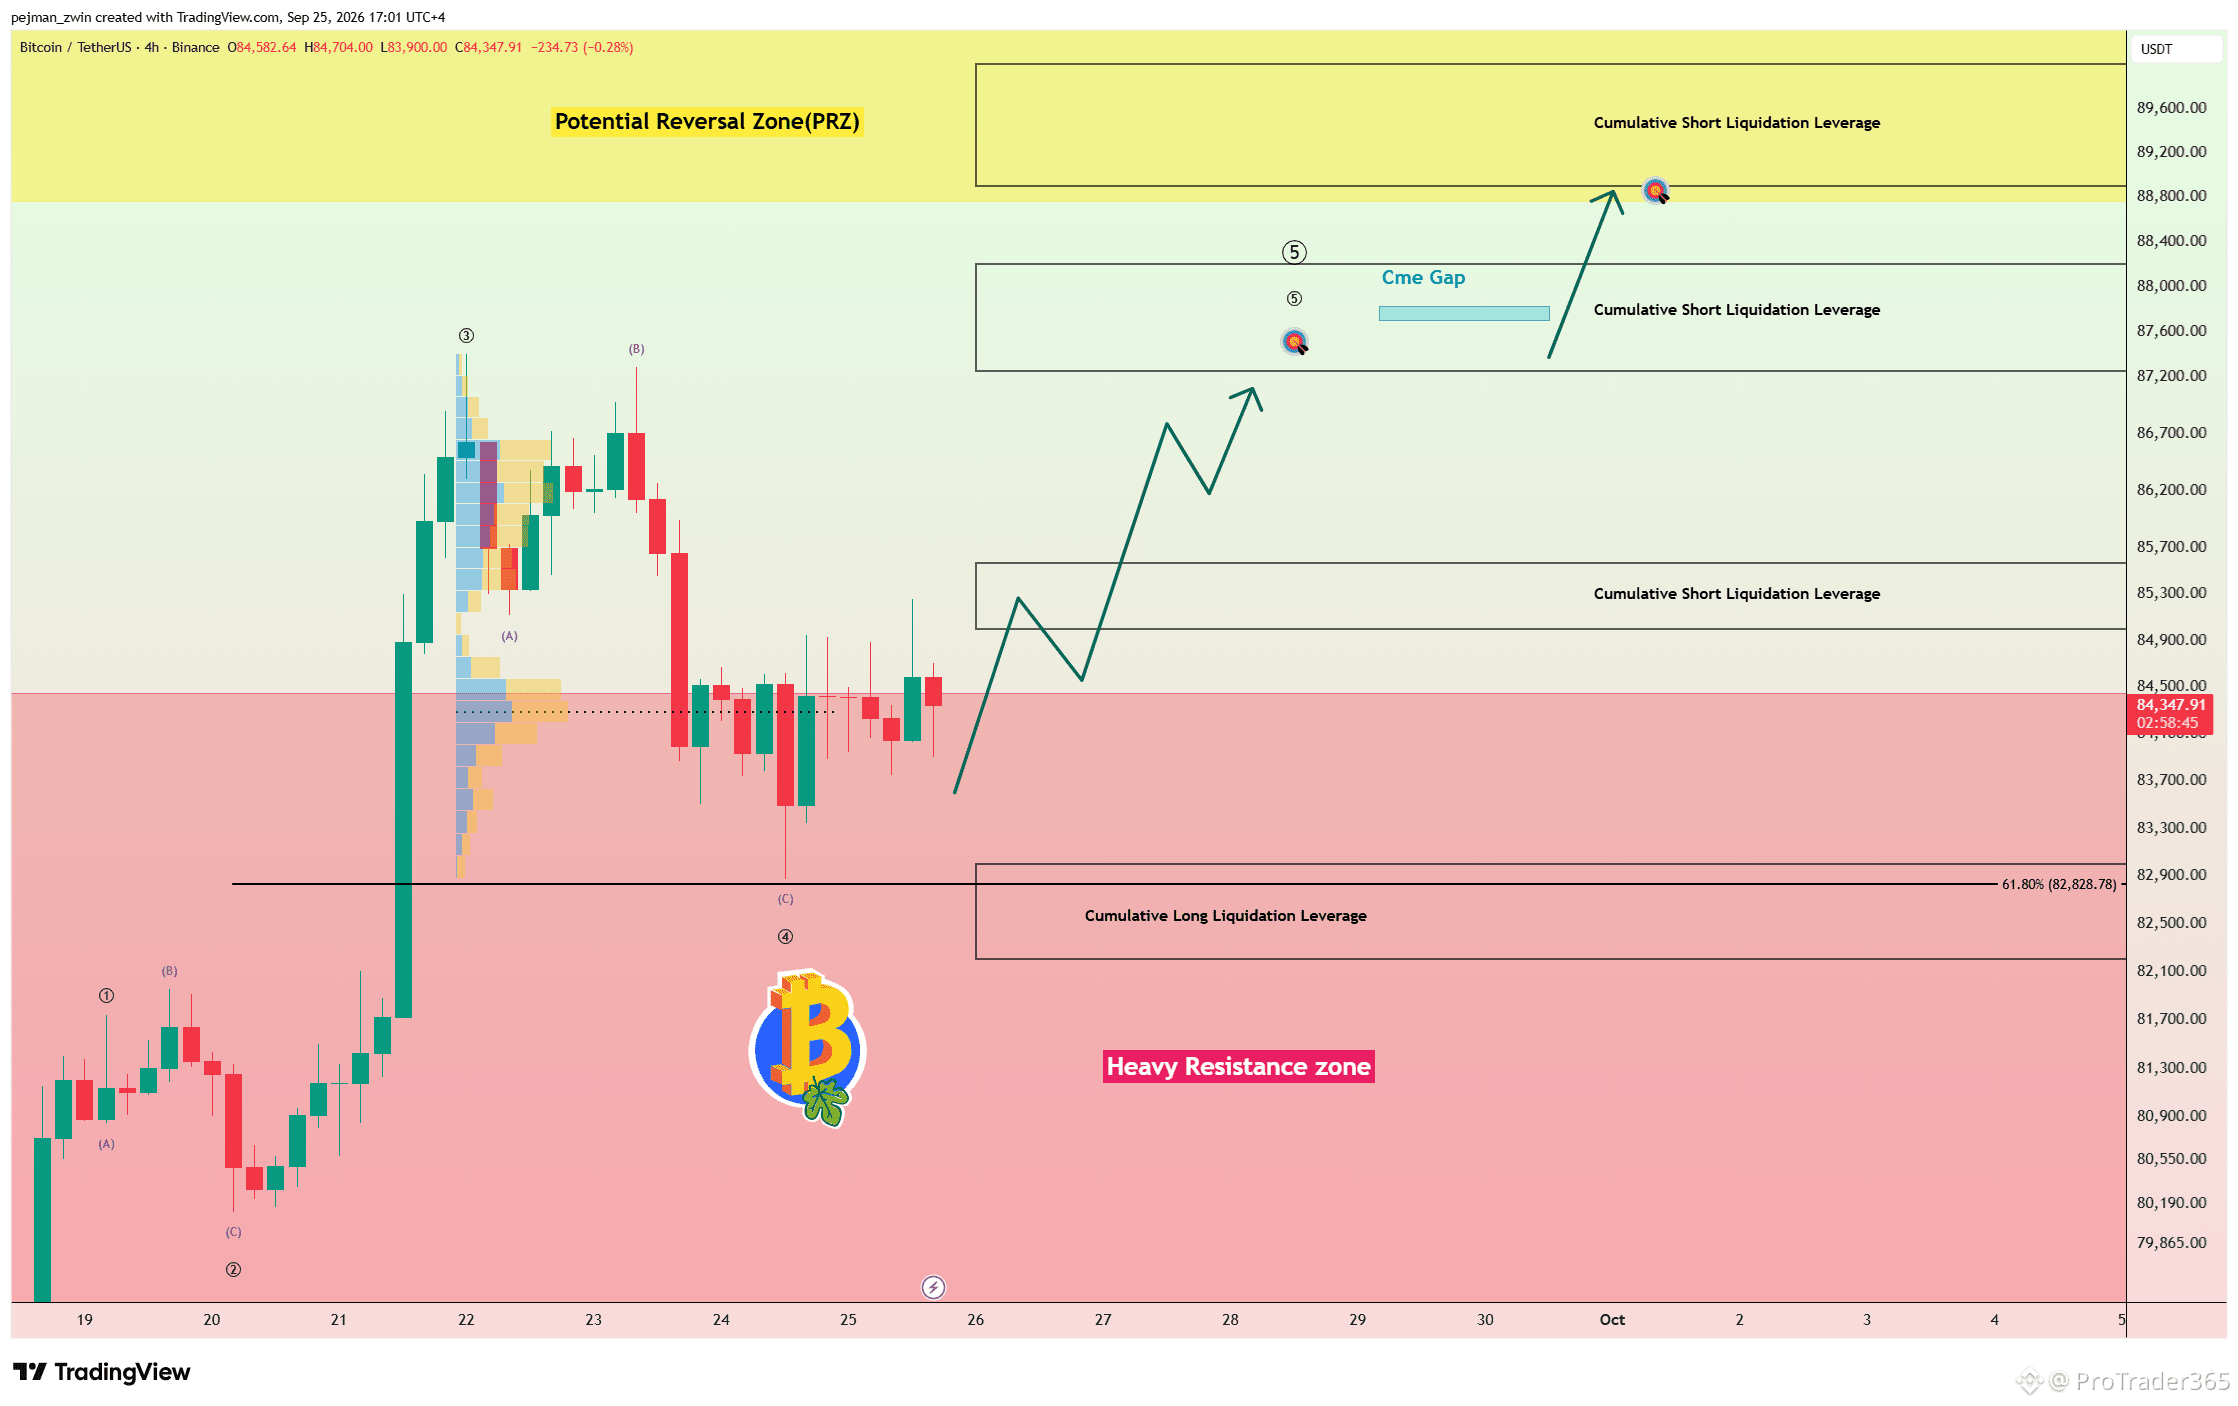
$BTC Phạm vi co hẹp — Vùng thanh khoản nào sẽ bị chạm trước? Bitcoin đã giao dịch trong một Range trong hai ngày qua, trong khi thanh khoản tiếp tục được tích lũy ở cả hai phía của thị trường. Các vùng then chốt cần theo dõi là: Đòn bẩy thanh lý Short tích lũy: $89,000-$90,000 Đòn bẩy thanh lý Short tích lũy: $87,250-$88,200 Đòn bẩy thanh lý Short tích lũy: $85,000-$85,570 Đòn bẩy thanh lý Long tích lũy: $82,200-$83,000 Những vùng này có thể đóng vai trò là các mục tiêu thanh khoản quan trọng khi Bitcoin thoát khỏi Range hiện tại. Về cơ bản, dòng tiền mạnh vào Spot Bitcoin ETF và lượng rút khỏi sàn lớn vẫn tiếp tục hỗ trợ cho việc tích lũy. Tuy nhiên, biến động ngắn hạn vẫn ở mức cao do đáo hạn các hợp đồng quyền chọn crypto và sự cố vi phạm bảo mật gần đây của Bitget liên quan đến khoảng $351,6M tài sản. Bên nào sẽ là mục tiêu đầu tiên của Bitcoin: $85,000-$85,570 hay $82,200-$83,000? #Bitcoin
$BTC Phạm vi co hẹp — Vùng thanh khoản nào sẽ bị chạm trước? Bitcoin đã giao dịch trong một Range trong hai ngày qua, trong khi thanh khoản tiếp tục được tích lũy ở cả hai phía của thị trường. Các vùng then chốt cần theo dõi là: Đòn bẩy thanh lý Short tích lũy: $89,000-$90,000 Đòn bẩy thanh lý Short tích lũy: $87,250-$88,200 Đòn bẩy thanh lý Short tích lũy: $85,000-$85,570 Đòn bẩy thanh lý Long tích lũy: $82,200-$83,000 Những vùng này có thể đóng vai trò là các mục tiêu thanh khoản quan trọng khi Bitcoin thoát khỏi Range hiện tại. Về cơ bản, dòng tiền mạnh vào Spot Bitcoin ETF và lượng rút khỏi sàn lớn vẫn tiếp tục hỗ trợ cho việc tích lũy. Tuy nhiên, biến động ngắn hạn vẫn ở mức cao do đáo hạn các hợp đồng quyền chọn crypto và sự cố vi phạm bảo mật gần đây của Bitget liên quan đến khoảng $351,6M tài sản. Bên nào sẽ là mục tiêu đầu tiên của Bitcoin: $85,000-$85,570 hay $82,200-$83,000? #Bitcoin
49
·
--
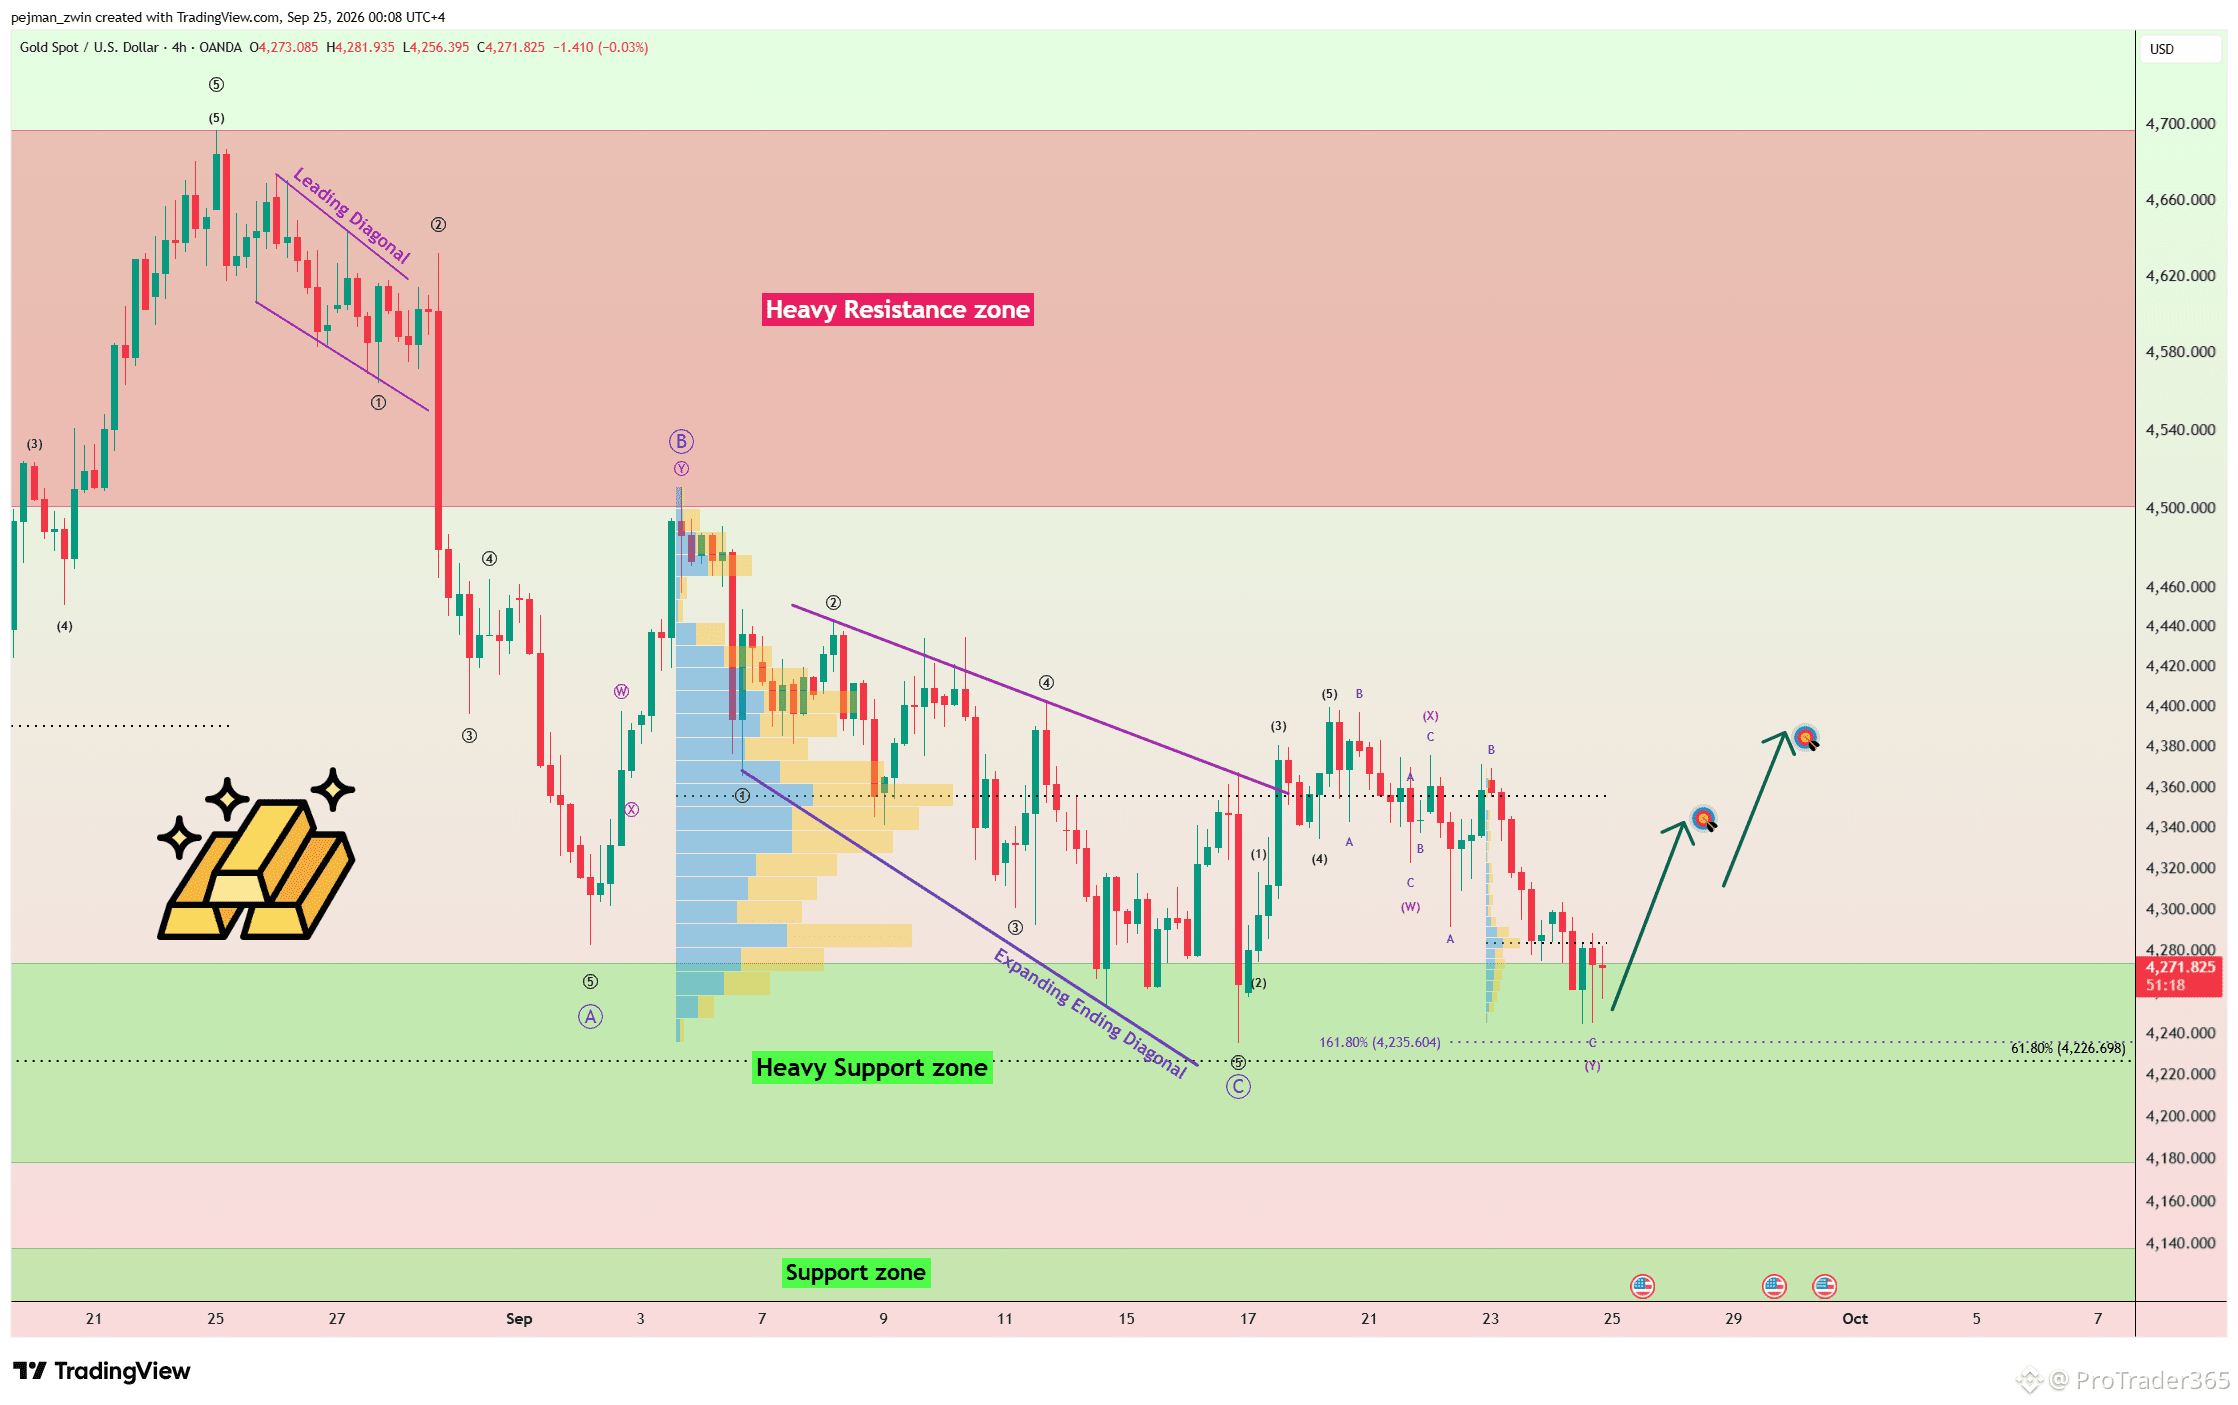
$XAUt Kiểm Tra Mức Hỗ Trợ Mạnh — Vàng Có Thể Tăng Lại Hướng Tới $4,381? Vàng đang trong xu hướng giảm trong 6–7 ngày, nhưng đà giảm hiện tại vẫn tương đối yếu. Đợt tăng trước đó, hoàn tất trong chưa đầy hai ngày, vẫn chưa được điều chỉnh/thoái lui hoàn toàn, cho thấy người mua vẫn duy trì được phần nào sức mạnh tương đối. Phân Tích Kỹ Thuật Vàng đang giao dịch gần mức Fibonacci 61,8% trên khung thời gian Daily và nằm trong Vùng Hỗ Trợ Mạnh ($4,274-$4,178). Xét theo góc độ Elliott Wave, trên khung 4 giờ, vàng có vẻ đang hoàn tất một mô hình Điều Chỉnh Double Three (W-X-Y). Miễn là giá vẫn giữ trên $4,233, kịch bản này vẫn còn hiệu lực. Tôi kỳ vọng một nhịp tăng sau khi giá vượt lên trên $4,284, nhắm mục tiêu đầu tiên là $4,337. Một đợt phá vỡ trên $4,355 có thể kéo dài đà tăng hướng tới $4,381. Mức Cắt Lỗ (SL): $4,229 Vàng có thể bảo vệ Vùng Hỗ Trợ Mạnh và đạt $4,381 hay trước đó sẽ xuất hiện một đợt điều chỉnh sâu hơn? #Gold
$XAUt Kiểm Tra Mức Hỗ Trợ Mạnh — Vàng Có Thể Tăng Lại Hướng Tới $4,381? Vàng đang trong xu hướng giảm trong 6–7 ngày, nhưng đà giảm hiện tại vẫn tương đối yếu. Đợt tăng trước đó, hoàn tất trong chưa đầy hai ngày, vẫn chưa được điều chỉnh/thoái lui hoàn toàn, cho thấy người mua vẫn duy trì được phần nào sức mạnh tương đối. Phân Tích Kỹ Thuật Vàng đang giao dịch gần mức Fibonacci 61,8% trên khung thời gian Daily và nằm trong Vùng Hỗ Trợ Mạnh ($4,274-$4,178). Xét theo góc độ Elliott Wave, trên khung 4 giờ, vàng có vẻ đang hoàn tất một mô hình Điều Chỉnh Double Three (W-X-Y). Miễn là giá vẫn giữ trên $4,233, kịch bản này vẫn còn hiệu lực. Tôi kỳ vọng một nhịp tăng sau khi giá vượt lên trên $4,284, nhắm mục tiêu đầu tiên là $4,337. Một đợt phá vỡ trên $4,355 có thể kéo dài đà tăng hướng tới $4,381. Mức Cắt Lỗ (SL): $4,229 Vàng có thể bảo vệ Vùng Hỗ Trợ Mạnh và đạt $4,381 hay trước đó sẽ xuất hiện một đợt điều chỉnh sâu hơn? #Gold
46
·
--
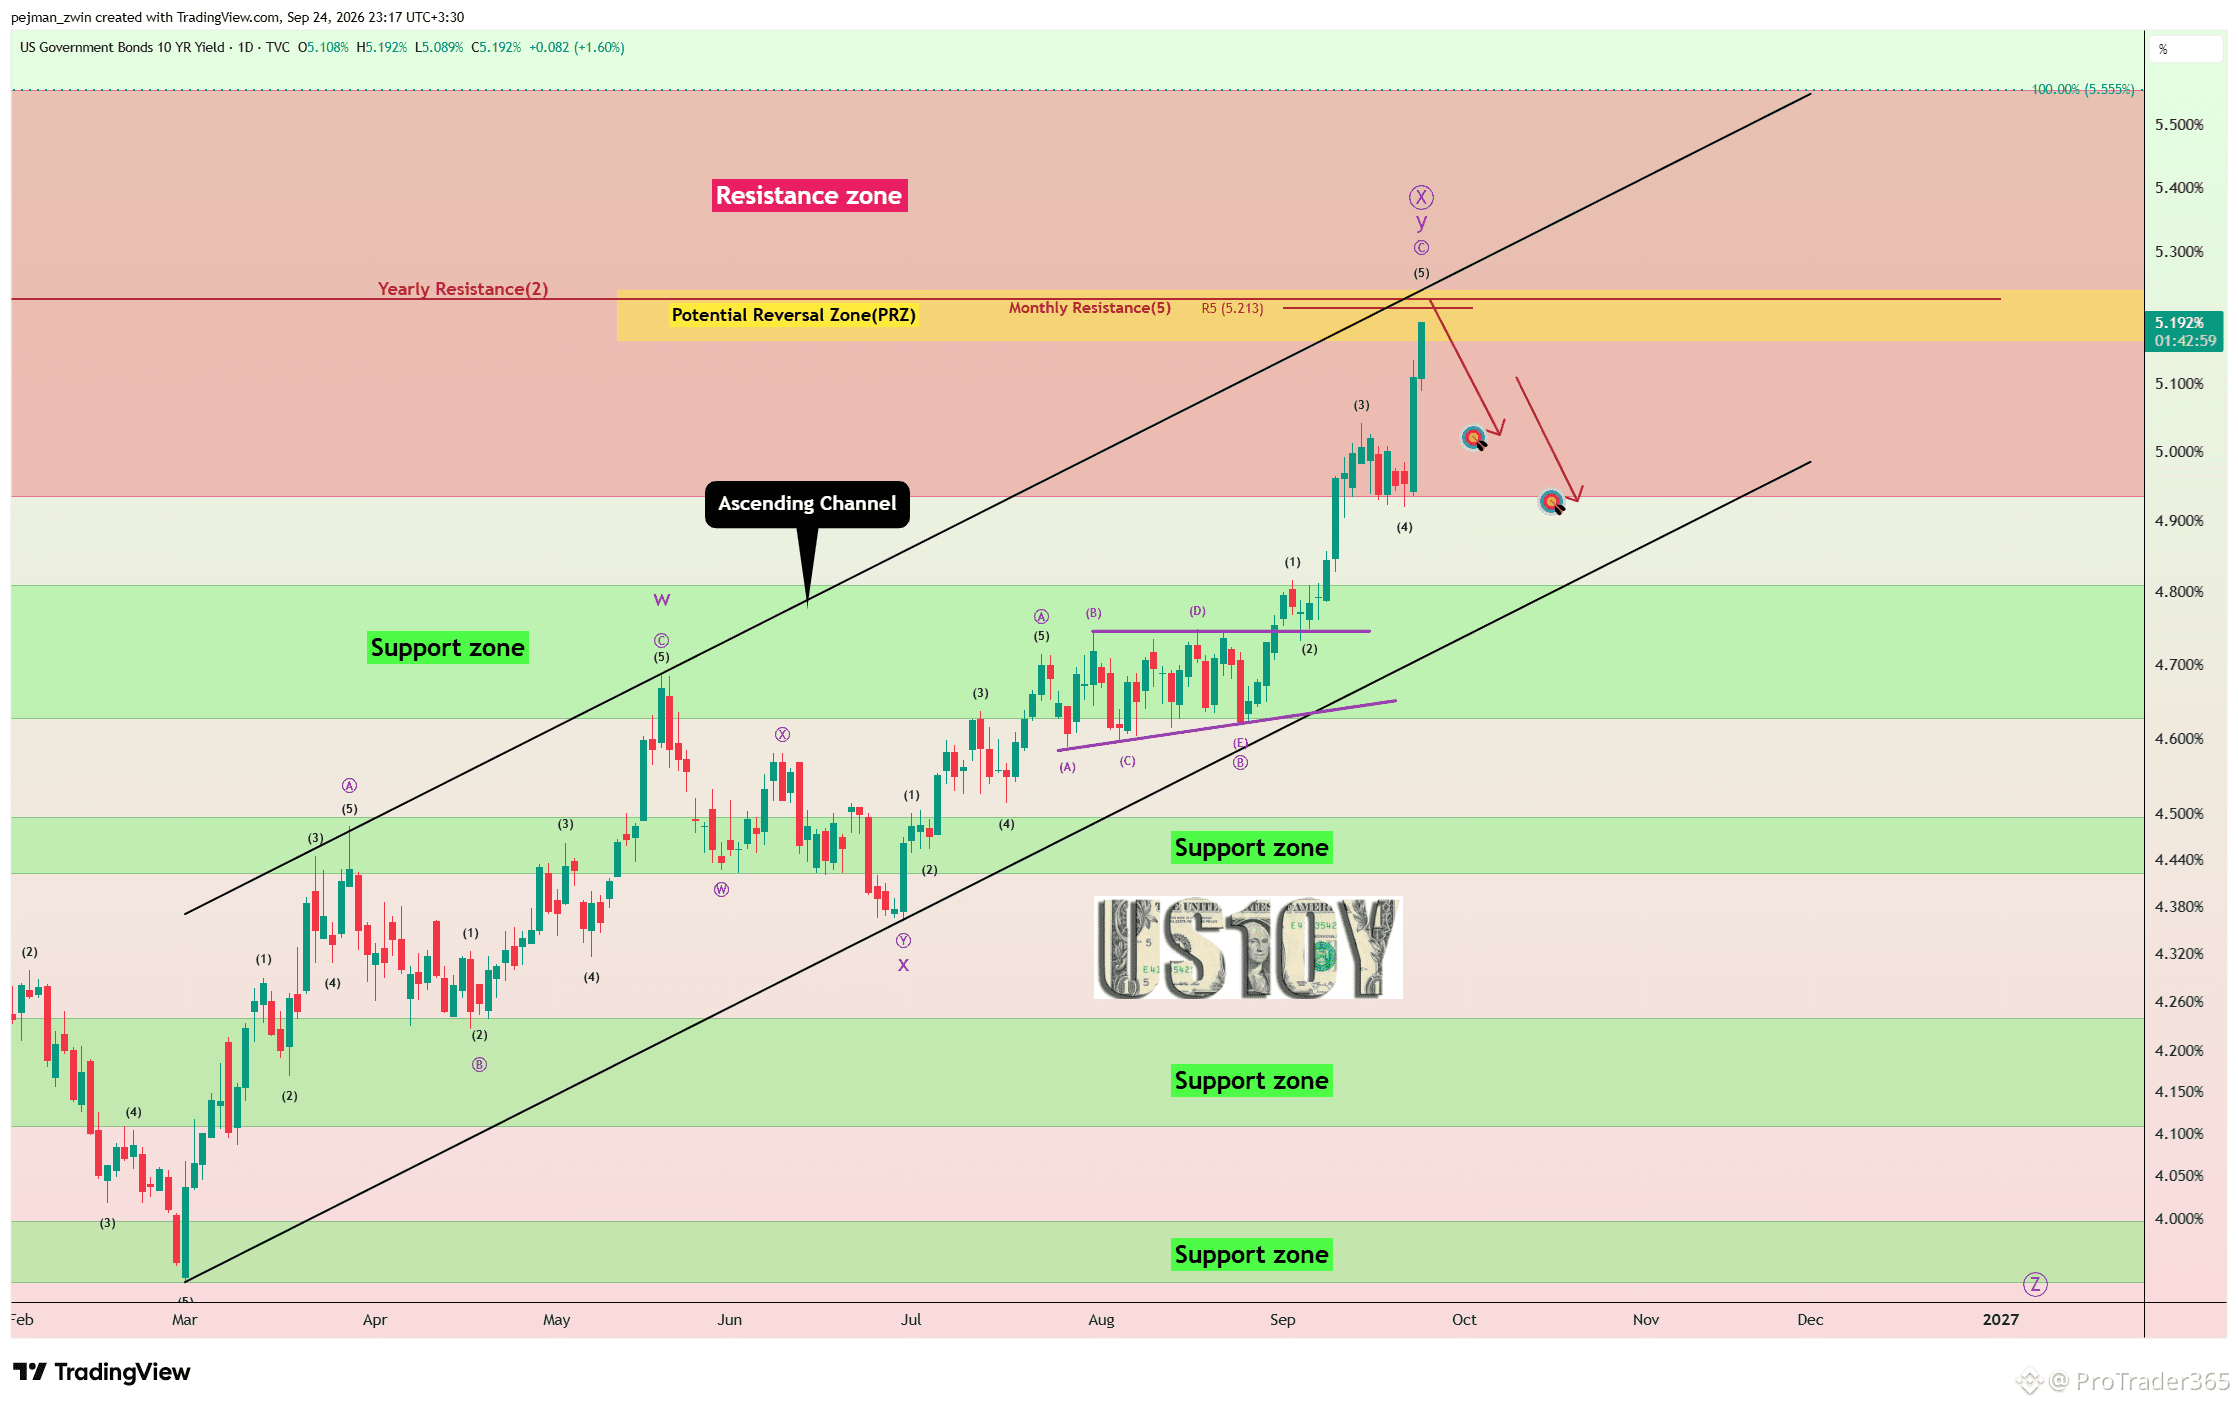
$BTC Có Thể Được Lợi Nếu US10Y Bị Từ Chối Tại Vùng Kháng Cự Lớn Này Lợi suất Trái phiếu Kho bạc Mỹ kỳ hạn 10 năm (US10Y) đã tăng mạnh trong 2–3 ngày qua và hiện đang tiến vào một vùng kháng cự kỹ thuật quan trọng. Một đợt đảo chiều tại đây có thể làm giảm áp lực lên Bitcoin, Vàng và cổ phiếu Mỹ. Phân Tích Kỹ Thuật US10Y đang giao dịch trong Vùng Kháng Cự(5.55%-4.93%), gần đường xu hướng trên của Kênh Tăng, Vùng Có Khả Năng Đảo Chiều(PRZ)[5.25%-5.16%], Kháng Cự Tháng 5, và Kháng Cự Năm 2. Theo góc nhìn Elliott Wave, US10Y có vẻ đang hoàn tất Sóng 5, sau đó các sóng điều chỉnh có thể bắt đầu. Tôi kỳ vọng mức giảm về 5.03% và có thể là 4.95%. Cắt Lỗ(SL): 5.29% Liệu US10Y có bị từ chối tại vùng hợp lưu này và kích hoạt một đợt phục hồi rủi ro trên diện rộng không?
$BTC Có Thể Được Lợi Nếu US10Y Bị Từ Chối Tại Vùng Kháng Cự Lớn Này Lợi suất Trái phiếu Kho bạc Mỹ kỳ hạn 10 năm (US10Y) đã tăng mạnh trong 2–3 ngày qua và hiện đang tiến vào một vùng kháng cự kỹ thuật quan trọng. Một đợt đảo chiều tại đây có thể làm giảm áp lực lên Bitcoin, Vàng và cổ phiếu Mỹ. Phân Tích Kỹ Thuật US10Y đang giao dịch trong Vùng Kháng Cự(5.55%-4.93%), gần đường xu hướng trên của Kênh Tăng, Vùng Có Khả Năng Đảo Chiều(PRZ)[5.25%-5.16%], Kháng Cự Tháng 5, và Kháng Cự Năm 2. Theo góc nhìn Elliott Wave, US10Y có vẻ đang hoàn tất Sóng 5, sau đó các sóng điều chỉnh có thể bắt đầu. Tôi kỳ vọng mức giảm về 5.03% và có thể là 4.95%. Cắt Lỗ(SL): 5.29% Liệu US10Y có bị từ chối tại vùng hợp lưu này và kích hoạt một đợt phục hồi rủi ro trên diện rộng không?
65
·
--
$USDT
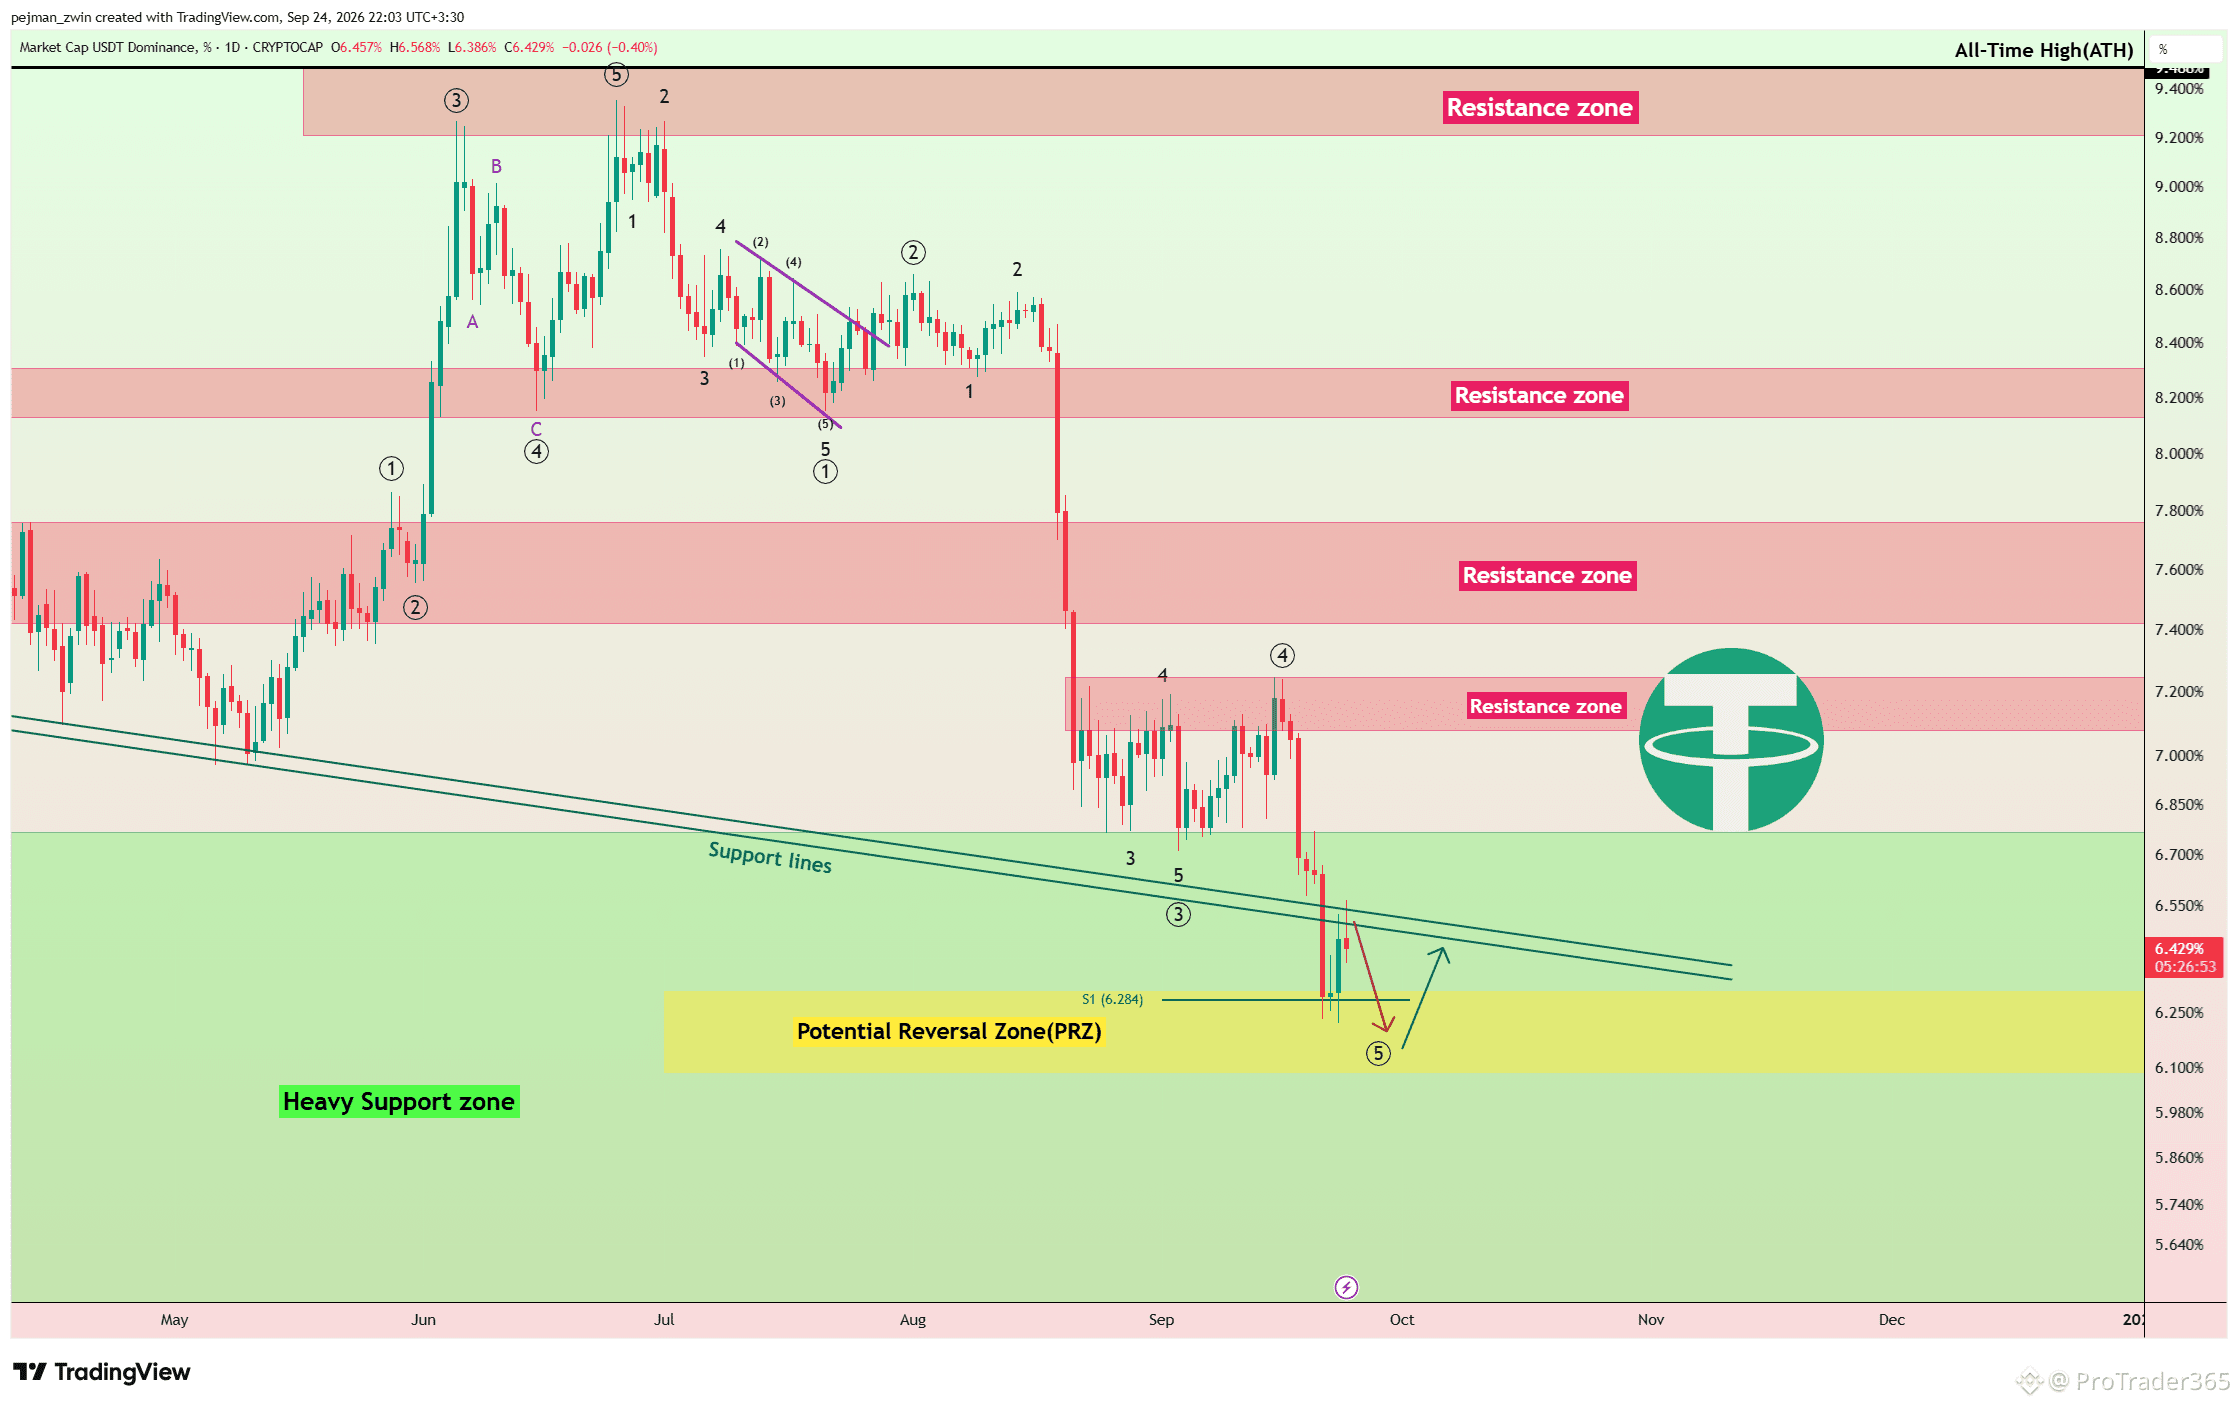
Sự thống trị của USDT đang suy giảm — Liệu một đợt tăng giá crypto có sắp diễn ra?
Chỉ số USDT Dominance%(USDT.D) là một trong những chỉ báo quan trọng để theo dõi mức độ chấp nhận rủi ro trên thị trường tiền mã hóa. Sự suy giảm thường hỗ trợ Bitcoin và các altcoin, trong khi mức tăng có thể báo hiệu dòng vốn đang chuyển sang stablecoin.
Phân tích kỹ thuật
Trên khung thời gian Daily, USDT.D đã tiến vào Vùng Hỗ trợ Mạnh (Heavy Support Zone)(6.77%-5.25%), phá vỡ xuống dưới các Đường Hỗ trợ của nó và dường như đã hoàn tất một nhịp điều chỉnh về cấu trúc đã bị phá vỡ.
Xét theo góc độ Elliott Wave, USDT.D có vẻ đang hoàn tất làn sóng chính Wave 5, có khả năng nằm trong Vùng Đảo Chiều Tiềm Năng (Potential Reversal Zone - PRZ)[6.30%-6.07%].
Tôi kỳ vọng USDT.D sẽ tiếp tục giảm hướng tới PRZ, điều này có thể hỗ trợ giá crypto cao hơn. Tuy nhiên, nếu hoàn tất Wave 5 tại đó có thể kích hoạt một nhịp đảo chiều ngắn hạn và tạo áp lực trở lại lên thị trường.
Liệu USDT.D có chạm đến PRZ trước khi đợt điều chỉnh crypto tiếp theo bắt đầu? #Tether
$USDT
Sự thống trị của USDT đang suy giảm — Liệu một đợt tăng giá crypto có sắp diễn ra?
Chỉ số USDT Dominance%(USDT.D) là một trong những chỉ báo quan trọng để theo dõi mức độ chấp nhận rủi ro trên thị trường tiền mã hóa. Sự suy giảm thường hỗ trợ Bitcoin và các altcoin, trong khi mức tăng có thể báo hiệu dòng vốn đang chuyển sang stablecoin.
Phân tích kỹ thuật
Trên khung thời gian Daily, USDT.D đã tiến vào Vùng Hỗ trợ Mạnh (Heavy Support Zone)(6.77%-5.25%), phá vỡ xuống dưới các Đường Hỗ trợ của nó và dường như đã hoàn tất một nhịp điều chỉnh về cấu trúc đã bị phá vỡ.
Xét theo góc độ Elliott Wave, USDT.D có vẻ đang hoàn tất làn sóng chính Wave 5, có khả năng nằm trong Vùng Đảo Chiều Tiềm Năng (Potential Reversal Zone - PRZ)[6.30%-6.07%].
Tôi kỳ vọng USDT.D sẽ tiếp tục giảm hướng tới PRZ, điều này có thể hỗ trợ giá crypto cao hơn. Tuy nhiên, nếu hoàn tất Wave 5 tại đó có thể kích hoạt một nhịp đảo chiều ngắn hạn và tạo áp lực trở lại lên thị trường.
Liệu USDT.D có chạm đến PRZ trước khi đợt điều chỉnh crypto tiếp theo bắt đầu? #Tether
Sự thống trị của USDT đang suy giảm — Liệu một đợt tăng giá crypto có sắp diễn ra?
Chỉ số USDT Dominance%(USDT.D) là một trong những chỉ báo quan trọng để theo dõi mức độ chấp nhận rủi ro trên thị trường tiền mã hóa. Sự suy giảm thường hỗ trợ Bitcoin và các altcoin, trong khi mức tăng có thể báo hiệu dòng vốn đang chuyển sang stablecoin.
Phân tích kỹ thuật
Trên khung thời gian Daily, USDT.D đã tiến vào Vùng Hỗ trợ Mạnh (Heavy Support Zone)(6.77%-5.25%), phá vỡ xuống dưới các Đường Hỗ trợ của nó và dường như đã hoàn tất một nhịp điều chỉnh về cấu trúc đã bị phá vỡ.
Xét theo góc độ Elliott Wave, USDT.D có vẻ đang hoàn tất làn sóng chính Wave 5, có khả năng nằm trong Vùng Đảo Chiều Tiềm Năng (Potential Reversal Zone - PRZ)[6.30%-6.07%].
Tôi kỳ vọng USDT.D sẽ tiếp tục giảm hướng tới PRZ, điều này có thể hỗ trợ giá crypto cao hơn. Tuy nhiên, nếu hoàn tất Wave 5 tại đó có thể kích hoạt một nhịp đảo chiều ngắn hạn và tạo áp lực trở lại lên thị trường.
Liệu USDT.D có chạm đến PRZ trước khi đợt điều chỉnh crypto tiếp theo bắt đầu? #Tether
58
·
--
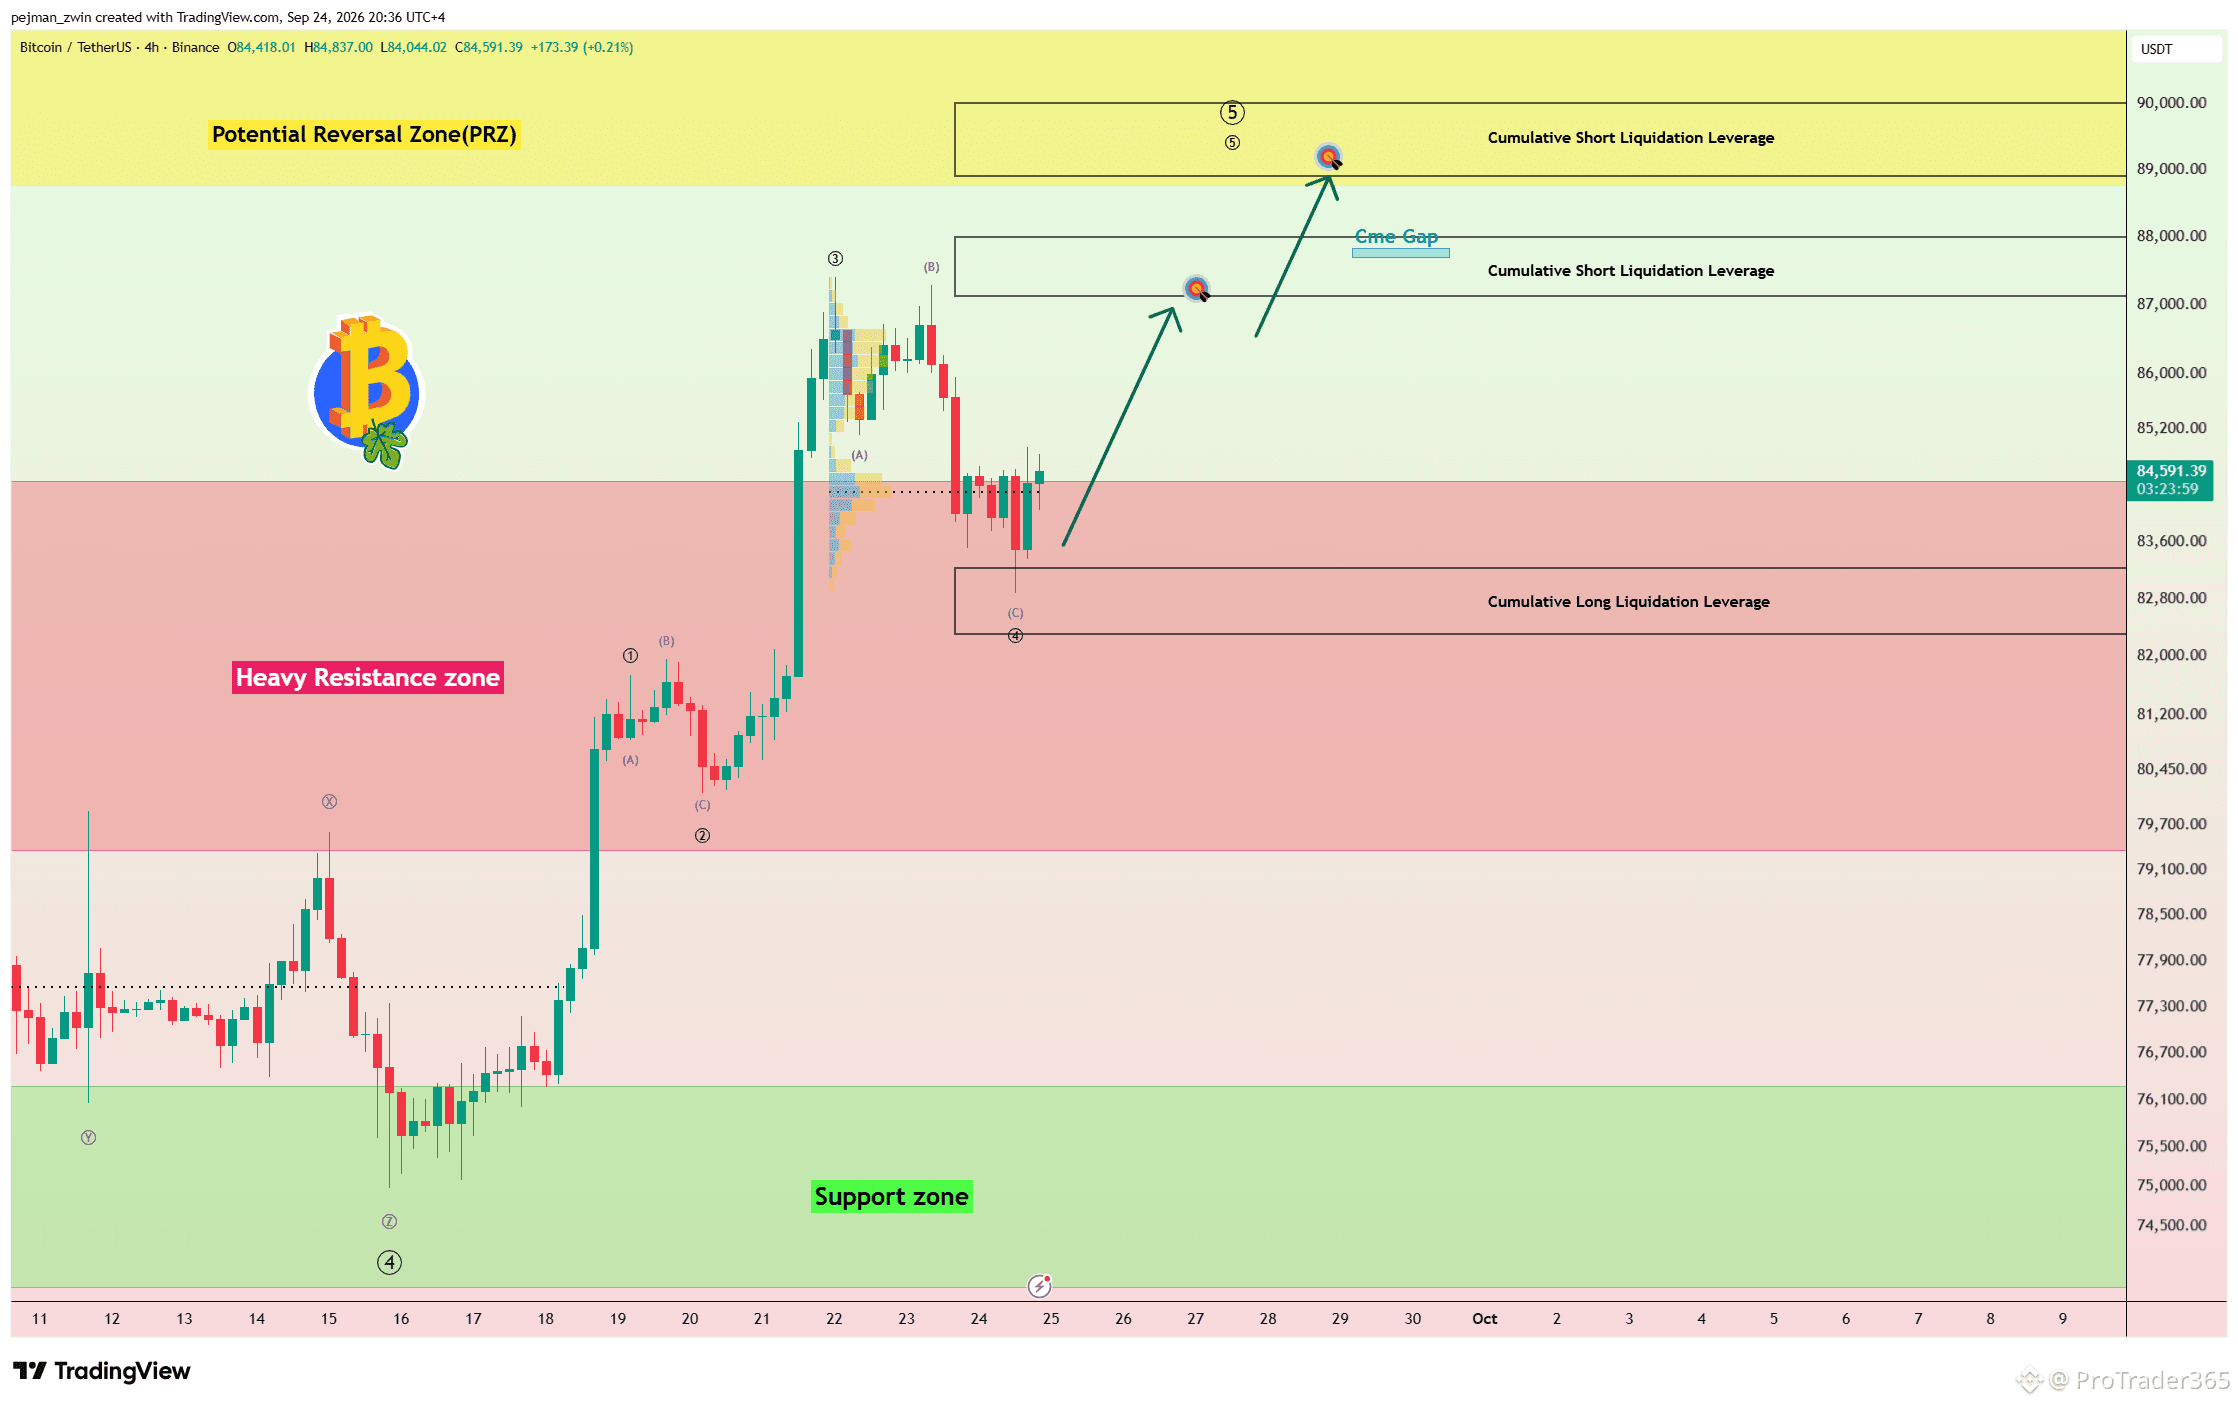
$BTC Phá vỡ vùng kháng cự nặng — Bitcoin có thể tiếp tục vượt trên $87,000 không? Bitcoin dường như đã thành công vượt lên trên vùng kháng cự nặng và hiện đang hoàn tất một nhịp điều chỉnh/pullback hướng về khu vực này. Giá cũng phản ứng rất tốt với Đòn bẩy thanh lý lệnh mua (Cumulative Long Liquidation Leverage)($83,220-$82,300) và bắt đầu tăng trở lại. Phân tích kỹ thuật Xét theo góc độ Sóng Elliott, Bitcoin có vẻ đã hoàn tất Sóng Cấp độ 4 (Primary Wave 4), từ đó có thể mở đường cho các Sóng xung lực (Impulsive Waves) tiếp theo. Nhịp pullback hiện tại hướng về vùng kháng cự nặng đã bị phá vỡ trước đó có thể đóng vai trò như một lần kiểm tra lại (retest) trước một đợt đi lên mang tính bullish khác. Tôi kỳ vọng Bitcoin sẽ tăng lên mức $86,870 trước. Nếu động lượng tăng tiếp tục mạnh hơn, giá có thể đạt $88,810 và thậm chí mở rộng hướng tới Vùng Đảo chiều tiềm năng (Potential Reversal Zone - PRZ)[$91,860-$88,760]. Cắt lỗ (Stop Loss - SL): $81,770 Khoảng trống CME (Upper CME Gap): $87,825-$87,700 Bitcoin có thể xác nhận cú phá vỡ và mở rộng vượt trên $87,000 không? #BTC Price Analysis#
$BTC Phá vỡ vùng kháng cự nặng — Bitcoin có thể tiếp tục vượt trên $87,000 không? Bitcoin dường như đã thành công vượt lên trên vùng kháng cự nặng và hiện đang hoàn tất một nhịp điều chỉnh/pullback hướng về khu vực này. Giá cũng phản ứng rất tốt với Đòn bẩy thanh lý lệnh mua (Cumulative Long Liquidation Leverage)($83,220-$82,300) và bắt đầu tăng trở lại. Phân tích kỹ thuật Xét theo góc độ Sóng Elliott, Bitcoin có vẻ đã hoàn tất Sóng Cấp độ 4 (Primary Wave 4), từ đó có thể mở đường cho các Sóng xung lực (Impulsive Waves) tiếp theo. Nhịp pullback hiện tại hướng về vùng kháng cự nặng đã bị phá vỡ trước đó có thể đóng vai trò như một lần kiểm tra lại (retest) trước một đợt đi lên mang tính bullish khác. Tôi kỳ vọng Bitcoin sẽ tăng lên mức $86,870 trước. Nếu động lượng tăng tiếp tục mạnh hơn, giá có thể đạt $88,810 và thậm chí mở rộng hướng tới Vùng Đảo chiều tiềm năng (Potential Reversal Zone - PRZ)[$91,860-$88,760]. Cắt lỗ (Stop Loss - SL): $81,770 Khoảng trống CME (Upper CME Gap): $87,825-$87,700 Bitcoin có thể xác nhận cú phá vỡ và mở rộng vượt trên $87,000 không? #BTC Price Analysis#
62
·
--
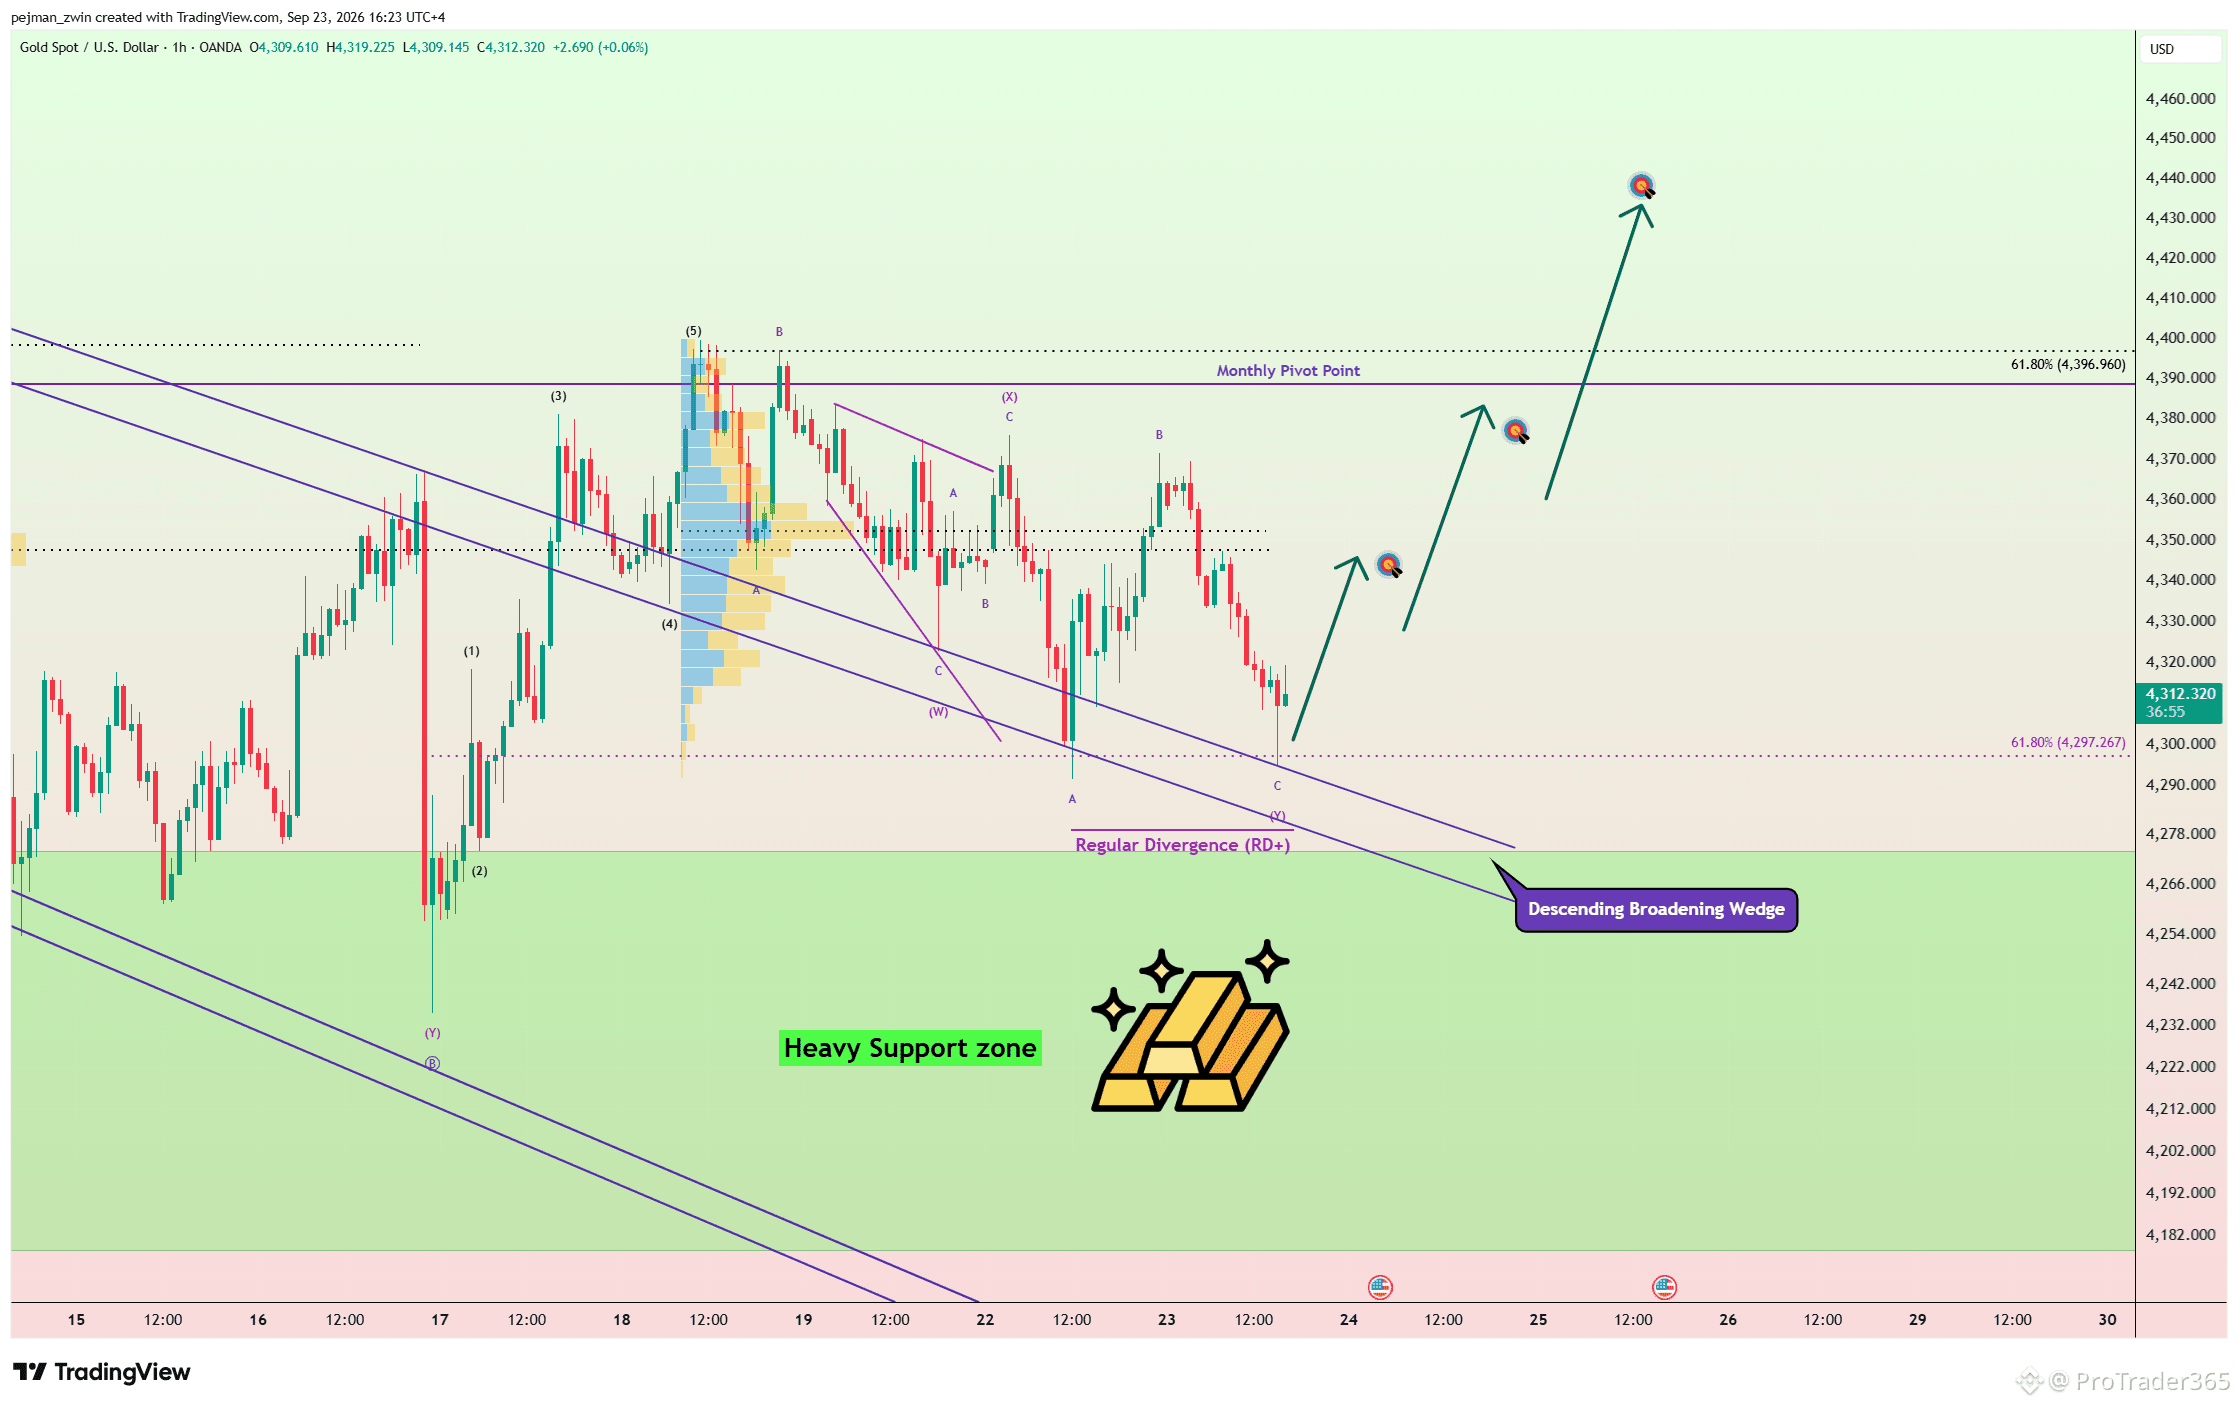
$XAUt Sự Điều Chỉnh Double Three Gần Hoàn Thành — Liệu $4,400 Tiếp Theo? Vàng đã giảm trong 4–5 ngày qua, nhưng đợt giảm đã diễn ra với mức biến động cao và động lượng giảm tương đối yếu. Miễn là giá vẫn nằm trên các đường xu hướng của Mô Hình Nêm Mở Rộng Giảm Dần, kịch bản tăng giá tổng thể vẫn còn hiệu lực. Phân Tích Kỹ Thuật Vàng đang giao dịch cao hơn mô hình và gần Vùng Hỗ Trợ Nặng. Dưới góc nhìn Elliott Wave, vàng có vẻ đã hình thành một Cú Điều Chỉnh Double Three (W-X-Y), và hiện có thể đang tiến gần đến hoàn tất. Tôi kỳ vọng vàng sẽ bắt đầu tăng trở lại hướng tới $4,344. Việc vượt lên trên mức giao dịch quan trọng $4,350 có thể giúp đợt tăng tiếp diễn hướng tới $4,377, trong khi động lượng tăng mạnh hơn có thể mở đường tới $4,421. Cắt Lỗ (SL): $4,284 Các Mức Quan Trọng: $4,350 _ $4,400 Liệu vàng có thể hoàn tất đợt điều chỉnh tại đây và bắt đầu một Sóng Tăng Động (Impulsive Wave) khác hướng tới $4,400 không? #Gold
$XAUt Sự Điều Chỉnh Double Three Gần Hoàn Thành — Liệu $4,400 Tiếp Theo? Vàng đã giảm trong 4–5 ngày qua, nhưng đợt giảm đã diễn ra với mức biến động cao và động lượng giảm tương đối yếu. Miễn là giá vẫn nằm trên các đường xu hướng của Mô Hình Nêm Mở Rộng Giảm Dần, kịch bản tăng giá tổng thể vẫn còn hiệu lực. Phân Tích Kỹ Thuật Vàng đang giao dịch cao hơn mô hình và gần Vùng Hỗ Trợ Nặng. Dưới góc nhìn Elliott Wave, vàng có vẻ đã hình thành một Cú Điều Chỉnh Double Three (W-X-Y), và hiện có thể đang tiến gần đến hoàn tất. Tôi kỳ vọng vàng sẽ bắt đầu tăng trở lại hướng tới $4,344. Việc vượt lên trên mức giao dịch quan trọng $4,350 có thể giúp đợt tăng tiếp diễn hướng tới $4,377, trong khi động lượng tăng mạnh hơn có thể mở đường tới $4,421. Cắt Lỗ (SL): $4,284 Các Mức Quan Trọng: $4,350 _ $4,400 Liệu vàng có thể hoàn tất đợt điều chỉnh tại đây và bắt đầu một Sóng Tăng Động (Impulsive Wave) khác hướng tới $4,400 không? #Gold
82
·
--
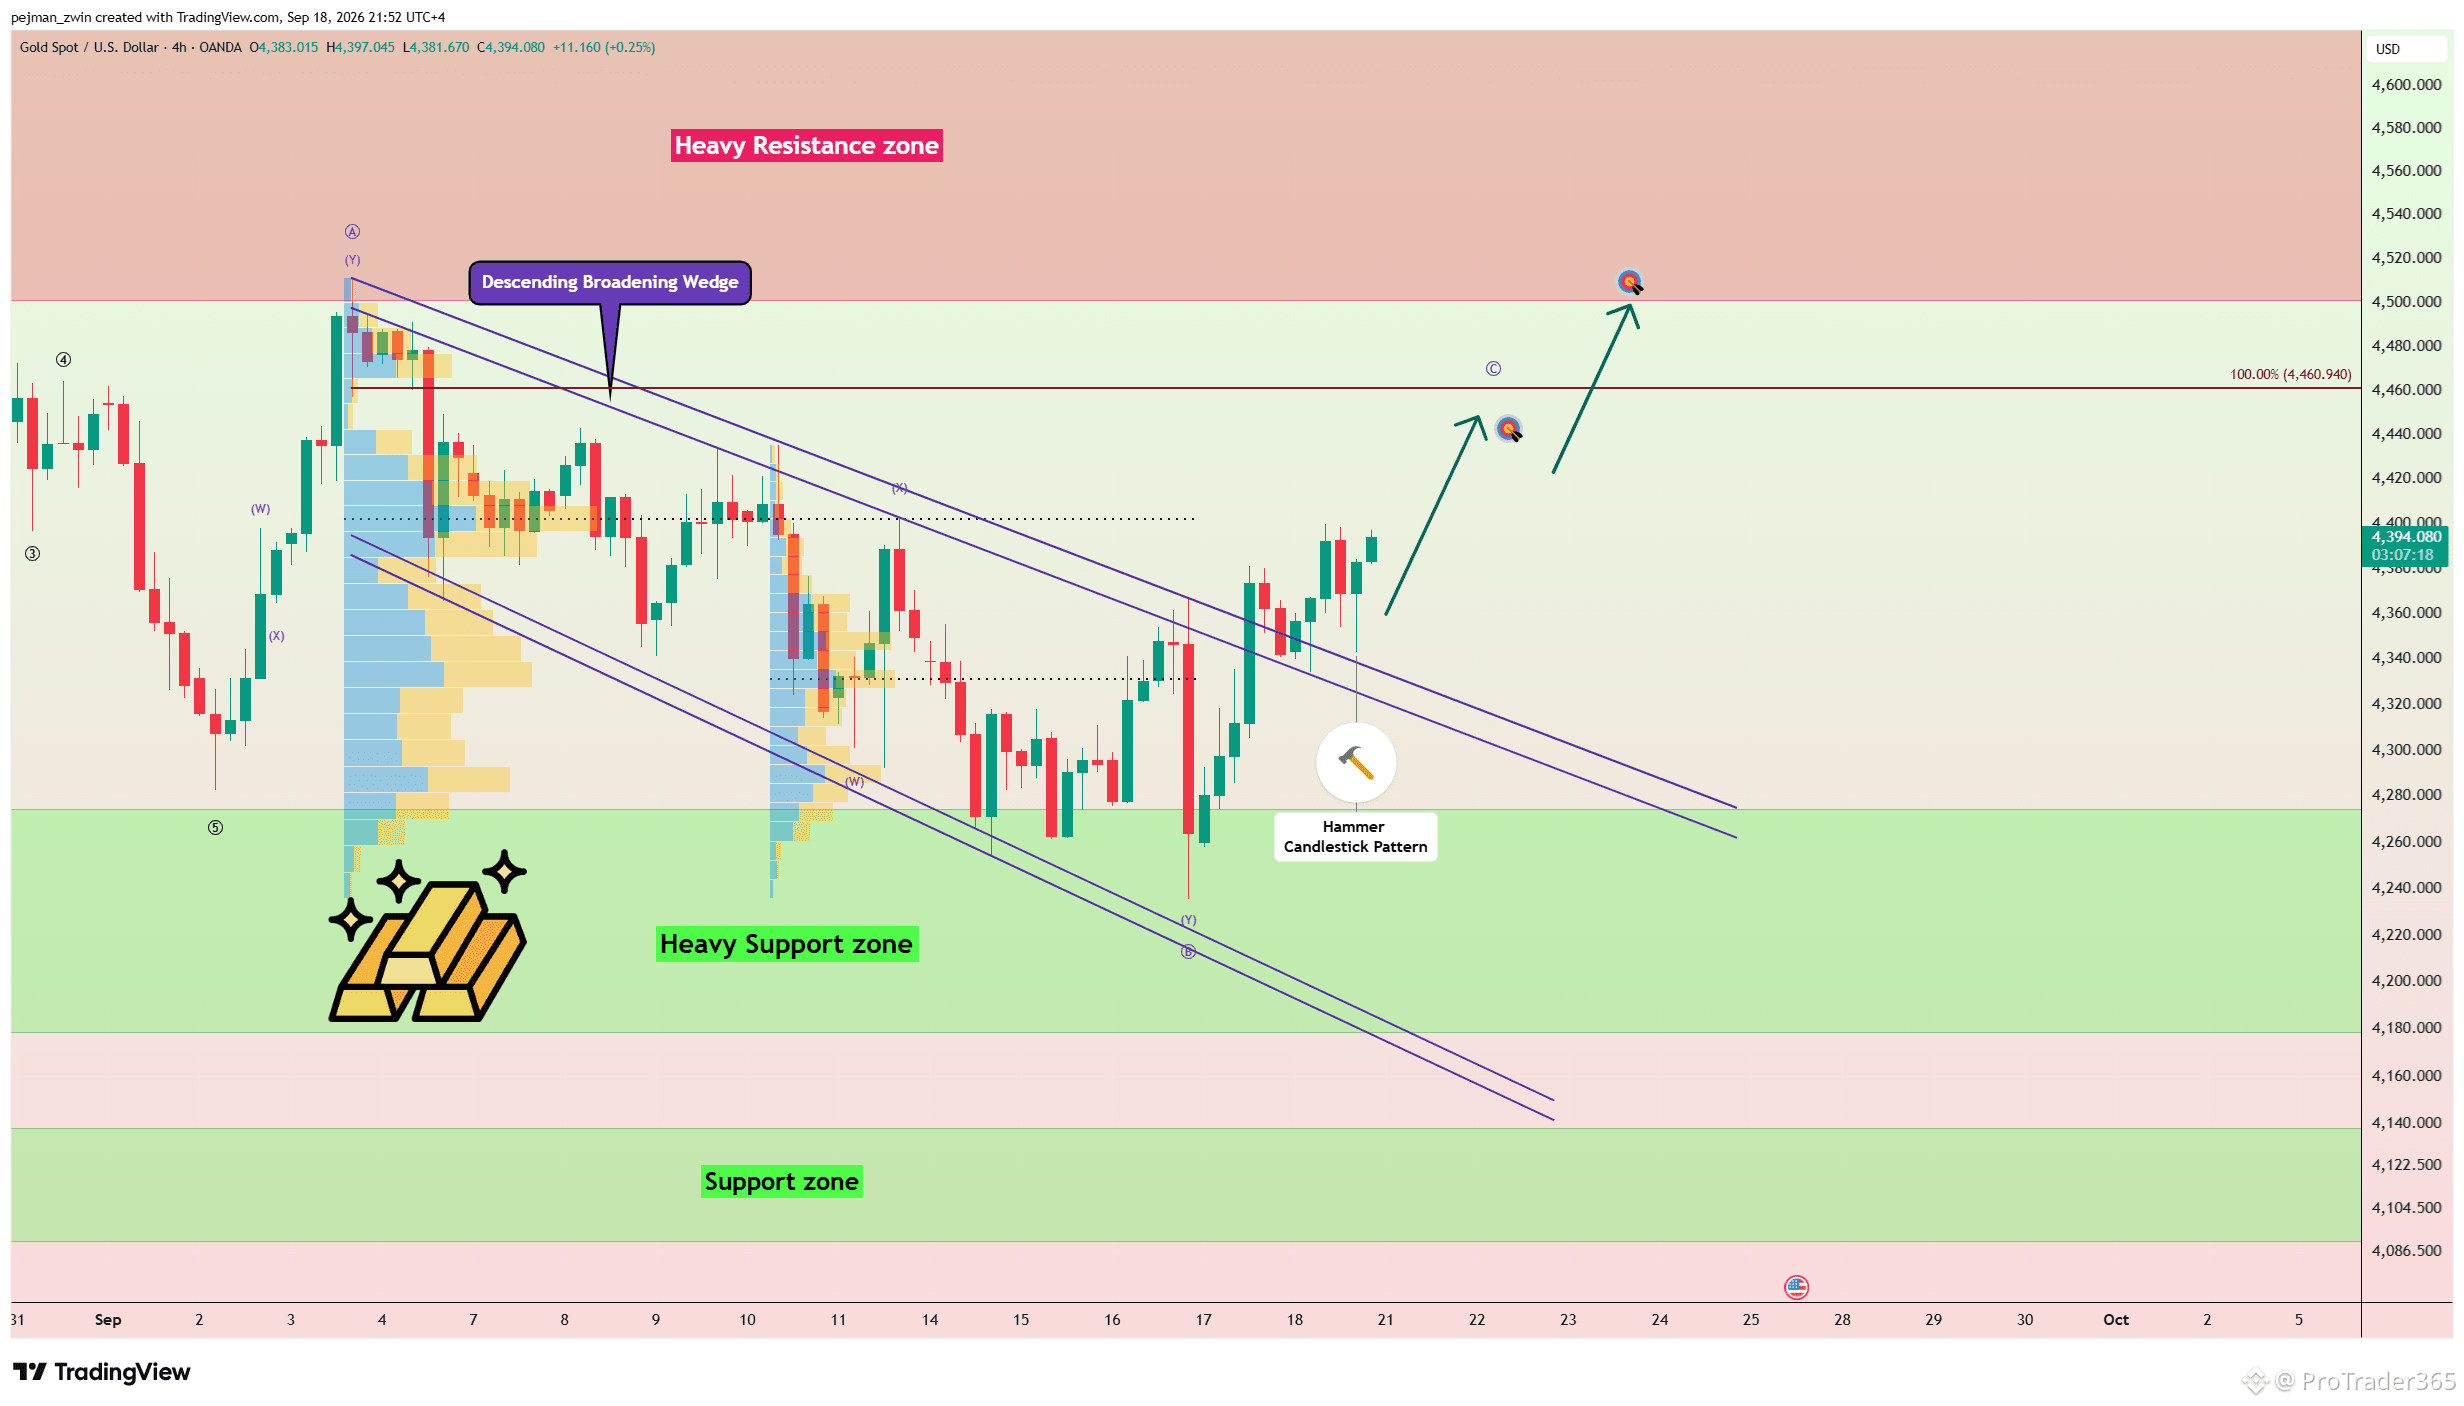
$XAUt Phá vỡ Tam giác mở rộng giảm dần — Vàng có thể đạt $4,487 không? Vàng đã thành công phá vỡ phía trên đường xu hướng của Mô hình Tam giác mở rộng giảm dần và hiện đang giao dịch trên mô hình, làm tăng xác suất cho một đợt tăng giá khác. Phân tích kỹ thuật Sự phá vỡ cho thấy áp lực giảm có thể đang suy yếu và người mua đang cố gắng giành lại quyền kiểm soát. Tuy nhiên, mốc giao dịch then chốt $4,400 vẫn là mức xác nhận chính cho động lượng tăng giá mạnh hơn. Tôi kỳ vọng vàng, sau khi thành công vượt lên trên $4,400, sẽ tăng ít nhất hướng đến $4,443. Nếu động lượng tăng giá gia tăng, đợt tăng có thể mở rộng lên $4,487. Lần chốt lời (TP) thứ nhất: $4,443 Lần chốt lời (TP) thứ hai: $4,487 Cắt lỗ (SL): $4,321 (Tệ nhất) Liệu vàng có thể xác nhận việc phá vỡ trên $4,400 và mở rộng đà tăng hướng tới $4,487 không? #Vàng
$XAUt Phá vỡ Tam giác mở rộng giảm dần — Vàng có thể đạt $4,487 không? Vàng đã thành công phá vỡ phía trên đường xu hướng của Mô hình Tam giác mở rộng giảm dần và hiện đang giao dịch trên mô hình, làm tăng xác suất cho một đợt tăng giá khác. Phân tích kỹ thuật Sự phá vỡ cho thấy áp lực giảm có thể đang suy yếu và người mua đang cố gắng giành lại quyền kiểm soát. Tuy nhiên, mốc giao dịch then chốt $4,400 vẫn là mức xác nhận chính cho động lượng tăng giá mạnh hơn. Tôi kỳ vọng vàng, sau khi thành công vượt lên trên $4,400, sẽ tăng ít nhất hướng đến $4,443. Nếu động lượng tăng giá gia tăng, đợt tăng có thể mở rộng lên $4,487. Lần chốt lời (TP) thứ nhất: $4,443 Lần chốt lời (TP) thứ hai: $4,487 Cắt lỗ (SL): $4,321 (Tệ nhất) Liệu vàng có thể xác nhận việc phá vỡ trên $4,400 và mở rộng đà tăng hướng tới $4,487 không? #Vàng
64
·
--
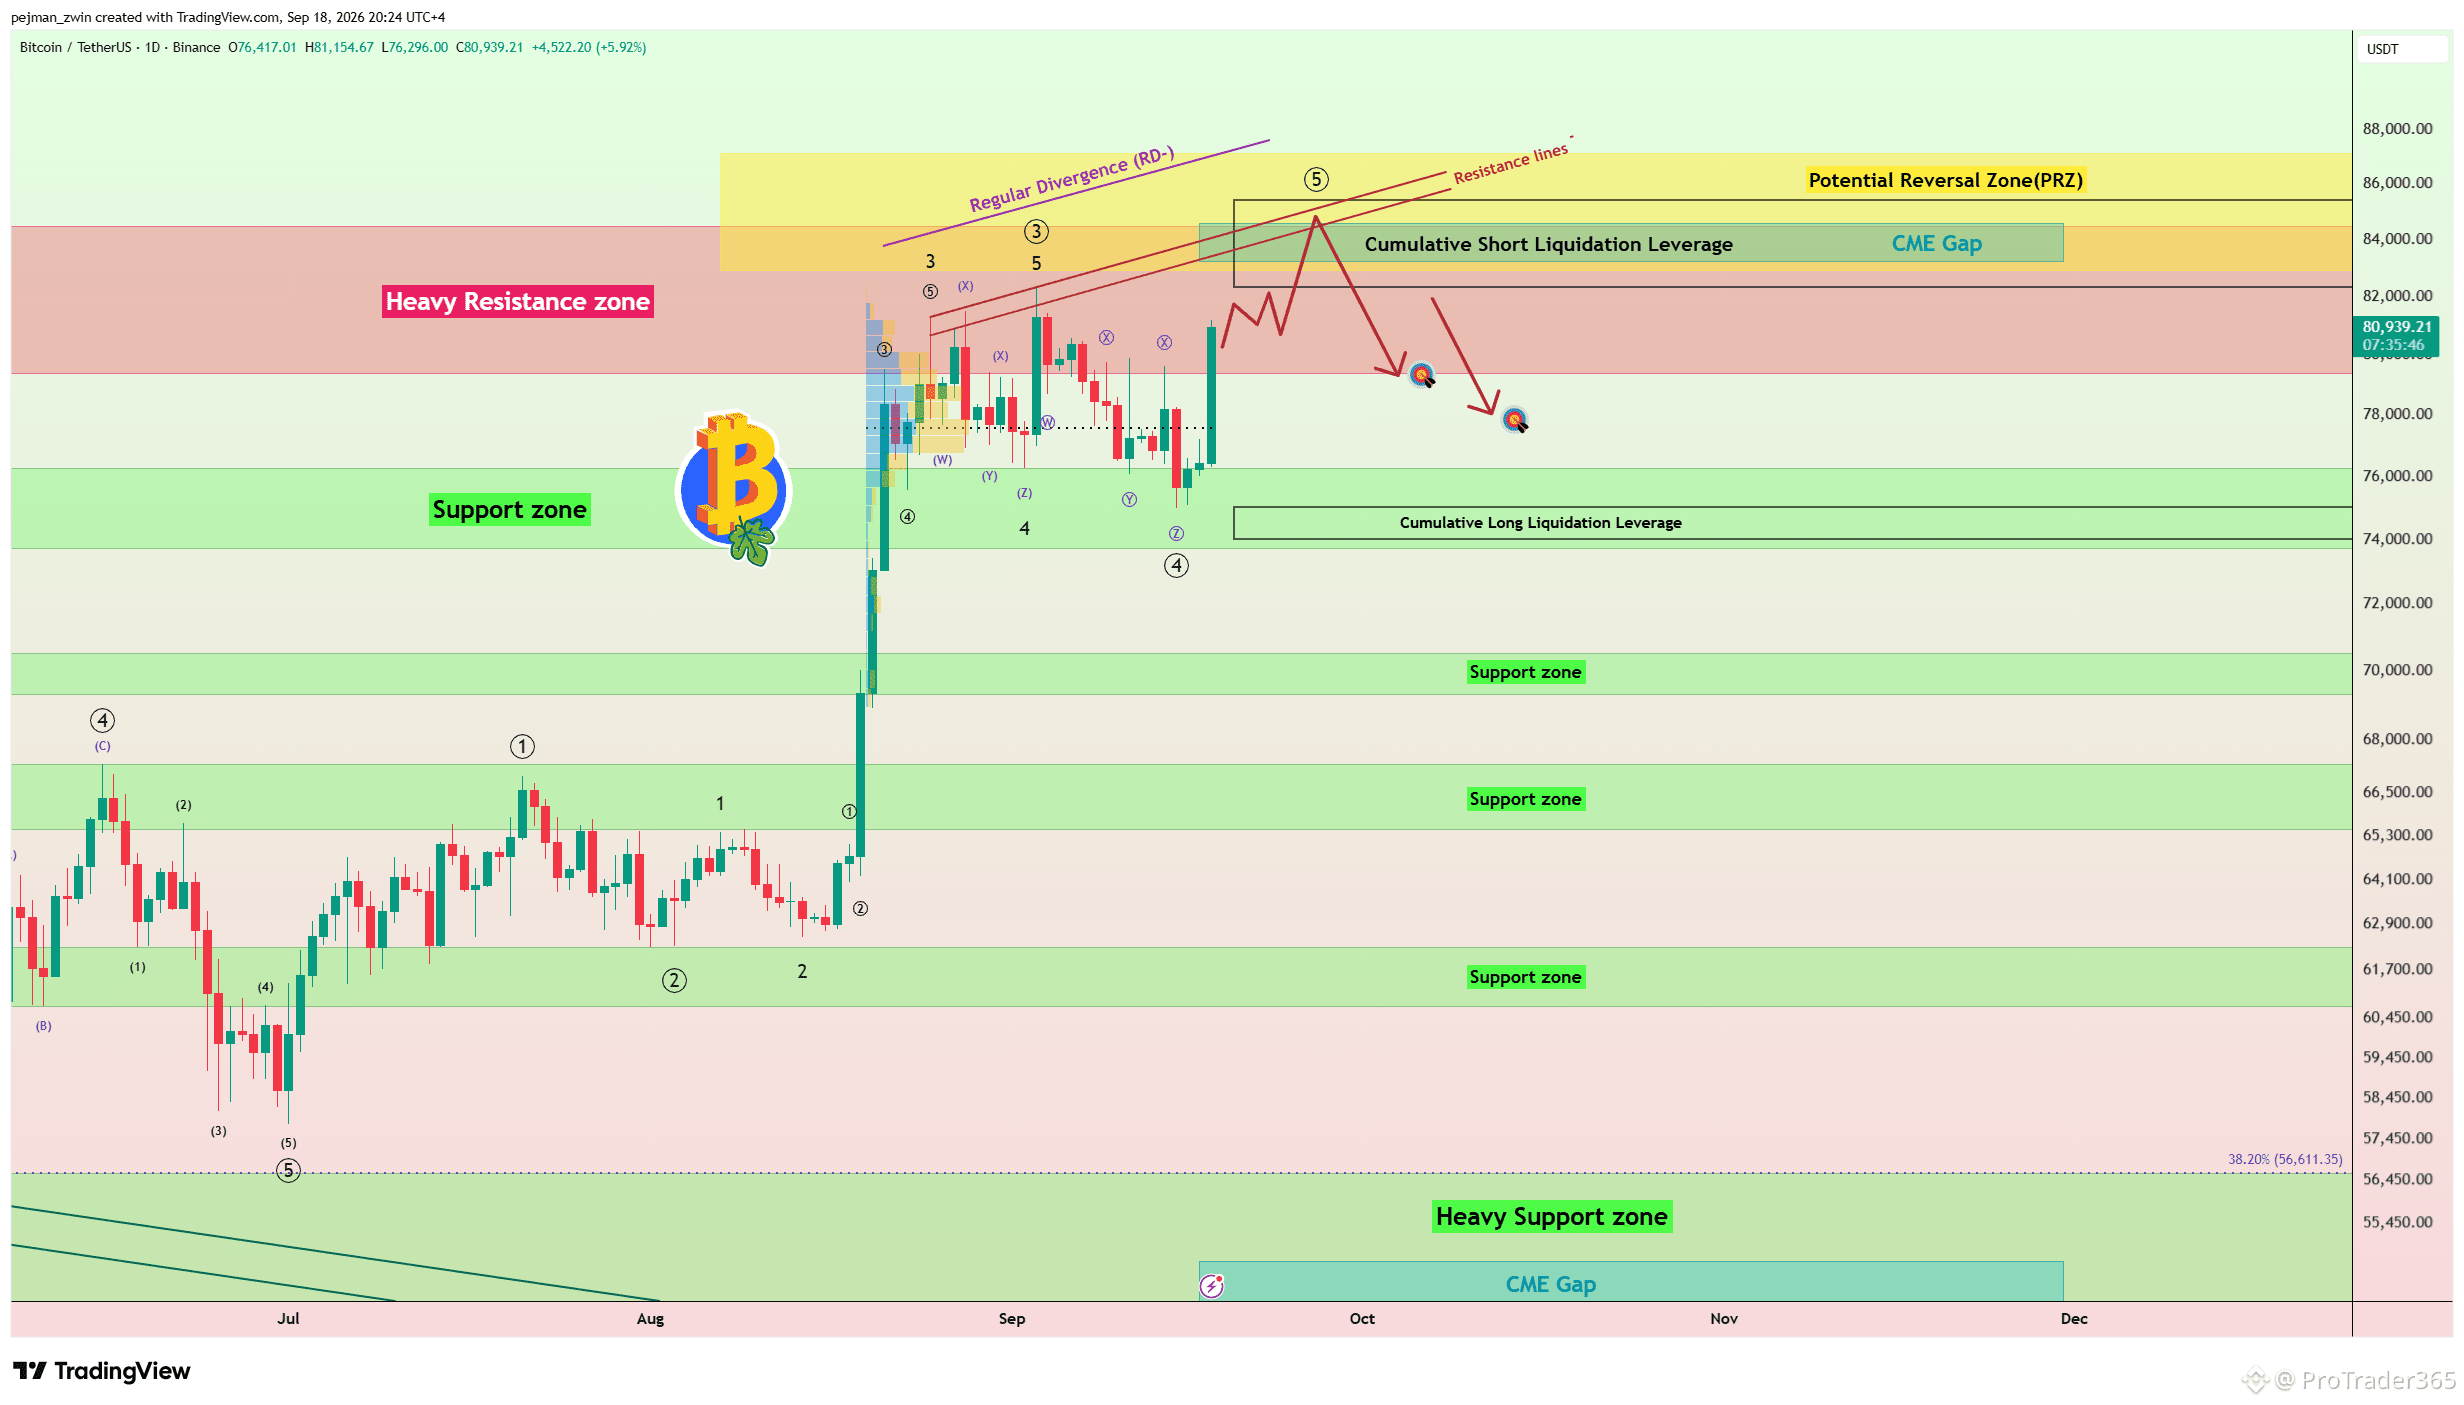
$BTC Bước vào vùng đảo chiều quan trọng — Liệu điều chỉnh có xảy ra tiếp theo? Bitcoin đã tăng hơn 6–7% trong vài giờ qua, nhưng đợt tăng hiện đang đi vào một cấu trúc kháng cự lớn trong khi dòng tiền ETF vẫn diễn biến lẫn lộn và sự không chắc chắn về mặt quy định vẫn kéo dài. Phân tích kỹ thuật Bitcoin đang giao dịch trong Vùng Kháng cự Nặng($84,500-$79,350), gần Vùng Có Khả năng Đảo Chiều(PRZ)[$87,100-$82,850], Đòn bẩy thanh lý Short Tích lũy($85,400-$82,300) và các Đường Kháng cự. Giá cũng có thể lấp đầy khoảng trống CME phía trên($84,560-$83,215). Theo góc nhìn Elliott Wave, Bitcoin dường như đang hoàn tất Sóng 5 chính, trong khi một Phân kỳ âm thường(RD-) được ghi nhận giữa các Đỉnh liên tiếp. Tôi kỳ vọng Bitcoin sẽ đi sâu hơn vào PRZ trước khi một nhịp giảm mới bắt đầu, có thể xảy ra sau một Bull Trap phía trên Vùng Kháng cự Nặng. Lần chốt lời thứ nhất(TP): $79,000 Lần chốt lời thứ hai(TP): $77,700 Cắt lỗ(SL): $87,300(Mức tệ nhất) Mức nào Bitcoin sẽ chạm trước: $77,700 hay $87,300?
$BTC Bước vào vùng đảo chiều quan trọng — Liệu điều chỉnh có xảy ra tiếp theo? Bitcoin đã tăng hơn 6–7% trong vài giờ qua, nhưng đợt tăng hiện đang đi vào một cấu trúc kháng cự lớn trong khi dòng tiền ETF vẫn diễn biến lẫn lộn và sự không chắc chắn về mặt quy định vẫn kéo dài. Phân tích kỹ thuật Bitcoin đang giao dịch trong Vùng Kháng cự Nặng($84,500-$79,350), gần Vùng Có Khả năng Đảo Chiều(PRZ)[$87,100-$82,850], Đòn bẩy thanh lý Short Tích lũy($85,400-$82,300) và các Đường Kháng cự. Giá cũng có thể lấp đầy khoảng trống CME phía trên($84,560-$83,215). Theo góc nhìn Elliott Wave, Bitcoin dường như đang hoàn tất Sóng 5 chính, trong khi một Phân kỳ âm thường(RD-) được ghi nhận giữa các Đỉnh liên tiếp. Tôi kỳ vọng Bitcoin sẽ đi sâu hơn vào PRZ trước khi một nhịp giảm mới bắt đầu, có thể xảy ra sau một Bull Trap phía trên Vùng Kháng cự Nặng. Lần chốt lời thứ nhất(TP): $79,000 Lần chốt lời thứ hai(TP): $77,700 Cắt lỗ(SL): $87,300(Mức tệ nhất) Mức nào Bitcoin sẽ chạm trước: $77,700 hay $87,300?
42
·
--
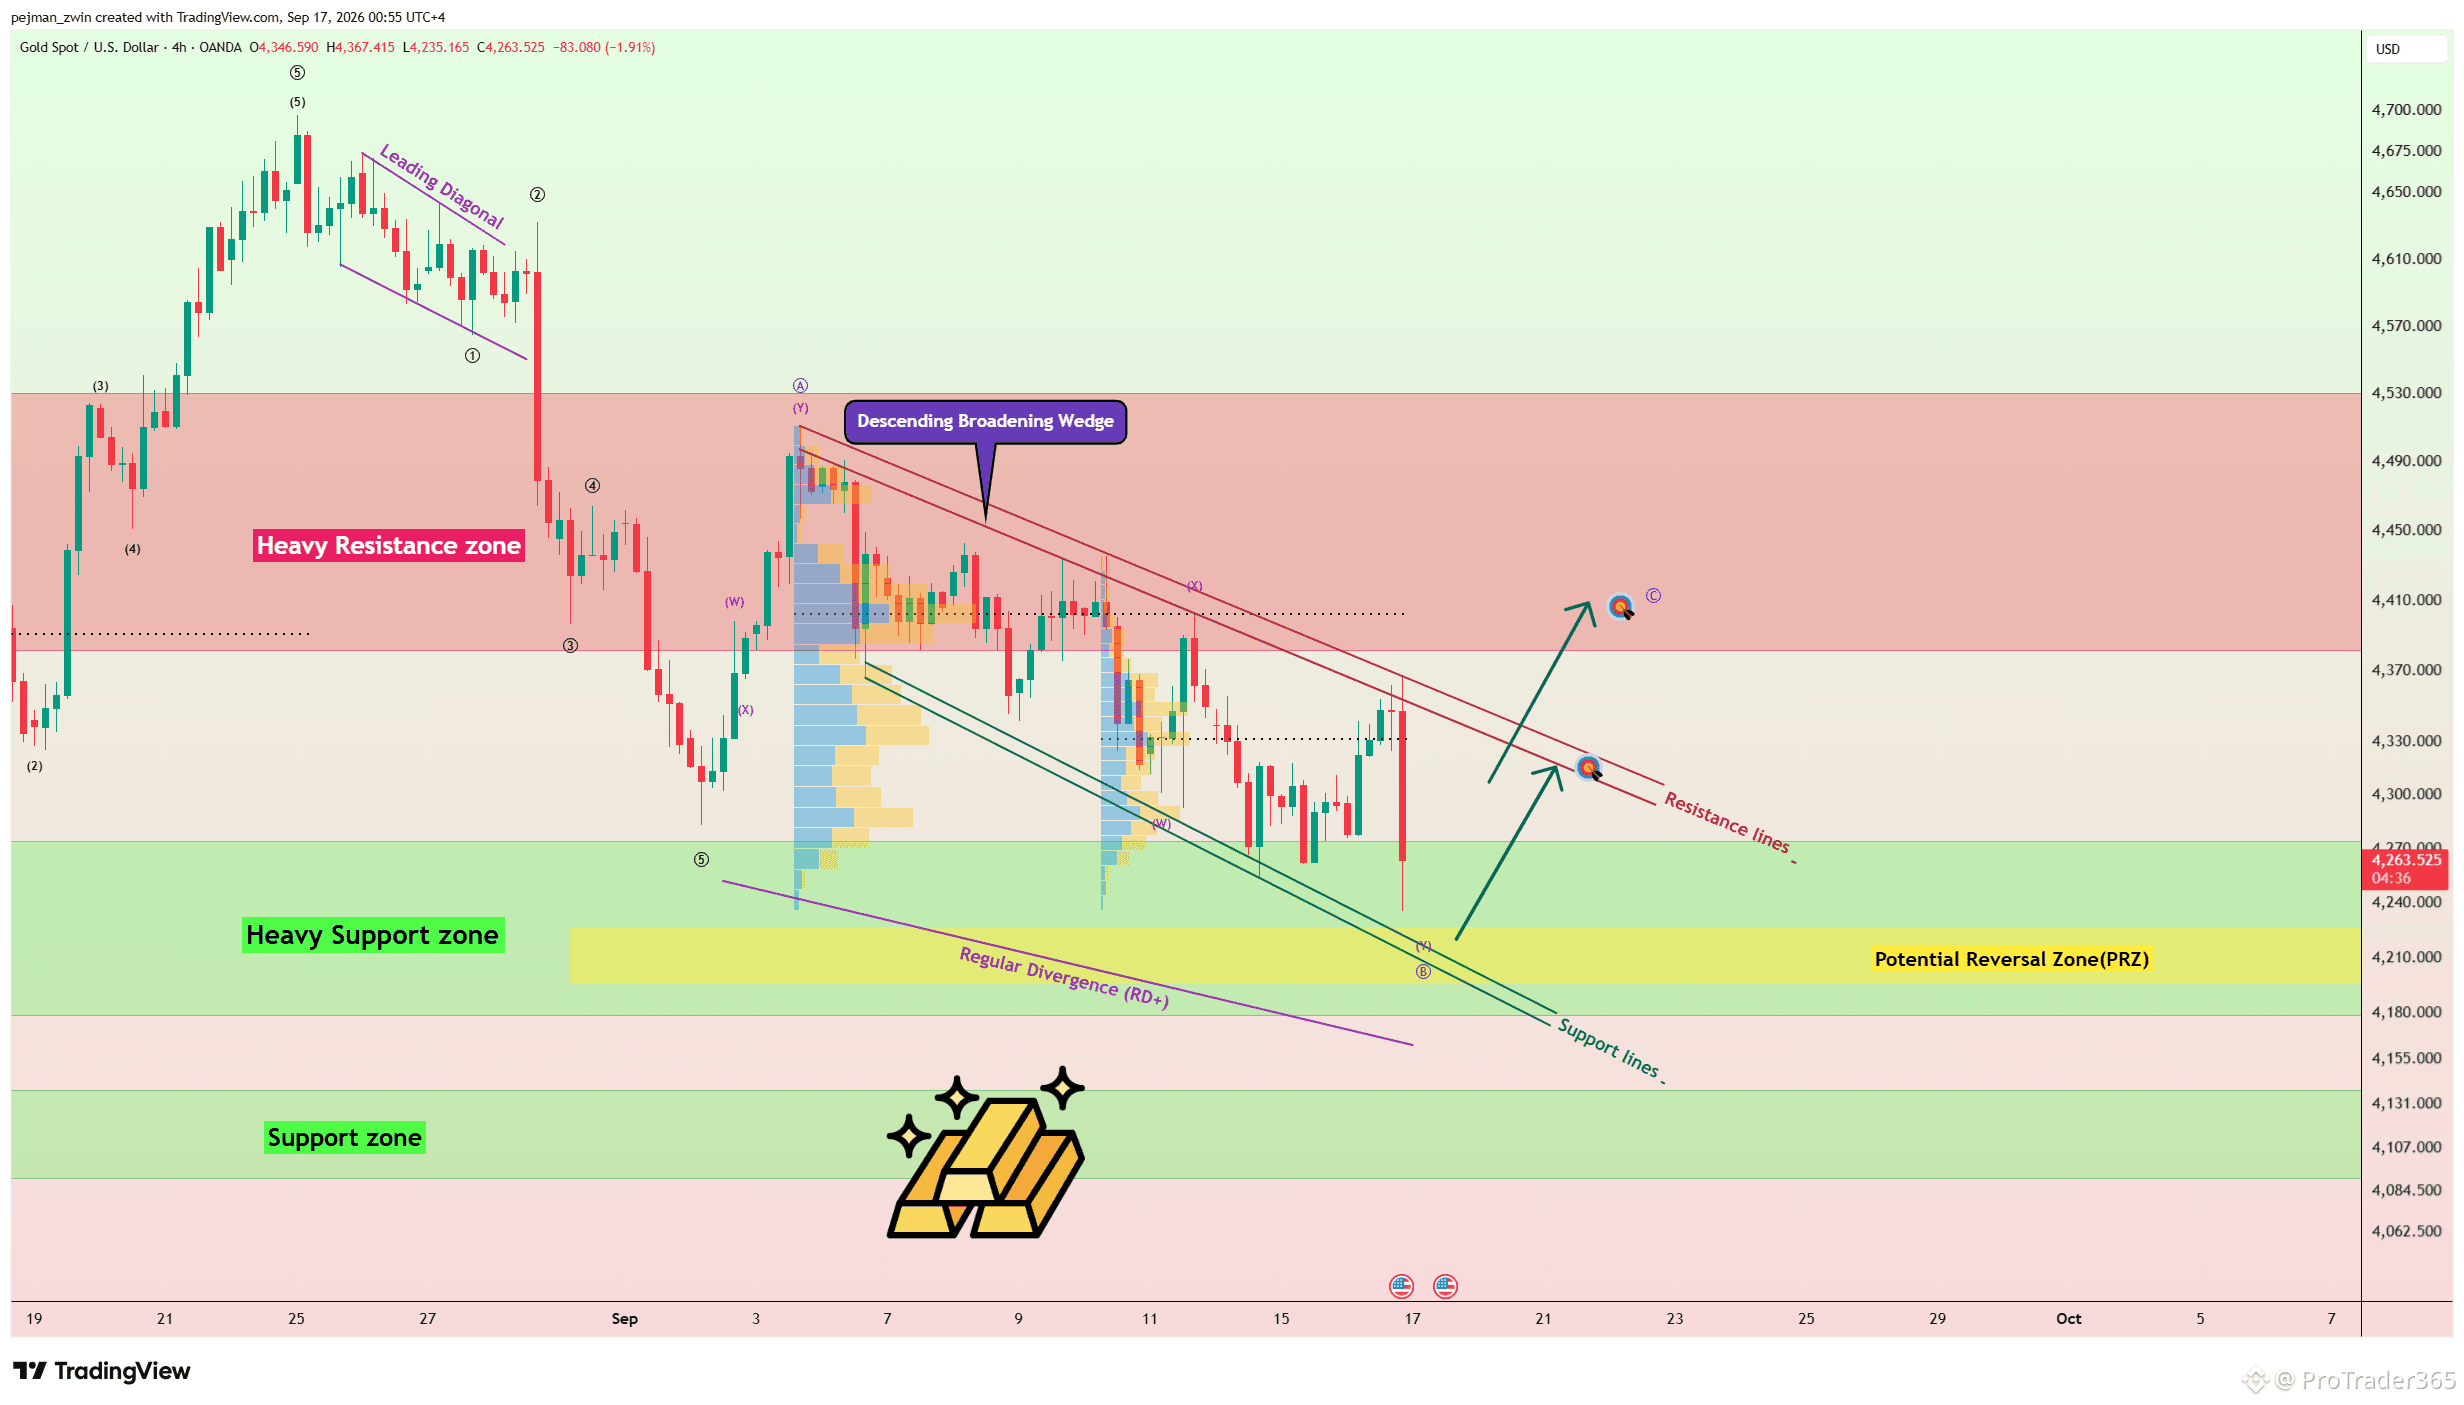
$XAUt Kiểm tra một PRZ lớn — Liệu Vàng có thể đảo chiều từ vùng hỗ trợ mạnh không? Vàng đã giảm với động lượng giảm giá mạnh sau quyết định về Tỷ lệ Quỹ Liên bang và các nhận xét từ Kevin Warsh, nhưng hiện giá đã chạm tới Vùng Hỗ trợ Mạnh, các Đường Hỗ trợ và Vùng Đảo Chiều Tiềm Năng lớn (PRZ)[$4,226-$4,195]. Phân tích Kỹ thuật Theo góc nhìn Elliott Wave, đợt giảm trong 13 ngày qua có vẻ mang tính điều chỉnh. Vàng cũng đã hình thành Mẫu Mở Rộng Giảm Dần (Descending Broadening Wedge Pattern), đồng thời một Phân kỳ Dương Thường (RD+) đang hiện rõ giữa hai Đỉnh/Đáy Liền kề Quan trọng (Major Consecutive Valley Pivots). Tôi kỳ vọng vàng sẽ bắt đầu tăng trở lại từ PRZ và các Đường Hỗ trợ hướng tới $4,317. Nếu động lượng tăng giá gia tăng và giá vượt lên trên các Đường Kháng cự, đà phục hồi có thể kéo dài tới $4,391. Cắt lỗ (SL): $4,170 Liệu vàng có giữ vững cấu trúc hỗ trợ này và khởi động đợt phục hồi tăng giá tiếp theo không? #Gold
$XAUt Kiểm tra một PRZ lớn — Liệu Vàng có thể đảo chiều từ vùng hỗ trợ mạnh không? Vàng đã giảm với động lượng giảm giá mạnh sau quyết định về Tỷ lệ Quỹ Liên bang và các nhận xét từ Kevin Warsh, nhưng hiện giá đã chạm tới Vùng Hỗ trợ Mạnh, các Đường Hỗ trợ và Vùng Đảo Chiều Tiềm Năng lớn (PRZ)[$4,226-$4,195]. Phân tích Kỹ thuật Theo góc nhìn Elliott Wave, đợt giảm trong 13 ngày qua có vẻ mang tính điều chỉnh. Vàng cũng đã hình thành Mẫu Mở Rộng Giảm Dần (Descending Broadening Wedge Pattern), đồng thời một Phân kỳ Dương Thường (RD+) đang hiện rõ giữa hai Đỉnh/Đáy Liền kề Quan trọng (Major Consecutive Valley Pivots). Tôi kỳ vọng vàng sẽ bắt đầu tăng trở lại từ PRZ và các Đường Hỗ trợ hướng tới $4,317. Nếu động lượng tăng giá gia tăng và giá vượt lên trên các Đường Kháng cự, đà phục hồi có thể kéo dài tới $4,391. Cắt lỗ (SL): $4,170 Liệu vàng có giữ vững cấu trúc hỗ trợ này và khởi động đợt phục hồi tăng giá tiếp theo không? #Gold
40
·
--
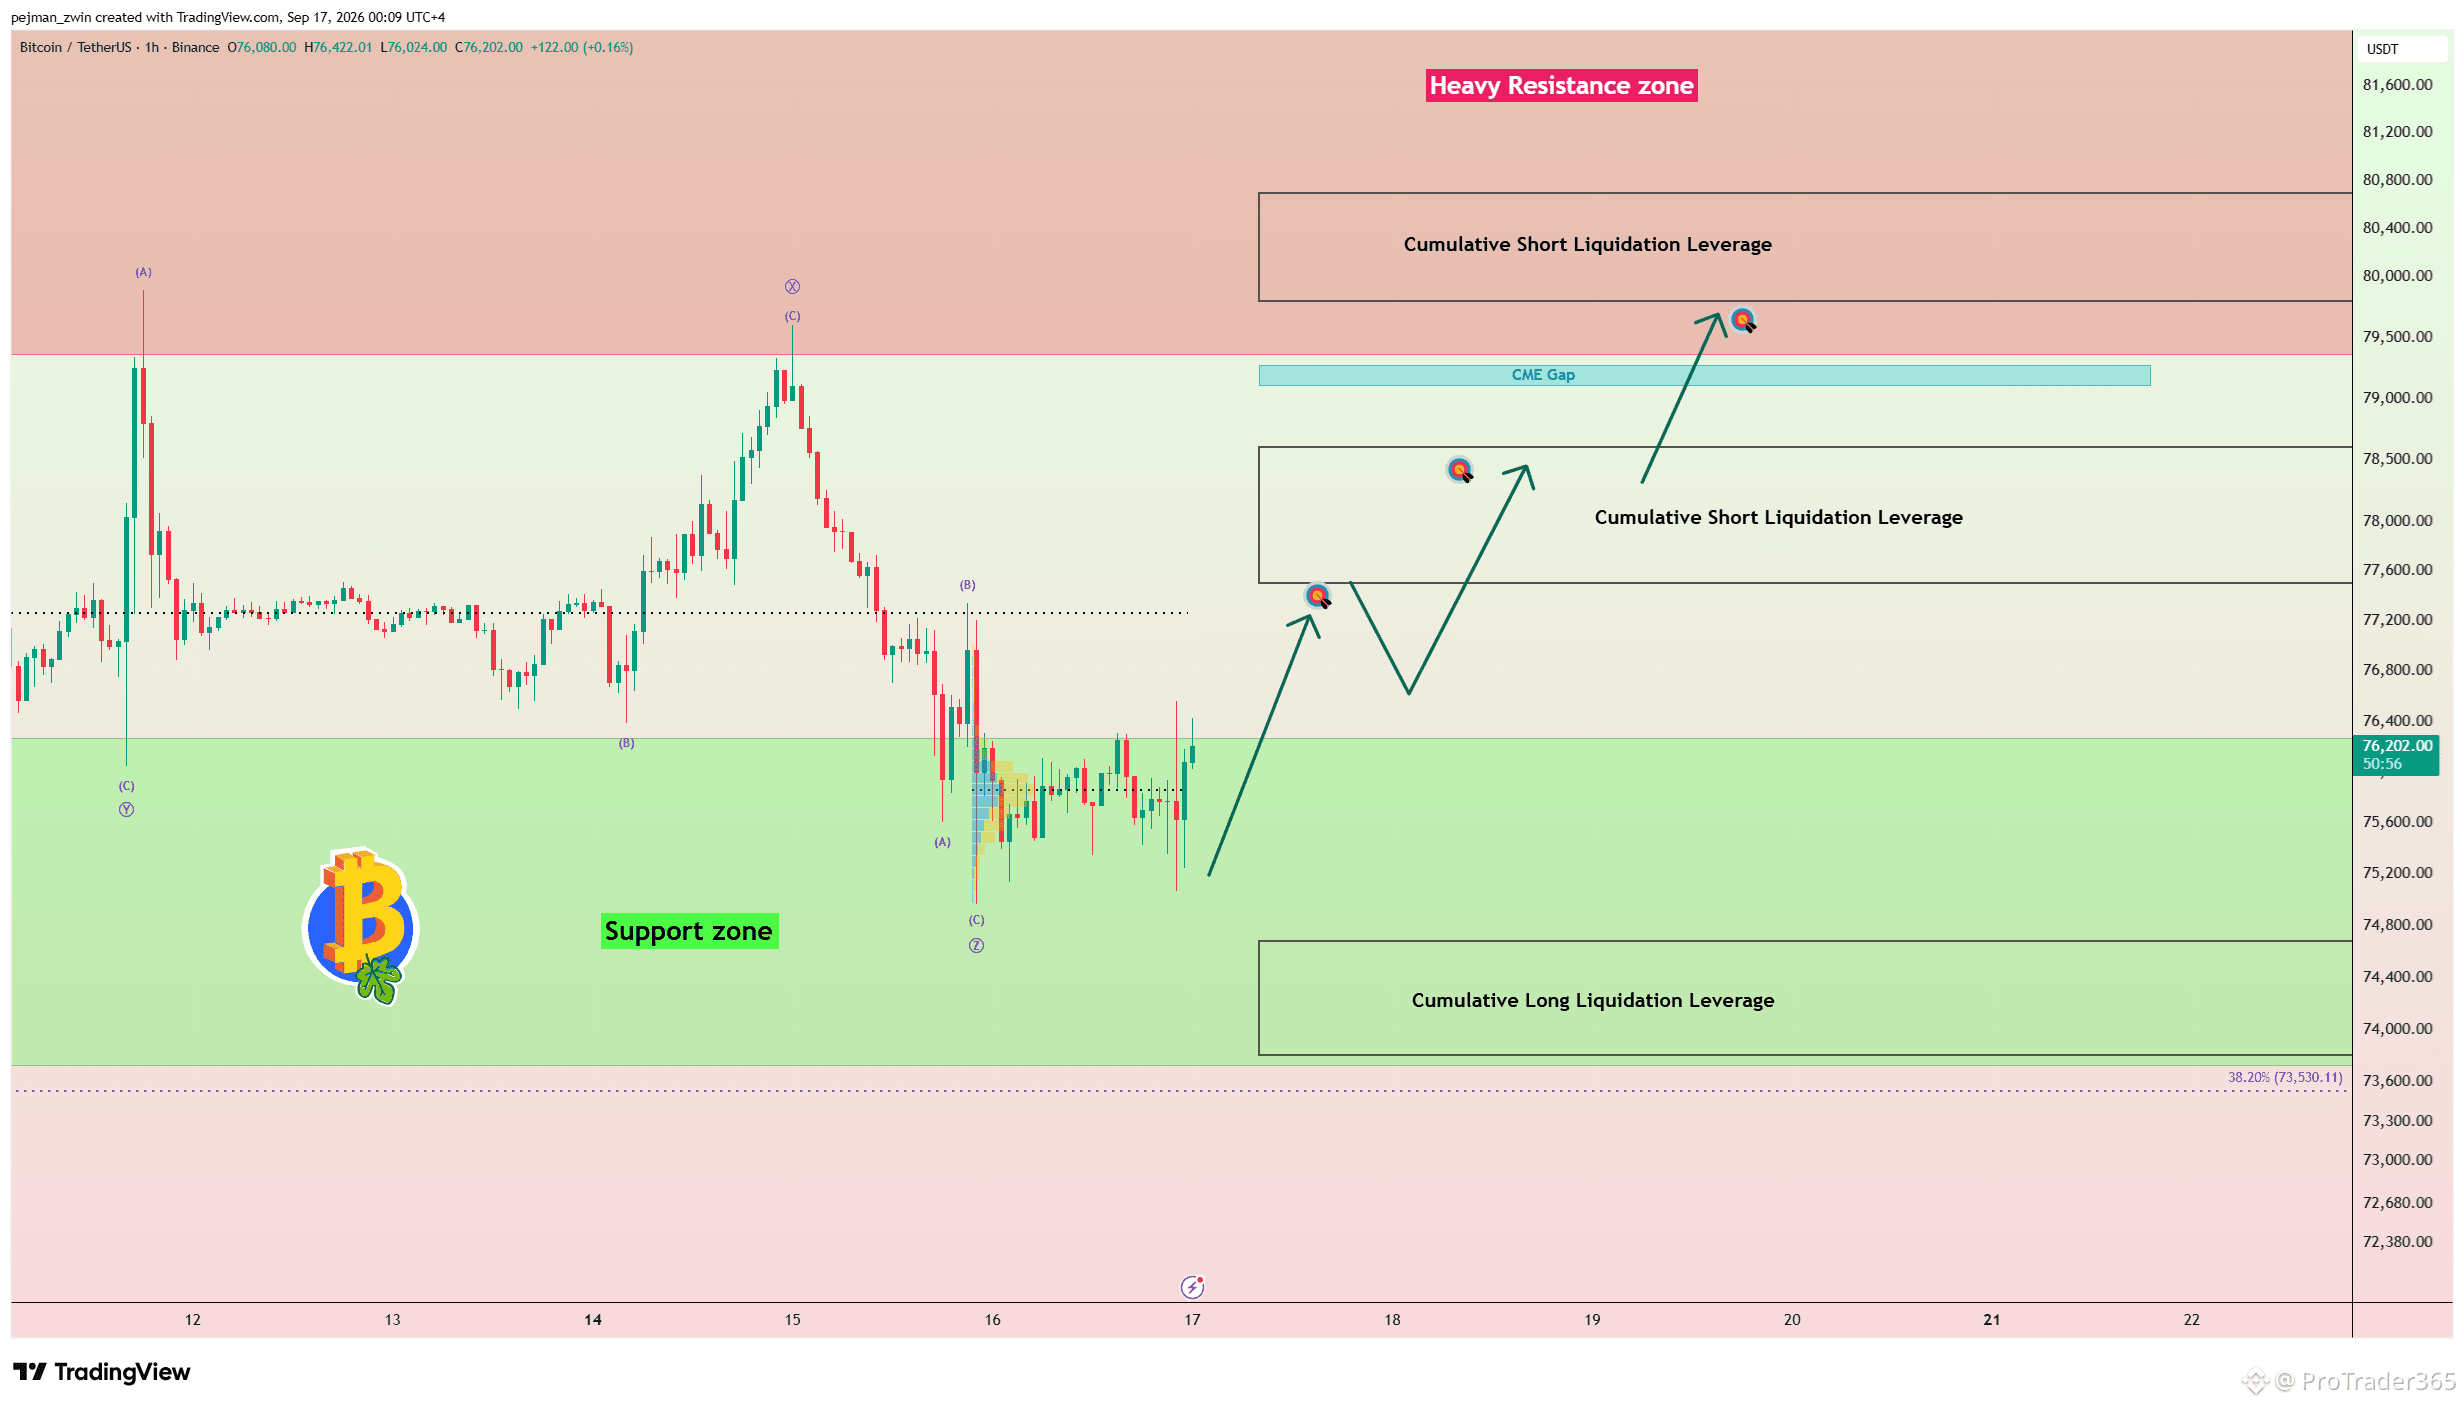
$BTC đang giữ Vùng hỗ trợ — Bitcoin có thể bật lên hướng tới $80,000 không? Bitcoin đã trải qua biến động mạnh sau khi Lãi suất Quỹ Liên bang (Federal Funds Rate) được công bố ở mức 4,00%, tiếp theo là các phát biểu từ Kevin Warsh. Không giống như Vàng và S&P 500, Bitcoin cho đến nay vẫn giữ vững bên trong Vùng hỗ trợ của mình, cho thấy sức mạnh tương đối. Phân tích Kỹ thuật Bitcoin đang giao dịch gần Cumulative Long Liquidation Leverage ($74,680-$73,800). Ngoài ra, một Golden Cross hợp lệ cũng đã hình thành giữa 50_SMA(Daily) và 200_SMA(Daily). Xét theo Góc nhìn Elliott Wave, 12 ngày trước đó có vẻ mang tính điều chỉnh nhiều hơn là giảm giá một cách bộc phát. Tôi kỳ vọng Bitcoin sẽ đi lên. Việc vượt qua mức giao dịch quan trọng $77,280 có thể mở đường hướng tới $78,370 và Cumulative Short Liquidation Leverage ($80,700-$79,800). Cắt lỗ (SL): $73,500 (Tệ nhất) Bitcoin có thể bảo vệ Vùng hỗ trợ và đạt $80,000 vào lần tới không? #BTC Price Analysis# #What is your Bitcoin Price Prediction?#
$BTC đang giữ Vùng hỗ trợ — Bitcoin có thể bật lên hướng tới $80,000 không? Bitcoin đã trải qua biến động mạnh sau khi Lãi suất Quỹ Liên bang (Federal Funds Rate) được công bố ở mức 4,00%, tiếp theo là các phát biểu từ Kevin Warsh. Không giống như Vàng và S&P 500, Bitcoin cho đến nay vẫn giữ vững bên trong Vùng hỗ trợ của mình, cho thấy sức mạnh tương đối. Phân tích Kỹ thuật Bitcoin đang giao dịch gần Cumulative Long Liquidation Leverage ($74,680-$73,800). Ngoài ra, một Golden Cross hợp lệ cũng đã hình thành giữa 50_SMA(Daily) và 200_SMA(Daily). Xét theo Góc nhìn Elliott Wave, 12 ngày trước đó có vẻ mang tính điều chỉnh nhiều hơn là giảm giá một cách bộc phát. Tôi kỳ vọng Bitcoin sẽ đi lên. Việc vượt qua mức giao dịch quan trọng $77,280 có thể mở đường hướng tới $78,370 và Cumulative Short Liquidation Leverage ($80,700-$79,800). Cắt lỗ (SL): $73,500 (Tệ nhất) Bitcoin có thể bảo vệ Vùng hỗ trợ và đạt $80,000 vào lần tới không? #BTC Price Analysis# #What is your Bitcoin Price Prediction?#
53
·
--
$BTC Thể hiện Sức mạnh Tương đối — Bitcoin có thể bảo vệ mốc $75.000 không? Sau quyết định Lãi suất Quỹ Liên bang và các nhận xét của Chủ tịch Fed Warsh, cho đến nay Bitcoin đã cho thấy sức mạnh tương đối so với Vàng và các chỉ số chứng khoán Mỹ, đặc biệt là S&P 500, đồng thời chống lại một phần áp lực bán rộng hơn trên toàn bộ thị trường tài chính. Mức quan trọng hiện tại là $75.000. Khu vực này thậm chí còn quan trọng hơn vì có thể hơn $1 tỷ vị thế đòn bẩy sẽ bị thanh lý quanh $74.860. Nếu Bitcoin tiến vào vùng thanh khoản này, biến động có thể tăng mạnh và có khả năng thúc đẩy nhanh bước đi theo hướng tiếp theo. Chừng nào Bitcoin vẫn duy trì trên $75.000, người mua vẫn còn cơ hội bảo vệ cấu trúc hiện tại. Bạn nghĩ Bitcoin có thể giữ vững $75.000 không, hay vùng thanh khoản $74.860 sẽ được kiểm tra tiếp theo?
$BTC Thể hiện Sức mạnh Tương đối — Bitcoin có thể bảo vệ mốc $75.000 không? Sau quyết định Lãi suất Quỹ Liên bang và các nhận xét của Chủ tịch Fed Warsh, cho đến nay Bitcoin đã cho thấy sức mạnh tương đối so với Vàng và các chỉ số chứng khoán Mỹ, đặc biệt là S&P 500, đồng thời chống lại một phần áp lực bán rộng hơn trên toàn bộ thị trường tài chính. Mức quan trọng hiện tại là $75.000. Khu vực này thậm chí còn quan trọng hơn vì có thể hơn $1 tỷ vị thế đòn bẩy sẽ bị thanh lý quanh $74.860. Nếu Bitcoin tiến vào vùng thanh khoản này, biến động có thể tăng mạnh và có khả năng thúc đẩy nhanh bước đi theo hướng tiếp theo. Chừng nào Bitcoin vẫn duy trì trên $75.000, người mua vẫn còn cơ hội bảo vệ cấu trúc hiện tại. Bạn nghĩ Bitcoin có thể giữ vững $75.000 không, hay vùng thanh khoản $74.860 sẽ được kiểm tra tiếp theo?
62
·
--
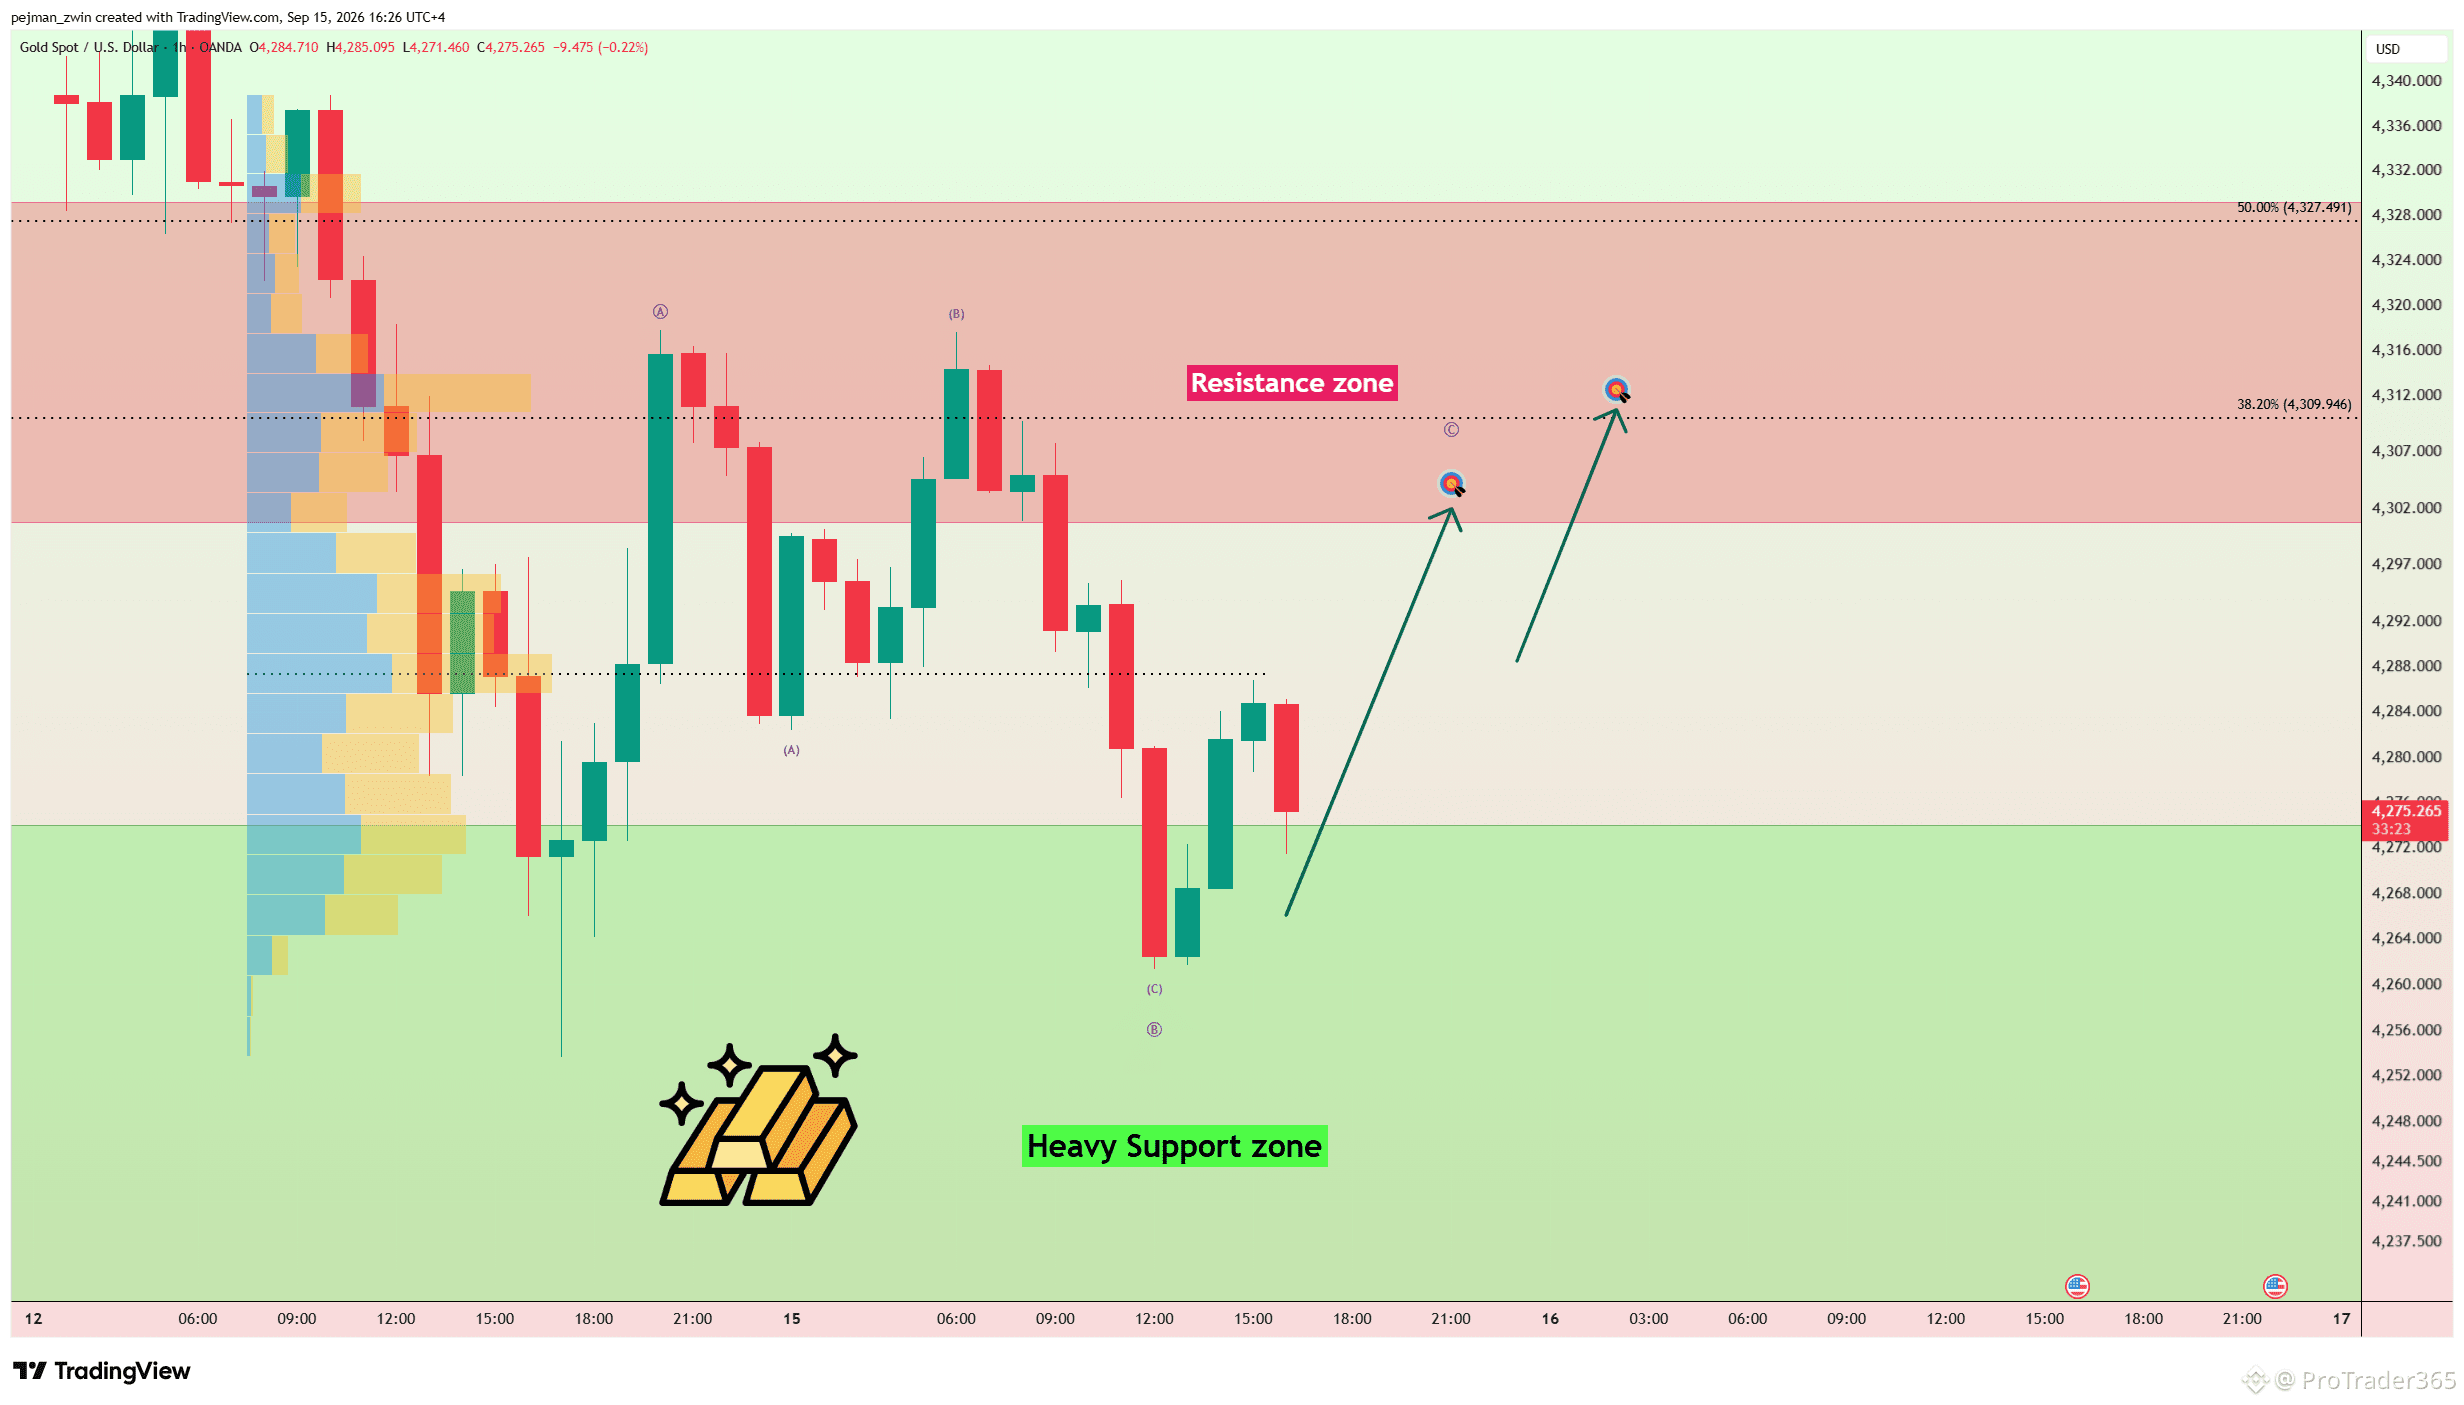
$XAUt Kiểm Tra Hỗ Trợ Lớn — Vàng Có Thể Bắt Đầu Sóng C Cao Hơn? Hiện tại, vàng đang giao dịch gần một Khu Vực Hỗ Trợ quan trọng và đang cố gắng vượt lên trên mức giao dịch quan trọng $4,288. Phản ứng từ khu vực này có thể quyết định liệu người mua có sẵn sàng giành lại quyền kiểm soát trong ngắn hạn hay không. Phân Tích Kỹ Thuật Dưới góc nhìn Elliott Wave, vàng dường như đang phát triển một Zic Zac Correction(A-B-C). Sóng B dường như đã hoàn thành, cho thấy rằng một Sóng C theo hướng tăng (impulsive) có thể bắt đầu ngay bây giờ. Tôi kỳ vọng vàng sẽ đi lên gần $4,306. Nếu động lượng tăng được củng cố, đợt tăng này có thể kéo dài đến $4,316 và có khả năng tiến gần Khu Vực Kháng Cự. Lợi Nhuận Chốt Lời Lần Đầu(TP): $4,306 Lợi Nhuận Chốt Lời Lần Thứ Hai(TP): $4,316 Cắt Lỗ(SL): $4,250 Liệu vàng có thể giữ vững Khu Vực Hỗ Trợ và bắt đầu Sóng C xung lực tiếp theo không? #Gold
$XAUt Kiểm Tra Hỗ Trợ Lớn — Vàng Có Thể Bắt Đầu Sóng C Cao Hơn? Hiện tại, vàng đang giao dịch gần một Khu Vực Hỗ Trợ quan trọng và đang cố gắng vượt lên trên mức giao dịch quan trọng $4,288. Phản ứng từ khu vực này có thể quyết định liệu người mua có sẵn sàng giành lại quyền kiểm soát trong ngắn hạn hay không. Phân Tích Kỹ Thuật Dưới góc nhìn Elliott Wave, vàng dường như đang phát triển một Zic Zac Correction(A-B-C). Sóng B dường như đã hoàn thành, cho thấy rằng một Sóng C theo hướng tăng (impulsive) có thể bắt đầu ngay bây giờ. Tôi kỳ vọng vàng sẽ đi lên gần $4,306. Nếu động lượng tăng được củng cố, đợt tăng này có thể kéo dài đến $4,316 và có khả năng tiến gần Khu Vực Kháng Cự. Lợi Nhuận Chốt Lời Lần Đầu(TP): $4,306 Lợi Nhuận Chốt Lời Lần Thứ Hai(TP): $4,316 Cắt Lỗ(SL): $4,250 Liệu vàng có thể giữ vững Khu Vực Hỗ Trợ và bắt đầu Sóng C xung lực tiếp theo không? #Gold
65
·
--
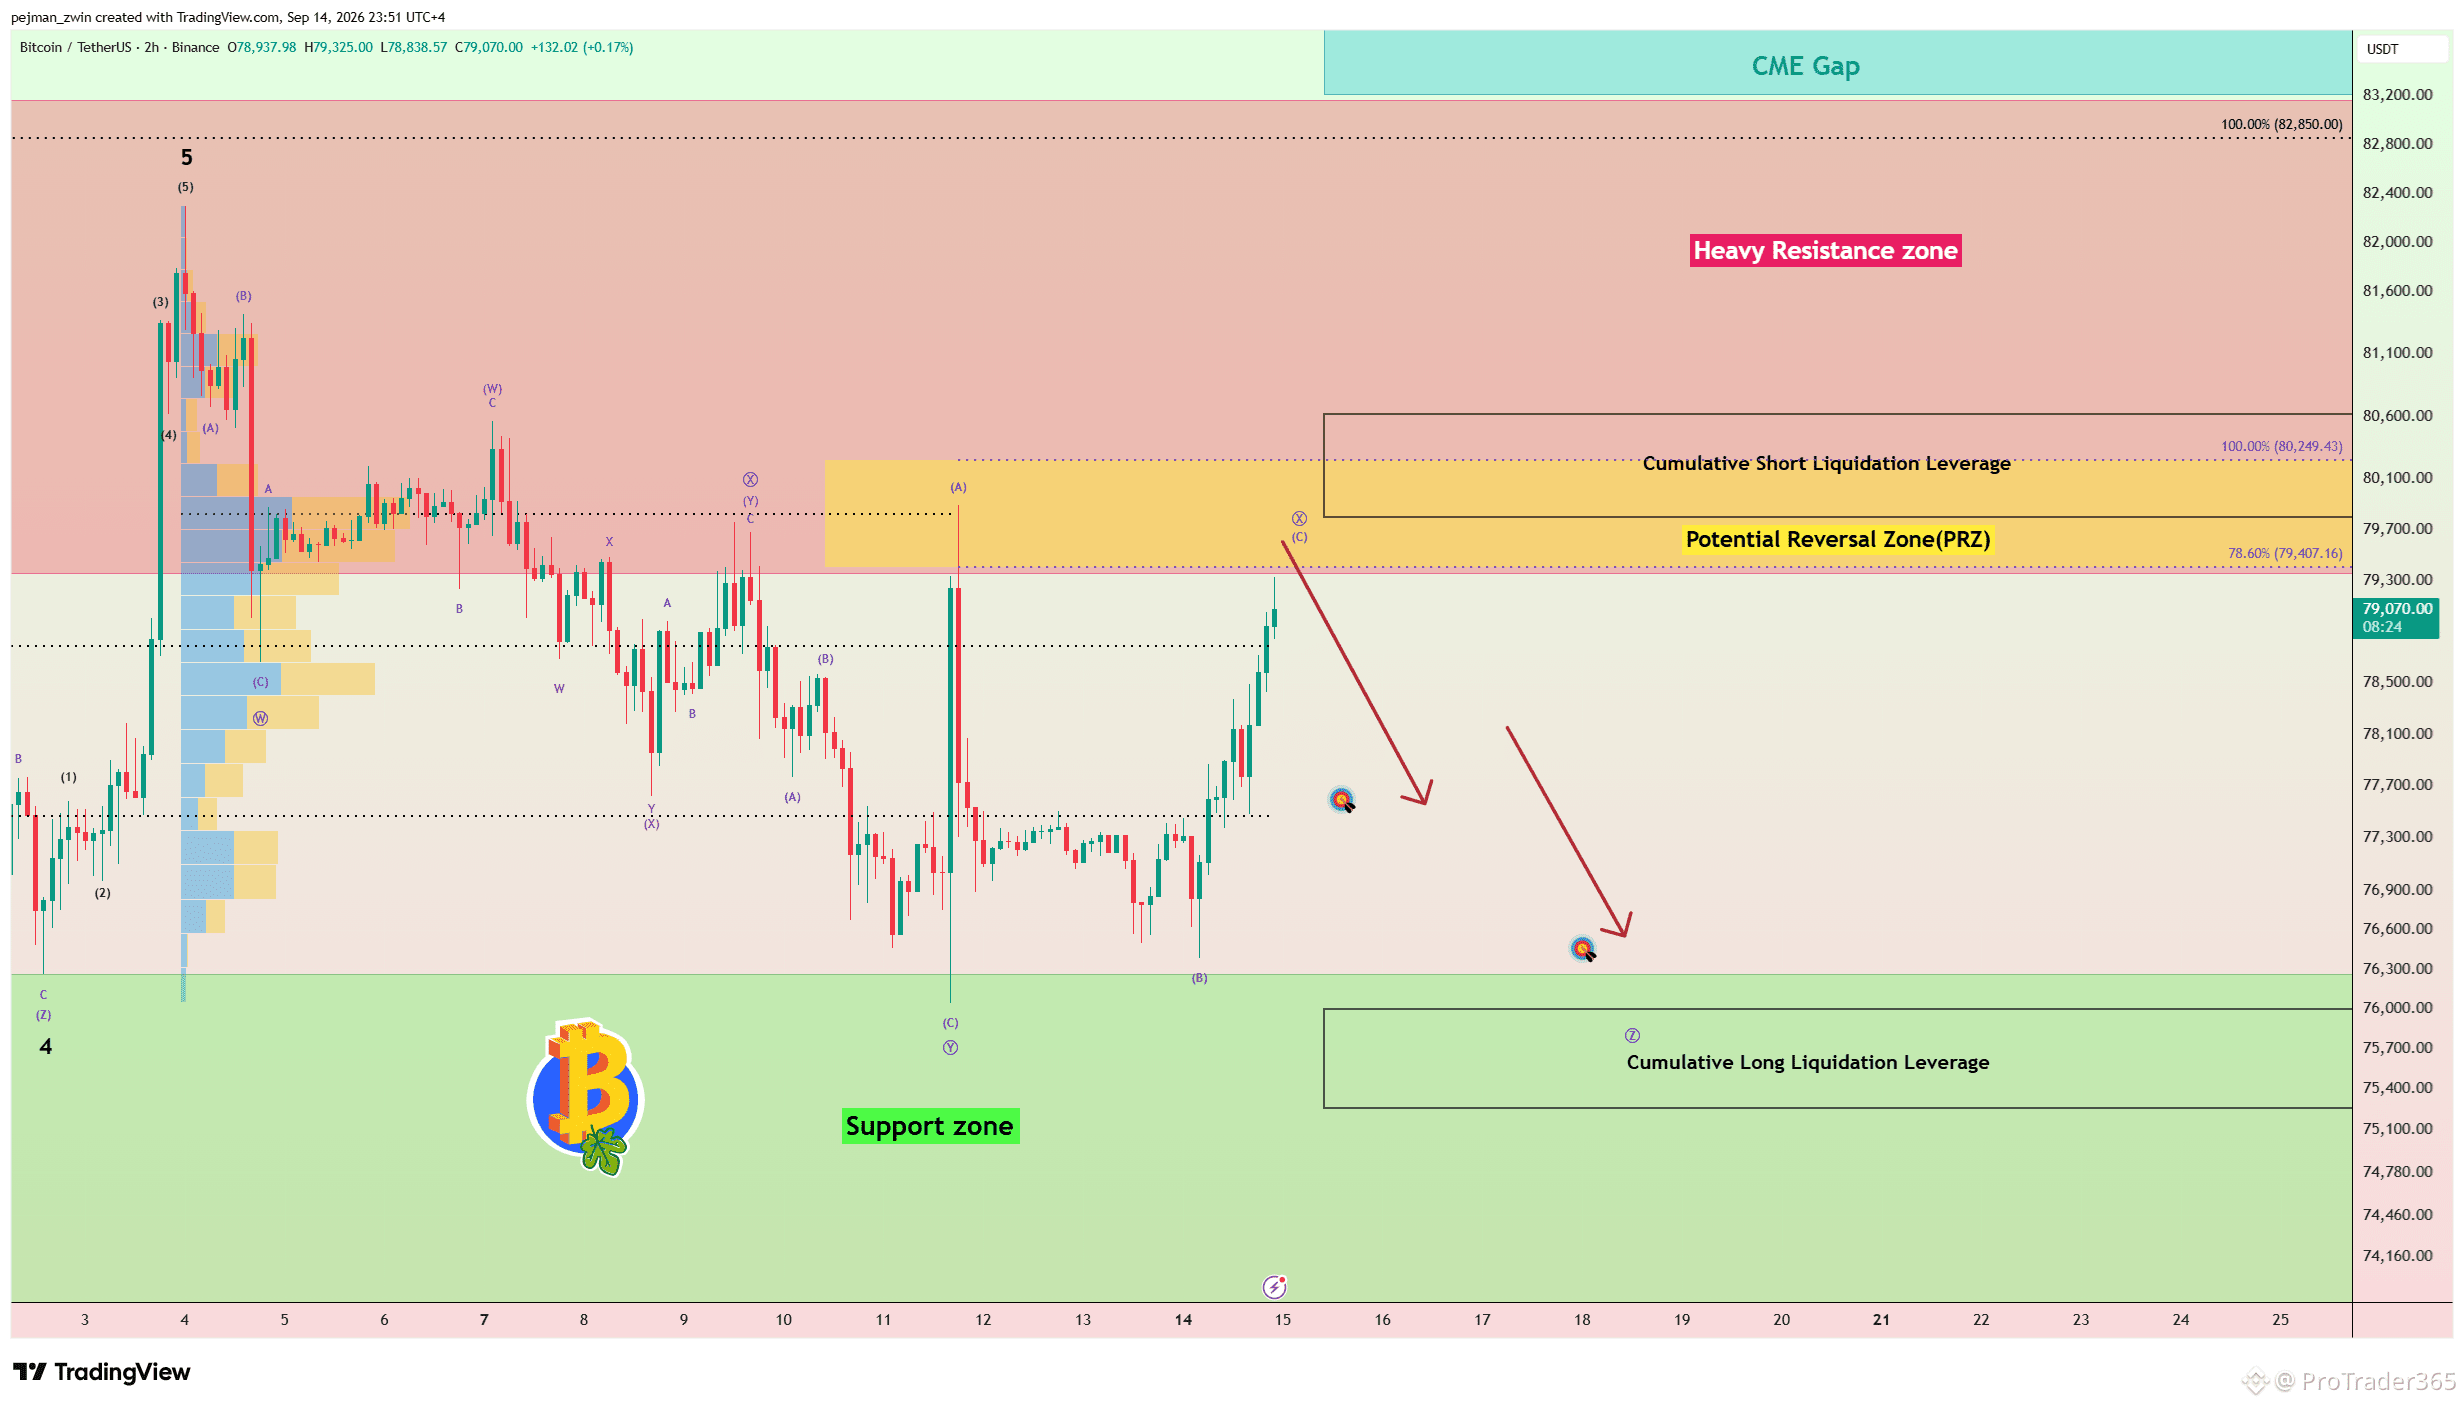
$BTC Kiểm Tra Tụ Thanh Khoản Lớn — Liệu Một Đợt Điều Chỉnh Khác Đang Bắt Đầu? Bitcoin đã tăng cao hơn sau tweet của Trump hỗ trợ đà phục hồi của cổ phiếu Mỹ, nhưng đợt tăng này chưa đi kèm với khối lượng giao dịch đặc biệt mạnh. BTC hiện đang giao dịch gần Vùng Đảo Chiều Tiềm Năng(PRZ)[$80,250-$79,400], Đòn Bẩy Thanh Lý Short Lũy Kế($80,620-$79,800) và mốc giao dịch quan trọng $79,800. Xét theo góc nhìn Elliott Wave, Bitcoin vẫn có thể đang phát triển một Cấu Trúc Điều Chỉnh Triple Three (W-X-Y-X-Z). Tôi kỳ vọng Bitcoin sẽ bắt đầu giảm từ vùng tụ kỹ thuật này về $77,800. Nếu động lượng giảm giá gia tăng, đợt điều chỉnh có thể mở rộng về $76,600. Dữ liệu thanh lý cũng cho thấy khoảng $909M lệnh short đang gặp rủi ro trên $80,600, khiến khu vực này đặc biệt quan trọng. Cắt Lỗ(SL): $80,890 Bitcoin có thể vượt lên trên $80,000 hay PRZ sẽ kích hoạt một đợt điều chỉnh trước?
$BTC Kiểm Tra Tụ Thanh Khoản Lớn — Liệu Một Đợt Điều Chỉnh Khác Đang Bắt Đầu? Bitcoin đã tăng cao hơn sau tweet của Trump hỗ trợ đà phục hồi của cổ phiếu Mỹ, nhưng đợt tăng này chưa đi kèm với khối lượng giao dịch đặc biệt mạnh. BTC hiện đang giao dịch gần Vùng Đảo Chiều Tiềm Năng(PRZ)[$80,250-$79,400], Đòn Bẩy Thanh Lý Short Lũy Kế($80,620-$79,800) và mốc giao dịch quan trọng $79,800. Xét theo góc nhìn Elliott Wave, Bitcoin vẫn có thể đang phát triển một Cấu Trúc Điều Chỉnh Triple Three (W-X-Y-X-Z). Tôi kỳ vọng Bitcoin sẽ bắt đầu giảm từ vùng tụ kỹ thuật này về $77,800. Nếu động lượng giảm giá gia tăng, đợt điều chỉnh có thể mở rộng về $76,600. Dữ liệu thanh lý cũng cho thấy khoảng $909M lệnh short đang gặp rủi ro trên $80,600, khiến khu vực này đặc biệt quan trọng. Cắt Lỗ(SL): $80,890 Bitcoin có thể vượt lên trên $80,000 hay PRZ sẽ kích hoạt một đợt điều chỉnh trước?
69
·
--
$XAUt Ba Ba Điều Chỉnh Gần Hoàn Thành — Vàng Có Thể Phục Hồi Hướng Tới $4,400? Vàng đã trong xu hướng giảm trong bảy ngày qua, nhưng miễn là giá vẫn ở trên $4,280, thì người mua vẫn có vẻ mạnh hơn người bán trong ngắn hạn. Phân Tích Kỹ Thuật Vàng đang giao dịch gần Khu Vực Đảo Chiều Tiềm Năng (PRZ)[$4,313-$4,282] và đường xu hướng giảm tiềm năng của một Kênh Đi Xuống. Xét theo Góc Nhìn Sóng Elliott, vàng dường như đã hình thành Mẫu Điều Chỉnh Triple Three (W-X-Y-X-Z), và có thể hoàn tất Sóng Chính B. Tôi kỳ vọng vàng sẽ bắt đầu một đợt tăng từ PRZ hiện tại hướng tới $4,366. Nếu đà tăng gia tăng, đợt phục hồi có thể kéo dài đến $4,395 và Khu Vực Đảo Chiều Tiềm Năng (PRZ) phía trên[$4,401-$4,373]. Cắt Lỗ(SL): $4,281 Vàng có thể giữ vững PRZ hiện tại và bắt đầu đợt tăng tiếp theo hướng tới $4,400 không? #Gold
$XAUt Ba Ba Điều Chỉnh Gần Hoàn Thành — Vàng Có Thể Phục Hồi Hướng Tới $4,400? Vàng đã trong xu hướng giảm trong bảy ngày qua, nhưng miễn là giá vẫn ở trên $4,280, thì người mua vẫn có vẻ mạnh hơn người bán trong ngắn hạn. Phân Tích Kỹ Thuật Vàng đang giao dịch gần Khu Vực Đảo Chiều Tiềm Năng (PRZ)[$4,313-$4,282] và đường xu hướng giảm tiềm năng của một Kênh Đi Xuống. Xét theo Góc Nhìn Sóng Elliott, vàng dường như đã hình thành Mẫu Điều Chỉnh Triple Three (W-X-Y-X-Z), và có thể hoàn tất Sóng Chính B. Tôi kỳ vọng vàng sẽ bắt đầu một đợt tăng từ PRZ hiện tại hướng tới $4,366. Nếu đà tăng gia tăng, đợt phục hồi có thể kéo dài đến $4,395 và Khu Vực Đảo Chiều Tiềm Năng (PRZ) phía trên[$4,401-$4,373]. Cắt Lỗ(SL): $4,281 Vàng có thể giữ vững PRZ hiện tại và bắt đầu đợt tăng tiếp theo hướng tới $4,400 không? #Gold

32
·
--
$USDT Tỷ trọng thống trị của USDT đang hướng tới mức 7,40% — Liệu còn áp lực phía trước cho crypto? Chỉ số Tỷ trọng thống trị của USDT (USDT.D) đang cố gắng vượt lên trên mốc giao dịch quan trọng 7,08% và Vùng Kháng cự lân cận. Một đợt bứt phá được xác nhận có thể làm gia tăng áp lực lên Bitcoin, Ethereum và các altcoin. Lợi suất Trái phiếu Kho bạc Mỹ kỳ hạn 10 năm (US10Y) cao hơn và Chỉ số Đô la Mỹ (DXY) cũng có thể góp phần hỗ trợ thêm cho đà tăng của USDT.D% khi điều kiện tài chính thắt chặt hơn. Phân tích kỹ thuật Theo góc nhìn Sóng Elliott, USDT.D% dường như đang hình thành Sóng 4 chính của nó. Tôi kỳ vọng nhịp này có thể tiếp tục tiến tới 7,40%, trùng khớp với mức Fibonacci 38,2%. Nếu Sóng 4 hoàn tất quanh 7,40%, thì USDT.D% sau đó có thể bắt đầu một nhịp giảm mới, tạo môi trường tích cực hơn cho toàn bộ thị trường tiền mã hóa. Liệu USDT.D% có thể vượt 7,08% và chạm 7,40% trước khi crypto bắt đầu nhịp hồi phục lớn tiếp theo? #Tether
$USDT Tỷ trọng thống trị của USDT đang hướng tới mức 7,40% — Liệu còn áp lực phía trước cho crypto? Chỉ số Tỷ trọng thống trị của USDT (USDT.D) đang cố gắng vượt lên trên mốc giao dịch quan trọng 7,08% và Vùng Kháng cự lân cận. Một đợt bứt phá được xác nhận có thể làm gia tăng áp lực lên Bitcoin, Ethereum và các altcoin. Lợi suất Trái phiếu Kho bạc Mỹ kỳ hạn 10 năm (US10Y) cao hơn và Chỉ số Đô la Mỹ (DXY) cũng có thể góp phần hỗ trợ thêm cho đà tăng của USDT.D% khi điều kiện tài chính thắt chặt hơn. Phân tích kỹ thuật Theo góc nhìn Sóng Elliott, USDT.D% dường như đang hình thành Sóng 4 chính của nó. Tôi kỳ vọng nhịp này có thể tiếp tục tiến tới 7,40%, trùng khớp với mức Fibonacci 38,2%. Nếu Sóng 4 hoàn tất quanh 7,40%, thì USDT.D% sau đó có thể bắt đầu một nhịp giảm mới, tạo môi trường tích cực hơn cho toàn bộ thị trường tiền mã hóa. Liệu USDT.D% có thể vượt 7,08% và chạm 7,40% trước khi crypto bắt đầu nhịp hồi phục lớn tiếp theo? #Tether

41
Đăng nhập để khám phá thêm nội dung
Tham gia cùng người dùng tiền mã hóa toàn cầu trên Binance Square
⚡️ Nhận thông tin mới nhất và hữu ích về tiền mã hóa.
💬 Được tin cậy bởi sàn giao dịch tiền mã hóa lớn nhất thế giới.
👍 Khám phá những thông tin chuyên sâu thực tế từ những nhà sáng tạo đã xác minh.
Email / Số điện thoại