

burakkesmeci
9 Bài đăng

burakkesmeci
Báo cáo
Chặn người dùng
💹 Verified Analist at CryptoQuant / KMQuant ❝❞ CoinDesk / Cointelegraph / Fortune / The Block
0 Đang theo dõi
0 Người theo dõi
0 Đã thích
Bài đăng
·
--
Tại sao mốc $2,000 lại là một điểm hội tụ cho $ETH ?
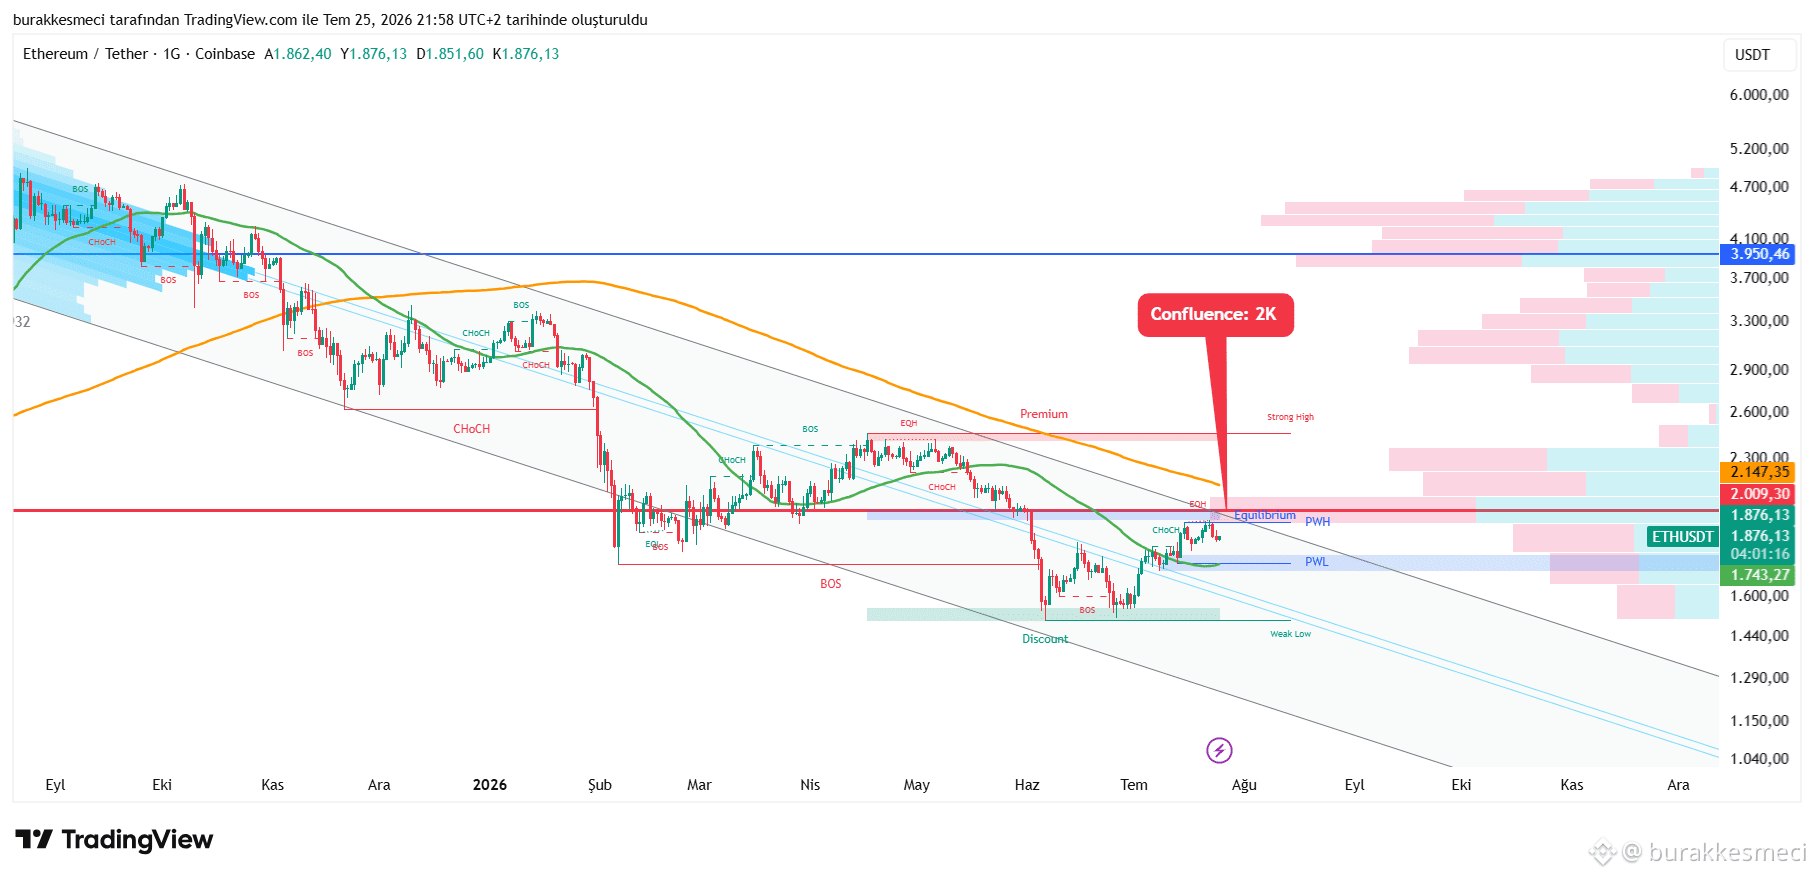
#Ethereum đã giảm 62% so với đỉnh, nhưng mắt tôi đang hướng vào chỉ một mốc. Muốn biết vì sao không? Vậy nếu ba chỉ báo độc lập cùng hướng đến một mức giá, thị trường có thể đang nói với chúng ta điều gì? Trên biểu đồ, ba công cụ độc lập gặp nhau đúng tại cùng một điểm. Đường kháng cự của xu hướng giảm, kéo dài từ từ tháng 08/2025, hôm nay nằm ở mức 2,000. Mức giá được giao dịch nhiều nhất trong năm qua, tức là POC (FRVP), cũng lại nằm tại 2,000. Cân bằng (Equilibrium) cho thấy sự cân bằng giữa người mua và người bán nằm đúng tại vị trí tương tự. Ta gọi đó là hội tụ (confluence) khi ba dữ liệu tách biệt cùng gặp nhau tại một mức giá. Chính điều này khiến 2,000 đô la trở thành mốc quan trọng nhất trên biểu đồ này. Tình hình hiện tại Hiện tại chúng ta đang ở mức 1,876 đô la. Miễn là giá vẫn nằm dưới 2,000 — nơi hội tụ giao nhau, có vẻ như người bán đang kiểm soát. Mọi đợt tăng lên vào lúc này có thể được hiểu như một nỗ lực quay trở lại POC. Cho đến khi 2,000 bị phá vỡ bằng một phiên đóng cửa theo tuần vượt qua nó, vẫn còn quá sớm để nói về khả năng đảo chiều xu hướng. Ngay cả khi 2,000 được vượt qua, con đường của ETH vẫn rất khó khăn. Ngay phía trên, 2,147 (SMA200) và 2,300 (giá đã thực hiện) đang chờ sẵn như những vùng kháng cự. Để xu hướng có thể đảo chiều, các mức này phải được vượt qua từng bước và được xác nhận. Kết luận ETH dường như đang bị kẹt giữa 1,500 và 2,000. Nếu 2,000 bị phá vỡ, hy vọng đầu tiên cho một đợt đảo chiều có thể xuất hiện. Nếu không vượt được, 1,743 (SMA50) có thể lại được đưa vào kịch bản. Nói ngắn gọn, 2,000 có thể là đường ranh định mệnh cho thị trường này. Bạn nghĩ ETH có thể tạo một phiên đóng cửa theo tuần trên 2,000 đô la trong giai đoạn tới không? #Altcoin
Tại sao mốc $2,000 lại là một điểm hội tụ cho $ETH ?
#Ethereum đã giảm 62% so với đỉnh, nhưng mắt tôi đang hướng vào chỉ một mốc. Muốn biết vì sao không? Vậy nếu ba chỉ báo độc lập cùng hướng đến một mức giá, thị trường có thể đang nói với chúng ta điều gì? Trên biểu đồ, ba công cụ độc lập gặp nhau đúng tại cùng một điểm. Đường kháng cự của xu hướng giảm, kéo dài từ từ tháng 08/2025, hôm nay nằm ở mức 2,000. Mức giá được giao dịch nhiều nhất trong năm qua, tức là POC (FRVP), cũng lại nằm tại 2,000. Cân bằng (Equilibrium) cho thấy sự cân bằng giữa người mua và người bán nằm đúng tại vị trí tương tự. Ta gọi đó là hội tụ (confluence) khi ba dữ liệu tách biệt cùng gặp nhau tại một mức giá. Chính điều này khiến 2,000 đô la trở thành mốc quan trọng nhất trên biểu đồ này. Tình hình hiện tại Hiện tại chúng ta đang ở mức 1,876 đô la. Miễn là giá vẫn nằm dưới 2,000 — nơi hội tụ giao nhau, có vẻ như người bán đang kiểm soát. Mọi đợt tăng lên vào lúc này có thể được hiểu như một nỗ lực quay trở lại POC. Cho đến khi 2,000 bị phá vỡ bằng một phiên đóng cửa theo tuần vượt qua nó, vẫn còn quá sớm để nói về khả năng đảo chiều xu hướng. Ngay cả khi 2,000 được vượt qua, con đường của ETH vẫn rất khó khăn. Ngay phía trên, 2,147 (SMA200) và 2,300 (giá đã thực hiện) đang chờ sẵn như những vùng kháng cự. Để xu hướng có thể đảo chiều, các mức này phải được vượt qua từng bước và được xác nhận. Kết luận ETH dường như đang bị kẹt giữa 1,500 và 2,000. Nếu 2,000 bị phá vỡ, hy vọng đầu tiên cho một đợt đảo chiều có thể xuất hiện. Nếu không vượt được, 1,743 (SMA50) có thể lại được đưa vào kịch bản. Nói ngắn gọn, 2,000 có thể là đường ranh định mệnh cho thị trường này. Bạn nghĩ ETH có thể tạo một phiên đóng cửa theo tuần trên 2,000 đô la trong giai đoạn tới không? #Altcoin
#Ethereum đã giảm 62% so với đỉnh, nhưng mắt tôi đang hướng vào chỉ một mốc. Muốn biết vì sao không? Vậy nếu ba chỉ báo độc lập cùng hướng đến một mức giá, thị trường có thể đang nói với chúng ta điều gì? Trên biểu đồ, ba công cụ độc lập gặp nhau đúng tại cùng một điểm. Đường kháng cự của xu hướng giảm, kéo dài từ từ tháng 08/2025, hôm nay nằm ở mức 2,000. Mức giá được giao dịch nhiều nhất trong năm qua, tức là POC (FRVP), cũng lại nằm tại 2,000. Cân bằng (Equilibrium) cho thấy sự cân bằng giữa người mua và người bán nằm đúng tại vị trí tương tự. Ta gọi đó là hội tụ (confluence) khi ba dữ liệu tách biệt cùng gặp nhau tại một mức giá. Chính điều này khiến 2,000 đô la trở thành mốc quan trọng nhất trên biểu đồ này. Tình hình hiện tại Hiện tại chúng ta đang ở mức 1,876 đô la. Miễn là giá vẫn nằm dưới 2,000 — nơi hội tụ giao nhau, có vẻ như người bán đang kiểm soát. Mọi đợt tăng lên vào lúc này có thể được hiểu như một nỗ lực quay trở lại POC. Cho đến khi 2,000 bị phá vỡ bằng một phiên đóng cửa theo tuần vượt qua nó, vẫn còn quá sớm để nói về khả năng đảo chiều xu hướng. Ngay cả khi 2,000 được vượt qua, con đường của ETH vẫn rất khó khăn. Ngay phía trên, 2,147 (SMA200) và 2,300 (giá đã thực hiện) đang chờ sẵn như những vùng kháng cự. Để xu hướng có thể đảo chiều, các mức này phải được vượt qua từng bước và được xác nhận. Kết luận ETH dường như đang bị kẹt giữa 1,500 và 2,000. Nếu 2,000 bị phá vỡ, hy vọng đầu tiên cho một đợt đảo chiều có thể xuất hiện. Nếu không vượt được, 1,743 (SMA50) có thể lại được đưa vào kịch bản. Nói ngắn gọn, 2,000 có thể là đường ranh định mệnh cho thị trường này. Bạn nghĩ ETH có thể tạo một phiên đóng cửa theo tuần trên 2,000 đô la trong giai đoạn tới không? #Altcoin
81
·
--
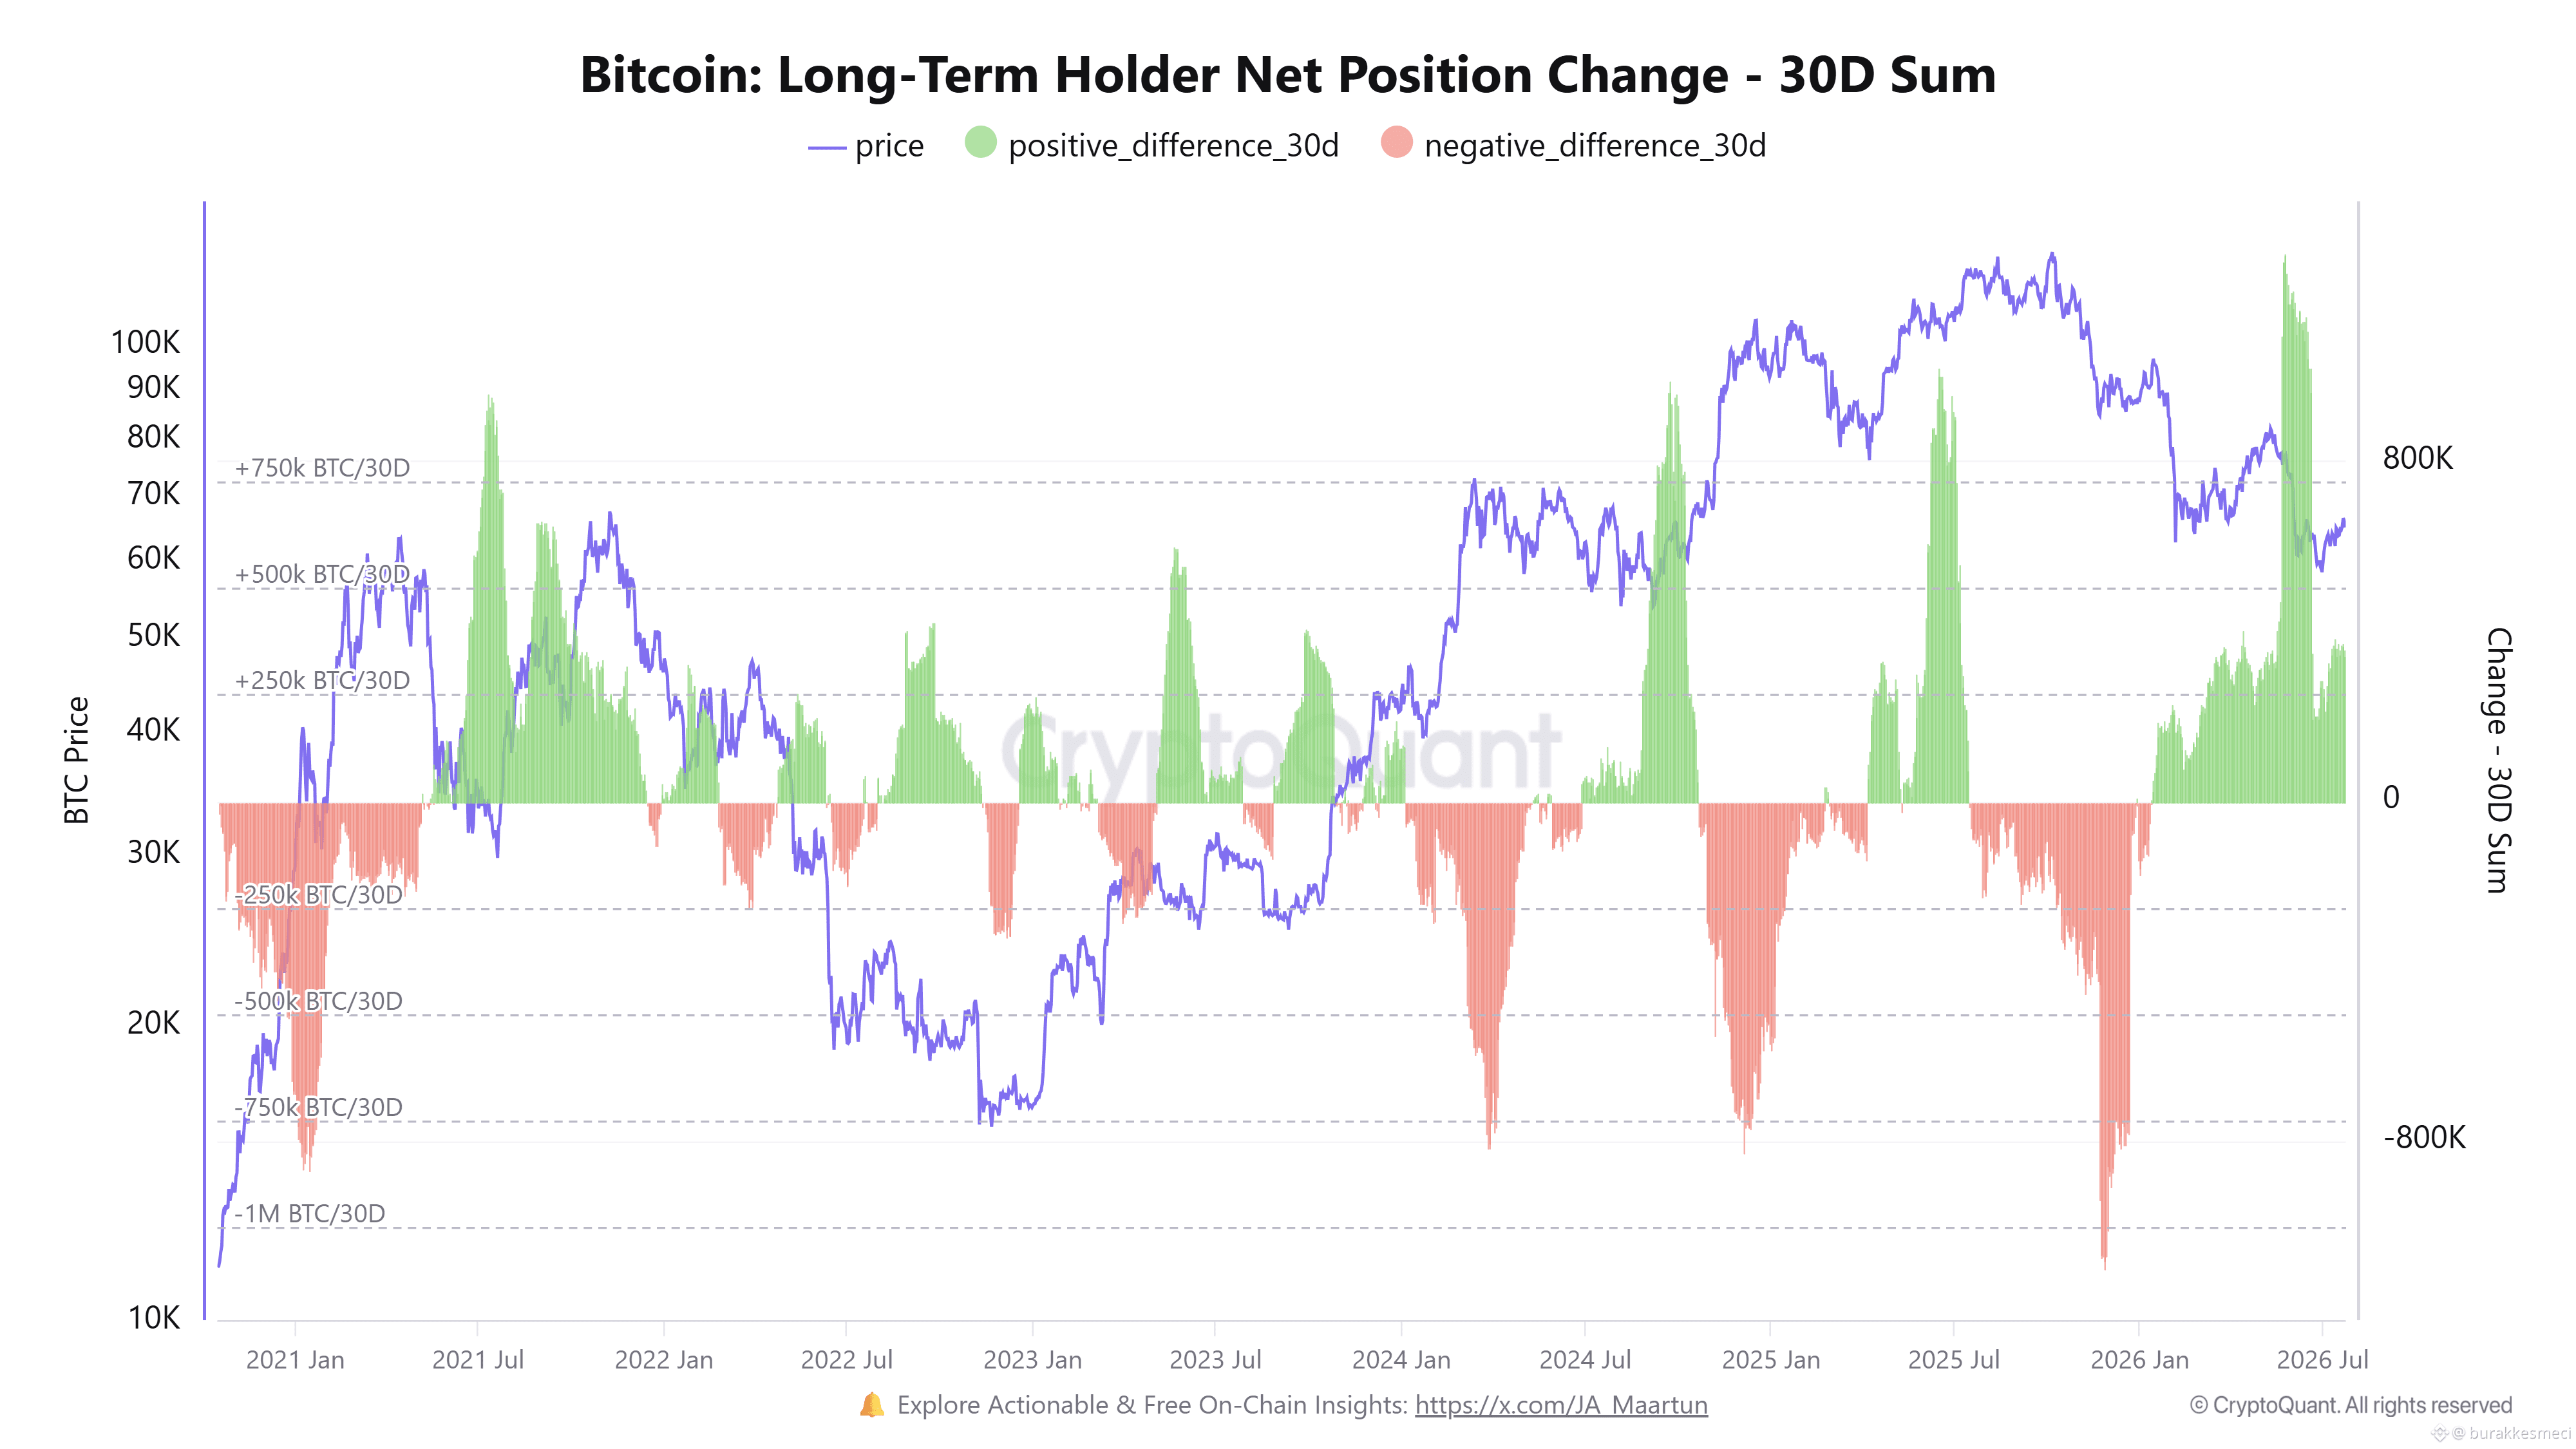
#Bitcoin LTH (nhà đầu tư nắm giữ dài hạn) tích lũy vừa chạm mức cao nhất trong 6 năm. Liệu đợt bull run có sắp tới? Vậy nếu “tiền thông minh” đang mua với khối lượng kỷ lục trong khi giá giảm, điều đó có thể đang nói gì với chúng ta? Thay đổi ròng vị thế LTH là gì? Thay đổi ròng vị thế LTH cho thấy tổng lượng $BTC do nhà đầu tư dài hạn nắm giữ đã tăng hay giảm bao nhiêu trong 30 ngày. Vùng màu xanh nghĩa là những “bàn tay” này đang tích lũy, còn vùng màu đỏ nghĩa là họ đang bán. Nói ngắn gọn, chỉ số này cho phép chúng ta đọc xem “tiền thông minh” thực sự đang làm gì. Xanh càng leo cao thì lực mua càng quyết liệt. Tình hình hiện tại Ngay bây giờ, chỉ số này đang phát tín hiệu theo hướng tích cực. Đọc xanh lớn nhất trong 6 năm vừa được ghi nhận. Vào ngày 24/05/2026, nó đạt 1,29 triệu BTC/30D, vượt qua cả kỷ lục tháng 08/2017. Nói cách khác, những “tay chơi mạnh nhất” đã xuất hiện đúng thời điểm giá ở trạng thái yếu nhất. Tích lũy ở quy mô này là bằng chứng rằng những “tay chơi mạnh” vẫn còn hiện diện cho dài hạn. Khi Bitcoin tiến gần đến mức giá hiện thực (realized price level), những nhà đầu tư mạnh sẽ bước lên sân khấu. Kết luận Tự nó, dữ liệu này chưa đủ để khẳng định chắc chắn về một chu kỳ bull quay trở lại, nhưng điều đó không làm thay đổi thực tế rằng đây là một tín hiệu tích cực mạnh. Ngoài ra, sau những lượt mua này, Bitcoin đã có một nhịp tăng khoảng 15% từ 58K lên 66K. Tâm lý LTH mạnh mẽ xuất hiện sau dữ liệu kỷ lục đã đẩy giá đi được gần như toàn bộ quãng đường tới STH RP (cơ sở chi phí của người nắm giữ ngắn hạn), là 68K. Liệu mốc này có bị phá vỡ hay không sẽ là vùng quyết định quan trọng để xác định xu hướng ngắn hạn. Bạn nghĩ BTC có thể đóng cửa trên STH RP (68K) trong Q3 không? #BTC #BTC Price Analysis#
#Bitcoin LTH (nhà đầu tư nắm giữ dài hạn) tích lũy vừa chạm mức cao nhất trong 6 năm. Liệu đợt bull run có sắp tới? Vậy nếu “tiền thông minh” đang mua với khối lượng kỷ lục trong khi giá giảm, điều đó có thể đang nói gì với chúng ta? Thay đổi ròng vị thế LTH là gì? Thay đổi ròng vị thế LTH cho thấy tổng lượng $BTC do nhà đầu tư dài hạn nắm giữ đã tăng hay giảm bao nhiêu trong 30 ngày. Vùng màu xanh nghĩa là những “bàn tay” này đang tích lũy, còn vùng màu đỏ nghĩa là họ đang bán. Nói ngắn gọn, chỉ số này cho phép chúng ta đọc xem “tiền thông minh” thực sự đang làm gì. Xanh càng leo cao thì lực mua càng quyết liệt. Tình hình hiện tại Ngay bây giờ, chỉ số này đang phát tín hiệu theo hướng tích cực. Đọc xanh lớn nhất trong 6 năm vừa được ghi nhận. Vào ngày 24/05/2026, nó đạt 1,29 triệu BTC/30D, vượt qua cả kỷ lục tháng 08/2017. Nói cách khác, những “tay chơi mạnh nhất” đã xuất hiện đúng thời điểm giá ở trạng thái yếu nhất. Tích lũy ở quy mô này là bằng chứng rằng những “tay chơi mạnh” vẫn còn hiện diện cho dài hạn. Khi Bitcoin tiến gần đến mức giá hiện thực (realized price level), những nhà đầu tư mạnh sẽ bước lên sân khấu. Kết luận Tự nó, dữ liệu này chưa đủ để khẳng định chắc chắn về một chu kỳ bull quay trở lại, nhưng điều đó không làm thay đổi thực tế rằng đây là một tín hiệu tích cực mạnh. Ngoài ra, sau những lượt mua này, Bitcoin đã có một nhịp tăng khoảng 15% từ 58K lên 66K. Tâm lý LTH mạnh mẽ xuất hiện sau dữ liệu kỷ lục đã đẩy giá đi được gần như toàn bộ quãng đường tới STH RP (cơ sở chi phí của người nắm giữ ngắn hạn), là 68K. Liệu mốc này có bị phá vỡ hay không sẽ là vùng quyết định quan trọng để xác định xu hướng ngắn hạn. Bạn nghĩ BTC có thể đóng cửa trên STH RP (68K) trong Q3 không? #BTC #BTC Price Analysis#
84
·
--
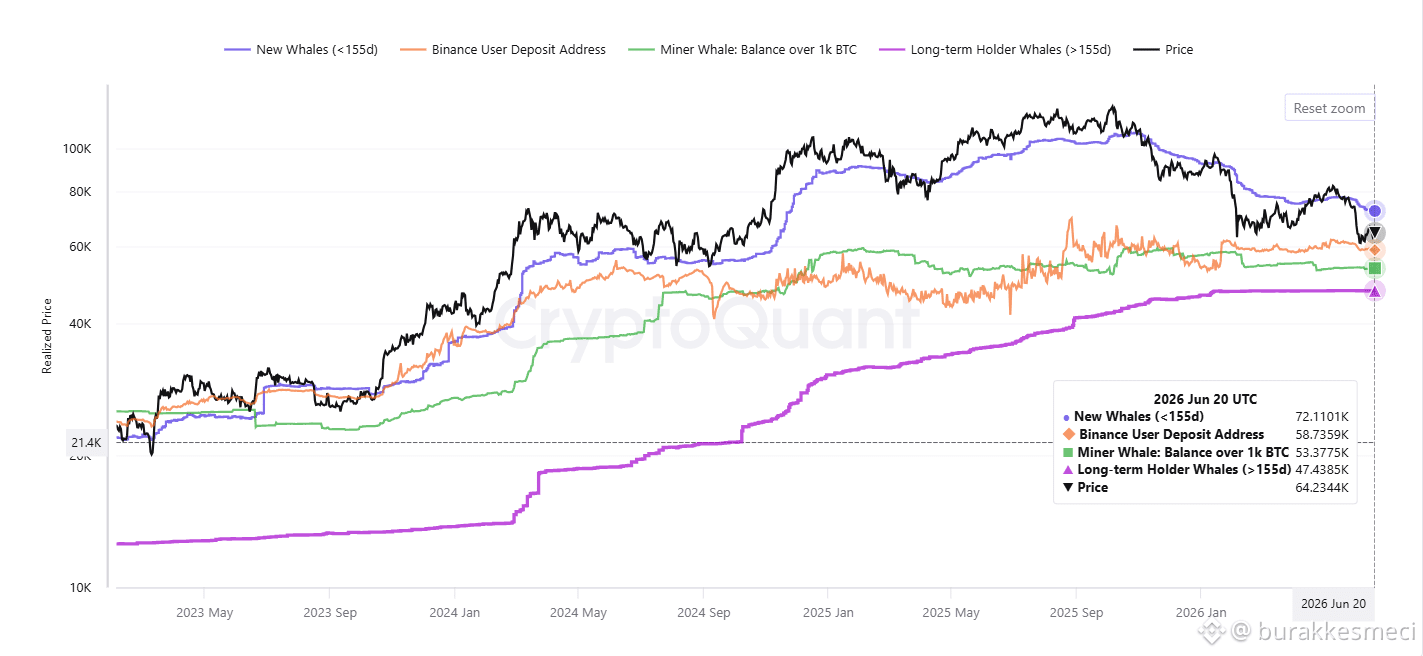
Khởi đầu tuần mới: Cá voi Bitcoin mới đang “chìm” dưới nước, kháng cự 72K! Không có cá voi mới ( <155 days> ) thì cảm giác hưng phấn vẫn chưa đến, còn một đợt bull rally vẫn chỉ là mơ ước. Chi phí trung bình của nhóm cá voi mới là 72,1K và vì giá hiện tại là 64,2K, lượng tiền tươi này hiện đã bị chìm dưới nước. Ngay sát bên dưới họ là ba lớp chi phí mạnh xếp hàng. Nhà đầu tư Binance RP (cơ sở chi phí trung bình) nằm ở 58,7K, thợ đào ở 53,7K và nhóm cá voi nắm giữ dài hạn ở 47,3K. Vì vậy, giá đang trôi thấp hơn các cá voi mới—những người có thể hoảng loạn—nhưng lại vẫn an toàn phía trên phần tiền kiên nhẫn đã mua coin của mình với giá rẻ. Kết quả là, cho đến khi 72,1K được kéo lại, xu hướng vẫn chịu áp lực từ các cá voi mới, và mức hỗ trợ thực sự quan trọng là dải 58,7K đến 53,4K; vì nếu nó bị phá vỡ, cánh cửa có thể mở ra hướng tới chi phí 47,4K của các nhà nắm giữ dài hạn. Bạn nghĩ cá voi mới có thể kéo lại lợi nhuận (về “xanh”) trong phần còn lại của năm 2026 không? #BTC Price Analysis# #Macro Insights# #BTC $BTC
Khởi đầu tuần mới: Cá voi Bitcoin mới đang “chìm” dưới nước, kháng cự 72K! Không có cá voi mới ( <155 days> ) thì cảm giác hưng phấn vẫn chưa đến, còn một đợt bull rally vẫn chỉ là mơ ước. Chi phí trung bình của nhóm cá voi mới là 72,1K và vì giá hiện tại là 64,2K, lượng tiền tươi này hiện đã bị chìm dưới nước. Ngay sát bên dưới họ là ba lớp chi phí mạnh xếp hàng. Nhà đầu tư Binance RP (cơ sở chi phí trung bình) nằm ở 58,7K, thợ đào ở 53,7K và nhóm cá voi nắm giữ dài hạn ở 47,3K. Vì vậy, giá đang trôi thấp hơn các cá voi mới—những người có thể hoảng loạn—nhưng lại vẫn an toàn phía trên phần tiền kiên nhẫn đã mua coin của mình với giá rẻ. Kết quả là, cho đến khi 72,1K được kéo lại, xu hướng vẫn chịu áp lực từ các cá voi mới, và mức hỗ trợ thực sự quan trọng là dải 58,7K đến 53,4K; vì nếu nó bị phá vỡ, cánh cửa có thể mở ra hướng tới chi phí 47,4K của các nhà nắm giữ dài hạn. Bạn nghĩ cá voi mới có thể kéo lại lợi nhuận (về “xanh”) trong phần còn lại của năm 2026 không? #BTC Price Analysis# #Macro Insights# #BTC $BTC
68
·
--
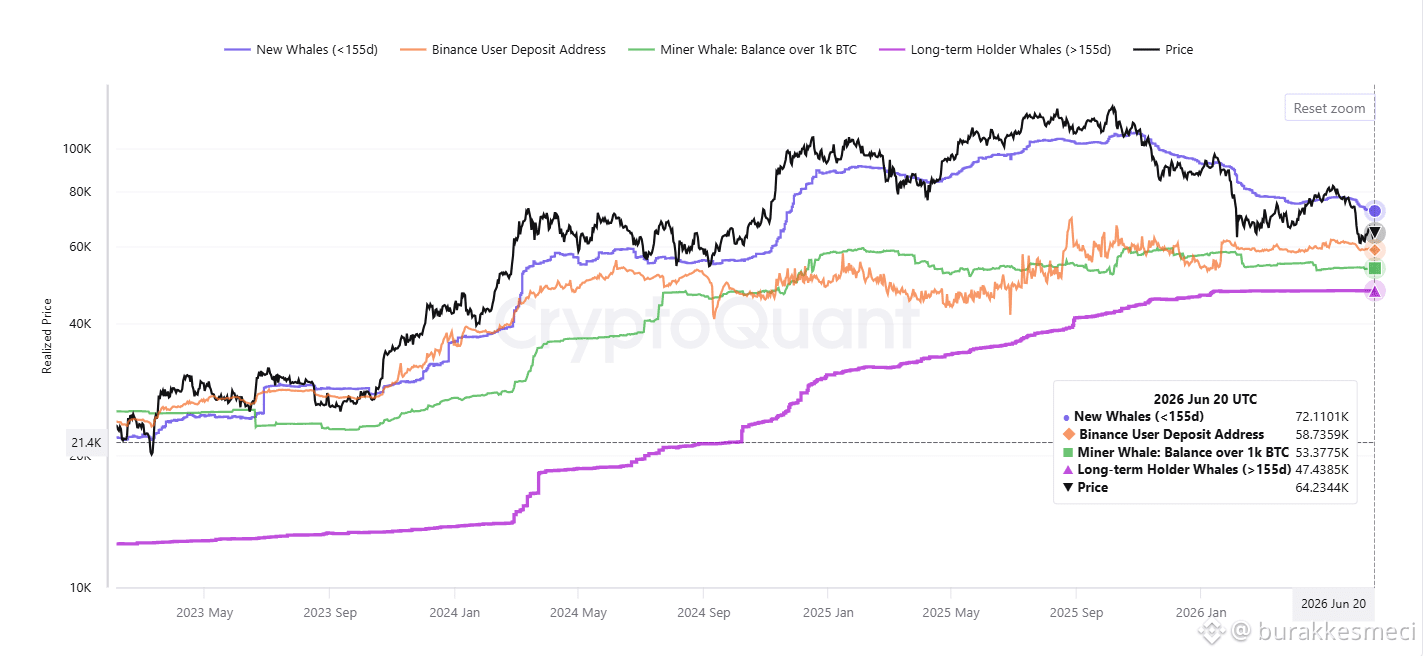
**Bắt Đầu Tuần Mới: Cá Voi Bitcoin Mới Vẫn Chìm Dưới Nước, Kháng Cự 72K!** Nếu không có cá voi mới (<155 ngày) vui mừng, một đợt bull rally vẫn chỉ là giấc mơ. Chi phí trung bình của nhóm cá voi mới là 72,1K và vì giá hiện tại ở 64,2K, dòng tiền mới này giờ đang ở dưới giá mua (thua lỗ). Ngay bên dưới họ là ba lớp chi phí mạnh xếp hàng. Nhà đầu tư Binance RP (cơ sở chi phí trung bình) nằm ở 58,7K, thợ đào ở 53,7K và nhóm cá voi nắm giữ dài hạn ở 47,3K. Vì vậy, giá đang trôi thấp hơn nhóm cá voi mới—những người có thể hoảng loạn—nhưng vẫn an toàn hơn phía trên phần tiền kiên nhẫn đã mua được coin của mình với giá rẻ. Kết quả là, cho đến khi 72,1K được giành lại, xu hướng vẫn chịu áp lực từ cá voi mới, và mức hỗ trợ thực sự quan trọng nằm trong dải 58,7K đến 53,4K, vì nếu dải này bị phá vỡ thì cánh cửa có thể mở hướng tới chi phí 47,4K của các nhà nắm giữ dài hạn. Bạn nghĩ cá voi mới có thể quay lại vùng có lãi trong phần còn lại của năm 2026 không? #Phân_TíchGiáBTC# #Nhận_ĐịnhVĩ_Mô# #Bitcoin $BTC
**Bắt Đầu Tuần Mới: Cá Voi Bitcoin Mới Vẫn Chìm Dưới Nước, Kháng Cự 72K!** Nếu không có cá voi mới (<155 ngày) vui mừng, một đợt bull rally vẫn chỉ là giấc mơ. Chi phí trung bình của nhóm cá voi mới là 72,1K và vì giá hiện tại ở 64,2K, dòng tiền mới này giờ đang ở dưới giá mua (thua lỗ). Ngay bên dưới họ là ba lớp chi phí mạnh xếp hàng. Nhà đầu tư Binance RP (cơ sở chi phí trung bình) nằm ở 58,7K, thợ đào ở 53,7K và nhóm cá voi nắm giữ dài hạn ở 47,3K. Vì vậy, giá đang trôi thấp hơn nhóm cá voi mới—những người có thể hoảng loạn—nhưng vẫn an toàn hơn phía trên phần tiền kiên nhẫn đã mua được coin của mình với giá rẻ. Kết quả là, cho đến khi 72,1K được giành lại, xu hướng vẫn chịu áp lực từ cá voi mới, và mức hỗ trợ thực sự quan trọng nằm trong dải 58,7K đến 53,4K, vì nếu dải này bị phá vỡ thì cánh cửa có thể mở hướng tới chi phí 47,4K của các nhà nắm giữ dài hạn. Bạn nghĩ cá voi mới có thể quay lại vùng có lãi trong phần còn lại của năm 2026 không? #Phân_TíchGiáBTC# #Nhận_ĐịnhVĩ_Mô# #Bitcoin $BTC
74
·
--
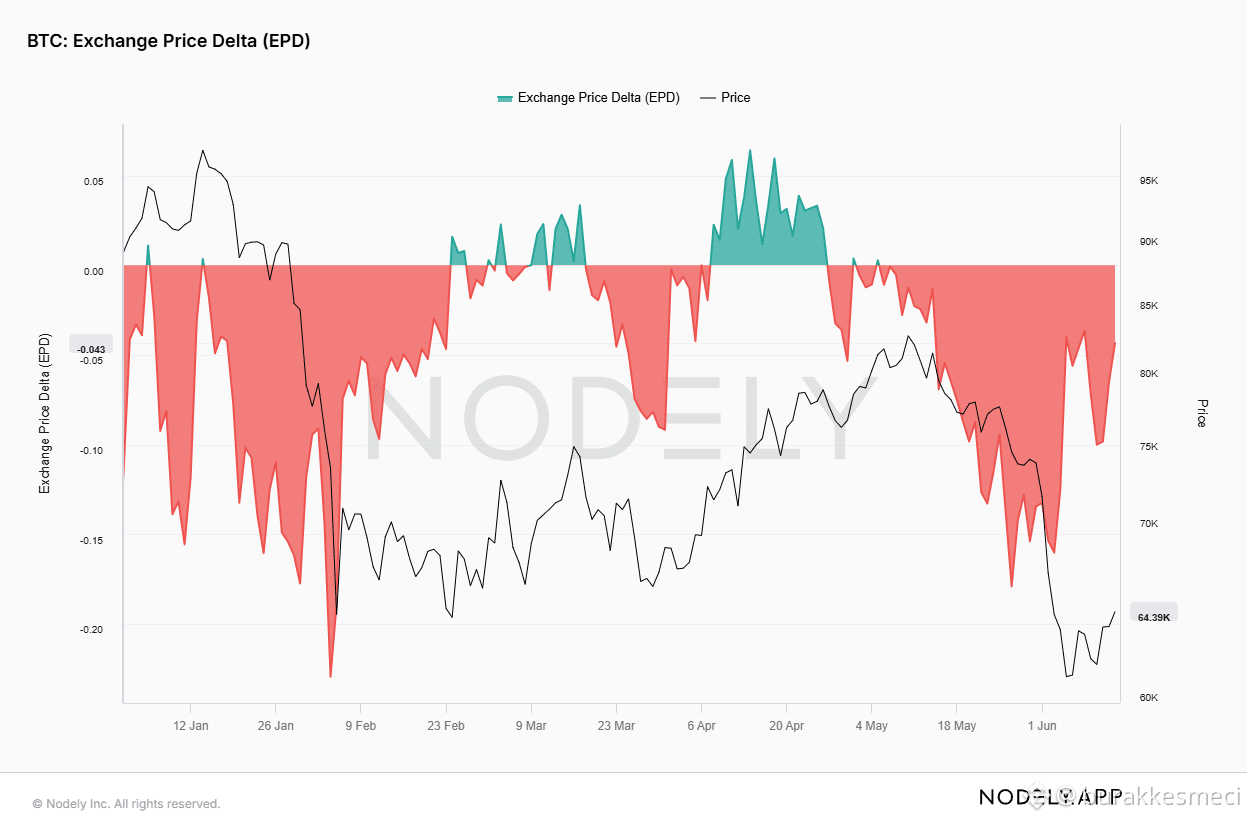
$BTC Áp lực bán trên phía US vẫn tiếp diễn, EPD ở -0.043 EPD (Exchange Price Delta) về cơ bản là khoảng chênh lệch giá giữa các sàn giao dịch ở Mỹ và phần còn lại, nghĩa là nó đo lường mức độ “thèm muốn” của các tổ chức và cá voi tại Mỹ. Trong năm 2026, gần như toàn bộ biểu đồ đều màu đỏ, nghĩa là nhu cầu ở phía Mỹ đã yếu kể từ tháng 1 và áp lực bán từ phía bán chiếm ưu thế. Ngoại lệ mạnh duy nhất là cụm màu xanh vào đầu tháng 4, khi các tổ chức Mỹ chuyển sang trạng thái mua và đẩy giá từ 62K lên 82K. Nhưng trong tháng 5, EPD lại đảo về màu đỏ, phía Mỹ chuyển sang người bán, và giá lao mạnh trở lại mức 62K. Kết luận. Nhu cầu từ Mỹ dẫn dắt giá theo chỉ báo này, và hiện tại EPD vẫn đang âm ở mức -0.043. Nó đang hồi phục từ vùng đáy nhưng chưa chuyển sang xanh, nghĩa là các tổ chức Mỹ chưa quay lại trạng thái người mua. Nhịp bật lên ở 64.4K này chưa có xác nhận nhu cầu trong nước, và để một sự đảo chiều bền vững diễn ra, chúng ta cần thấy EPD tiến lên trên 0. Cảm ơn bạn đã đọc. #BTC Price Analysis# #bitcoin #btc #BTC Correction Incoming?#
$BTC Áp lực bán trên phía US vẫn tiếp diễn, EPD ở -0.043 EPD (Exchange Price Delta) về cơ bản là khoảng chênh lệch giá giữa các sàn giao dịch ở Mỹ và phần còn lại, nghĩa là nó đo lường mức độ “thèm muốn” của các tổ chức và cá voi tại Mỹ. Trong năm 2026, gần như toàn bộ biểu đồ đều màu đỏ, nghĩa là nhu cầu ở phía Mỹ đã yếu kể từ tháng 1 và áp lực bán từ phía bán chiếm ưu thế. Ngoại lệ mạnh duy nhất là cụm màu xanh vào đầu tháng 4, khi các tổ chức Mỹ chuyển sang trạng thái mua và đẩy giá từ 62K lên 82K. Nhưng trong tháng 5, EPD lại đảo về màu đỏ, phía Mỹ chuyển sang người bán, và giá lao mạnh trở lại mức 62K. Kết luận. Nhu cầu từ Mỹ dẫn dắt giá theo chỉ báo này, và hiện tại EPD vẫn đang âm ở mức -0.043. Nó đang hồi phục từ vùng đáy nhưng chưa chuyển sang xanh, nghĩa là các tổ chức Mỹ chưa quay lại trạng thái người mua. Nhịp bật lên ở 64.4K này chưa có xác nhận nhu cầu trong nước, và để một sự đảo chiều bền vững diễn ra, chúng ta cần thấy EPD tiến lên trên 0. Cảm ơn bạn đã đọc. #BTC Price Analysis# #bitcoin #btc #BTC Correction Incoming?#
80
·
--
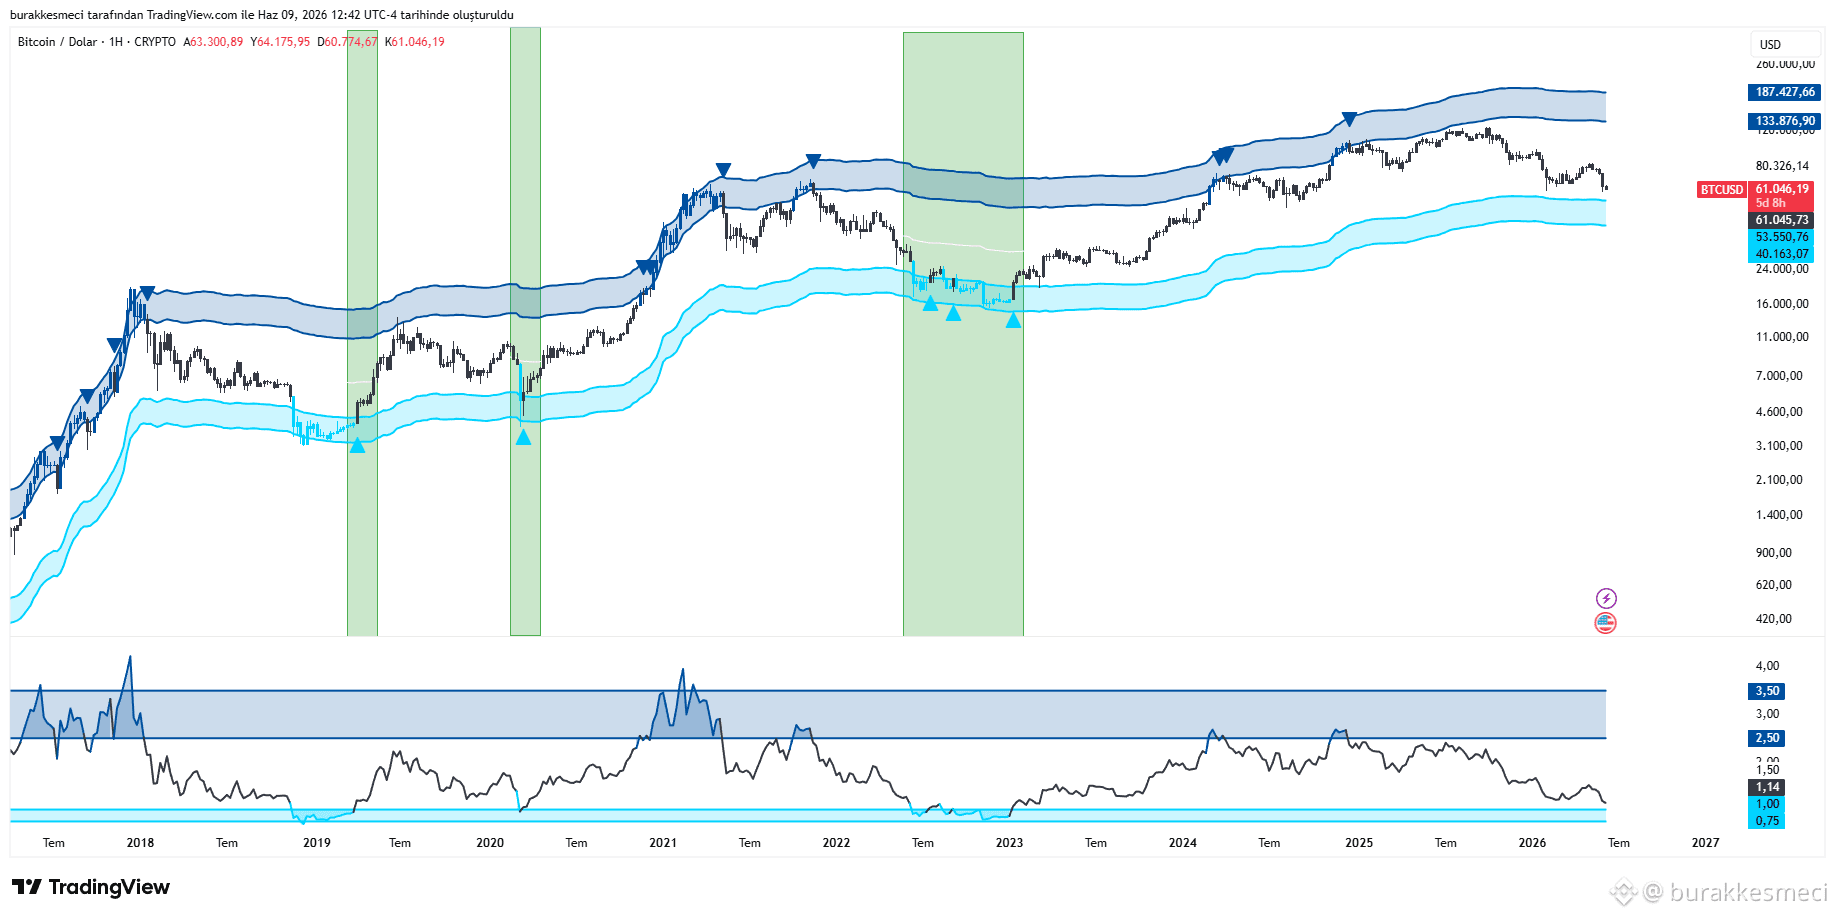
Nếu $BTC BTC vượt qua $53,551, thì điều gì sẽ xảy ra?
Điều này đã xảy ra 3 lần trong lịch sử — mỗi lần, giá giảm hơn 30%.
Nếu bạn muốn thấy “đáy thật” của BTC, hãy xem Giá Thực Hiện (Realized Price).
Giá Thực Hiện là gì?
Giá Thực Hiện là giá trung bình tại đó mọi BTC trên chuỗi đã lần cuối cùng được chuyển nhượng. Hãy hình dung đây như “cơ sở giá vốn trung bình” của thị trường. Khi BTC giảm xuống dưới mức này, phần lớn thị trường sẽ lâm vào trạng thái thua lỗ. Bán tháo bắt đầu, “người cầm yếu” buông hàng (capitulation), và các nhà mua mạnh tay bước vào.
Trong 8 năm qua, điều này đã xảy ra đúng 3 lần.
3 Giai đoạn lịch sử
Thị trường gấu 2018-2019: RP bị phá vỡ trong 133 ngày. BTC giảm 33,3% so với Giá Thực Hiện.
2022-2023 Thị trường gấu: RP bị phá vỡ trong 210 ngày. BTC giảm 28,2% so với Giá Thực Hiện.
2020 Sự cố Covid: Chỉ 7 ngày. Lệch 4,4%, sau đó phục hồi nhanh.
Điểm chung: áp lực bán tiếp tục miễn là BTC vẫn nằm dưới RP — và ngay khi nó lấy lại được, mỗi lần đều xuất hiện một đợt tăng mạnh theo sau.
Hiện tại chúng ta đang ở đâu
BTC đang ở $61,255. Giá Thực Hiện đang ở $53,551. Chúng ta chỉ cách RP 14,4%.
Chỉ cần BTC giảm 12,6% nữa là chạm được mức này. Nếu RP bị phá vỡ, lịch sử nói gì?
Kịch bản tốt nhất: BTC sẽ kiểm tra ngắn quanh $51,000 và phục hồi nhanh. Dựa trên mức lệch trung bình của tất cả 3 lần RP bị phá vỡ trong quá khứ, mức lệch ~22% dưới RP tương ứng mục tiêu khoảng $41,800.
Đây không phải là dự đoán. Chúng là các phép tính dựa trên trung bình độ lệch RP trong lịch sử.
Khi đầu tư vào Bitcoin, hãy luôn theo dõi Giá Thực Hiện. Nếu $53,551 bị phá vỡ, hãy quay lại và đọc lại bản phân tích này.
Bạn đã từng dùng Giá Thực Hiện làm chỉ báo rủi ro theo cách này chưa? (Rất hoan nghênh các câu trả lời chân thành trong phần bình luận.)
Cảm ơn vì đã đọc — nếu bạn thấy bài này hữu ích, hãy chia sẻ với 1 người bạn. #Bitcoin #BTC #BTC Correction Incoming?#
Nếu $BTC BTC vượt qua $53,551, thì điều gì sẽ xảy ra?
Điều này đã xảy ra 3 lần trong lịch sử — mỗi lần, giá giảm hơn 30%.
Nếu bạn muốn thấy “đáy thật” của BTC, hãy xem Giá Thực Hiện (Realized Price).
Giá Thực Hiện là gì?
Giá Thực Hiện là giá trung bình tại đó mọi BTC trên chuỗi đã lần cuối cùng được chuyển nhượng. Hãy hình dung đây như “cơ sở giá vốn trung bình” của thị trường. Khi BTC giảm xuống dưới mức này, phần lớn thị trường sẽ lâm vào trạng thái thua lỗ. Bán tháo bắt đầu, “người cầm yếu” buông hàng (capitulation), và các nhà mua mạnh tay bước vào.
Trong 8 năm qua, điều này đã xảy ra đúng 3 lần.
3 Giai đoạn lịch sử
Thị trường gấu 2018-2019: RP bị phá vỡ trong 133 ngày. BTC giảm 33,3% so với Giá Thực Hiện.
2022-2023 Thị trường gấu: RP bị phá vỡ trong 210 ngày. BTC giảm 28,2% so với Giá Thực Hiện.
2020 Sự cố Covid: Chỉ 7 ngày. Lệch 4,4%, sau đó phục hồi nhanh.
Điểm chung: áp lực bán tiếp tục miễn là BTC vẫn nằm dưới RP — và ngay khi nó lấy lại được, mỗi lần đều xuất hiện một đợt tăng mạnh theo sau.
Hiện tại chúng ta đang ở đâu
BTC đang ở $61,255. Giá Thực Hiện đang ở $53,551. Chúng ta chỉ cách RP 14,4%.
Chỉ cần BTC giảm 12,6% nữa là chạm được mức này. Nếu RP bị phá vỡ, lịch sử nói gì?
Kịch bản tốt nhất: BTC sẽ kiểm tra ngắn quanh $51,000 và phục hồi nhanh. Dựa trên mức lệch trung bình của tất cả 3 lần RP bị phá vỡ trong quá khứ, mức lệch ~22% dưới RP tương ứng mục tiêu khoảng $41,800.
Đây không phải là dự đoán. Chúng là các phép tính dựa trên trung bình độ lệch RP trong lịch sử.
Khi đầu tư vào Bitcoin, hãy luôn theo dõi Giá Thực Hiện. Nếu $53,551 bị phá vỡ, hãy quay lại và đọc lại bản phân tích này.
Bạn đã từng dùng Giá Thực Hiện làm chỉ báo rủi ro theo cách này chưa? (Rất hoan nghênh các câu trả lời chân thành trong phần bình luận.)
Cảm ơn vì đã đọc — nếu bạn thấy bài này hữu ích, hãy chia sẻ với 1 người bạn. #Bitcoin #BTC #BTC Correction Incoming?#
Điều này đã xảy ra 3 lần trong lịch sử — mỗi lần, giá giảm hơn 30%.
Nếu bạn muốn thấy “đáy thật” của BTC, hãy xem Giá Thực Hiện (Realized Price).
Giá Thực Hiện là gì?
Giá Thực Hiện là giá trung bình tại đó mọi BTC trên chuỗi đã lần cuối cùng được chuyển nhượng. Hãy hình dung đây như “cơ sở giá vốn trung bình” của thị trường. Khi BTC giảm xuống dưới mức này, phần lớn thị trường sẽ lâm vào trạng thái thua lỗ. Bán tháo bắt đầu, “người cầm yếu” buông hàng (capitulation), và các nhà mua mạnh tay bước vào.
Trong 8 năm qua, điều này đã xảy ra đúng 3 lần.
3 Giai đoạn lịch sử
Thị trường gấu 2018-2019: RP bị phá vỡ trong 133 ngày. BTC giảm 33,3% so với Giá Thực Hiện.
2022-2023 Thị trường gấu: RP bị phá vỡ trong 210 ngày. BTC giảm 28,2% so với Giá Thực Hiện.
2020 Sự cố Covid: Chỉ 7 ngày. Lệch 4,4%, sau đó phục hồi nhanh.
Điểm chung: áp lực bán tiếp tục miễn là BTC vẫn nằm dưới RP — và ngay khi nó lấy lại được, mỗi lần đều xuất hiện một đợt tăng mạnh theo sau.
Hiện tại chúng ta đang ở đâu
BTC đang ở $61,255. Giá Thực Hiện đang ở $53,551. Chúng ta chỉ cách RP 14,4%.
Chỉ cần BTC giảm 12,6% nữa là chạm được mức này. Nếu RP bị phá vỡ, lịch sử nói gì?
Kịch bản tốt nhất: BTC sẽ kiểm tra ngắn quanh $51,000 và phục hồi nhanh. Dựa trên mức lệch trung bình của tất cả 3 lần RP bị phá vỡ trong quá khứ, mức lệch ~22% dưới RP tương ứng mục tiêu khoảng $41,800.
Đây không phải là dự đoán. Chúng là các phép tính dựa trên trung bình độ lệch RP trong lịch sử.
Khi đầu tư vào Bitcoin, hãy luôn theo dõi Giá Thực Hiện. Nếu $53,551 bị phá vỡ, hãy quay lại và đọc lại bản phân tích này.
Bạn đã từng dùng Giá Thực Hiện làm chỉ báo rủi ro theo cách này chưa? (Rất hoan nghênh các câu trả lời chân thành trong phần bình luận.)
Cảm ơn vì đã đọc — nếu bạn thấy bài này hữu ích, hãy chia sẻ với 1 người bạn. #Bitcoin #BTC #BTC Correction Incoming?#
75
·
--
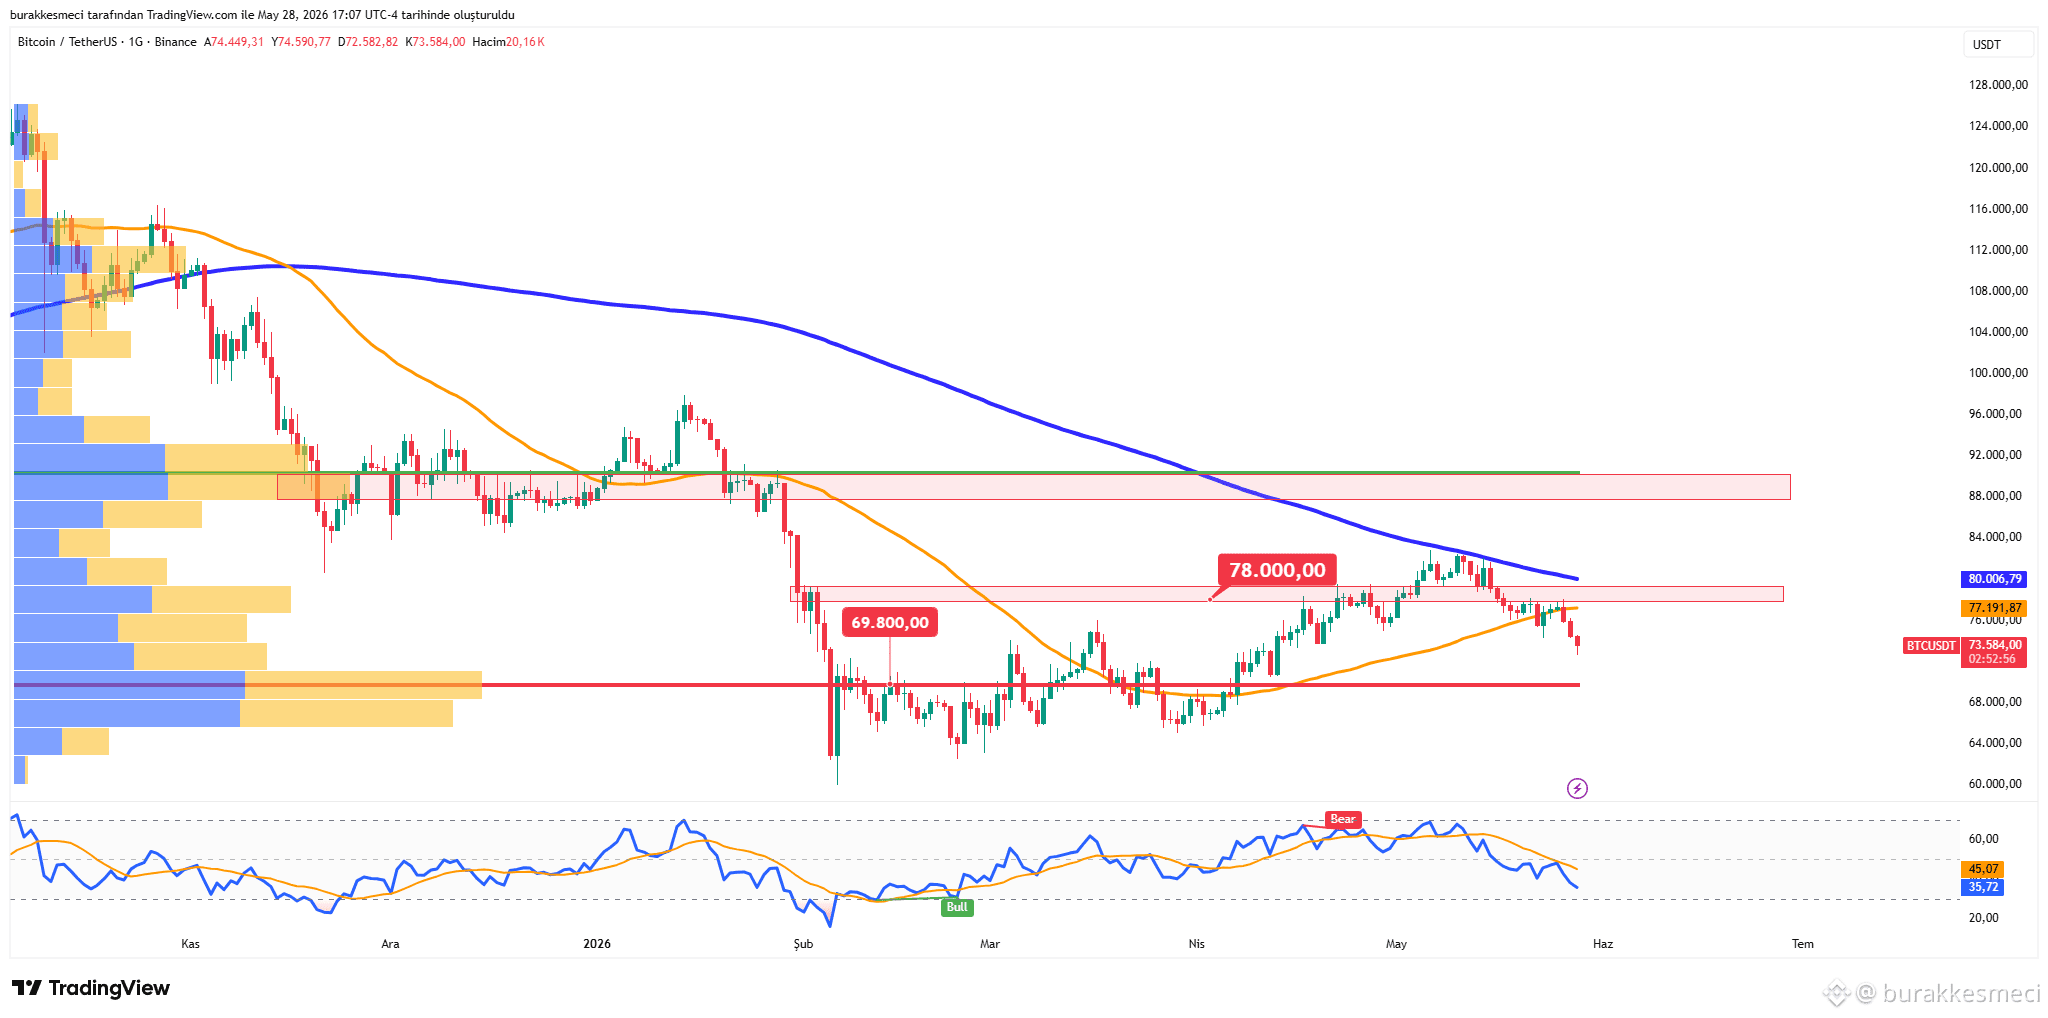
$BTC đã giảm xuống dưới SMA50, mức hỗ trợ ngắn hạn của nó, và áp lực bán đang gia tăng. Một động thái tăng cường hướng tới mức POC hiện đang diễn ra. Mục tiêu FRVP POC: 69.8K. #Bitcoin
$BTC đã giảm xuống dưới SMA50, mức hỗ trợ ngắn hạn của nó, và áp lực bán đang gia tăng. Một động thái tăng cường hướng tới mức POC hiện đang diễn ra. Mục tiêu FRVP POC: 69.8K. #Bitcoin
68
·
--
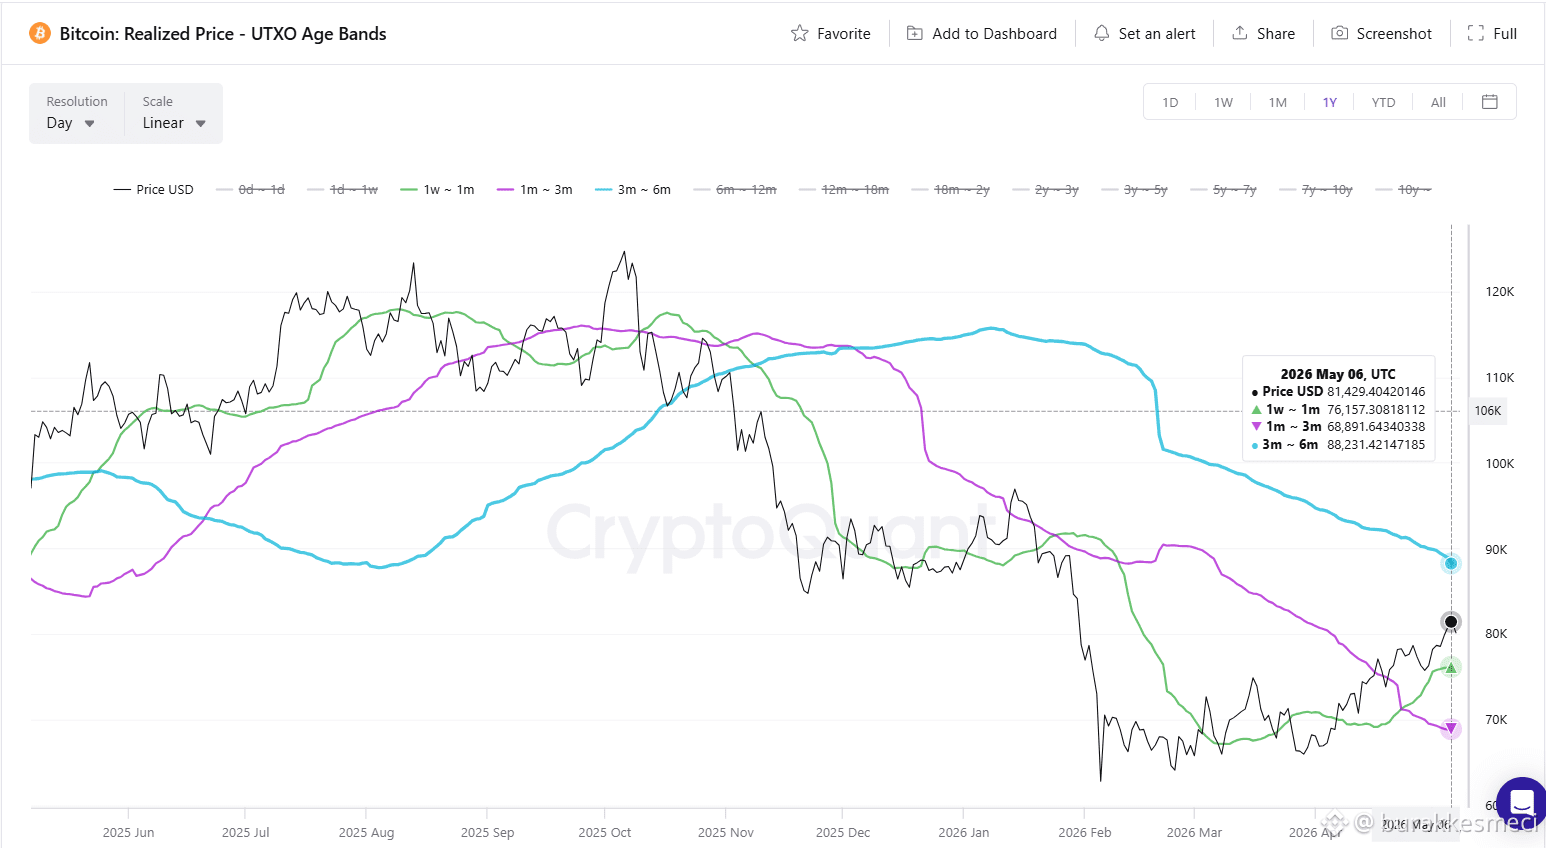
$BTC Các cụm chi phí ngắn hạn đang tăng lên: Nếu 88K bị phá vỡ, câu chuyện sẽ thay đổi. Nhìn vào các cụm chi phí của người nắm giữ ngắn hạn thông qua chỉ số UTXO Age Bands của Bitcoin, một sự phát triển quan trọng đang diễn ra. Tỷ lệ chi phí của nhóm 1-4 tuần đã tăng từ 67K lên 76K. Cụm này đã bắt đầu vượt lên trên cụm tiếp theo (1-3 tháng → 68K). Bạn có thể gọi đó là một cú giao cắt vàng nhỏ nhưng có ý nghĩa. Tại sao điều này lại quan trọng? Bởi vì những người nắm giữ ngắn hạn là động cơ tăng trưởng của thị trường. Khi nhóm này đang thua lỗ, họ tạo ra áp lực bán. Khi họ bắt đầu có lợi nhuận, họ mang lại tín hiệu đầu tiên về sự thay đổi tâm lý. Các cụm chi phí xếp chồng từ dưới lên là nền tảng của một cấu trúc xu hướng khỏe mạnh. Đó chính xác là sự đồng bộ đang bắt đầu hình thành ngay bây giờ. Mục tiêu tiếp theo là cụm 3-6 tháng: 88K. Đây là một mức kháng cự quan trọng cho Bitcoin. Nếu giá ổn định trên 88K, tất cả các cụm của nhóm ngắn hạn sẽ chuyển sang tích cực, những người nắm giữ ngắn hạn sẽ có lợi nhuận, và họ bắt đầu kể những câu chuyện thành công cho mọi người xung quanh. Đó sẽ là tín hiệu thực sự của một sự đảo chiều xu hướng. Nhưng có một rào cản mạnh cần vượt qua trước: 88K. Bạn có nghĩ rằng Bitcoin có thể phá vỡ trên 88K vào tháng 5 năm 2026 không? #Bitcoin #BTC #Phân Tích Giá BTC
$BTC Các cụm chi phí ngắn hạn đang tăng lên: Nếu 88K bị phá vỡ, câu chuyện sẽ thay đổi. Nhìn vào các cụm chi phí của người nắm giữ ngắn hạn thông qua chỉ số UTXO Age Bands của Bitcoin, một sự phát triển quan trọng đang diễn ra. Tỷ lệ chi phí của nhóm 1-4 tuần đã tăng từ 67K lên 76K. Cụm này đã bắt đầu vượt lên trên cụm tiếp theo (1-3 tháng → 68K). Bạn có thể gọi đó là một cú giao cắt vàng nhỏ nhưng có ý nghĩa. Tại sao điều này lại quan trọng? Bởi vì những người nắm giữ ngắn hạn là động cơ tăng trưởng của thị trường. Khi nhóm này đang thua lỗ, họ tạo ra áp lực bán. Khi họ bắt đầu có lợi nhuận, họ mang lại tín hiệu đầu tiên về sự thay đổi tâm lý. Các cụm chi phí xếp chồng từ dưới lên là nền tảng của một cấu trúc xu hướng khỏe mạnh. Đó chính xác là sự đồng bộ đang bắt đầu hình thành ngay bây giờ. Mục tiêu tiếp theo là cụm 3-6 tháng: 88K. Đây là một mức kháng cự quan trọng cho Bitcoin. Nếu giá ổn định trên 88K, tất cả các cụm của nhóm ngắn hạn sẽ chuyển sang tích cực, những người nắm giữ ngắn hạn sẽ có lợi nhuận, và họ bắt đầu kể những câu chuyện thành công cho mọi người xung quanh. Đó sẽ là tín hiệu thực sự của một sự đảo chiều xu hướng. Nhưng có một rào cản mạnh cần vượt qua trước: 88K. Bạn có nghĩ rằng Bitcoin có thể phá vỡ trên 88K vào tháng 5 năm 2026 không? #Bitcoin #BTC #Phân Tích Giá BTC
64
·
--
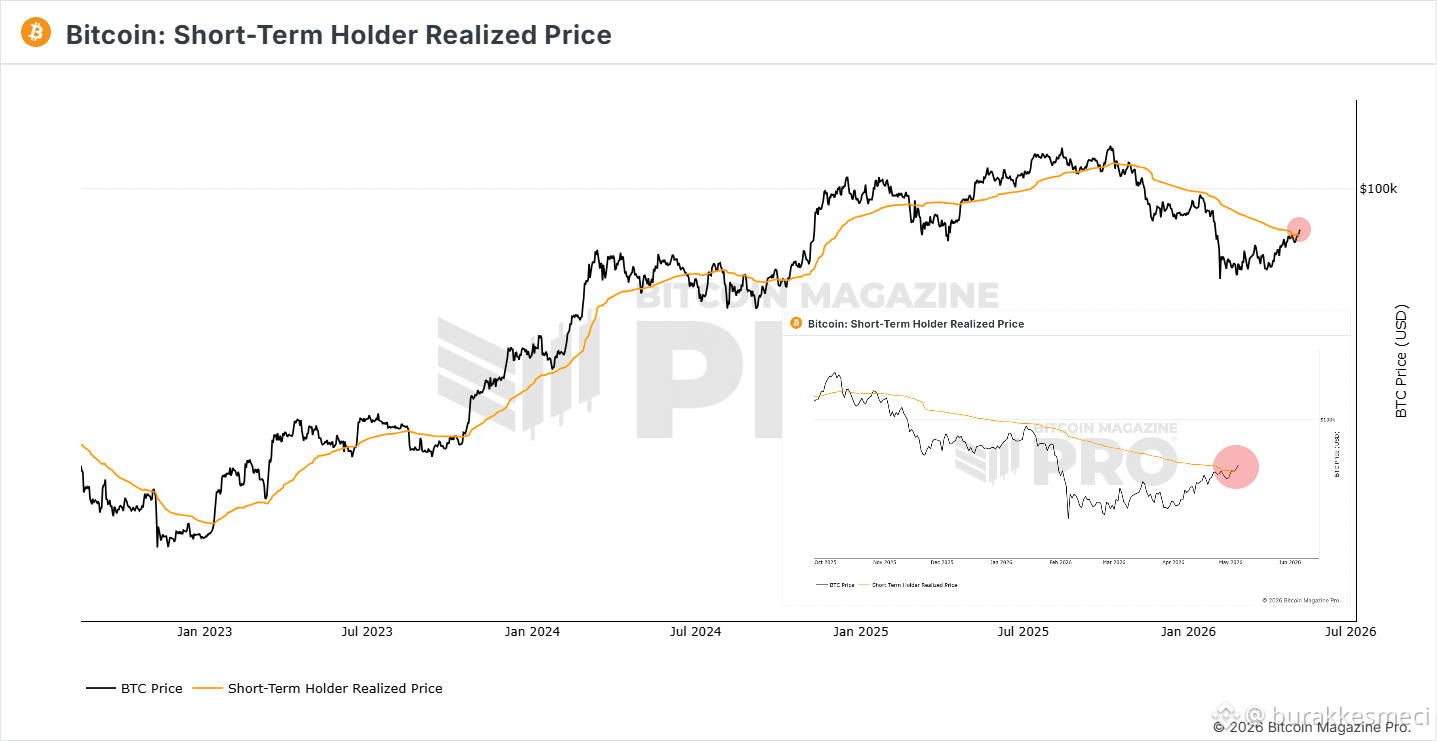
Không nhanh như vậy. Bitcoin đã lấy lại Giá Thực Hiện của Người Nắm Giữ Ngắn Hạn (~$79K) — mức giá cơ bản của những nhà đầu tư đã mua trong 155 ngày qua — nhưng một lần đóng cửa hàng ngày trên mức này chưa đủ để tuyên bố xu hướng tăng đã được khôi phục. Lịch sử cho thấy rằng trong các giai đoạn giảm giá, BTC có thể tạm thời xuyên thủng STH RP chỉ để bị từ chối và trượt trở lại dưới mức đó. Tín hiệu xác nhận thực sự sẽ là hai lần đóng cửa tuần liên tiếp trên STH RP. Cho đến khi điều đó xảy ra, mức này hoạt động nhiều hơn như một trần kháng cự hơn là một bệ phóng. Khuyến khích? Có. Quyết định? Chưa phải bây giờ.
Không nhanh như vậy. Bitcoin đã lấy lại Giá Thực Hiện của Người Nắm Giữ Ngắn Hạn (~$79K) — mức giá cơ bản của những nhà đầu tư đã mua trong 155 ngày qua — nhưng một lần đóng cửa hàng ngày trên mức này chưa đủ để tuyên bố xu hướng tăng đã được khôi phục. Lịch sử cho thấy rằng trong các giai đoạn giảm giá, BTC có thể tạm thời xuyên thủng STH RP chỉ để bị từ chối và trượt trở lại dưới mức đó. Tín hiệu xác nhận thực sự sẽ là hai lần đóng cửa tuần liên tiếp trên STH RP. Cho đến khi điều đó xảy ra, mức này hoạt động nhiều hơn như một trần kháng cự hơn là một bệ phóng. Khuyến khích? Có. Quyết định? Chưa phải bây giờ.
69
Đăng nhập để khám phá thêm nội dung
Tham gia cùng người dùng tiền mã hóa toàn cầu trên Binance Square
⚡️ Nhận thông tin mới nhất và hữu ích về tiền mã hóa.
💬 Được tin cậy bởi sàn giao dịch tiền mã hóa lớn nhất thế giới.
👍 Khám phá những thông tin chuyên sâu thực tế từ những nhà sáng tạo đã xác minh.
Email / Số điện thoại