
Zarrar_X 1
991 Bài đăng

Zarrar_X 1
Báo cáo
Chặn người dùng
DeFi Researcher || Crypto Analyst || Web3 explorer || one chart at a time.
0 Đang theo dõi
60 Người theo dõi
121 Đã thích
Bài đăng
·
--
Xem bản dịch
When comparing political gridlock in Washington with institutional capital flows from Wall Street, Wall Street selling moves Bitcoin faster and more violently in the short term.
– The Immediate Impact of Wall Street Flows
Capital behavior from traditional financial markets hits Bitcoin's order books instantly through spot ETFs, corporate treasury adjustments, and derivatives liquidations.
=> Liquidity Transmission: When Wall Street de-risks due to rising yields or macroeconomic tightening, spot selling and ETF outflows drain market depth within hours, triggering cascading liquidations across leveraged long positions.
=> Price Discovery Speed: Macro risk-off sentiment executed by institutional desks dictates immediate intraday volatility far quicker than legislative debates can progress.
– The Structural Impact of Washington Votes
Legislative actions and regulatory votes carry massive weight, but they operate on a fundamentally slower timeline.
=> Policy Gridlock vs. Progress: Regulatory stalemates or failed legislative bills (such as stalled market structure acts) create long-term headwinds or delays for institutional adoption, but they rarely cause sudden flash crashes.
=> The Exception: Sudden enforcement crackdowns or emergency executive actions can trigger sharp knee-jerk reactions, but routine congressional votes usually price in slowly over weeks.
Washington determines the rules of the road over multi-year horizons, but Wall Street capital flows control the immediate price velocity. Short-term market direction answers directly to liquidity and execution desks, not legislative calendars.
$BTC #BTC Price Analysis# #Macro Insights# #Crypto
When comparing political gridlock in Washington with institutional capital flows from Wall Street, Wall Street selling moves Bitcoin faster and more violently in the short term.
– The Immediate Impact of Wall Street Flows
Capital behavior from traditional financial markets hits Bitcoin's order books instantly through spot ETFs, corporate treasury adjustments, and derivatives liquidations.
=> Liquidity Transmission: When Wall Street de-risks due to rising yields or macroeconomic tightening, spot selling and ETF outflows drain market depth within hours, triggering cascading liquidations across leveraged long positions.
=> Price Discovery Speed: Macro risk-off sentiment executed by institutional desks dictates immediate intraday volatility far quicker than legislative debates can progress.
– The Structural Impact of Washington Votes
Legislative actions and regulatory votes carry massive weight, but they operate on a fundamentally slower timeline.
=> Policy Gridlock vs. Progress: Regulatory stalemates or failed legislative bills (such as stalled market structure acts) create long-term headwinds or delays for institutional adoption, but they rarely cause sudden flash crashes.
=> The Exception: Sudden enforcement crackdowns or emergency executive actions can trigger sharp knee-jerk reactions, but routine congressional votes usually price in slowly over weeks.
Washington determines the rules of the road over multi-year horizons, but Wall Street capital flows control the immediate price velocity. Short-term market direction answers directly to liquidity and execution desks, not legislative calendars.
$BTC #BTC Price Analysis# #Macro Insights# #Crypto
– The Immediate Impact of Wall Street Flows
Capital behavior from traditional financial markets hits Bitcoin's order books instantly through spot ETFs, corporate treasury adjustments, and derivatives liquidations.
=> Liquidity Transmission: When Wall Street de-risks due to rising yields or macroeconomic tightening, spot selling and ETF outflows drain market depth within hours, triggering cascading liquidations across leveraged long positions.
=> Price Discovery Speed: Macro risk-off sentiment executed by institutional desks dictates immediate intraday volatility far quicker than legislative debates can progress.
– The Structural Impact of Washington Votes
Legislative actions and regulatory votes carry massive weight, but they operate on a fundamentally slower timeline.
=> Policy Gridlock vs. Progress: Regulatory stalemates or failed legislative bills (such as stalled market structure acts) create long-term headwinds or delays for institutional adoption, but they rarely cause sudden flash crashes.
=> The Exception: Sudden enforcement crackdowns or emergency executive actions can trigger sharp knee-jerk reactions, but routine congressional votes usually price in slowly over weeks.
Washington determines the rules of the road over multi-year horizons, but Wall Street capital flows control the immediate price velocity. Short-term market direction answers directly to liquidity and execution desks, not legislative calendars.
$BTC #BTC Price Analysis# #Macro Insights# #Crypto

25
·
--
Xem bản dịch
Recent security breaches across multiple platforms highlight a harsh reality: centralized honeypots remain primary targets for sophisticated threat actors.
– Where Crypto Is Actually Vulnerable?
Centralized exchanges and custodial hot wallets hold massive pools of aggregated user capital under single administrative domains.
=> Hot Wallet Exposure: When attackers compromise server infrastructure or deploy spear-phishing vectors against internal systems, hot wallets connected directly to public networks are drained within minutes.
=> Third-Party Vendor Risks: Auxiliary integrations, plugins, and analytical service providers frequently serve as backdoor entry points into otherwise secure platforms.
– Where Crypto Is Actually Safe
True asset safety relies on eliminating third-party counterparty risk through self-custody architecture.
=> Hardware Wallets (Cold Storage): Offline devices (such as Ledger or Trezor) keep private keys isolated from internet-connected software. An attacker cannot drain funds remotely because transaction authorization requires physical button confirmation on the device.
=> Air-Gapped Setups: For maximum security, signing transactions via completely offline devices ensures that private keys never touch a network-connected interface.
=> Decentralized Custody with Caution: Interacting strictly with audited, non-custodial smart contracts reduces institutional platform risk, though user error and protocol exploits still require rigorous risk management.
Takeaway : Exchanges are designed for trading liquidity, not long-term storage. Keeping active capital exposed on custodial platforms leaves funds vulnerable to systemic network breaches—making self-custodial cold storage the only definitive baseline for protecting digital assets.
$BTC $ETH #BTC Price Analysis# #Macro Insights# #exploit
Recent security breaches across multiple platforms highlight a harsh reality: centralized honeypots remain primary targets for sophisticated threat actors.
– Where Crypto Is Actually Vulnerable?
Centralized exchanges and custodial hot wallets hold massive pools of aggregated user capital under single administrative domains.
=> Hot Wallet Exposure: When attackers compromise server infrastructure or deploy spear-phishing vectors against internal systems, hot wallets connected directly to public networks are drained within minutes.
=> Third-Party Vendor Risks: Auxiliary integrations, plugins, and analytical service providers frequently serve as backdoor entry points into otherwise secure platforms.
– Where Crypto Is Actually Safe
True asset safety relies on eliminating third-party counterparty risk through self-custody architecture.
=> Hardware Wallets (Cold Storage): Offline devices (such as Ledger or Trezor) keep private keys isolated from internet-connected software. An attacker cannot drain funds remotely because transaction authorization requires physical button confirmation on the device.
=> Air-Gapped Setups: For maximum security, signing transactions via completely offline devices ensures that private keys never touch a network-connected interface.
=> Decentralized Custody with Caution: Interacting strictly with audited, non-custodial smart contracts reduces institutional platform risk, though user error and protocol exploits still require rigorous risk management.
Takeaway : Exchanges are designed for trading liquidity, not long-term storage. Keeping active capital exposed on custodial platforms leaves funds vulnerable to systemic network breaches—making self-custodial cold storage the only definitive baseline for protecting digital assets.
$BTC $ETH #BTC Price Analysis# #Macro Insights# #exploit
– Where Crypto Is Actually Vulnerable?
Centralized exchanges and custodial hot wallets hold massive pools of aggregated user capital under single administrative domains.
=> Hot Wallet Exposure: When attackers compromise server infrastructure or deploy spear-phishing vectors against internal systems, hot wallets connected directly to public networks are drained within minutes.
=> Third-Party Vendor Risks: Auxiliary integrations, plugins, and analytical service providers frequently serve as backdoor entry points into otherwise secure platforms.
– Where Crypto Is Actually Safe
True asset safety relies on eliminating third-party counterparty risk through self-custody architecture.
=> Hardware Wallets (Cold Storage): Offline devices (such as Ledger or Trezor) keep private keys isolated from internet-connected software. An attacker cannot drain funds remotely because transaction authorization requires physical button confirmation on the device.
=> Air-Gapped Setups: For maximum security, signing transactions via completely offline devices ensures that private keys never touch a network-connected interface.
=> Decentralized Custody with Caution: Interacting strictly with audited, non-custodial smart contracts reduces institutional platform risk, though user error and protocol exploits still require rigorous risk management.
Takeaway : Exchanges are designed for trading liquidity, not long-term storage. Keeping active capital exposed on custodial platforms leaves funds vulnerable to systemic network breaches—making self-custodial cold storage the only definitive baseline for protecting digital assets.
$BTC $ETH #BTC Price Analysis# #Macro Insights# #exploit

25
·
--
Xem bản dịch
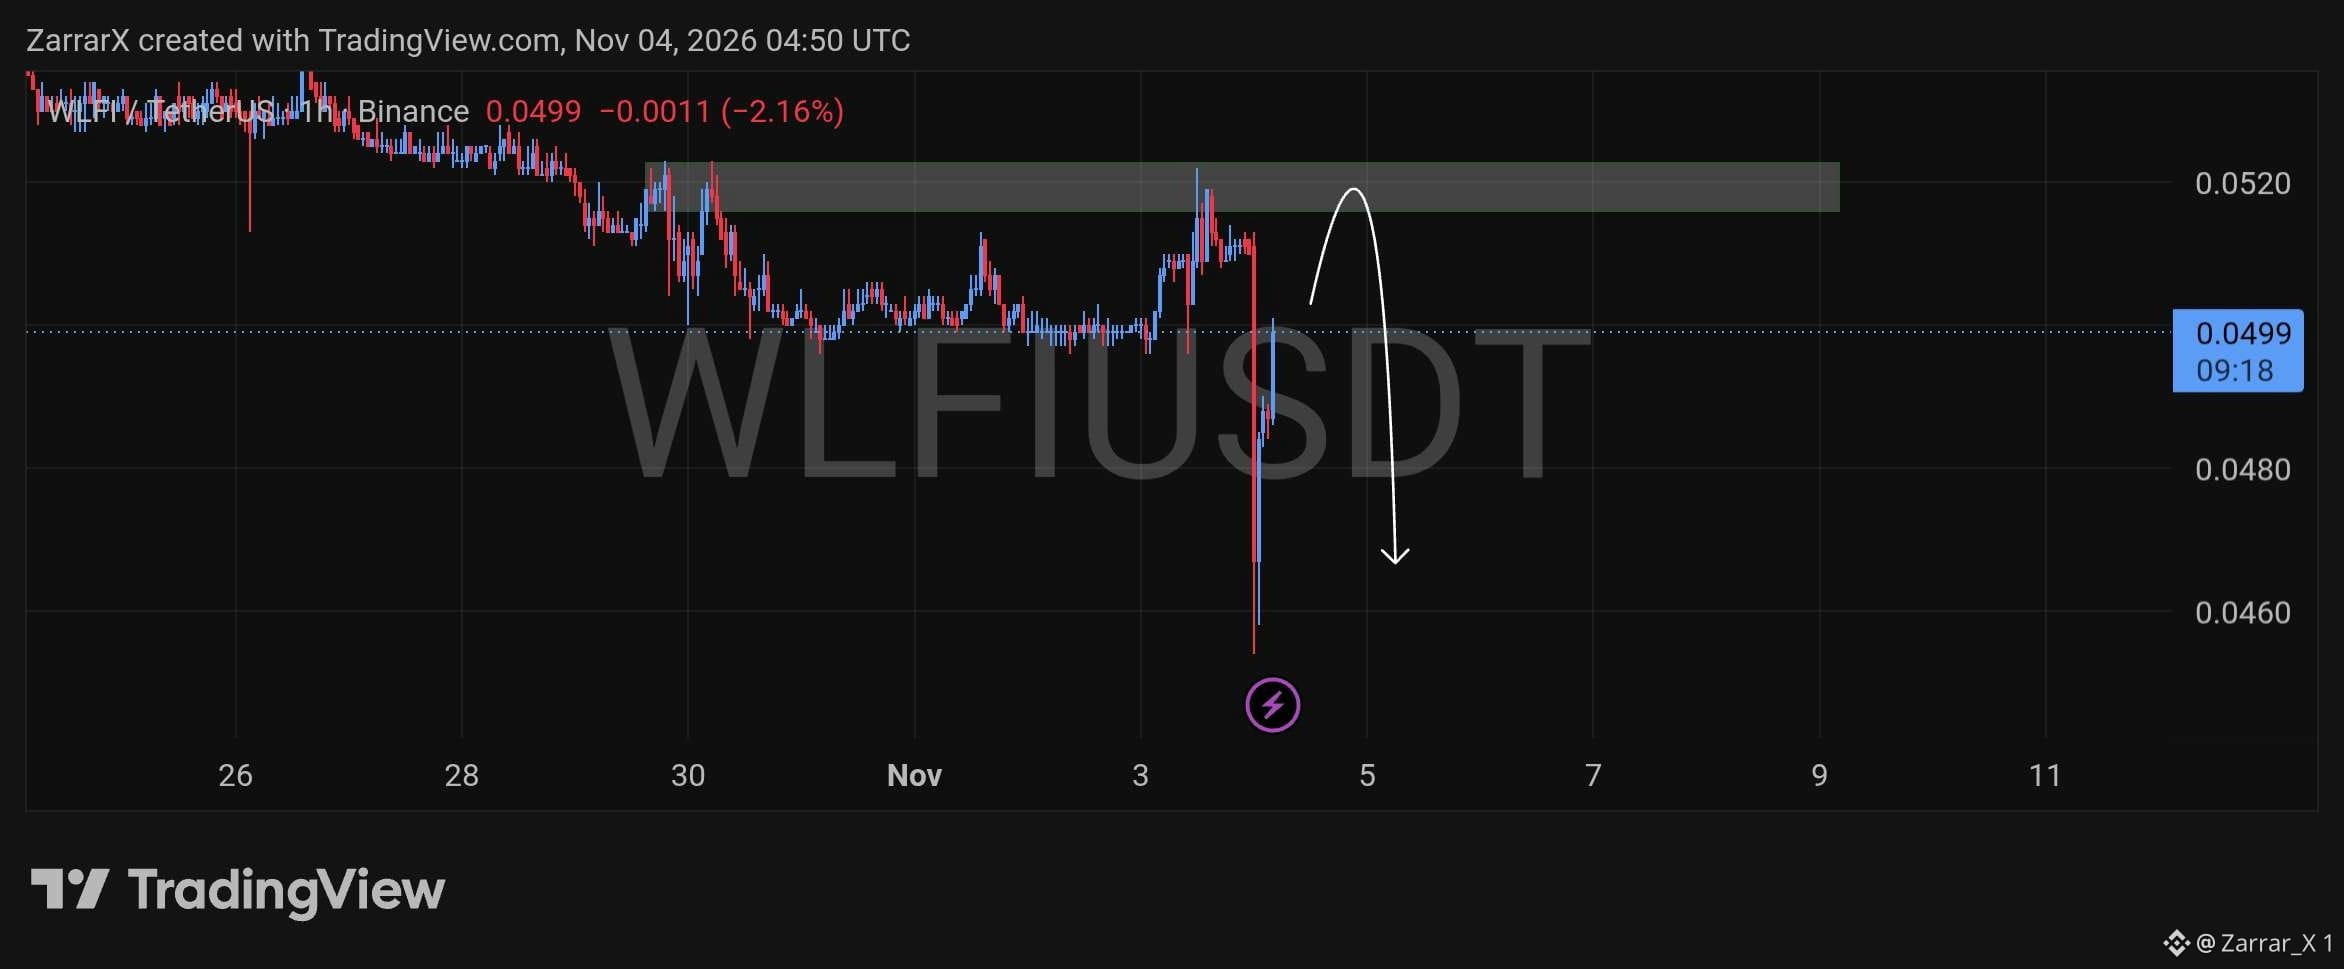
$WLFI executed a sharp corrective liquidation sweep on the 1-hour timeframe, plunging rapidly before finding a temporary foothold near $0.0499.
Price is interacting with an immediate overhead supply band and Fair Value Gap imbalance zone situated between $0.0510 and $0.0520, which acts as a strong institutional magnet.
The technical roadmap projects a brief corrective relief move upward into this overhead imbalance area to mitigate inefficiencies and trap late liquidity before continuation.
#Macro Insights# #Altcoin Season# #Crypto
$WLFI executed a sharp corrective liquidation sweep on the 1-hour timeframe, plunging rapidly before finding a temporary foothold near $0.0499.
Price is interacting with an immediate overhead supply band and Fair Value Gap imbalance zone situated between $0.0510 and $0.0520, which acts as a strong institutional magnet.
The technical roadmap projects a brief corrective relief move upward into this overhead imbalance area to mitigate inefficiencies and trap late liquidity before continuation.
#Macro Insights# #Altcoin Season# #Crypto
Price is interacting with an immediate overhead supply band and Fair Value Gap imbalance zone situated between $0.0510 and $0.0520, which acts as a strong institutional magnet.
The technical roadmap projects a brief corrective relief move upward into this overhead imbalance area to mitigate inefficiencies and trap late liquidity before continuation.
#Macro Insights# #Altcoin Season# #Crypto
35
·
--
Xem bản dịch
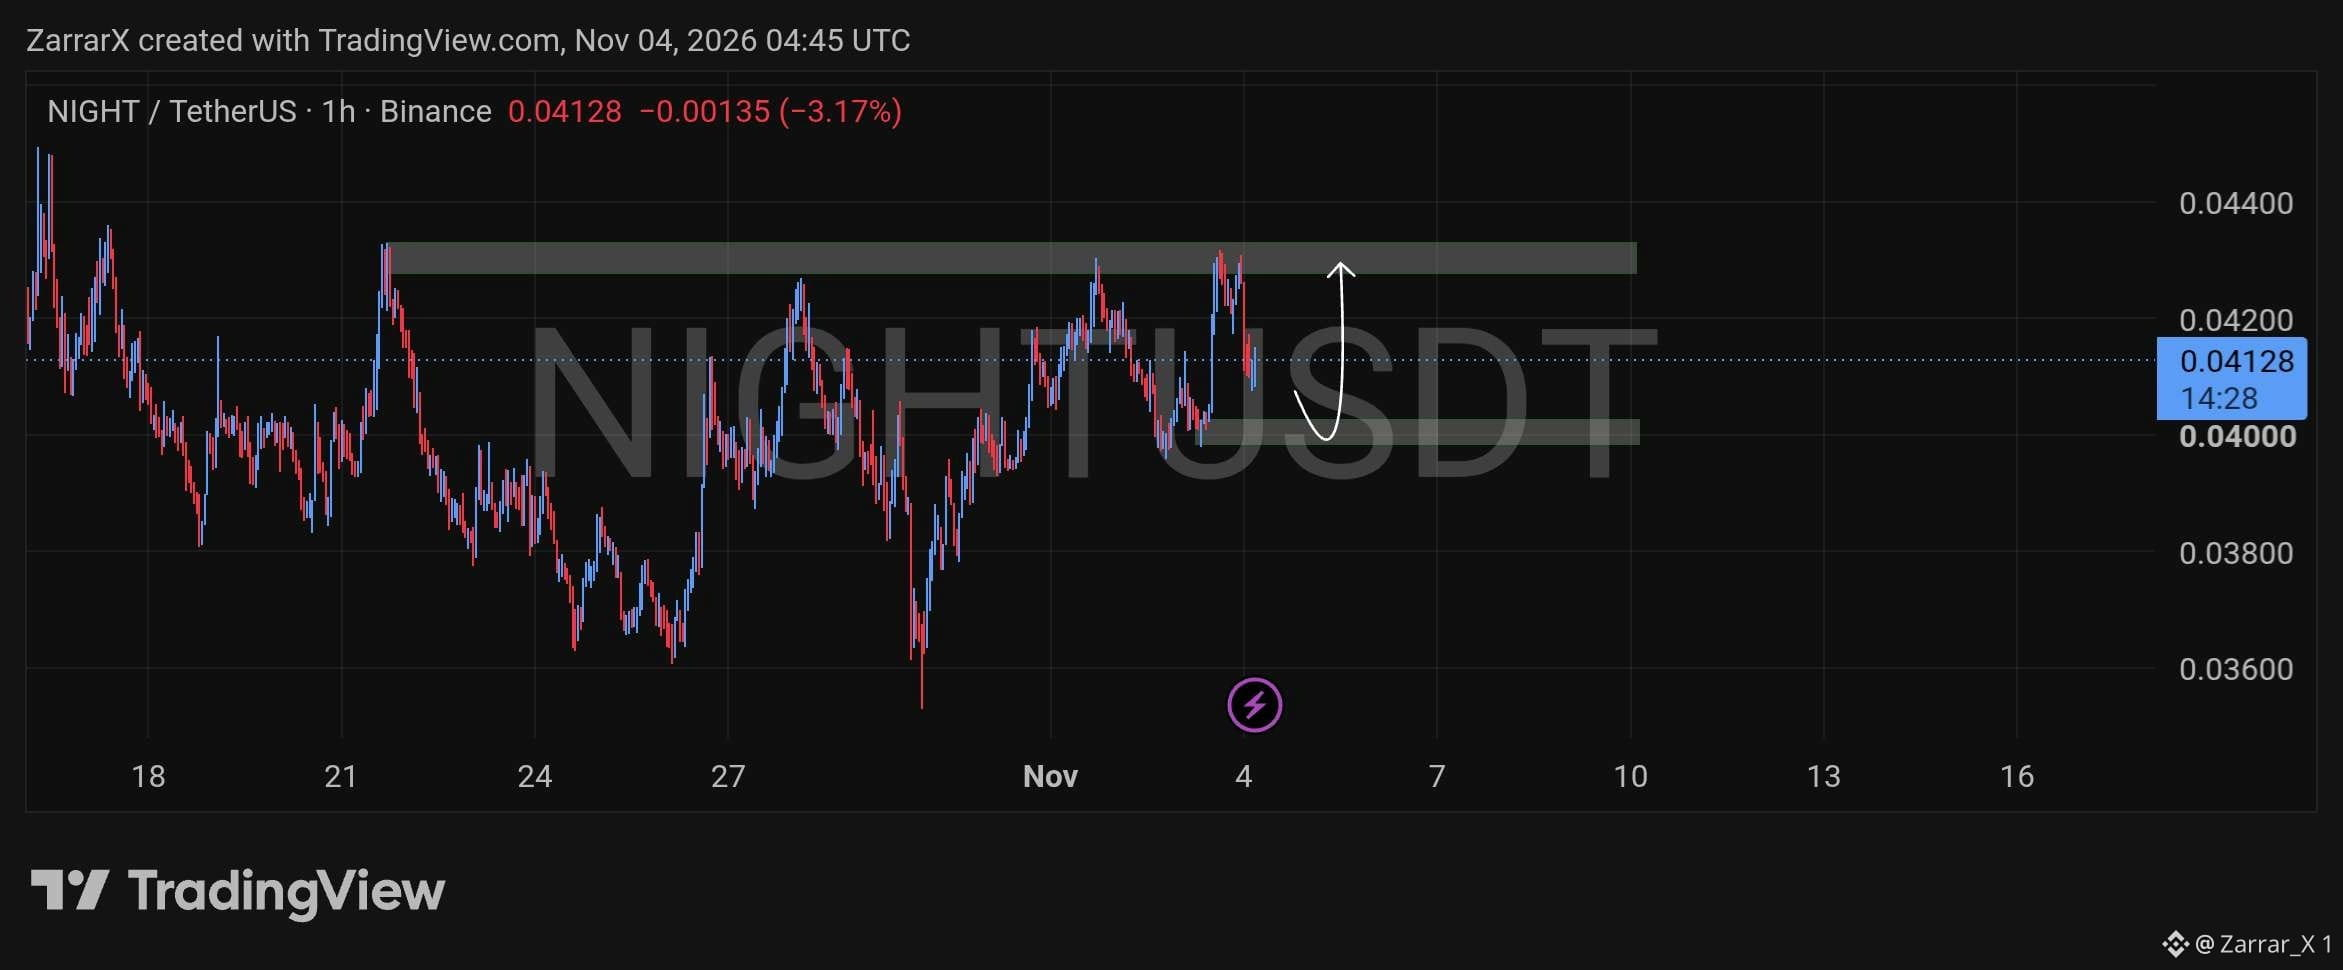
$NIGHT is taking a breather around $0.04128 after testing the upper boundary of its recent trading range. The latest price action suggests buyers are struggling to push higher, with the market still lacking a clear breakout direction.
The $0.04250–$0.04350 region remains the immediate resistance to watch. #NIGHT could make another attempt toward this supply band, but sellers may step in again if buying pressure remains weak.
Before that happens, a small pullback toward the $0.04000 demand area is possible. This zone could attract fresh buying interest and provide the support needed for another attempt at the upper boundary.
I'd be watching how price reacts around $0.04000 rather than rushing into the current range. A successful defence could keep the recovery scenario alive, while a loss of that level would put further downside on the table.
#BNBChain# #Altcoin Season#
$NIGHT is taking a breather around $0.04128 after testing the upper boundary of its recent trading range. The latest price action suggests buyers are struggling to push higher, with the market still lacking a clear breakout direction.
The $0.04250–$0.04350 region remains the immediate resistance to watch. #NIGHT could make another attempt toward this supply band, but sellers may step in again if buying pressure remains weak.
Before that happens, a small pullback toward the $0.04000 demand area is possible. This zone could attract fresh buying interest and provide the support needed for another attempt at the upper boundary.
I'd be watching how price reacts around $0.04000 rather than rushing into the current range. A successful defence could keep the recovery scenario alive, while a loss of that level would put further downside on the table.
#BNBChain# #Altcoin Season#
The $0.04250–$0.04350 region remains the immediate resistance to watch. #NIGHT could make another attempt toward this supply band, but sellers may step in again if buying pressure remains weak.
Before that happens, a small pullback toward the $0.04000 demand area is possible. This zone could attract fresh buying interest and provide the support needed for another attempt at the upper boundary.
I'd be watching how price reacts around $0.04000 rather than rushing into the current range. A successful defence could keep the recovery scenario alive, while a loss of that level would put further downside on the table.
#BNBChain# #Altcoin Season#
56
·
--
Xem bản dịch
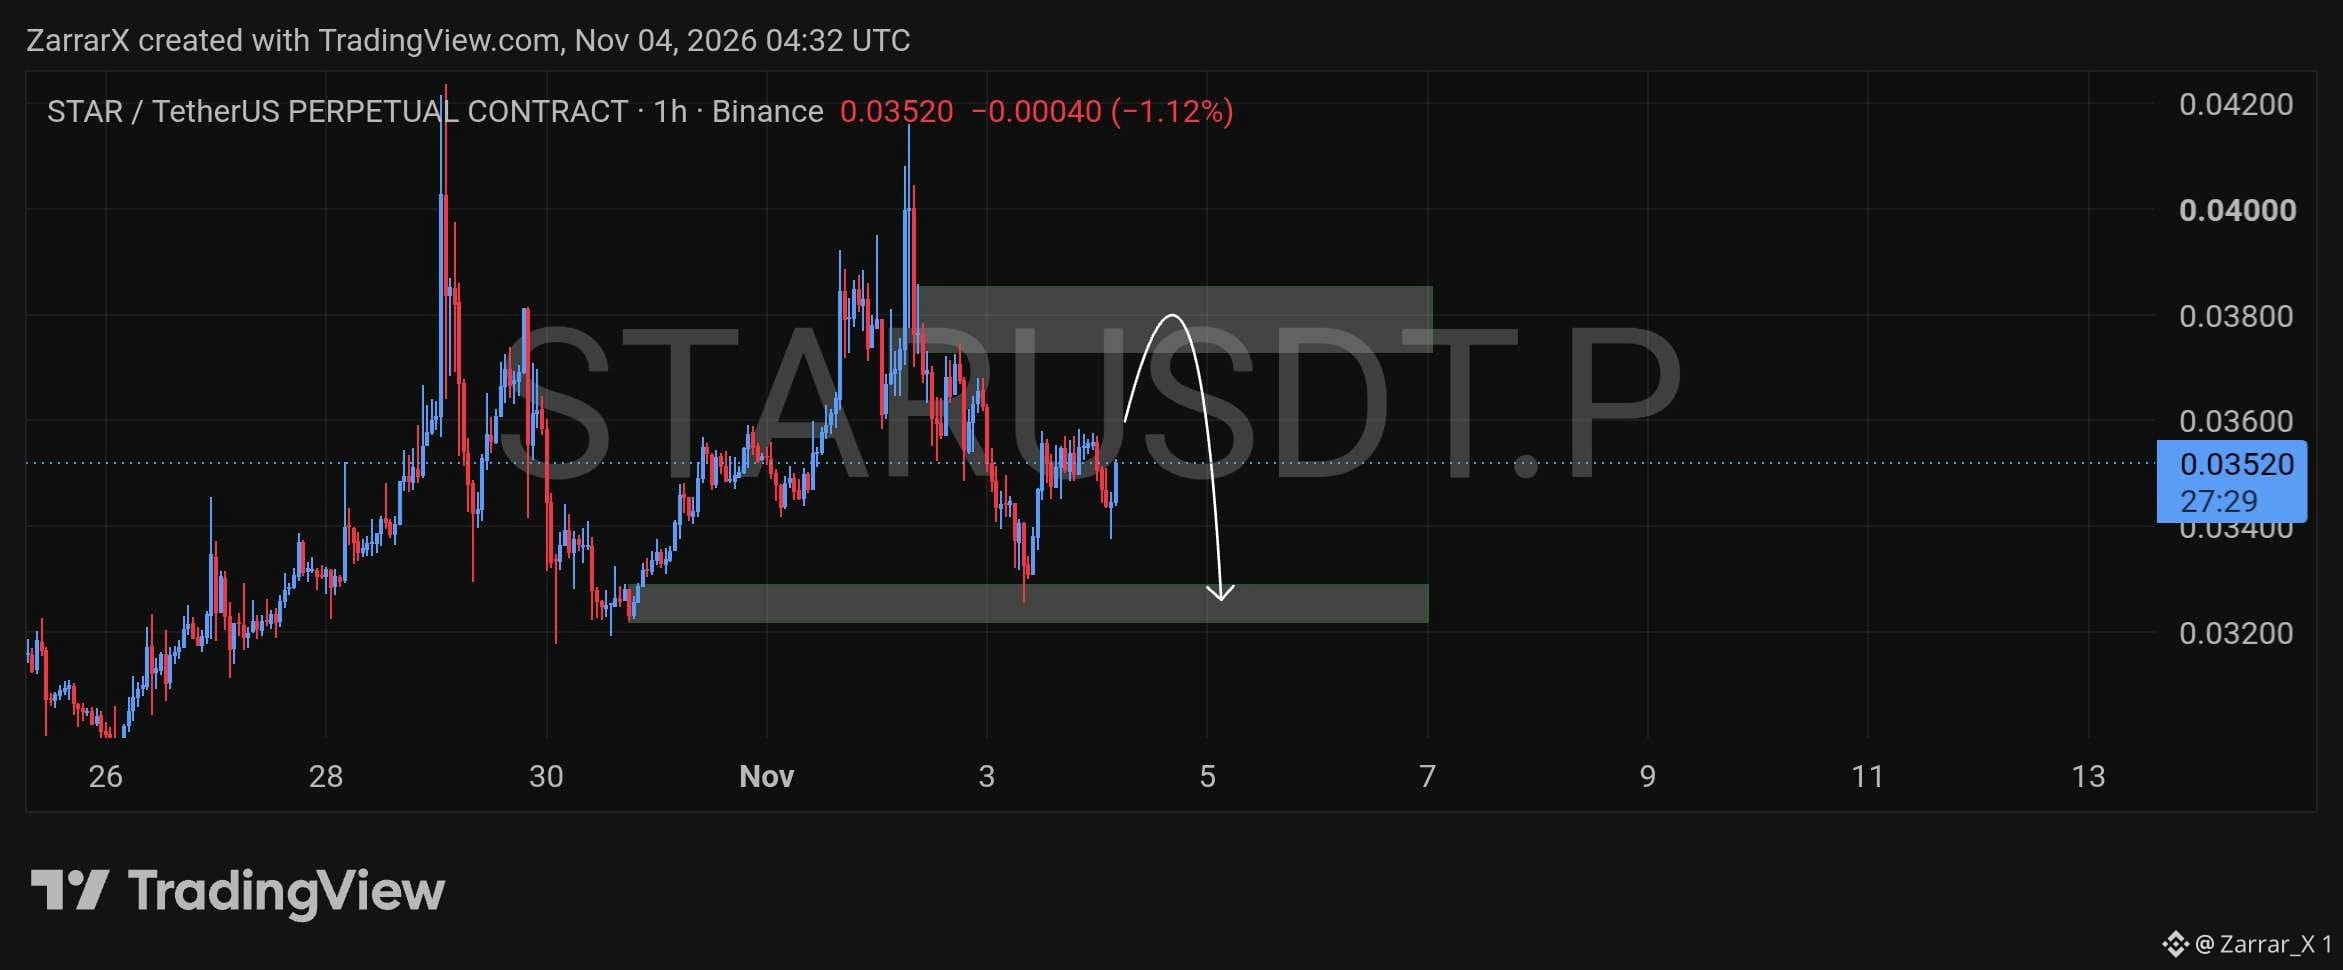
$STAR has been moving sideways after facing rejection around its recent local highs. Price is currently hovering near $0.03520, with neither buyers nor sellers showing enough strength to establish a clear direction. The consolidation comes after an earlier attempt to push higher.
The immediate hurdle sits around $0.03750–$0.03850, where overhead supply could limit another recovery attempt. A revisit to this region is still possible, but the reaction there will be important in determining whether buyers have enough momentum to push beyond the recent highs.
There is also a lower demand area around $0.03200–$0.03300 that deserves attention. Price could make another attempt toward the upper supply before eventually rotating lower to test this zone, particularly if buying pressure starts to fade.
Rather than chasing the current consolidation, I'd pay closer attention to how price reacts at both ends of the range. A rejection from the upper band could reinforce the downside scenario, while a strong break above it would challenge the expected pullback.
#STARS #Altcoin Season# #Meme Alpha#
$STAR has been moving sideways after facing rejection around its recent local highs. Price is currently hovering near $0.03520, with neither buyers nor sellers showing enough strength to establish a clear direction. The consolidation comes after an earlier attempt to push higher.
The immediate hurdle sits around $0.03750–$0.03850, where overhead supply could limit another recovery attempt. A revisit to this region is still possible, but the reaction there will be important in determining whether buyers have enough momentum to push beyond the recent highs.
There is also a lower demand area around $0.03200–$0.03300 that deserves attention. Price could make another attempt toward the upper supply before eventually rotating lower to test this zone, particularly if buying pressure starts to fade.
Rather than chasing the current consolidation, I'd pay closer attention to how price reacts at both ends of the range. A rejection from the upper band could reinforce the downside scenario, while a strong break above it would challenge the expected pullback.
#STARS #Altcoin Season# #Meme Alpha#
The immediate hurdle sits around $0.03750–$0.03850, where overhead supply could limit another recovery attempt. A revisit to this region is still possible, but the reaction there will be important in determining whether buyers have enough momentum to push beyond the recent highs.
There is also a lower demand area around $0.03200–$0.03300 that deserves attention. Price could make another attempt toward the upper supply before eventually rotating lower to test this zone, particularly if buying pressure starts to fade.
Rather than chasing the current consolidation, I'd pay closer attention to how price reacts at both ends of the range. A rejection from the upper band could reinforce the downside scenario, while a strong break above it would challenge the expected pullback.
#STARS #Altcoin Season# #Meme Alpha#
51
·
--
Xem bản dịch
Nearly $751M in Bitcoin Reportedly Flows Into Binance.
On-chain tracking data shows an aggregated inflow of 9,722.17 $BTC, worth approximately $751 million, to Binance. The sizeable movement has raised questions about whether large holders are preparing to sell or reposition their assets.
Some market participants have linked the inflow to Binance’s recent reported security breach, suggesting the exchange could face pressure to recover losses. However, there is no confirmed evidence that Binance intends to sell Bitcoin or deliberately push the market lower.
Large exchange inflows can signal potential selling pressure, but they can also reflect internal transfers, custody movements or other operational activity. Traders should watch for actual selling activity and broader market reactions before treating this transfer as a bearish signal.
$XRP #BTC Price Analysis# #Macro Insights# #Crypto
Nearly $751M in Bitcoin Reportedly Flows Into Binance.
On-chain tracking data shows an aggregated inflow of 9,722.17 $BTC, worth approximately $751 million, to Binance. The sizeable movement has raised questions about whether large holders are preparing to sell or reposition their assets.
Some market participants have linked the inflow to Binance’s recent reported security breach, suggesting the exchange could face pressure to recover losses. However, there is no confirmed evidence that Binance intends to sell Bitcoin or deliberately push the market lower.
Large exchange inflows can signal potential selling pressure, but they can also reflect internal transfers, custody movements or other operational activity. Traders should watch for actual selling activity and broader market reactions before treating this transfer as a bearish signal.
$XRP #BTC Price Analysis# #Macro Insights# #Crypto
On-chain tracking data shows an aggregated inflow of 9,722.17 $BTC, worth approximately $751 million, to Binance. The sizeable movement has raised questions about whether large holders are preparing to sell or reposition their assets.
Some market participants have linked the inflow to Binance’s recent reported security breach, suggesting the exchange could face pressure to recover losses. However, there is no confirmed evidence that Binance intends to sell Bitcoin or deliberately push the market lower.
Large exchange inflows can signal potential selling pressure, but they can also reflect internal transfers, custody movements or other operational activity. Traders should watch for actual selling activity and broader market reactions before treating this transfer as a bearish signal.
$XRP #BTC Price Analysis# #Macro Insights# #Crypto
29
·
--
Xem bản dịch
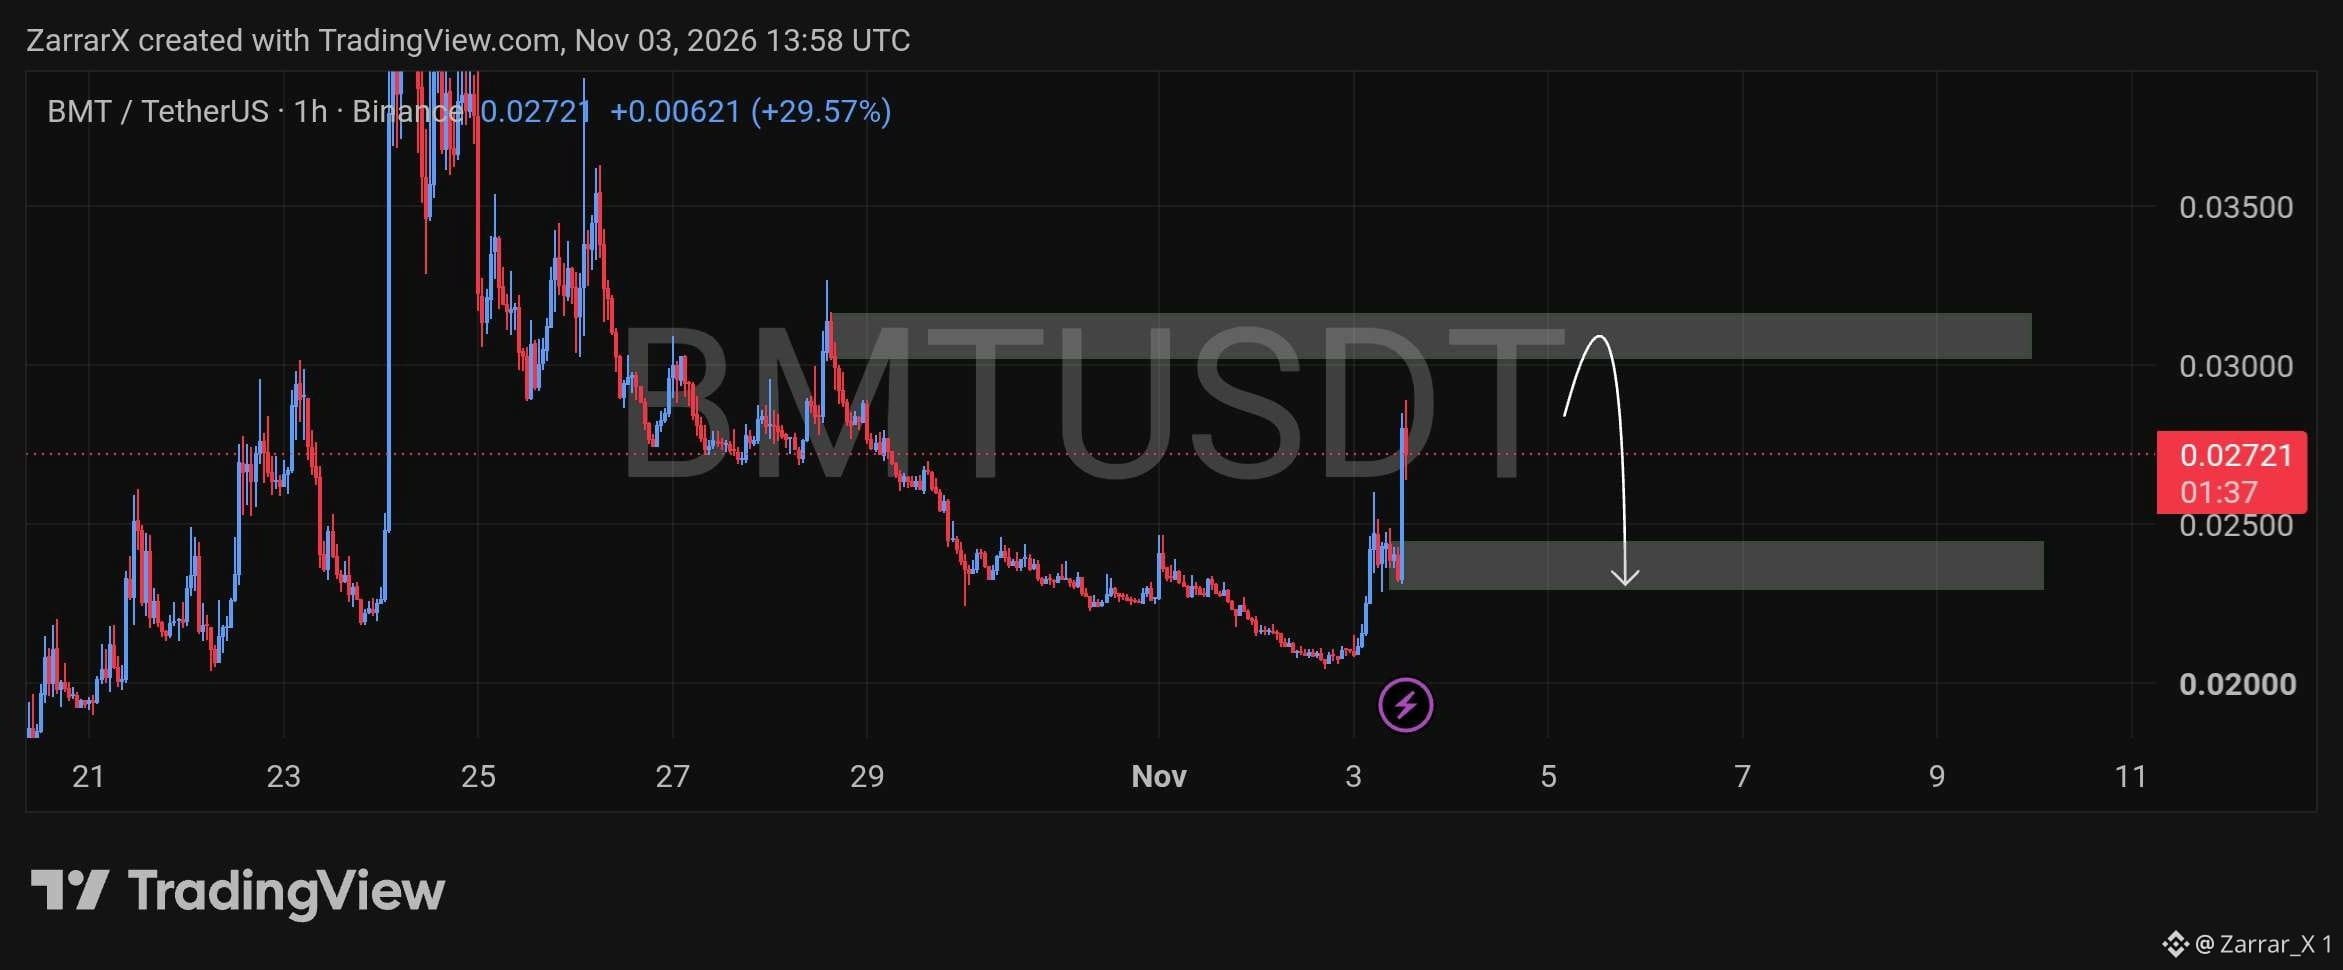
$BMT has finally shown some signs of life after spending several sessions under sustained selling pressure. The latest move has lifted price from around $0.0210 to approximately $0.0272, marking a nearly 30% recovery. While the sudden buying interest is encouraging, the broader chart still shows a declining structure.
One area worth watching is the $0.0300–$0.0315 region, which stands out as the next resistance zone. A move toward this area could provide another test for buyers, although the previous price action suggests sellers may not give up that territory easily.
If the rally loses steam, the $0.0230–$0.0245 region could become the next point of interest. This area may offer a chance for price to stabilize after the recent jump, particularly if buyers manage to defend it during a pullback.
The recovery is promising, but it is still too early to call it a trend reversal. #BMTUSDT needs to show that it can hold onto its recent gains rather than give them back immediately. I'd be watching the reaction around the lower zone closely, as it could reveal whether this is the beginning of a broader recovery or simply a temporary bounce.
#Altcoin Season# #Crypto
$BMT has finally shown some signs of life after spending several sessions under sustained selling pressure. The latest move has lifted price from around $0.0210 to approximately $0.0272, marking a nearly 30% recovery. While the sudden buying interest is encouraging, the broader chart still shows a declining structure.
One area worth watching is the $0.0300–$0.0315 region, which stands out as the next resistance zone. A move toward this area could provide another test for buyers, although the previous price action suggests sellers may not give up that territory easily.
If the rally loses steam, the $0.0230–$0.0245 region could become the next point of interest. This area may offer a chance for price to stabilize after the recent jump, particularly if buyers manage to defend it during a pullback.
The recovery is promising, but it is still too early to call it a trend reversal. #BMTUSDT needs to show that it can hold onto its recent gains rather than give them back immediately. I'd be watching the reaction around the lower zone closely, as it could reveal whether this is the beginning of a broader recovery or simply a temporary bounce.
#Altcoin Season# #Crypto
One area worth watching is the $0.0300–$0.0315 region, which stands out as the next resistance zone. A move toward this area could provide another test for buyers, although the previous price action suggests sellers may not give up that territory easily.
If the rally loses steam, the $0.0230–$0.0245 region could become the next point of interest. This area may offer a chance for price to stabilize after the recent jump, particularly if buyers manage to defend it during a pullback.
The recovery is promising, but it is still too early to call it a trend reversal. #BMTUSDT needs to show that it can hold onto its recent gains rather than give them back immediately. I'd be watching the reaction around the lower zone closely, as it could reveal whether this is the beginning of a broader recovery or simply a temporary bounce.
#Altcoin Season# #Crypto
44
·
--
Xem bản dịch
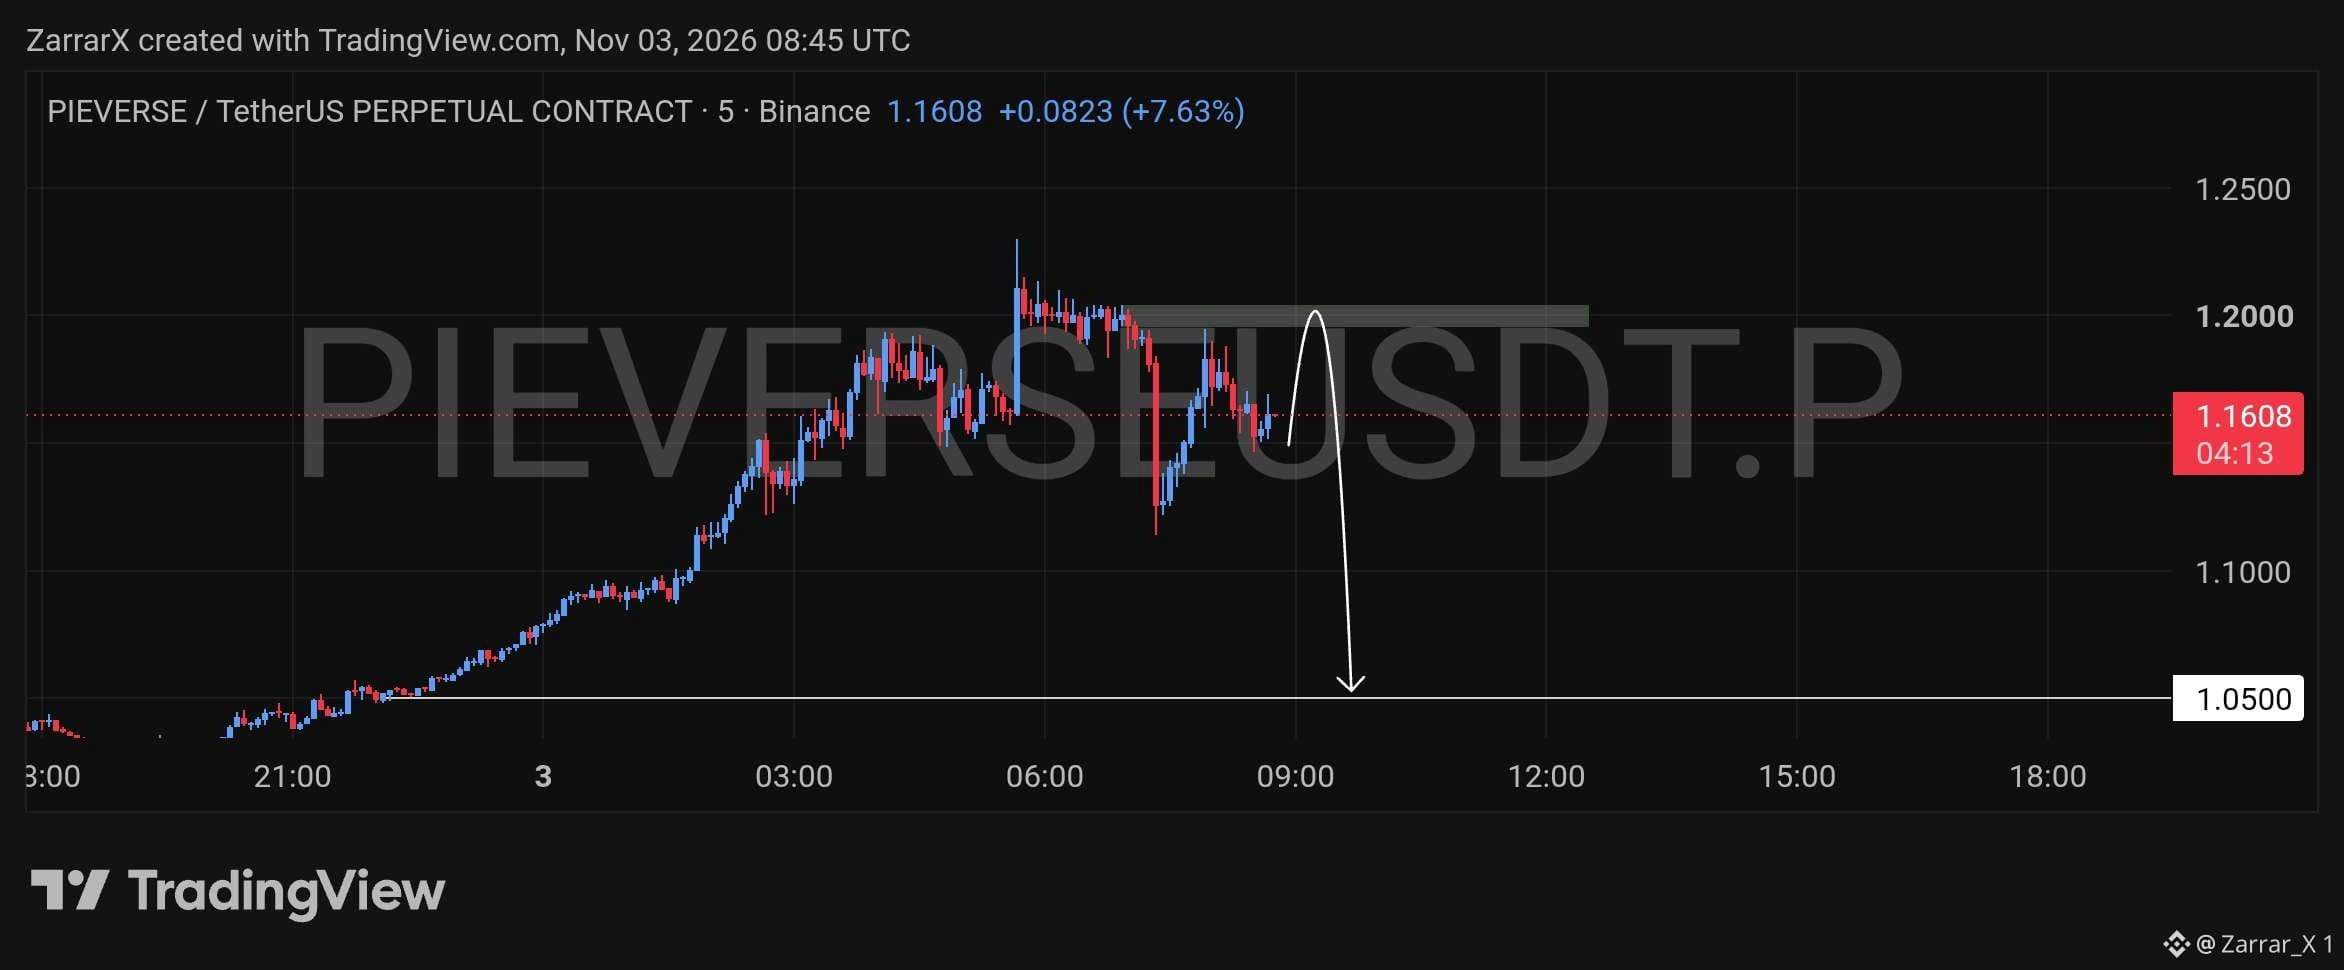
$PIEVERSE PIEVERSE has enjoyed a strong upward move, climbing from around $1.04 to briefly trade above $1.20. However, the latest candles show some hesitation after that rally, with price pulling back from the highs and struggling to regain its previous momentum. The market is beginning to show signs of exhaustion in the short term.
At approximately $1.1608, PIEVERSE is approaching an interesting area, but the $1.1950–$1.2050 region remains the immediate resistance to watch. Another attempt toward this zone could attract sellers, particularly given the rejection seen during the earlier rally.
If the rejection continues, I'd keep an eye on $1.0500 as the next major downside reference. That's a considerable distance from current price, but the chart suggests a deeper correction could develop if buyers fail to reclaim the upper region. A sustained loss of momentum would make that possibility more relevant.
#PIEVERSE #Altcoin Season# #Crypto
The important thing now is how price behaves around the current levels rather than assuming the rally will continue. After such a sharp advance, some profit-taking wouldn't be unusual. A rejection near $1.20 could open the door to further downside, while a convincing break above that supply would weaken the bearish outlook.
$PIEVERSE PIEVERSE has enjoyed a strong upward move, climbing from around $1.04 to briefly trade above $1.20. However, the latest candles show some hesitation after that rally, with price pulling back from the highs and struggling to regain its previous momentum. The market is beginning to show signs of exhaustion in the short term.
At approximately $1.1608, PIEVERSE is approaching an interesting area, but the $1.1950–$1.2050 region remains the immediate resistance to watch. Another attempt toward this zone could attract sellers, particularly given the rejection seen during the earlier rally.
If the rejection continues, I'd keep an eye on $1.0500 as the next major downside reference. That's a considerable distance from current price, but the chart suggests a deeper correction could develop if buyers fail to reclaim the upper region. A sustained loss of momentum would make that possibility more relevant.
#PIEVERSE #Altcoin Season# #Crypto
The important thing now is how price behaves around the current levels rather than assuming the rally will continue. After such a sharp advance, some profit-taking wouldn't be unusual. A rejection near $1.20 could open the door to further downside, while a convincing break above that supply would weaken the bearish outlook.
At approximately $1.1608, PIEVERSE is approaching an interesting area, but the $1.1950–$1.2050 region remains the immediate resistance to watch. Another attempt toward this zone could attract sellers, particularly given the rejection seen during the earlier rally.
If the rejection continues, I'd keep an eye on $1.0500 as the next major downside reference. That's a considerable distance from current price, but the chart suggests a deeper correction could develop if buyers fail to reclaim the upper region. A sustained loss of momentum would make that possibility more relevant.
#PIEVERSE #Altcoin Season# #Crypto
The important thing now is how price behaves around the current levels rather than assuming the rally will continue. After such a sharp advance, some profit-taking wouldn't be unusual. A rejection near $1.20 could open the door to further downside, while a convincing break above that supply would weaken the bearish outlook.
49
·
--
Xem bản dịch
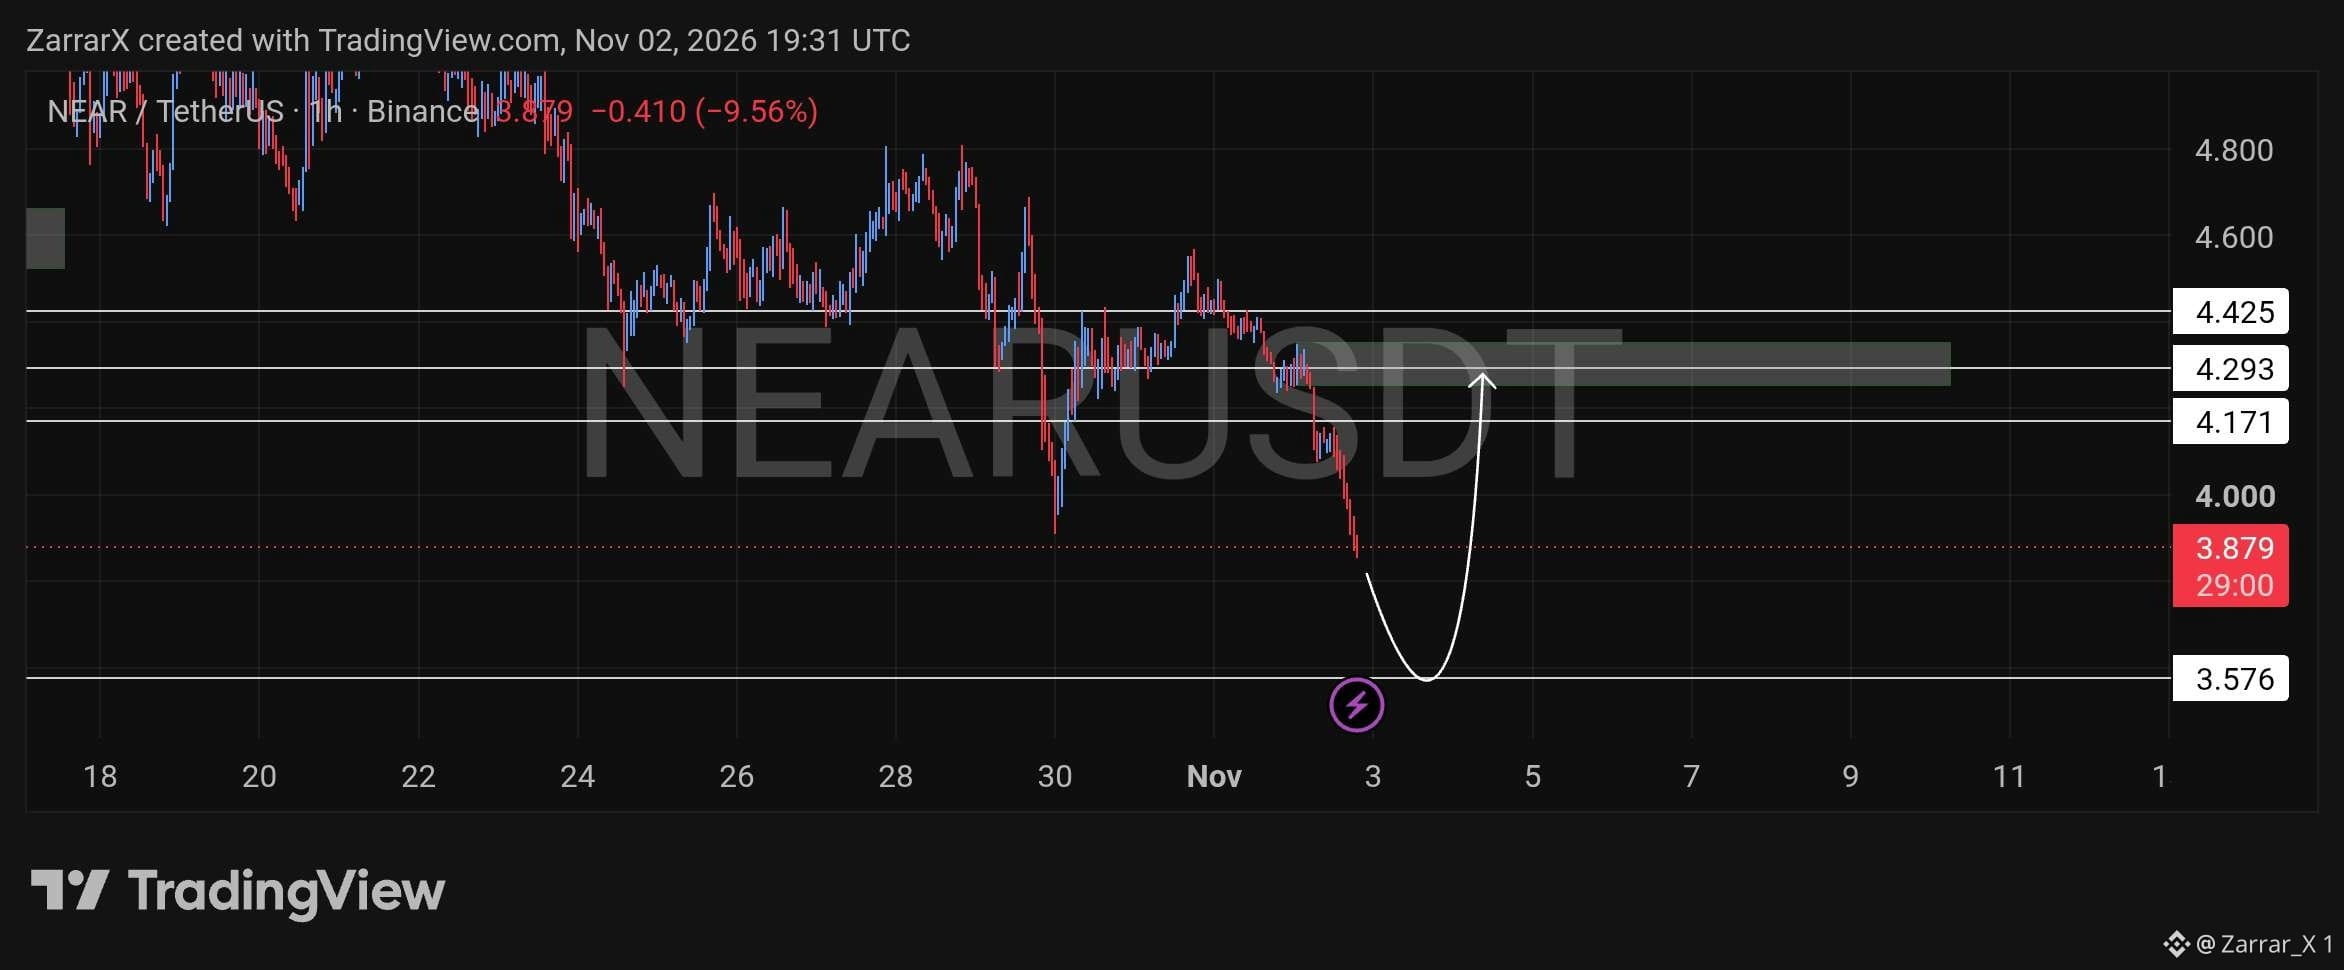
$NEAR has taken another leg lower after failing to sustain its recovery attempts around the $4.30 region. The latest sell-off has pushed price down to approximately $3.879, extending the weakness that has been building since the October 31 rejection. Sellers are clearly having the upper hand in the immediate structure.
The level I'd be watching closely now is $3.576, which stands out as the next important downside area. With price trading below the previous support region, a further decline toward this level remains possible before any meaningful recovery develops.
If buyers manage to establish a base around $3.576, attention could gradually shift back toward the $4.171–$4.293 region. This area previously acted as an important trading zone and could become the first major hurdle during a recovery. Beyond that, $4.425 remains another resistance reference.
For now, there isn't much evidence of a convincing reversal. A reaction at lower support could change the short-term picture, but until then, I'd be cautious about treating minor rebounds as a trend change. The next move around $3.576 should provide a clearer indication of whether buyers are ready to step back in.
#NEAR #Macro Insights# #Altcoin Season#
$NEAR has taken another leg lower after failing to sustain its recovery attempts around the $4.30 region. The latest sell-off has pushed price down to approximately $3.879, extending the weakness that has been building since the October 31 rejection. Sellers are clearly having the upper hand in the immediate structure.
The level I'd be watching closely now is $3.576, which stands out as the next important downside area. With price trading below the previous support region, a further decline toward this level remains possible before any meaningful recovery develops.
If buyers manage to establish a base around $3.576, attention could gradually shift back toward the $4.171–$4.293 region. This area previously acted as an important trading zone and could become the first major hurdle during a recovery. Beyond that, $4.425 remains another resistance reference.
For now, there isn't much evidence of a convincing reversal. A reaction at lower support could change the short-term picture, but until then, I'd be cautious about treating minor rebounds as a trend change. The next move around $3.576 should provide a clearer indication of whether buyers are ready to step back in.
#NEAR #Macro Insights# #Altcoin Season#
The level I'd be watching closely now is $3.576, which stands out as the next important downside area. With price trading below the previous support region, a further decline toward this level remains possible before any meaningful recovery develops.
If buyers manage to establish a base around $3.576, attention could gradually shift back toward the $4.171–$4.293 region. This area previously acted as an important trading zone and could become the first major hurdle during a recovery. Beyond that, $4.425 remains another resistance reference.
For now, there isn't much evidence of a convincing reversal. A reaction at lower support could change the short-term picture, but until then, I'd be cautious about treating minor rebounds as a trend change. The next move around $3.576 should provide a clearer indication of whether buyers are ready to step back in.
#NEAR #Macro Insights# #Altcoin Season#
73
·
--
Xem bản dịch
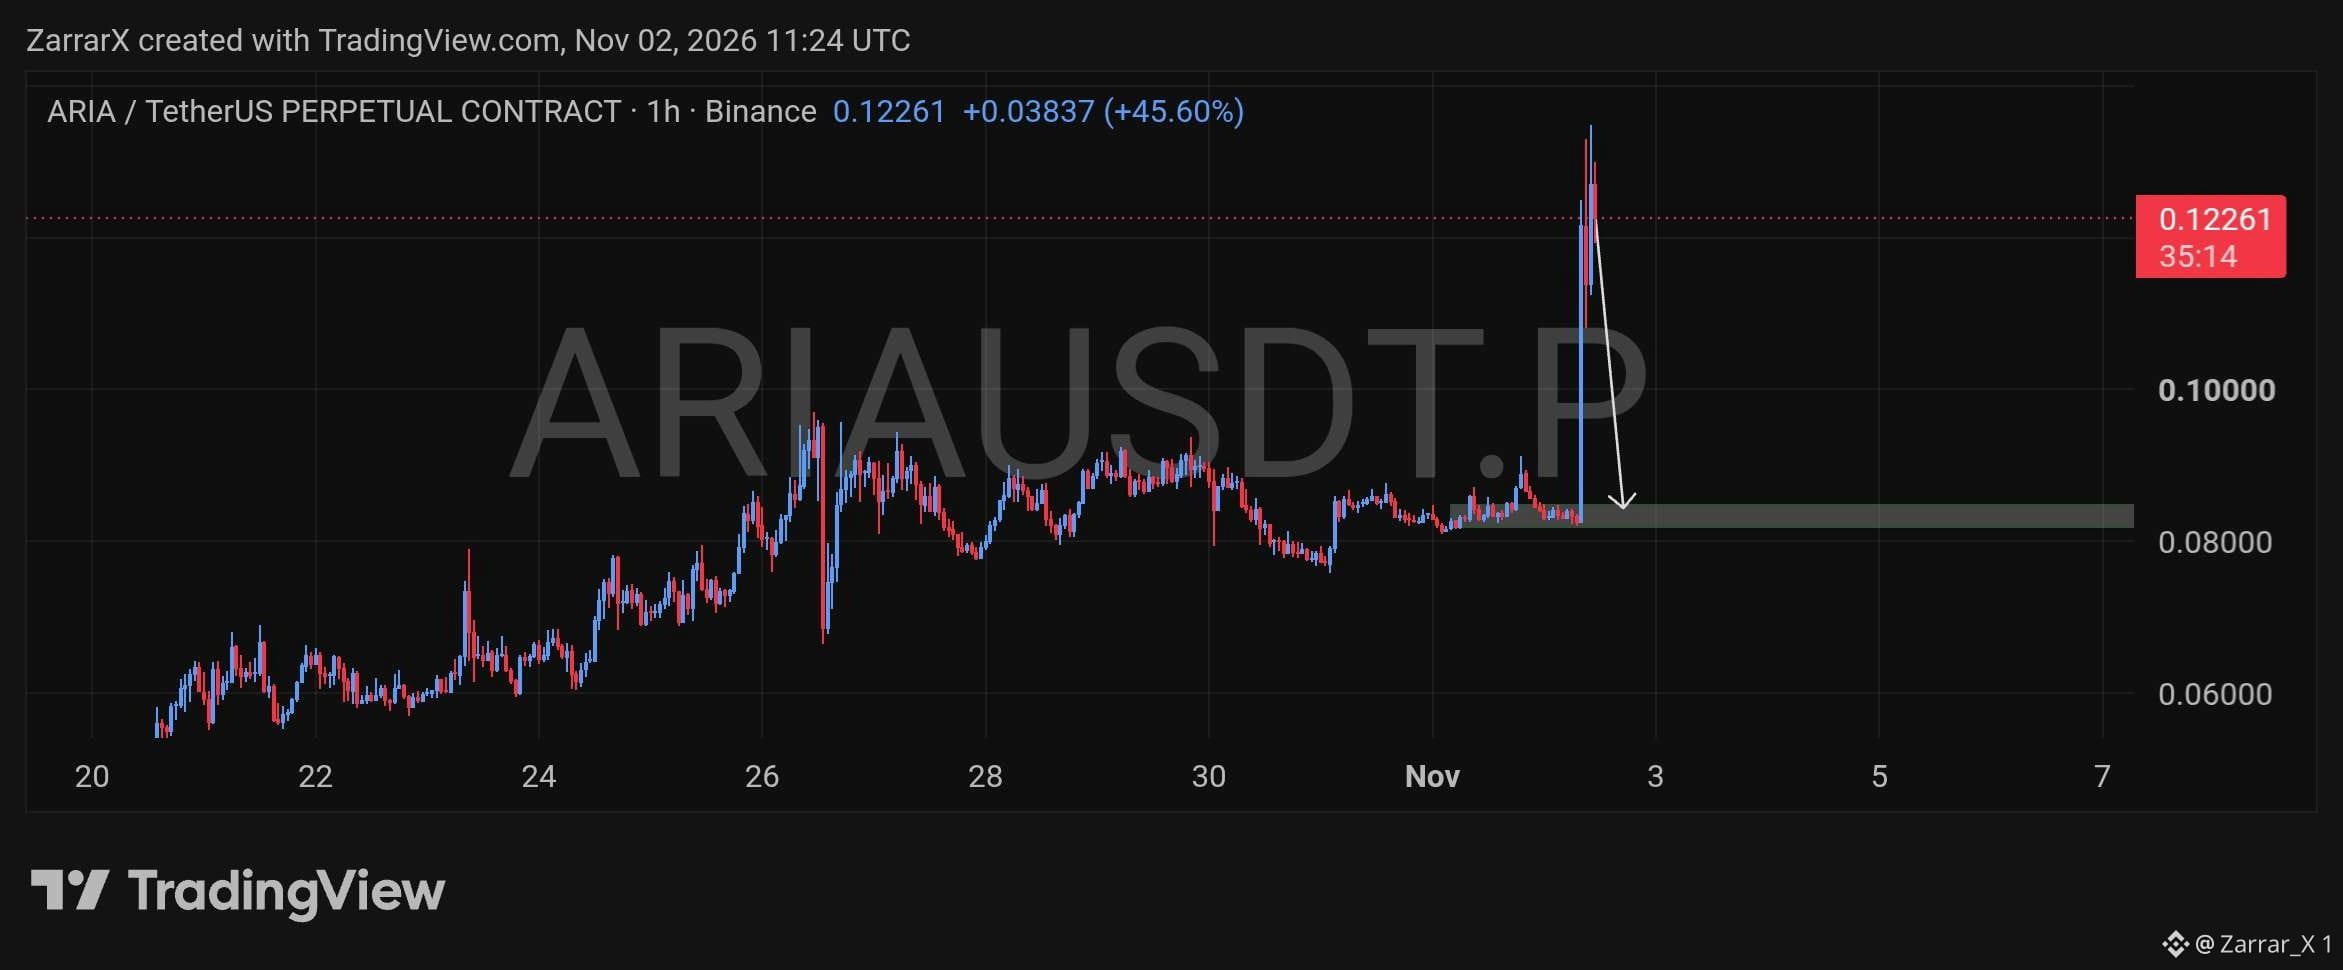
The latest move in $ARIA is quite aggressive, with price jumping nearly 46% in a single session and breaking well above its previous consolidation range. The rally pushed price from around $0.0830 to a high above $0.1300, but the immediate reaction suggests traders may start locking in profits after such a sharp expansion.
At around $0.1226, price is trading considerably above its previous range. The $0.0820–$0.0850 region is the important support area to watch. It previously acted as a consolidation base, and a return toward that zone would give the market an opportunity to test whether buyers are still willing to defend the breakout.
A pullback would not be particularly surprising here. If price gradually retraces and finds demand around that former range, it could provide a healthier foundation for another recovery attempt. On the other hand, losing that area would raise questions about how much of the recent breakout can actually be sustained.
For now, the main concern is the distance price has travelled in such a short period. Chasing the current spike carries considerable risk, especially with volatility this elevated. I'd rather see how the market handles a potential retest of the previous range before drawing conclusions about its next major move.
#aria #Altcoin Season# #MacroInsights
The latest move in $ARIA is quite aggressive, with price jumping nearly 46% in a single session and breaking well above its previous consolidation range. The rally pushed price from around $0.0830 to a high above $0.1300, but the immediate reaction suggests traders may start locking in profits after such a sharp expansion.
At around $0.1226, price is trading considerably above its previous range. The $0.0820–$0.0850 region is the important support area to watch. It previously acted as a consolidation base, and a return toward that zone would give the market an opportunity to test whether buyers are still willing to defend the breakout.
A pullback would not be particularly surprising here. If price gradually retraces and finds demand around that former range, it could provide a healthier foundation for another recovery attempt. On the other hand, losing that area would raise questions about how much of the recent breakout can actually be sustained.
For now, the main concern is the distance price has travelled in such a short period. Chasing the current spike carries considerable risk, especially with volatility this elevated. I'd rather see how the market handles a potential retest of the previous range before drawing conclusions about its next major move.
#aria #Altcoin Season# #MacroInsights
At around $0.1226, price is trading considerably above its previous range. The $0.0820–$0.0850 region is the important support area to watch. It previously acted as a consolidation base, and a return toward that zone would give the market an opportunity to test whether buyers are still willing to defend the breakout.
A pullback would not be particularly surprising here. If price gradually retraces and finds demand around that former range, it could provide a healthier foundation for another recovery attempt. On the other hand, losing that area would raise questions about how much of the recent breakout can actually be sustained.
For now, the main concern is the distance price has travelled in such a short period. Chasing the current spike carries considerable risk, especially with volatility this elevated. I'd rather see how the market handles a potential retest of the previous range before drawing conclusions about its next major move.
#aria #Altcoin Season# #MacroInsights
37
·
--
Xem bản dịch
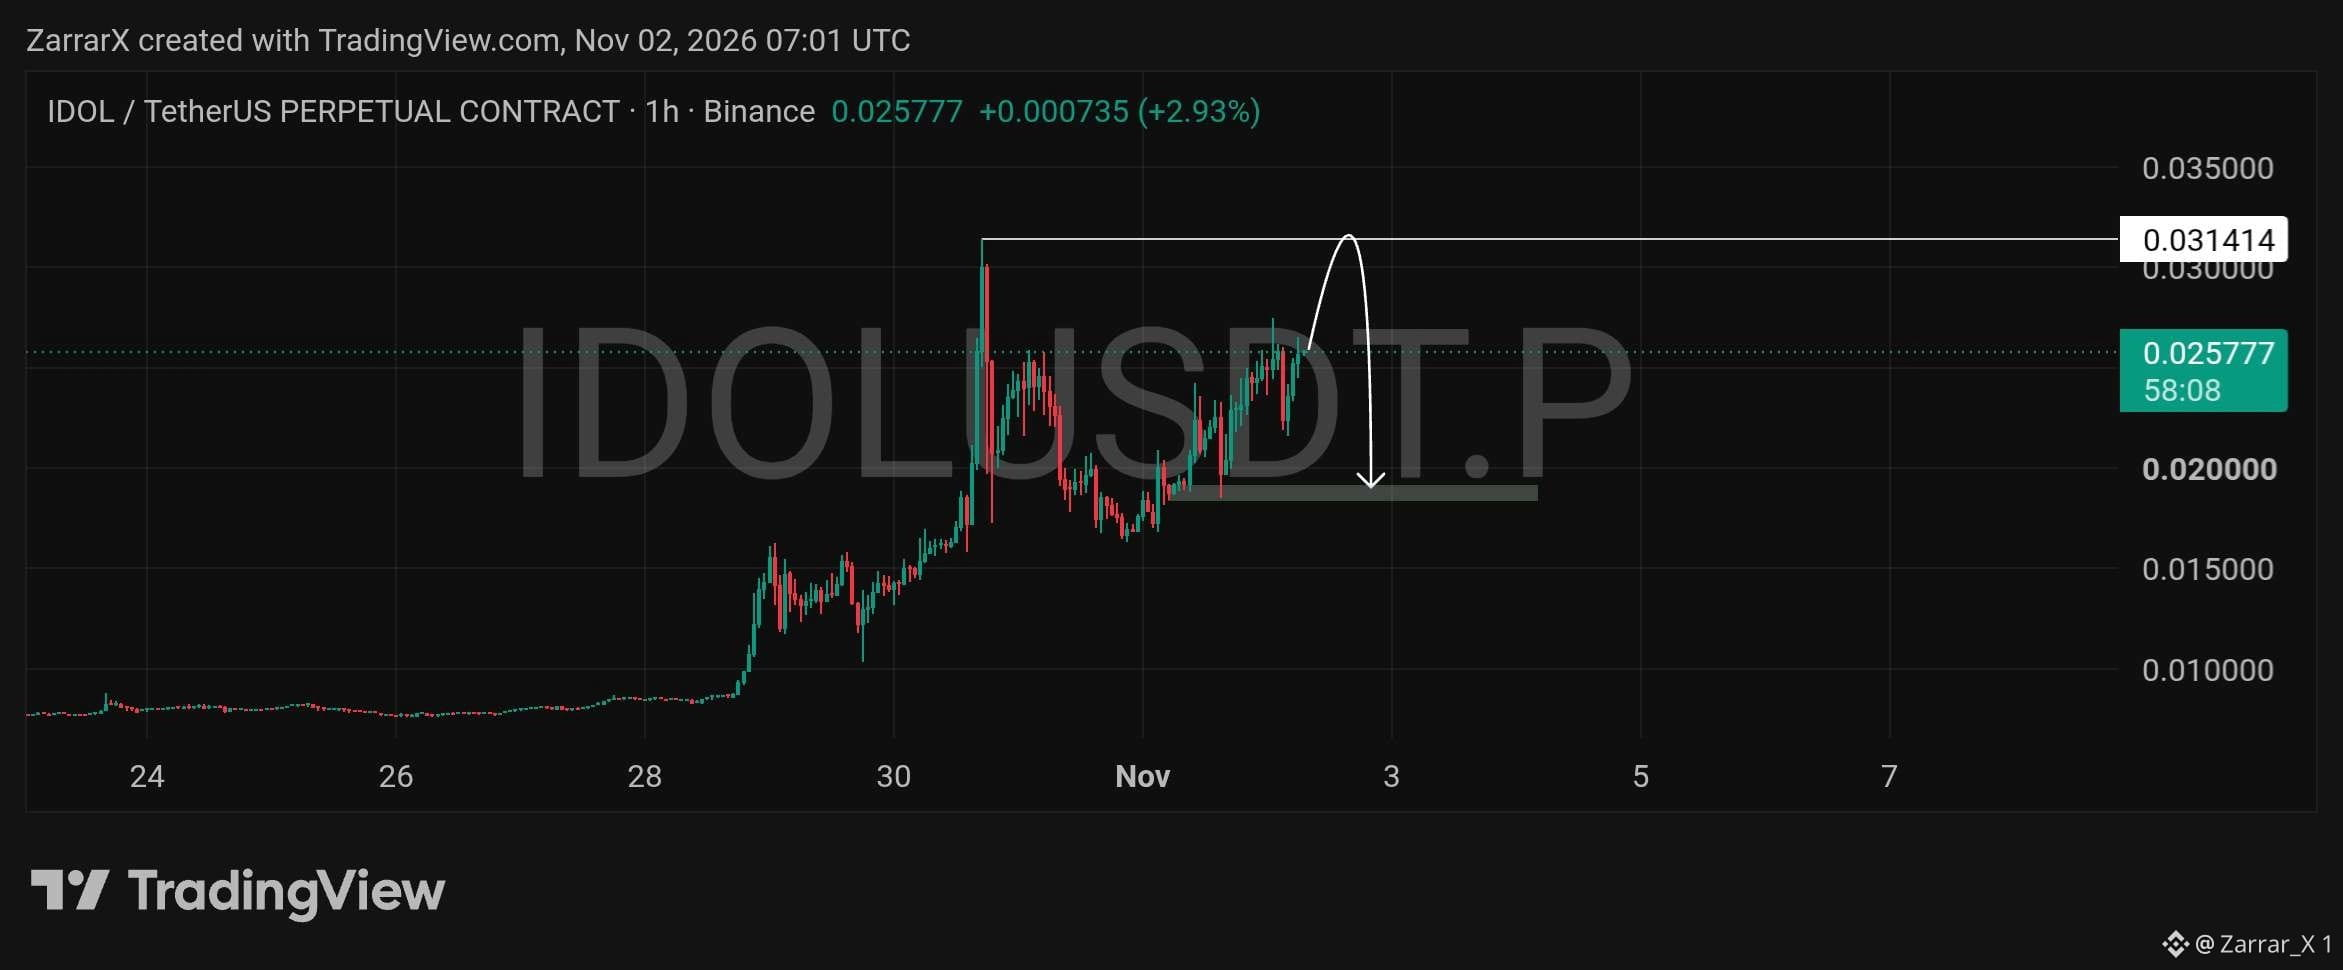
$IDOL has been holding up relatively well since its sharp expansion on October 29, but the latest price action suggests momentum is beginning to cool. After climbing from below $0.0100 and reaching a high around $0.0314, price has settled into a more volatile range, with sellers becoming active near the recent highs.
Currently trading around $0.0257, #IDOL still has room for a deeper retracement. The $0.0185–$0.0193 region is the main support area I'd keep an eye on. It previously served as a base during consolidation, making it an interesting area to watch if selling pressure continues.
A revisit to that zone wouldn't necessarily invalidate the broader recovery. If buyers defend it and price starts building momentum again, another attempt toward $0.0280 could follow, with the previous high around $0.0314 remaining the bigger upside reference.
The market has already delivered a substantial move, so some cooling off would not be surprising. I'd be more interested in the reaction around the $0.0185–$0.0193 region than in chasing price at its current level. A sustained break below that support, however, would put the bullish outlook under pressure.
#Altcoin Season# #Meme Alpha#
$IDOL has been holding up relatively well since its sharp expansion on October 29, but the latest price action suggests momentum is beginning to cool. After climbing from below $0.0100 and reaching a high around $0.0314, price has settled into a more volatile range, with sellers becoming active near the recent highs.
Currently trading around $0.0257, #IDOL still has room for a deeper retracement. The $0.0185–$0.0193 region is the main support area I'd keep an eye on. It previously served as a base during consolidation, making it an interesting area to watch if selling pressure continues.
A revisit to that zone wouldn't necessarily invalidate the broader recovery. If buyers defend it and price starts building momentum again, another attempt toward $0.0280 could follow, with the previous high around $0.0314 remaining the bigger upside reference.
The market has already delivered a substantial move, so some cooling off would not be surprising. I'd be more interested in the reaction around the $0.0185–$0.0193 region than in chasing price at its current level. A sustained break below that support, however, would put the bullish outlook under pressure.
#Altcoin Season# #Meme Alpha#
Currently trading around $0.0257, #IDOL still has room for a deeper retracement. The $0.0185–$0.0193 region is the main support area I'd keep an eye on. It previously served as a base during consolidation, making it an interesting area to watch if selling pressure continues.
A revisit to that zone wouldn't necessarily invalidate the broader recovery. If buyers defend it and price starts building momentum again, another attempt toward $0.0280 could follow, with the previous high around $0.0314 remaining the bigger upside reference.
The market has already delivered a substantial move, so some cooling off would not be surprising. I'd be more interested in the reaction around the $0.0185–$0.0193 region than in chasing price at its current level. A sustained break below that support, however, would put the bullish outlook under pressure.
#Altcoin Season# #Meme Alpha#
52
·
--
Xem bản dịch
Binance Hacker-Linked Wallet Moves $100.9M in XRP.
A wallet tagged “Binance Hack 2026” has transferred a combined 80 million #XRP worth approximately $100.9 million to two unknown addresses, according to blockchain tracking service Whale Alert.
The transfers involved 40 million XRP each, worth roughly $50.5 million apiece. Both transactions occurred within 50 seconds of each other on November 2, originating from the same wallet but going to separate destinations.
The purpose of the movements remains unclear. So far, there is no indication that the funds have reached a cryptocurrency exchange or been sold, meaning the transfers alone do not confirm an attempt to liquidate the XRP.
The activity comes days after the reported $6.3 billion Binance security breach. The exchange began restoring withdrawals across 15 blockchain networks on November 1, including the XRP Ledger, after temporarily suspending withdrawals while conducting security checks. Binance also stated that XRP balances were fully backed and that approximately 95% of affected assets had been replenished.
$XRP #Altcoin Season# #Crypto
Binance Hacker-Linked Wallet Moves $100.9M in XRP.
A wallet tagged “Binance Hack 2026” has transferred a combined 80 million #XRP worth approximately $100.9 million to two unknown addresses, according to blockchain tracking service Whale Alert.
The transfers involved 40 million XRP each, worth roughly $50.5 million apiece. Both transactions occurred within 50 seconds of each other on November 2, originating from the same wallet but going to separate destinations.
The purpose of the movements remains unclear. So far, there is no indication that the funds have reached a cryptocurrency exchange or been sold, meaning the transfers alone do not confirm an attempt to liquidate the XRP.
The activity comes days after the reported $6.3 billion Binance security breach. The exchange began restoring withdrawals across 15 blockchain networks on November 1, including the XRP Ledger, after temporarily suspending withdrawals while conducting security checks. Binance also stated that XRP balances were fully backed and that approximately 95% of affected assets had been replenished.
$XRP #Altcoin Season# #Crypto
A wallet tagged “Binance Hack 2026” has transferred a combined 80 million #XRP worth approximately $100.9 million to two unknown addresses, according to blockchain tracking service Whale Alert.
The transfers involved 40 million XRP each, worth roughly $50.5 million apiece. Both transactions occurred within 50 seconds of each other on November 2, originating from the same wallet but going to separate destinations.
The purpose of the movements remains unclear. So far, there is no indication that the funds have reached a cryptocurrency exchange or been sold, meaning the transfers alone do not confirm an attempt to liquidate the XRP.
The activity comes days after the reported $6.3 billion Binance security breach. The exchange began restoring withdrawals across 15 blockchain networks on November 1, including the XRP Ledger, after temporarily suspending withdrawals while conducting security checks. Binance also stated that XRP balances were fully backed and that approximately 95% of affected assets had been replenished.
$XRP #Altcoin Season# #Crypto

62
·
--
OpenAI giảm mục tiêu huy động vốn xuống còn 20 tỷ USD giữa làn sóng bán tháo cổ phiếu công nghệ.
Theo các nguồn tin, OpenAI, công ty đứng sau ChatGPT, đã giảm mục tiêu huy động vốn mới nhất từ 30 tỷ USD xuống còn tối đa 20 tỷ USD, khi các nhà đầu tư trở nên thận trọng hơn trước khoản chi tiêu khổng lồ trong ngành AI.
Theo Financial Times, vòng gọi vốn được điều chỉnh này định giá công ty ở mức 1,25 nghìn tỷ USD sau đầu tư, giảm so với mức 1,4 nghìn tỷ USD từng đặt mục tiêu trước đó. CNBC cũng xác nhận mục tiêu huy động vốn thấp hơn, dù vòng gọi vốn vẫn đang mở và các điều khoản cuối cùng vẫn có thể thay đổi.
Việc điều chỉnh diễn ra giữa làn sóng bán tháo cổ phiếu công nghệ trên diện rộng, khi các nhà đầu tư đặt câu hỏi liệu những khoản đầu tư khổng lồ vào chip AI, trung tâm dữ liệu và hạ tầng điện toán có tạo ra lợi nhuận tương xứng hay không. Theo các nguồn tin, một số nhà đầu tư lớn đã giảm mức cam kết dự kiến.
Dù mục tiêu thấp hơn, mức định giá 1,25 nghìn tỷ USD vẫn đưa OpenAI vào hàng ngũ những công ty công nghệ tư nhân có giá trị nhất thế giới. Diễn biến này cho thấy sự giám sát ngày càng chặt chẽ đối với định giá AI và chi phí tài trợ cho giai đoạn mở rộng tiếp theo của ngành.
$XPL $BTC #Phân tích giá BTC# #Góc nhìn vĩ mô# #Mùa altcoin#
OpenAI giảm mục tiêu huy động vốn xuống còn 20 tỷ USD giữa làn sóng bán tháo cổ phiếu công nghệ.
Theo các nguồn tin, OpenAI, công ty đứng sau ChatGPT, đã giảm mục tiêu huy động vốn mới nhất từ 30 tỷ USD xuống còn tối đa 20 tỷ USD, khi các nhà đầu tư trở nên thận trọng hơn trước khoản chi tiêu khổng lồ trong ngành AI.
Theo Financial Times, vòng gọi vốn được điều chỉnh này định giá công ty ở mức 1,25 nghìn tỷ USD sau đầu tư, giảm so với mức 1,4 nghìn tỷ USD từng đặt mục tiêu trước đó. CNBC cũng xác nhận mục tiêu huy động vốn thấp hơn, dù vòng gọi vốn vẫn đang mở và các điều khoản cuối cùng vẫn có thể thay đổi.
Việc điều chỉnh diễn ra giữa làn sóng bán tháo cổ phiếu công nghệ trên diện rộng, khi các nhà đầu tư đặt câu hỏi liệu những khoản đầu tư khổng lồ vào chip AI, trung tâm dữ liệu và hạ tầng điện toán có tạo ra lợi nhuận tương xứng hay không. Theo các nguồn tin, một số nhà đầu tư lớn đã giảm mức cam kết dự kiến.
Dù mục tiêu thấp hơn, mức định giá 1,25 nghìn tỷ USD vẫn đưa OpenAI vào hàng ngũ những công ty công nghệ tư nhân có giá trị nhất thế giới. Diễn biến này cho thấy sự giám sát ngày càng chặt chẽ đối với định giá AI và chi phí tài trợ cho giai đoạn mở rộng tiếp theo của ngành.
$XPL $BTC #Phân tích giá BTC# #Góc nhìn vĩ mô# #Mùa altcoin#
Theo các nguồn tin, OpenAI, công ty đứng sau ChatGPT, đã giảm mục tiêu huy động vốn mới nhất từ 30 tỷ USD xuống còn tối đa 20 tỷ USD, khi các nhà đầu tư trở nên thận trọng hơn trước khoản chi tiêu khổng lồ trong ngành AI.
Theo Financial Times, vòng gọi vốn được điều chỉnh này định giá công ty ở mức 1,25 nghìn tỷ USD sau đầu tư, giảm so với mức 1,4 nghìn tỷ USD từng đặt mục tiêu trước đó. CNBC cũng xác nhận mục tiêu huy động vốn thấp hơn, dù vòng gọi vốn vẫn đang mở và các điều khoản cuối cùng vẫn có thể thay đổi.
Việc điều chỉnh diễn ra giữa làn sóng bán tháo cổ phiếu công nghệ trên diện rộng, khi các nhà đầu tư đặt câu hỏi liệu những khoản đầu tư khổng lồ vào chip AI, trung tâm dữ liệu và hạ tầng điện toán có tạo ra lợi nhuận tương xứng hay không. Theo các nguồn tin, một số nhà đầu tư lớn đã giảm mức cam kết dự kiến.
Dù mục tiêu thấp hơn, mức định giá 1,25 nghìn tỷ USD vẫn đưa OpenAI vào hàng ngũ những công ty công nghệ tư nhân có giá trị nhất thế giới. Diễn biến này cho thấy sự giám sát ngày càng chặt chẽ đối với định giá AI và chi phí tài trợ cho giai đoạn mở rộng tiếp theo của ngành.
$XPL $BTC #Phân tích giá BTC# #Góc nhìn vĩ mô# #Mùa altcoin#


11
·
--
Xem bản dịch
🚨 Binance Records $3.74B in Net Outflows as Withdrawals Resume.
Binance has begun reopening withdrawals in phases following the reported $6.3 billion security breach, while DefiLlama data shows approximately $3.74 billion in net outflows from Binance-linked wallets over 24 hours as of November 1. Despite the movement, the tracker still shows around $131.36 billion in assets associated with the exchange.
However, the figure does not represent confirmed customer withdrawals. DefiLlama tracks labeled blockchain wallets, meaning its readings can include internal transfers between Binance’s own hot and cold wallets. Binance co-CEO Yi He has also warned that some newly created hot wallets may have been counted as outflows.
Over seven days, the tracker recorded approximately $10.41 billion in net outflows. Binance says withdrawals are being restored across major networks, while around 95% of the assets affected by the breach have been covered. The exchange also maintains that customer funds remain fully backed.
The key figure to watch is whether net outflows continue as withdrawals return to normal. For now, the $3.74 billion reading signals substantial movement around Binance, but it is not enough to establish a customer bank run.
$BNB $BTC
#BTC Price Analysis# #Macro Insights# #BNBChain#
🚨 Binance Records $3.74B in Net Outflows as Withdrawals Resume.
Binance has begun reopening withdrawals in phases following the reported $6.3 billion security breach, while DefiLlama data shows approximately $3.74 billion in net outflows from Binance-linked wallets over 24 hours as of November 1. Despite the movement, the tracker still shows around $131.36 billion in assets associated with the exchange.
However, the figure does not represent confirmed customer withdrawals. DefiLlama tracks labeled blockchain wallets, meaning its readings can include internal transfers between Binance’s own hot and cold wallets. Binance co-CEO Yi He has also warned that some newly created hot wallets may have been counted as outflows.
Over seven days, the tracker recorded approximately $10.41 billion in net outflows. Binance says withdrawals are being restored across major networks, while around 95% of the assets affected by the breach have been covered. The exchange also maintains that customer funds remain fully backed.
The key figure to watch is whether net outflows continue as withdrawals return to normal. For now, the $3.74 billion reading signals substantial movement around Binance, but it is not enough to establish a customer bank run.
$BNB $BTC
#BTC Price Analysis# #Macro Insights# #BNBChain#
Binance has begun reopening withdrawals in phases following the reported $6.3 billion security breach, while DefiLlama data shows approximately $3.74 billion in net outflows from Binance-linked wallets over 24 hours as of November 1. Despite the movement, the tracker still shows around $131.36 billion in assets associated with the exchange.
However, the figure does not represent confirmed customer withdrawals. DefiLlama tracks labeled blockchain wallets, meaning its readings can include internal transfers between Binance’s own hot and cold wallets. Binance co-CEO Yi He has also warned that some newly created hot wallets may have been counted as outflows.
Over seven days, the tracker recorded approximately $10.41 billion in net outflows. Binance says withdrawals are being restored across major networks, while around 95% of the assets affected by the breach have been covered. The exchange also maintains that customer funds remain fully backed.
The key figure to watch is whether net outflows continue as withdrawals return to normal. For now, the $3.74 billion reading signals substantial movement around Binance, but it is not enough to establish a customer bank run.
$BNB $BTC
#BTC Price Analysis# #Macro Insights# #BNBChain#
·
--
Microsoft Copilot AI đưa ra mục tiêu giá Solana cực cao là 2.500 USD.
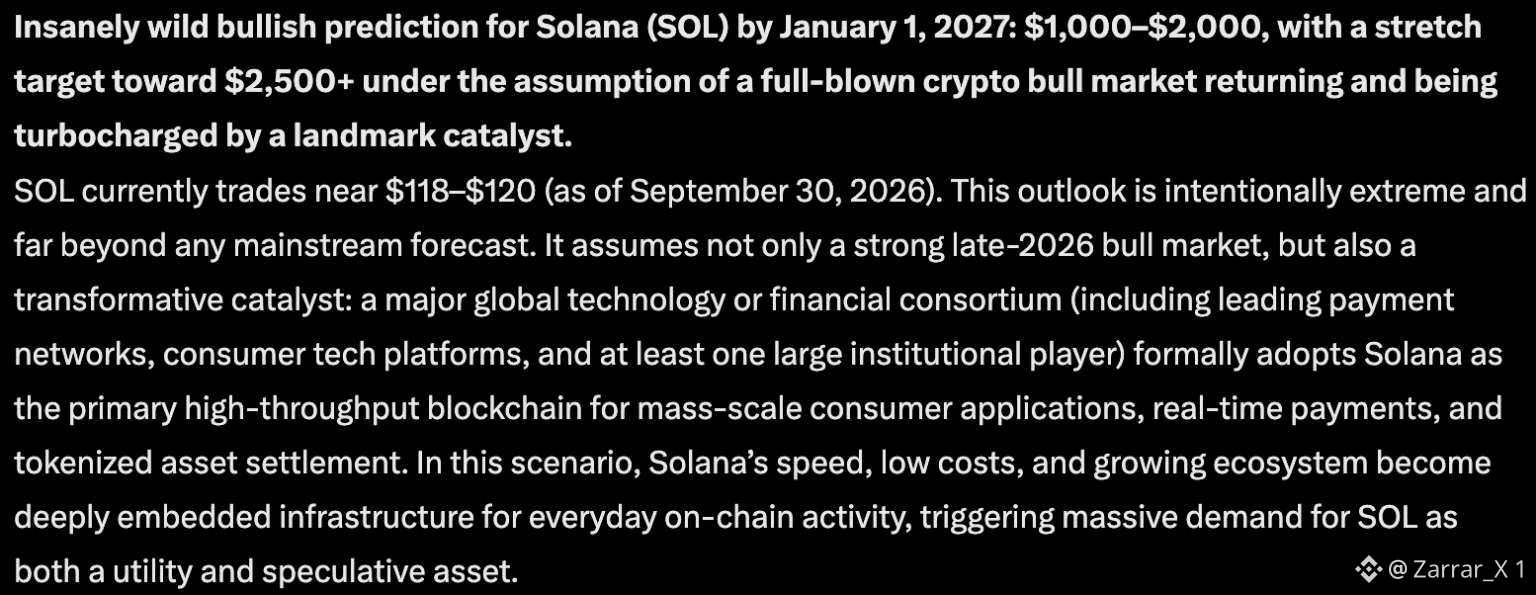
Microsoft Copilot AI đã phác họa triển vọng rất lạc quan nhưng mang tính đầu cơ cao đối với $SOL, cho rằng token này có thể đạt 1.000–2.000 USD vào ngày 1 tháng 1 năm 2027, với mục tiêu tham vọng hơn là vượt 2.500 USD.
Dự báo này giả định thị trường tăng giá lớn của tiền mã hóa sẽ quay trở lại và một liên minh toàn cầu quy mô lớn sẽ chọn Solana làm blockchain ưu tiên cho các ứng dụng dành cho người tiêu dùng và thanh toán theo thời gian thực. Việc áp dụng như vậy có thể làm tăng nhu cầu đối với SOL thông qua hoạt động mạng lưới, phí giao dịch và sự tham gia ngày càng tăng của hệ sinh thái.
Tuy nhiên, dự báo này vượt xa kỳ vọng phổ biến của thị trường và phụ thuộc vào một động lực thúc đẩy việc áp dụng mang tính giả định, chưa được xác nhận. Với SOL đang giao dịch quanh mức 95 USD, để đạt 2.500 USD, giá sẽ cần tăng hơn 2.500%.
Dự đoán này phù hợp hơn khi được xem là một kịch bản tăng giá cực đoan, thay vì một dự báo giá đáng tin cậy. Tốc độ cao, chi phí giao dịch thấp và hệ sinh thái đang phát triển của Solana có thể tạo nền tảng để được chấp nhận rộng rãi, nhưng liệu những yếu tố đó có thể dẫn đến mức định giá tăng mạnh như vậy hay không vẫn còn rất bất định.
#SOL #MùaAltcoin# #TiềnMãHóa
Microsoft Copilot AI đưa ra mục tiêu giá Solana cực cao là 2.500 USD.
Microsoft Copilot AI đã phác họa triển vọng rất lạc quan nhưng mang tính đầu cơ cao đối với $SOL, cho rằng token này có thể đạt 1.000–2.000 USD vào ngày 1 tháng 1 năm 2027, với mục tiêu tham vọng hơn là vượt 2.500 USD.
Dự báo này giả định thị trường tăng giá lớn của tiền mã hóa sẽ quay trở lại và một liên minh toàn cầu quy mô lớn sẽ chọn Solana làm blockchain ưu tiên cho các ứng dụng dành cho người tiêu dùng và thanh toán theo thời gian thực. Việc áp dụng như vậy có thể làm tăng nhu cầu đối với SOL thông qua hoạt động mạng lưới, phí giao dịch và sự tham gia ngày càng tăng của hệ sinh thái.
Tuy nhiên, dự báo này vượt xa kỳ vọng phổ biến của thị trường và phụ thuộc vào một động lực thúc đẩy việc áp dụng mang tính giả định, chưa được xác nhận. Với SOL đang giao dịch quanh mức 95 USD, để đạt 2.500 USD, giá sẽ cần tăng hơn 2.500%.
Dự đoán này phù hợp hơn khi được xem là một kịch bản tăng giá cực đoan, thay vì một dự báo giá đáng tin cậy. Tốc độ cao, chi phí giao dịch thấp và hệ sinh thái đang phát triển của Solana có thể tạo nền tảng để được chấp nhận rộng rãi, nhưng liệu những yếu tố đó có thể dẫn đến mức định giá tăng mạnh như vậy hay không vẫn còn rất bất định.
#SOL #MùaAltcoin# #TiềnMãHóa
Microsoft Copilot AI đã phác họa triển vọng rất lạc quan nhưng mang tính đầu cơ cao đối với $SOL, cho rằng token này có thể đạt 1.000–2.000 USD vào ngày 1 tháng 1 năm 2027, với mục tiêu tham vọng hơn là vượt 2.500 USD.
Dự báo này giả định thị trường tăng giá lớn của tiền mã hóa sẽ quay trở lại và một liên minh toàn cầu quy mô lớn sẽ chọn Solana làm blockchain ưu tiên cho các ứng dụng dành cho người tiêu dùng và thanh toán theo thời gian thực. Việc áp dụng như vậy có thể làm tăng nhu cầu đối với SOL thông qua hoạt động mạng lưới, phí giao dịch và sự tham gia ngày càng tăng của hệ sinh thái.
Tuy nhiên, dự báo này vượt xa kỳ vọng phổ biến của thị trường và phụ thuộc vào một động lực thúc đẩy việc áp dụng mang tính giả định, chưa được xác nhận. Với SOL đang giao dịch quanh mức 95 USD, để đạt 2.500 USD, giá sẽ cần tăng hơn 2.500%.
Dự đoán này phù hợp hơn khi được xem là một kịch bản tăng giá cực đoan, thay vì một dự báo giá đáng tin cậy. Tốc độ cao, chi phí giao dịch thấp và hệ sinh thái đang phát triển của Solana có thể tạo nền tảng để được chấp nhận rộng rãi, nhưng liệu những yếu tố đó có thể dẫn đến mức định giá tăng mạnh như vậy hay không vẫn còn rất bất định.
#SOL #MùaAltcoin# #TiềnMãHóa

22
·
--
Xem bản dịch
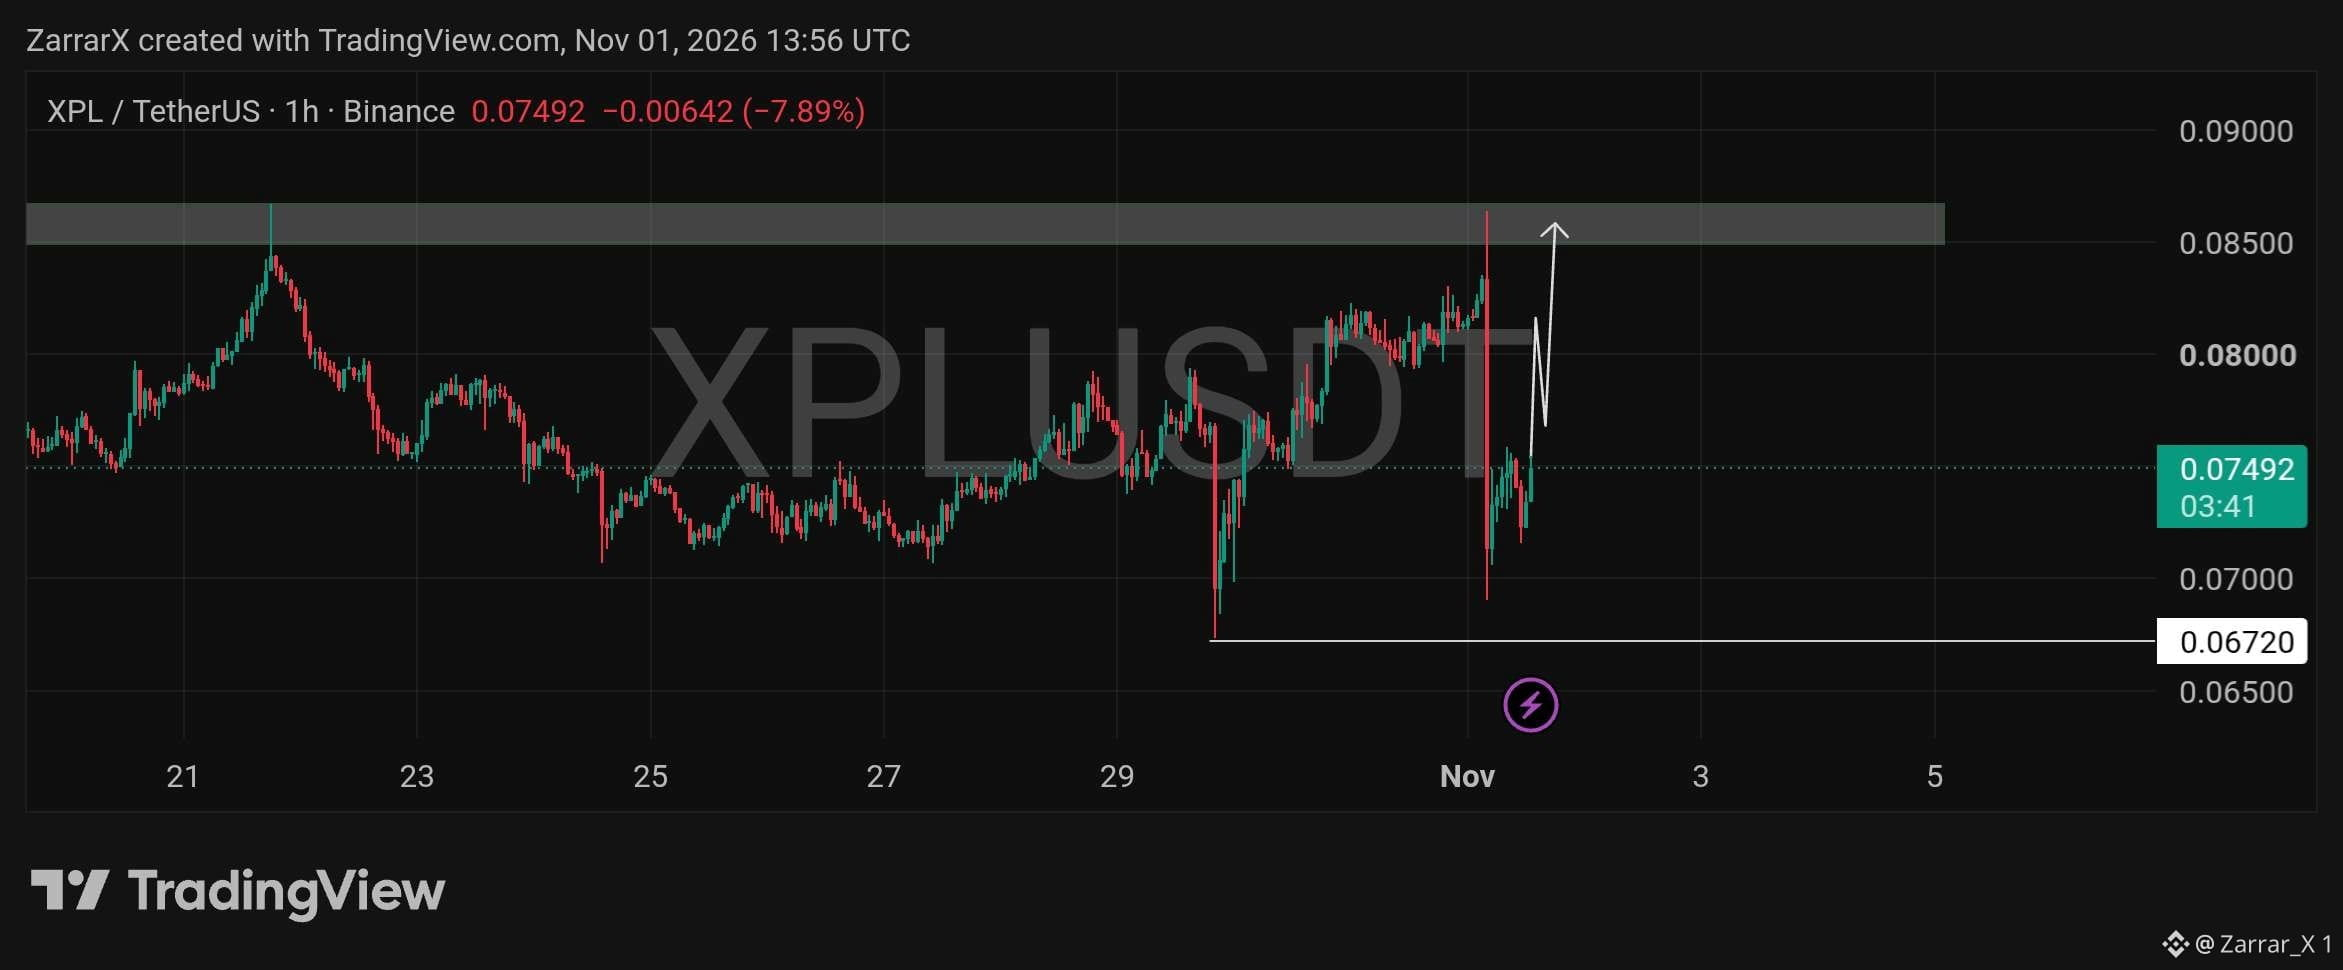
$XPL is struggling to hold onto its recent gains after a sharp rejection near $0.0860. The sudden sell-off erased much of the rally, bringing price back to around $0.0749. Despite the recovery attempts, buyers have yet to establish clear control.
One level worth keeping on the radar is $0.0672, which remains the key support below current price. A deeper retracement toward this area is possible, particularly if the current bounce fails to attract stronger buying interest. For #XPL , the reaction around this level could determine whether the recent weakness develops into a larger correction.
On the upside, price needs to reclaim the $0.0800–$0.0810 region before another attempt at the $0.0850–$0.0860 supply zone becomes realistic. That upper region has already produced a strong rejection, so another visit could bring sellers back into the picture.
What makes this chart interesting is the sharp volatility around the November 1 move. Rather than assuming the recovery is underway, I'd watch how price handles the intermediate resistance first. Until buyers regain that ground, a retest of lower support remains a reasonable possibility.
#Macro Insights# #Altcoin Season#
$XPL is struggling to hold onto its recent gains after a sharp rejection near $0.0860. The sudden sell-off erased much of the rally, bringing price back to around $0.0749. Despite the recovery attempts, buyers have yet to establish clear control.
One level worth keeping on the radar is $0.0672, which remains the key support below current price. A deeper retracement toward this area is possible, particularly if the current bounce fails to attract stronger buying interest. For #XPL , the reaction around this level could determine whether the recent weakness develops into a larger correction.
On the upside, price needs to reclaim the $0.0800–$0.0810 region before another attempt at the $0.0850–$0.0860 supply zone becomes realistic. That upper region has already produced a strong rejection, so another visit could bring sellers back into the picture.
What makes this chart interesting is the sharp volatility around the November 1 move. Rather than assuming the recovery is underway, I'd watch how price handles the intermediate resistance first. Until buyers regain that ground, a retest of lower support remains a reasonable possibility.
#Macro Insights# #Altcoin Season#
One level worth keeping on the radar is $0.0672, which remains the key support below current price. A deeper retracement toward this area is possible, particularly if the current bounce fails to attract stronger buying interest. For #XPL , the reaction around this level could determine whether the recent weakness develops into a larger correction.
On the upside, price needs to reclaim the $0.0800–$0.0810 region before another attempt at the $0.0850–$0.0860 supply zone becomes realistic. That upper region has already produced a strong rejection, so another visit could bring sellers back into the picture.
What makes this chart interesting is the sharp volatility around the November 1 move. Rather than assuming the recovery is underway, I'd watch how price handles the intermediate resistance first. Until buyers regain that ground, a retest of lower support remains a reasonable possibility.
#Macro Insights# #Altcoin Season#
26
·
--
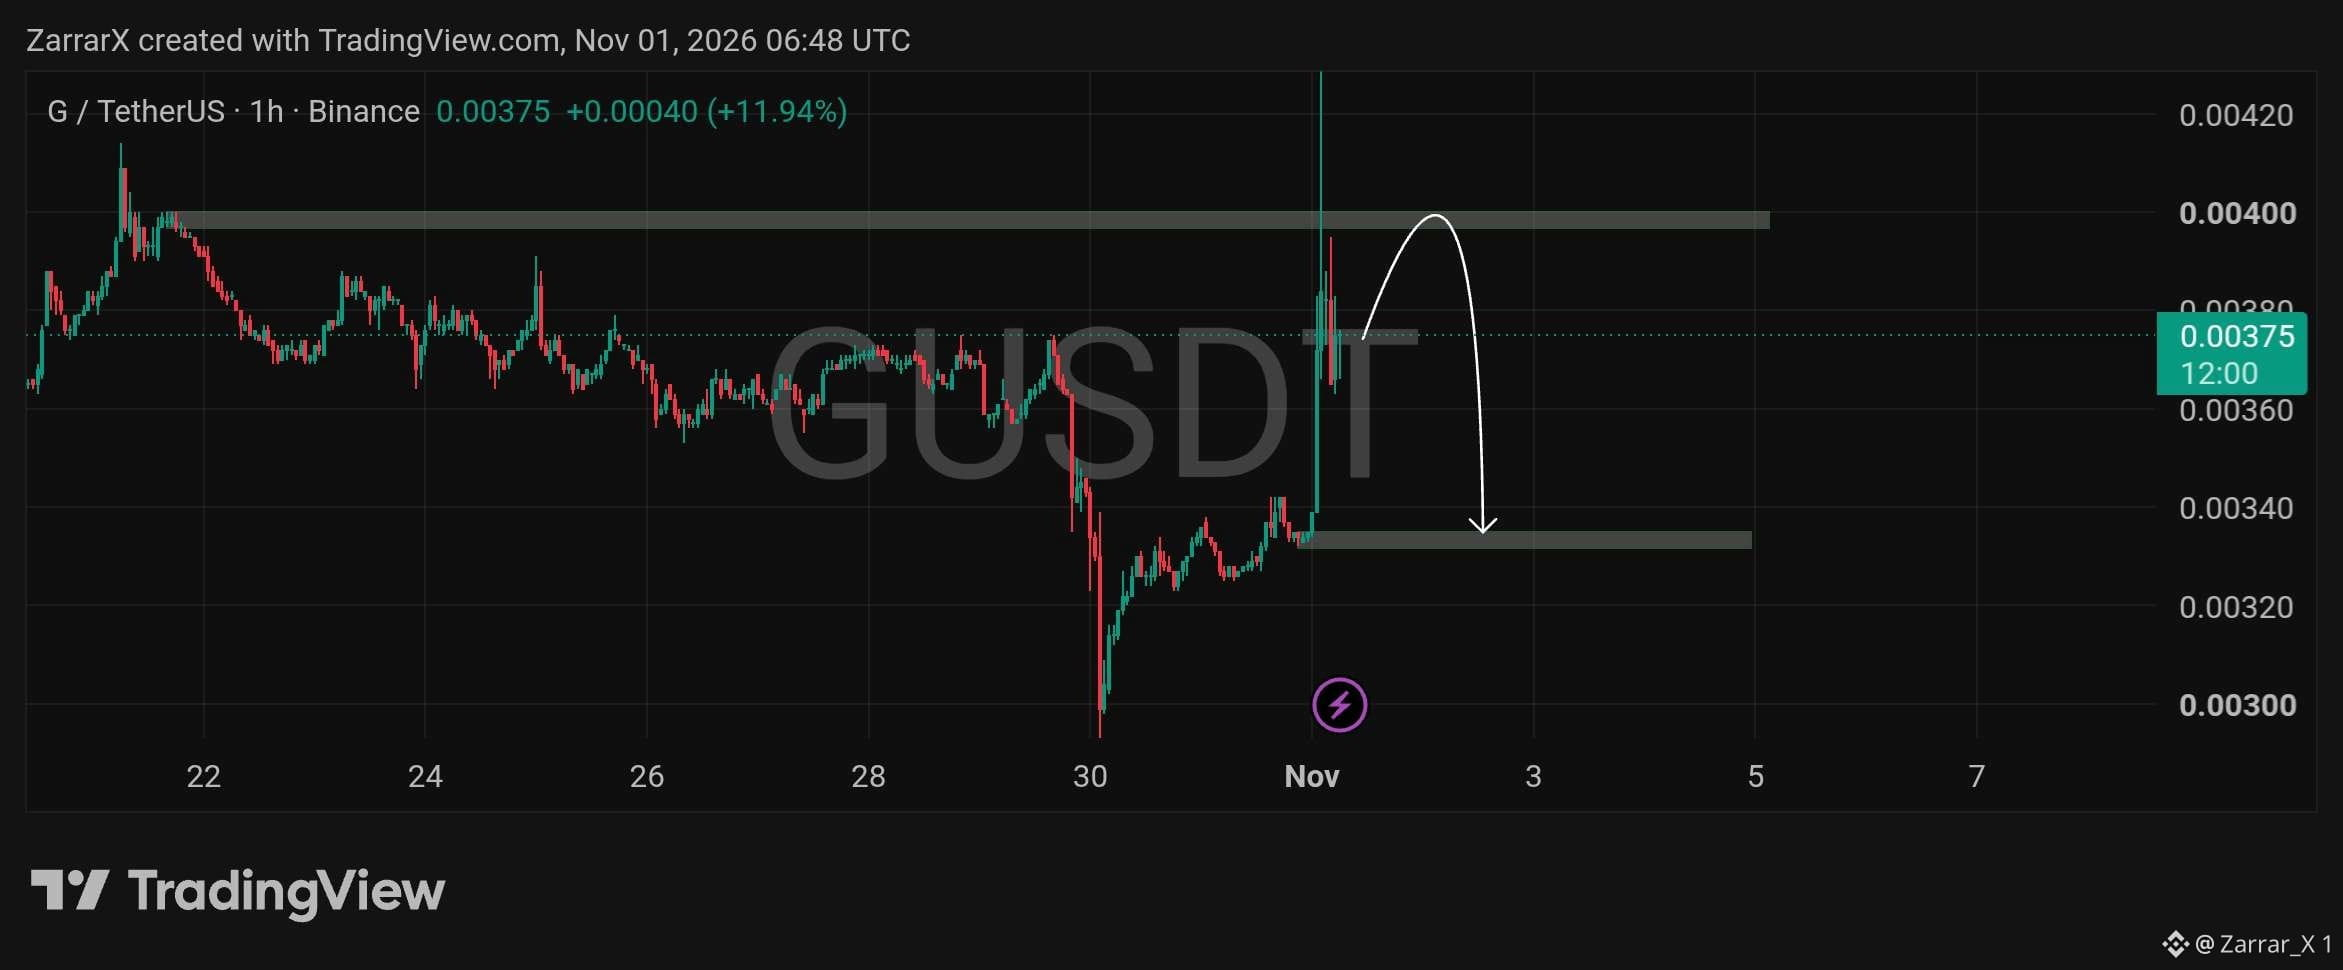
Đợt bứt phá gần đây đã tiếp thêm động lực cho thị trường sau vài ngày giao dịch tương đối trầm lắng. Giá tăng vọt vượt khỏi vùng dao động trước đó vào ngày 31 tháng 10, có lúc vượt mốc $0.00420 trước khi bên bán nhập cuộc. Hiện giá đang ổn định quanh mức $0.00375.
Một nhịp điều chỉnh về vùng $0.00330–$0.00335 có thể là diễn biến đáng chú ý tiếp theo của $G. Khu vực này từng đóng vai trò là vùng nền trước đợt tăng giá, vì vậy đáng để theo dõi nhằm tìm dấu hiệu lực mua quay trở lại.
Nếu khu vực này thu hút người mua, giá có thể tiếp tục thử hướng tới mốc $0.00400. Tuy nhiên, bên bán đã cho thấy họ sẵn sàng bảo vệ các mức giá cao hơn, nên để đà phục hồi có được động lực, cần nhiều hơn một nhịp bật tăng ngắn ngủi.
Thay vì đuổi theo cú bứt phá ban đầu, tôi sẽ chú ý hơn đến diễn biến giá trong lần kiểm tra lại vùng này. Việc giữ vững vùng cầu sẽ duy trì khả năng có thêm một nhịp tăng, còn nếu để mất vùng này, các mức tăng gần đây có thể chịu áp lực.
#Meme Alpha# #Tăng giá #Mùa Altcoin#
Đợt bứt phá gần đây đã tiếp thêm động lực cho thị trường sau vài ngày giao dịch tương đối trầm lắng. Giá tăng vọt vượt khỏi vùng dao động trước đó vào ngày 31 tháng 10, có lúc vượt mốc $0.00420 trước khi bên bán nhập cuộc. Hiện giá đang ổn định quanh mức $0.00375.
Một nhịp điều chỉnh về vùng $0.00330–$0.00335 có thể là diễn biến đáng chú ý tiếp theo của $G. Khu vực này từng đóng vai trò là vùng nền trước đợt tăng giá, vì vậy đáng để theo dõi nhằm tìm dấu hiệu lực mua quay trở lại.
Nếu khu vực này thu hút người mua, giá có thể tiếp tục thử hướng tới mốc $0.00400. Tuy nhiên, bên bán đã cho thấy họ sẵn sàng bảo vệ các mức giá cao hơn, nên để đà phục hồi có được động lực, cần nhiều hơn một nhịp bật tăng ngắn ngủi.
Thay vì đuổi theo cú bứt phá ban đầu, tôi sẽ chú ý hơn đến diễn biến giá trong lần kiểm tra lại vùng này. Việc giữ vững vùng cầu sẽ duy trì khả năng có thêm một nhịp tăng, còn nếu để mất vùng này, các mức tăng gần đây có thể chịu áp lực.
#Meme Alpha# #Tăng giá #Mùa Altcoin#
Một nhịp điều chỉnh về vùng $0.00330–$0.00335 có thể là diễn biến đáng chú ý tiếp theo của $G. Khu vực này từng đóng vai trò là vùng nền trước đợt tăng giá, vì vậy đáng để theo dõi nhằm tìm dấu hiệu lực mua quay trở lại.
Nếu khu vực này thu hút người mua, giá có thể tiếp tục thử hướng tới mốc $0.00400. Tuy nhiên, bên bán đã cho thấy họ sẵn sàng bảo vệ các mức giá cao hơn, nên để đà phục hồi có được động lực, cần nhiều hơn một nhịp bật tăng ngắn ngủi.
Thay vì đuổi theo cú bứt phá ban đầu, tôi sẽ chú ý hơn đến diễn biến giá trong lần kiểm tra lại vùng này. Việc giữ vững vùng cầu sẽ duy trì khả năng có thêm một nhịp tăng, còn nếu để mất vùng này, các mức tăng gần đây có thể chịu áp lực.
#Meme Alpha# #Tăng giá #Mùa Altcoin#
37
·
--
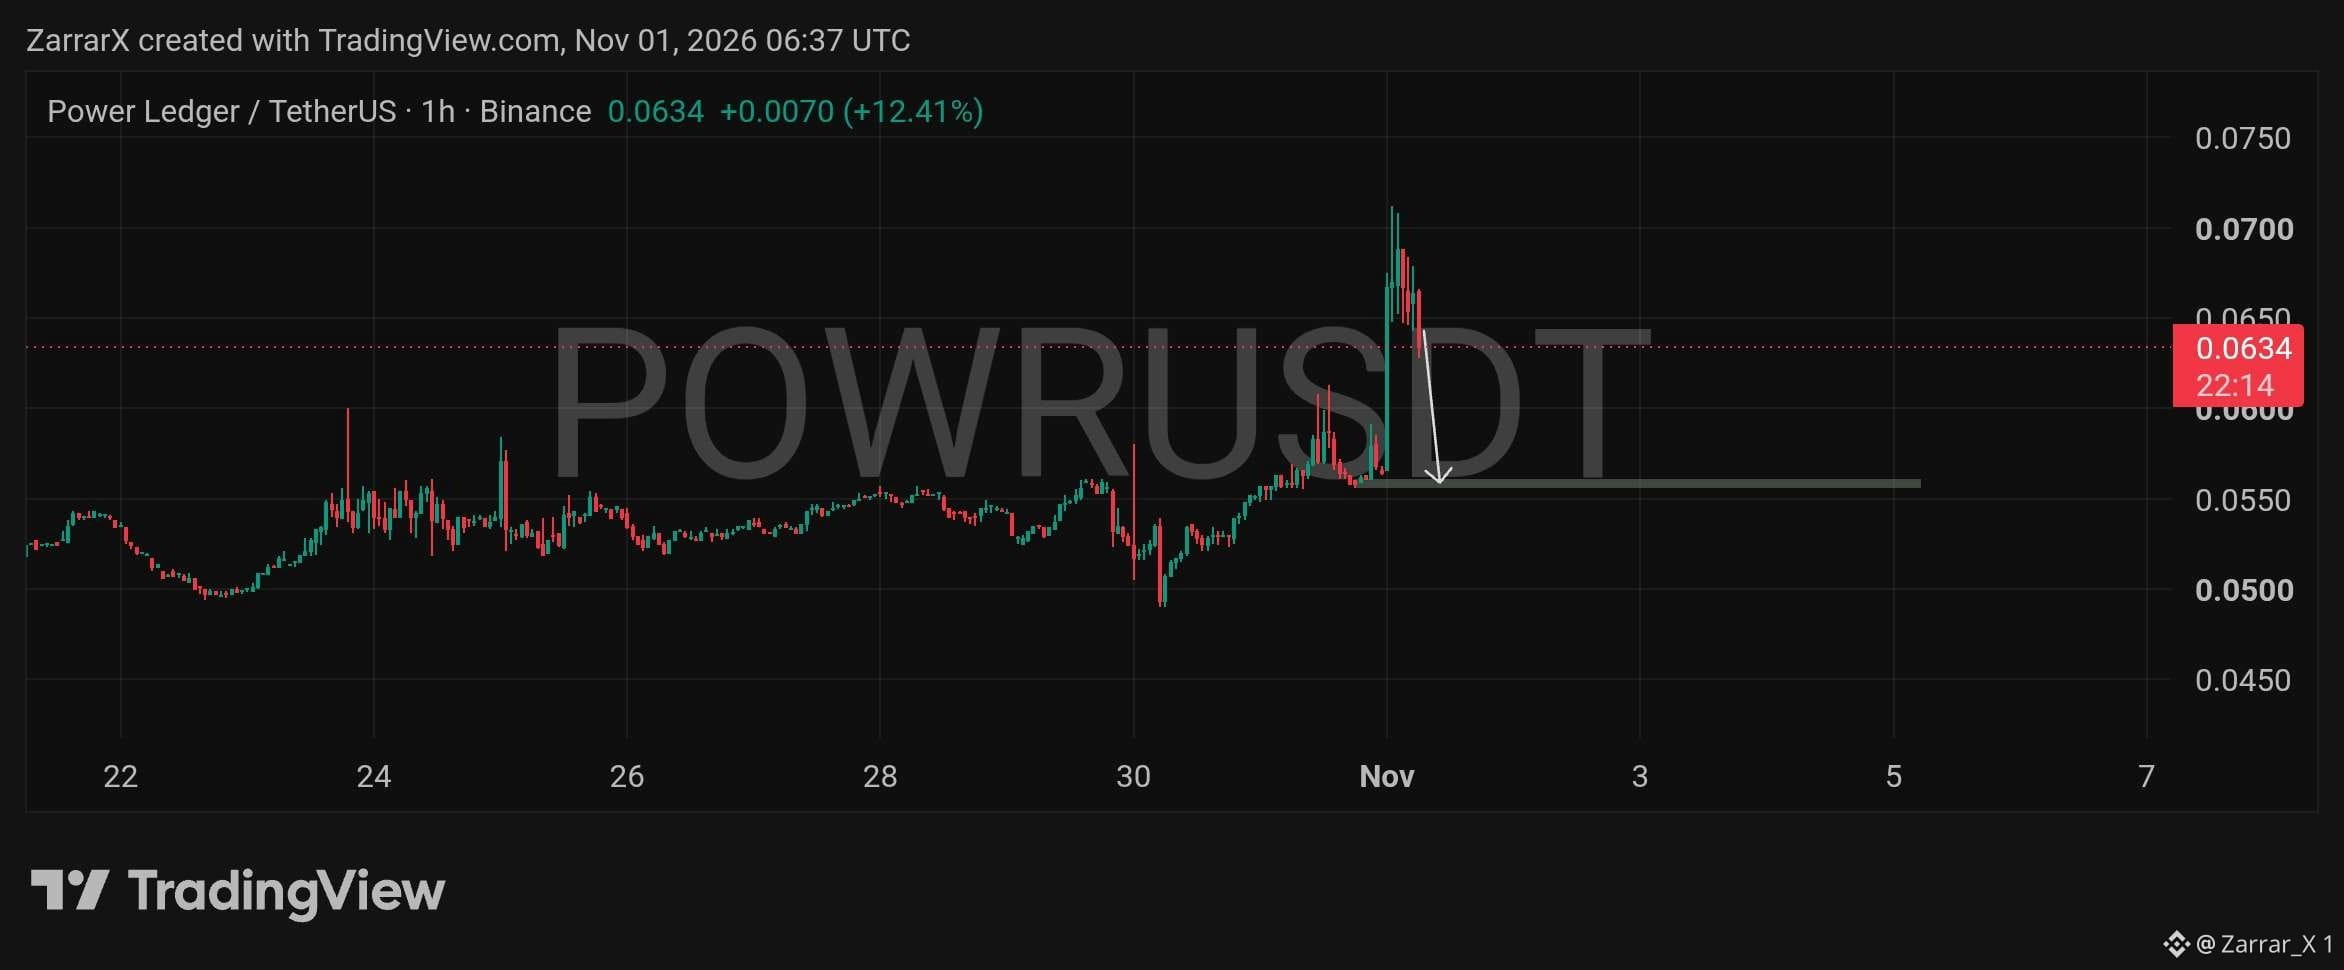
$POWR đã có một bước tiến mạnh mẽ sau giai đoạn tích lũy trước đó, tăng từ vùng $0.0540–$0.0560 lên mức cao gần đây quanh $0.0710. Đợt bứt phá đã tạo đà tăng đáng kể, dù những cây nến gần nhất cho thấy người mua có thể đang bắt đầu chốt lời sau nhịp tăng mạnh.
Giá hiện đang giao dịch quanh $0.0634 và có thể còn điều chỉnh thêm trước khi hình thành một xu hướng tiếp theo. Vùng $0.0555–$0.0560 nổi bật là khu vực cầu quan trọng cần theo dõi, đặc biệt khi vùng này trùng với cấu trúc bứt phá trước đó.
Việc giá quay lại vùng này có thể tạo cơ hội để người mua giành lại quyền kiểm soát. Nếu lực cầu được duy trì và thị trường có phản ứng thuyết phục, #POWER có thể thử tăng trở lại hướng tới $0.0650 trước khi kiểm tra các mức đỉnh gần đây trong khoảng $0.0700–$0.0710.
Hiện tại, kiên nhẫn là điều quan trọng. Trọng tâm trước mắt là liệu nhịp điều chỉnh có trở thành một lần kiểm tra lại lành mạnh hay chuyển thành đợt điều chỉnh sâu hơn. Việc mất vùng cầu đã đánh dấu sẽ làm suy yếu triển vọng tăng giá, trong khi sự phục hồi mạnh từ vùng này có thể đưa các mức đỉnh gần đây trở lại tâm điểm.
#Meme Alpha# #Tăng giá
$POWR đã có một bước tiến mạnh mẽ sau giai đoạn tích lũy trước đó, tăng từ vùng $0.0540–$0.0560 lên mức cao gần đây quanh $0.0710. Đợt bứt phá đã tạo đà tăng đáng kể, dù những cây nến gần nhất cho thấy người mua có thể đang bắt đầu chốt lời sau nhịp tăng mạnh.
Giá hiện đang giao dịch quanh $0.0634 và có thể còn điều chỉnh thêm trước khi hình thành một xu hướng tiếp theo. Vùng $0.0555–$0.0560 nổi bật là khu vực cầu quan trọng cần theo dõi, đặc biệt khi vùng này trùng với cấu trúc bứt phá trước đó.
Việc giá quay lại vùng này có thể tạo cơ hội để người mua giành lại quyền kiểm soát. Nếu lực cầu được duy trì và thị trường có phản ứng thuyết phục, #POWER có thể thử tăng trở lại hướng tới $0.0650 trước khi kiểm tra các mức đỉnh gần đây trong khoảng $0.0700–$0.0710.
Hiện tại, kiên nhẫn là điều quan trọng. Trọng tâm trước mắt là liệu nhịp điều chỉnh có trở thành một lần kiểm tra lại lành mạnh hay chuyển thành đợt điều chỉnh sâu hơn. Việc mất vùng cầu đã đánh dấu sẽ làm suy yếu triển vọng tăng giá, trong khi sự phục hồi mạnh từ vùng này có thể đưa các mức đỉnh gần đây trở lại tâm điểm.
#Meme Alpha# #Tăng giá
Giá hiện đang giao dịch quanh $0.0634 và có thể còn điều chỉnh thêm trước khi hình thành một xu hướng tiếp theo. Vùng $0.0555–$0.0560 nổi bật là khu vực cầu quan trọng cần theo dõi, đặc biệt khi vùng này trùng với cấu trúc bứt phá trước đó.
Việc giá quay lại vùng này có thể tạo cơ hội để người mua giành lại quyền kiểm soát. Nếu lực cầu được duy trì và thị trường có phản ứng thuyết phục, #POWER có thể thử tăng trở lại hướng tới $0.0650 trước khi kiểm tra các mức đỉnh gần đây trong khoảng $0.0700–$0.0710.
Hiện tại, kiên nhẫn là điều quan trọng. Trọng tâm trước mắt là liệu nhịp điều chỉnh có trở thành một lần kiểm tra lại lành mạnh hay chuyển thành đợt điều chỉnh sâu hơn. Việc mất vùng cầu đã đánh dấu sẽ làm suy yếu triển vọng tăng giá, trong khi sự phục hồi mạnh từ vùng này có thể đưa các mức đỉnh gần đây trở lại tâm điểm.
#Meme Alpha# #Tăng giá
46
·
--
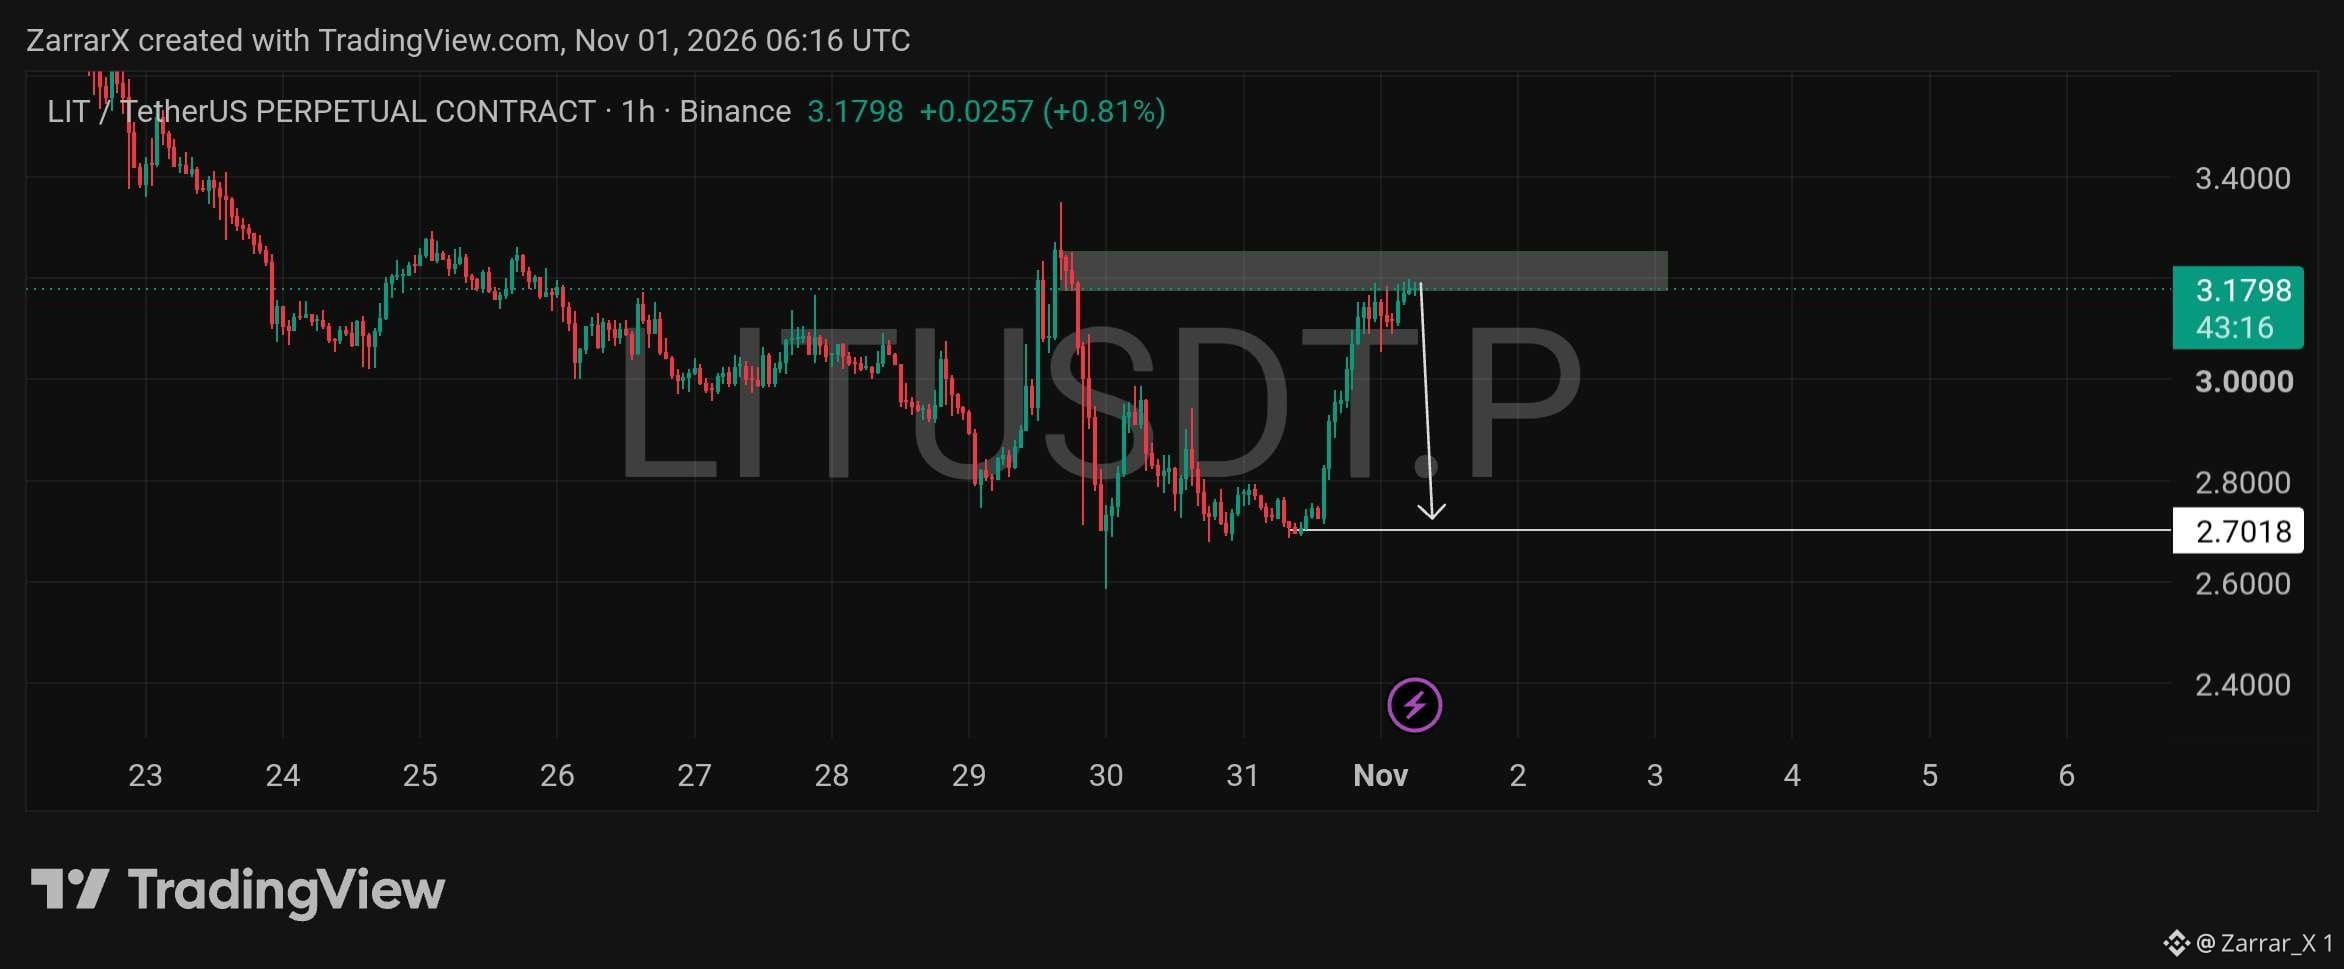
$LIT đã phục hồi mạnh mẽ sau nhiều phiên chịu áp lực bán. Đà tăng từ vùng $2.70 đã đưa giá trở lại gần $3.18, nơi hiện giá đang tiến sát vùng cung quan trọng từng khiến giá bị từ chối.
Vùng kháng cự gần nhất nằm quanh $3.18–$3.27. Giá đã kiểm tra vùng này, nên bên bán có thể giành lại quyền kiểm soát và đẩy giá điều chỉnh thay vì để đà phục hồi tiếp tục ngay lập tức.
Biểu đồ cho thấy $2.70–$2.72 là vùng giảm giá quan trọng tiếp theo. Nếu bị từ chối ở các mức hiện tại, #LIT có thể quay về vùng hỗ trợ này, tạo cơ hội để thị trường kiểm tra lại đáy được hình thành trước đợt tăng giá gần đây nhất.
Hiện tại, phản ứng quanh vùng kháng cự cần được theo dõi sát sao. Một cú phá vỡ dứt khoát lên trên vùng cung có thể thay đổi triển vọng ngắn hạn, nhưng nếu không thể vượt qua vùng này, kịch bản điều chỉnh vẫn sẽ tiếp diễn.
#Góc nhìn vĩ mô# #Mùa altcoin#
$LIT đã phục hồi mạnh mẽ sau nhiều phiên chịu áp lực bán. Đà tăng từ vùng $2.70 đã đưa giá trở lại gần $3.18, nơi hiện giá đang tiến sát vùng cung quan trọng từng khiến giá bị từ chối.
Vùng kháng cự gần nhất nằm quanh $3.18–$3.27. Giá đã kiểm tra vùng này, nên bên bán có thể giành lại quyền kiểm soát và đẩy giá điều chỉnh thay vì để đà phục hồi tiếp tục ngay lập tức.
Biểu đồ cho thấy $2.70–$2.72 là vùng giảm giá quan trọng tiếp theo. Nếu bị từ chối ở các mức hiện tại, #LIT có thể quay về vùng hỗ trợ này, tạo cơ hội để thị trường kiểm tra lại đáy được hình thành trước đợt tăng giá gần đây nhất.
Hiện tại, phản ứng quanh vùng kháng cự cần được theo dõi sát sao. Một cú phá vỡ dứt khoát lên trên vùng cung có thể thay đổi triển vọng ngắn hạn, nhưng nếu không thể vượt qua vùng này, kịch bản điều chỉnh vẫn sẽ tiếp diễn.
#Góc nhìn vĩ mô# #Mùa altcoin#
Vùng kháng cự gần nhất nằm quanh $3.18–$3.27. Giá đã kiểm tra vùng này, nên bên bán có thể giành lại quyền kiểm soát và đẩy giá điều chỉnh thay vì để đà phục hồi tiếp tục ngay lập tức.
Biểu đồ cho thấy $2.70–$2.72 là vùng giảm giá quan trọng tiếp theo. Nếu bị từ chối ở các mức hiện tại, #LIT có thể quay về vùng hỗ trợ này, tạo cơ hội để thị trường kiểm tra lại đáy được hình thành trước đợt tăng giá gần đây nhất.
Hiện tại, phản ứng quanh vùng kháng cự cần được theo dõi sát sao. Một cú phá vỡ dứt khoát lên trên vùng cung có thể thay đổi triển vọng ngắn hạn, nhưng nếu không thể vượt qua vùng này, kịch bản điều chỉnh vẫn sẽ tiếp diễn.
#Góc nhìn vĩ mô# #Mùa altcoin#
65
·
--
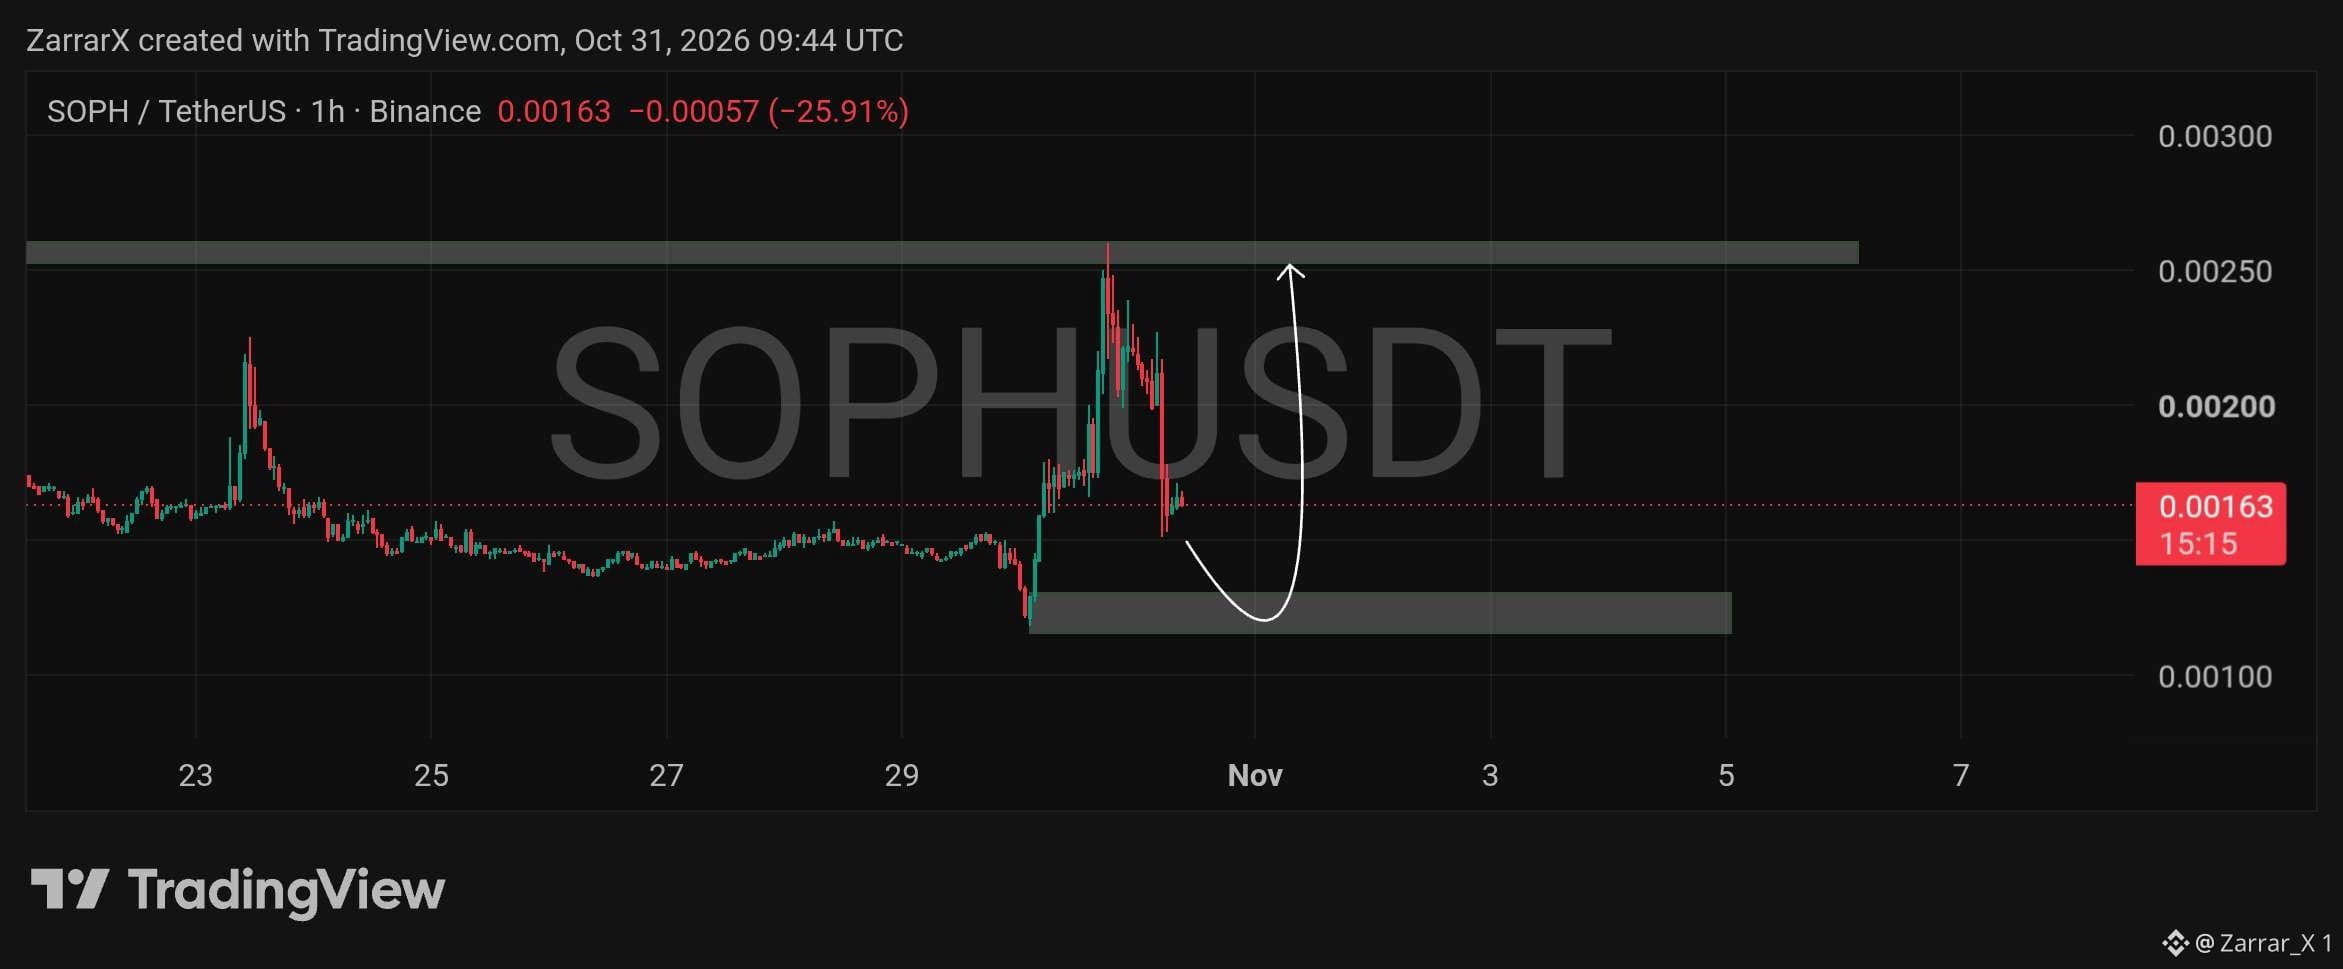
Đợt tăng giá gần đây của $SOPH nhanh chóng chuyển thành một đợt điều chỉnh mạnh, khi bên bán đẩy giá giảm gần 26% trong nhịp biến động mới nhất. Sau khi chạm vùng $0.00260, token đã để mất phần lớn mức tăng và hiện đang giao dịch quanh $0.00163.
Vùng tiếp theo đáng chú ý là $0.00115–$0.00130, nơi người mua có thể tìm cách xây dựng một vùng nền vững chắc hơn. Giá vẫn chưa kiểm tra vùng cầu thấp hơn này, vì vậy vẫn có thể giảm thêm trước khi hình thành một đợt phục hồi đáng kể.
Việc giá chạm vùng này không nhất thiết sẽ làm mất đi triển vọng tăng giá rộng hơn. Nếu người mua nhập cuộc và bảo vệ vùng này, giá bật lại có thể đưa vùng cung $0.00250–$0.00260 trở lại tầm ngắm.
Cho đến lúc đó, biến động gần đây đòi hỏi sự thận trọng. Phản ứng quanh vùng cầu sẽ quan trọng hơn việc chạy theo nhịp hồi hiện tại, bởi một đợt phục hồi bền vững cần áp lực mua mạnh hơn để hình thành.
#SOPHUSDT #GócNhìnVĩMô# #MùaAltcoin#
Đợt tăng giá gần đây của $SOPH nhanh chóng chuyển thành một đợt điều chỉnh mạnh, khi bên bán đẩy giá giảm gần 26% trong nhịp biến động mới nhất. Sau khi chạm vùng $0.00260, token đã để mất phần lớn mức tăng và hiện đang giao dịch quanh $0.00163.
Vùng tiếp theo đáng chú ý là $0.00115–$0.00130, nơi người mua có thể tìm cách xây dựng một vùng nền vững chắc hơn. Giá vẫn chưa kiểm tra vùng cầu thấp hơn này, vì vậy vẫn có thể giảm thêm trước khi hình thành một đợt phục hồi đáng kể.
Việc giá chạm vùng này không nhất thiết sẽ làm mất đi triển vọng tăng giá rộng hơn. Nếu người mua nhập cuộc và bảo vệ vùng này, giá bật lại có thể đưa vùng cung $0.00250–$0.00260 trở lại tầm ngắm.
Cho đến lúc đó, biến động gần đây đòi hỏi sự thận trọng. Phản ứng quanh vùng cầu sẽ quan trọng hơn việc chạy theo nhịp hồi hiện tại, bởi một đợt phục hồi bền vững cần áp lực mua mạnh hơn để hình thành.
#SOPHUSDT #GócNhìnVĩMô# #MùaAltcoin#
Vùng tiếp theo đáng chú ý là $0.00115–$0.00130, nơi người mua có thể tìm cách xây dựng một vùng nền vững chắc hơn. Giá vẫn chưa kiểm tra vùng cầu thấp hơn này, vì vậy vẫn có thể giảm thêm trước khi hình thành một đợt phục hồi đáng kể.
Việc giá chạm vùng này không nhất thiết sẽ làm mất đi triển vọng tăng giá rộng hơn. Nếu người mua nhập cuộc và bảo vệ vùng này, giá bật lại có thể đưa vùng cung $0.00250–$0.00260 trở lại tầm ngắm.
Cho đến lúc đó, biến động gần đây đòi hỏi sự thận trọng. Phản ứng quanh vùng cầu sẽ quan trọng hơn việc chạy theo nhịp hồi hiện tại, bởi một đợt phục hồi bền vững cần áp lực mua mạnh hơn để hình thành.
#SOPHUSDT #GócNhìnVĩMô# #MùaAltcoin#
38
Đăng nhập để khám phá thêm nội dung
Tham gia cùng người dùng tiền mã hóa toàn cầu trên Binance Square
⚡️ Nhận thông tin mới nhất và hữu ích về tiền mã hóa.
💬 Được tin cậy bởi sàn giao dịch tiền mã hóa lớn nhất thế giới.
👍 Khám phá những thông tin chuyên sâu thực tế từ những nhà sáng tạo đã xác minh.
Email / Số điện thoại
Chủ đề thịnh hành
TinFed
393,468 lượt xem
1,097 đang thảo luận
Cập nhật cả 2 luôn, hôm nay 3/11/2026 thị trường bị kẹp giữa SOL yếu và FED diều hâu:
SOL hôm nay:
Giá: $91.85 - $93.29, đang quanh $91.5 - $92.3, giảm ∼0.4% - 1.8%, range 24h $91.39 - $94.51
7 ngày -8.5%, 30 ngày -23%
Tin xấu chính:
- ETF rút kỷ lục: 5 phiên gần nhất outflow $63.4M, tuần trước $71.47M là tuần rút lớn nhất từ khi có ETF, tháng 10 rút $143.7M
- Hậu Binance hack $6.3B: Binance bị rút ròng $3.64B sau khi mở lại rút tiền
- Liquidation $15.28M long SOL
Tin tốt đỡ lại:
- RWA trên Solana đạt ATH $5.12B - $5.19B, +17.65% trong 30 ngày
- Doanh thu app Q3 $299M, card spending kỷ lục $141.1M
- Nâng cấp Agave v4.4.0 và Firedancer mainnet v26.10.5 đã release 29/10, Alpenglow protocol giúp finality nhanh hơn
FED hôm nay - quan trọng hơn cho cả crypto:
Đã họp 28/10: FED giữ nguyên lãi suất 3.75% - 4.00%, vote 10-2, 2 người muốn tăng thêm 0.25%
Lãi suất thực tế tuần 26-30/10: Fed funds effective 3.88%, prime 7.00%, discount 4.00%
10-year yield biến động mạnh: từ 5.00% lên 5.05% rồi về 4.94% cuối 30/10
Chủ tịch FED Kevin Warsh phát tín hiệu diều hâu, nói lãi suất sẽ siết mạnh các ngành thâm dụng vốn, thị trường đang pricing khả năng cao tăng 0.25% vào tháng 12
BNY dự báo: thêm 1 lần tăng tháng 12 để giữ uy tín, 2027 thì mù mờ hơn
Hôm nay 3/11 là bầu cử giữa kỳ Mỹ: toàn bộ 435 ghế Hạ viện và 1/3 Thượng viện, market dự đoán Dân chủ có 74% cơ hội lấy Thượng viện, cái này cũng làm dollar và crypto rung lắc
=> Nói ngắn gọn: FED đang tạm pause nhưng không dovish, vẫn có thể tăng tiếp tháng 12 nên crypto bao gồm SOL, BTC đang bị đè risk. SOL đang oversold nhưng nếu FED tăng thì khó hồi mạnh ngay.
#TinFed $SOL
Frog princetrade
·0 lượt thích
·189 lượt xem
TheoDõiFOMC
320,697 lượt xem
1,371 đang thảo luận
BTCRebounds80K
5,448 lượt xem
290 đang thảo luận