

ScalpingX TG Channel
3.9k Bài đăng

ScalpingX TG Channel
Báo cáo
Chặn người dùng
1 scalper with unconventional mindset, loves big risks with big profits. Don't ask about the leverage I use, it's always maximum!
0 Đang theo dõi
10 Người theo dõi
9 Đã thích
Bài đăng
Xem bản dịch
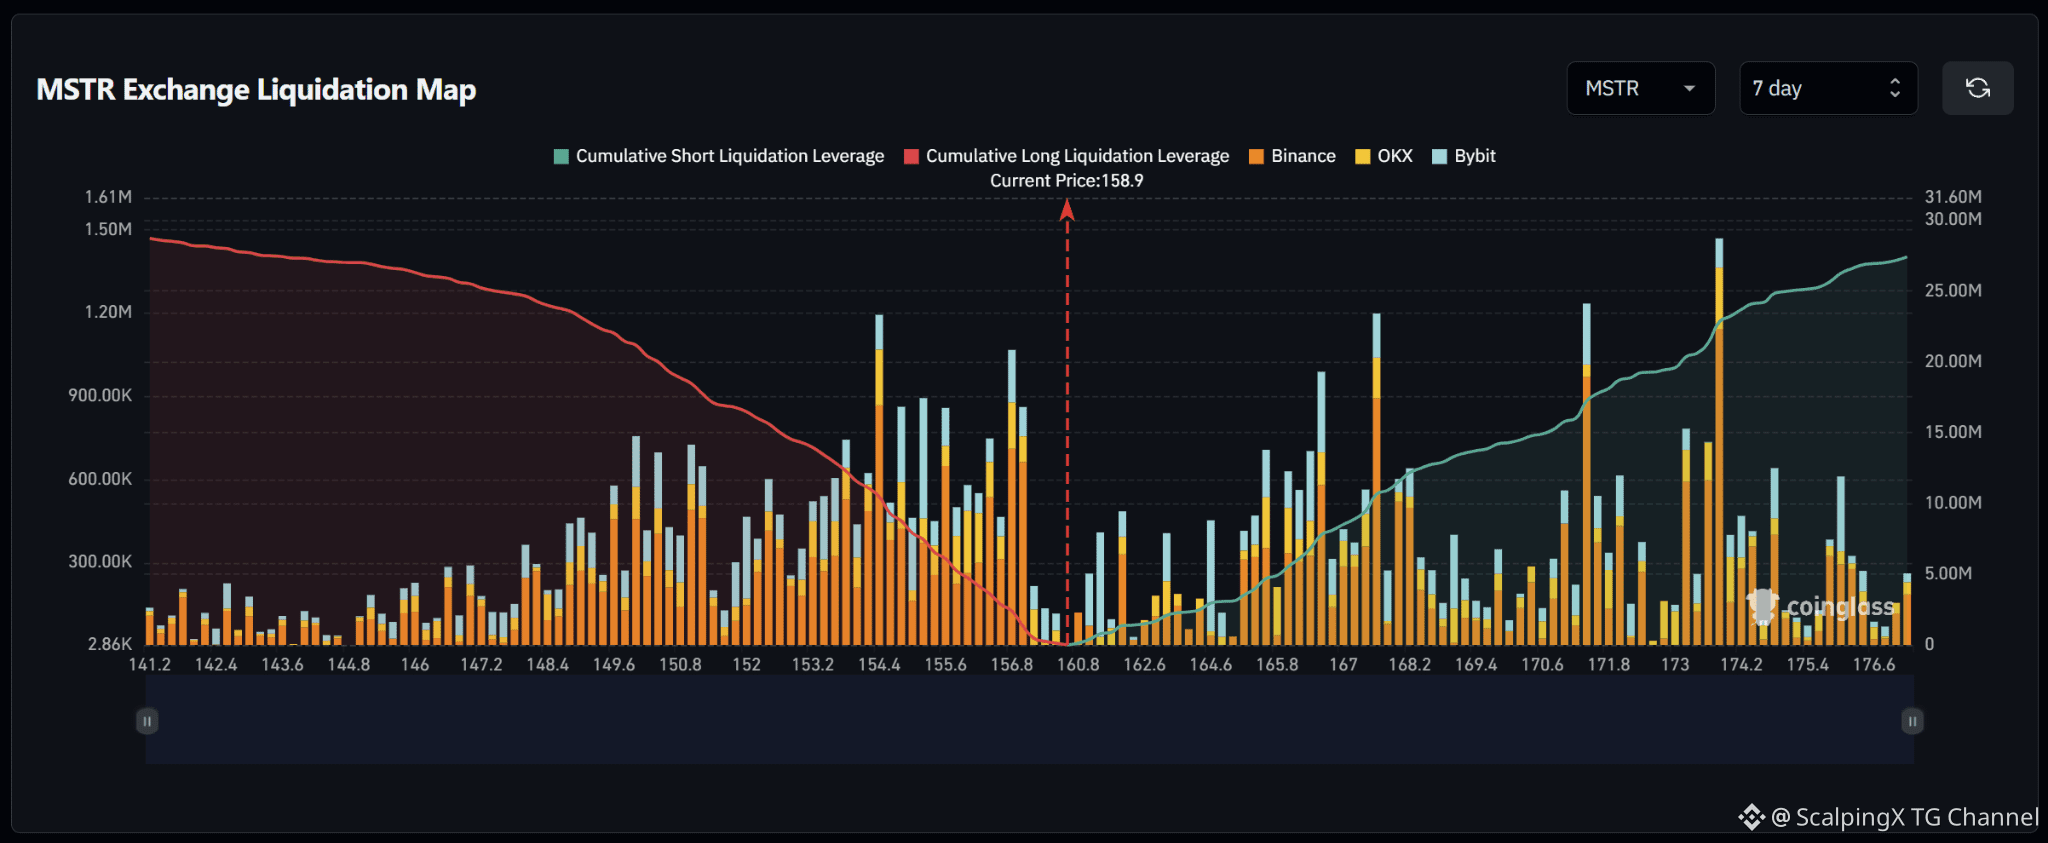
$MSTR – Liquidation Map (7 Days) – Current Price 158.9 🔎 The 7-day liquidation map shows roughly 28–29 million USD in long liquidations below the current price, slightly exceeding approximately 26–27 million USD in short liquidations above. The liquidity structure is therefore fairly balanced, with a mild downside tilt. 📉 Below the market, long-liquidation liquidity is concentrated heavily across 153–157. A major cluster sits around 154.4 with a bar close to 1.2 million USD; the 155–156 area contains several bars around 0.8–0.9 million USD, while 156.7–157.0 holds another cluster above 1 million USD. Losing 156.5 would shift attention toward 155–154 and then 152–150. 📈 Above the market, short-liquidation liquidity is distributed heavily across 165–174. Major clusters appear around 167–168 with a bar near 1.2 million USD, 171–172 with a bar above 1.2 million USD, and especially 173–174 with a bar close to 1.5 million USD. This is the most prominent liquidity zone above the market. 🧭 The broader setup is close to balanced but carries a mild downside tilt. Losing 156.5 would increase the probability of a sweep toward 155–154, followed by 152–150. Breaking above 162–164 would instead expose 167–168 and then 171–174.
$MSTR – Liquidation Map (7 Days) – Current Price 158.9 🔎 The 7-day liquidation map shows roughly 28–29 million USD in long liquidations below the current price, slightly exceeding approximately 26–27 million USD in short liquidations above. The liquidity structure is therefore fairly balanced, with a mild downside tilt. 📉 Below the market, long-liquidation liquidity is concentrated heavily across 153–157. A major cluster sits around 154.4 with a bar close to 1.2 million USD; the 155–156 area contains several bars around 0.8–0.9 million USD, while 156.7–157.0 holds another cluster above 1 million USD. Losing 156.5 would shift attention toward 155–154 and then 152–150. 📈 Above the market, short-liquidation liquidity is distributed heavily across 165–174. Major clusters appear around 167–168 with a bar near 1.2 million USD, 171–172 with a bar above 1.2 million USD, and especially 173–174 with a bar close to 1.5 million USD. This is the most prominent liquidity zone above the market. 🧭 The broader setup is close to balanced but carries a mild downside tilt. Losing 156.5 would increase the probability of a sweep toward 155–154, followed by 152–150. Breaking above 162–164 would instead expose 167–168 and then 171–174.
18
Xem bản dịch
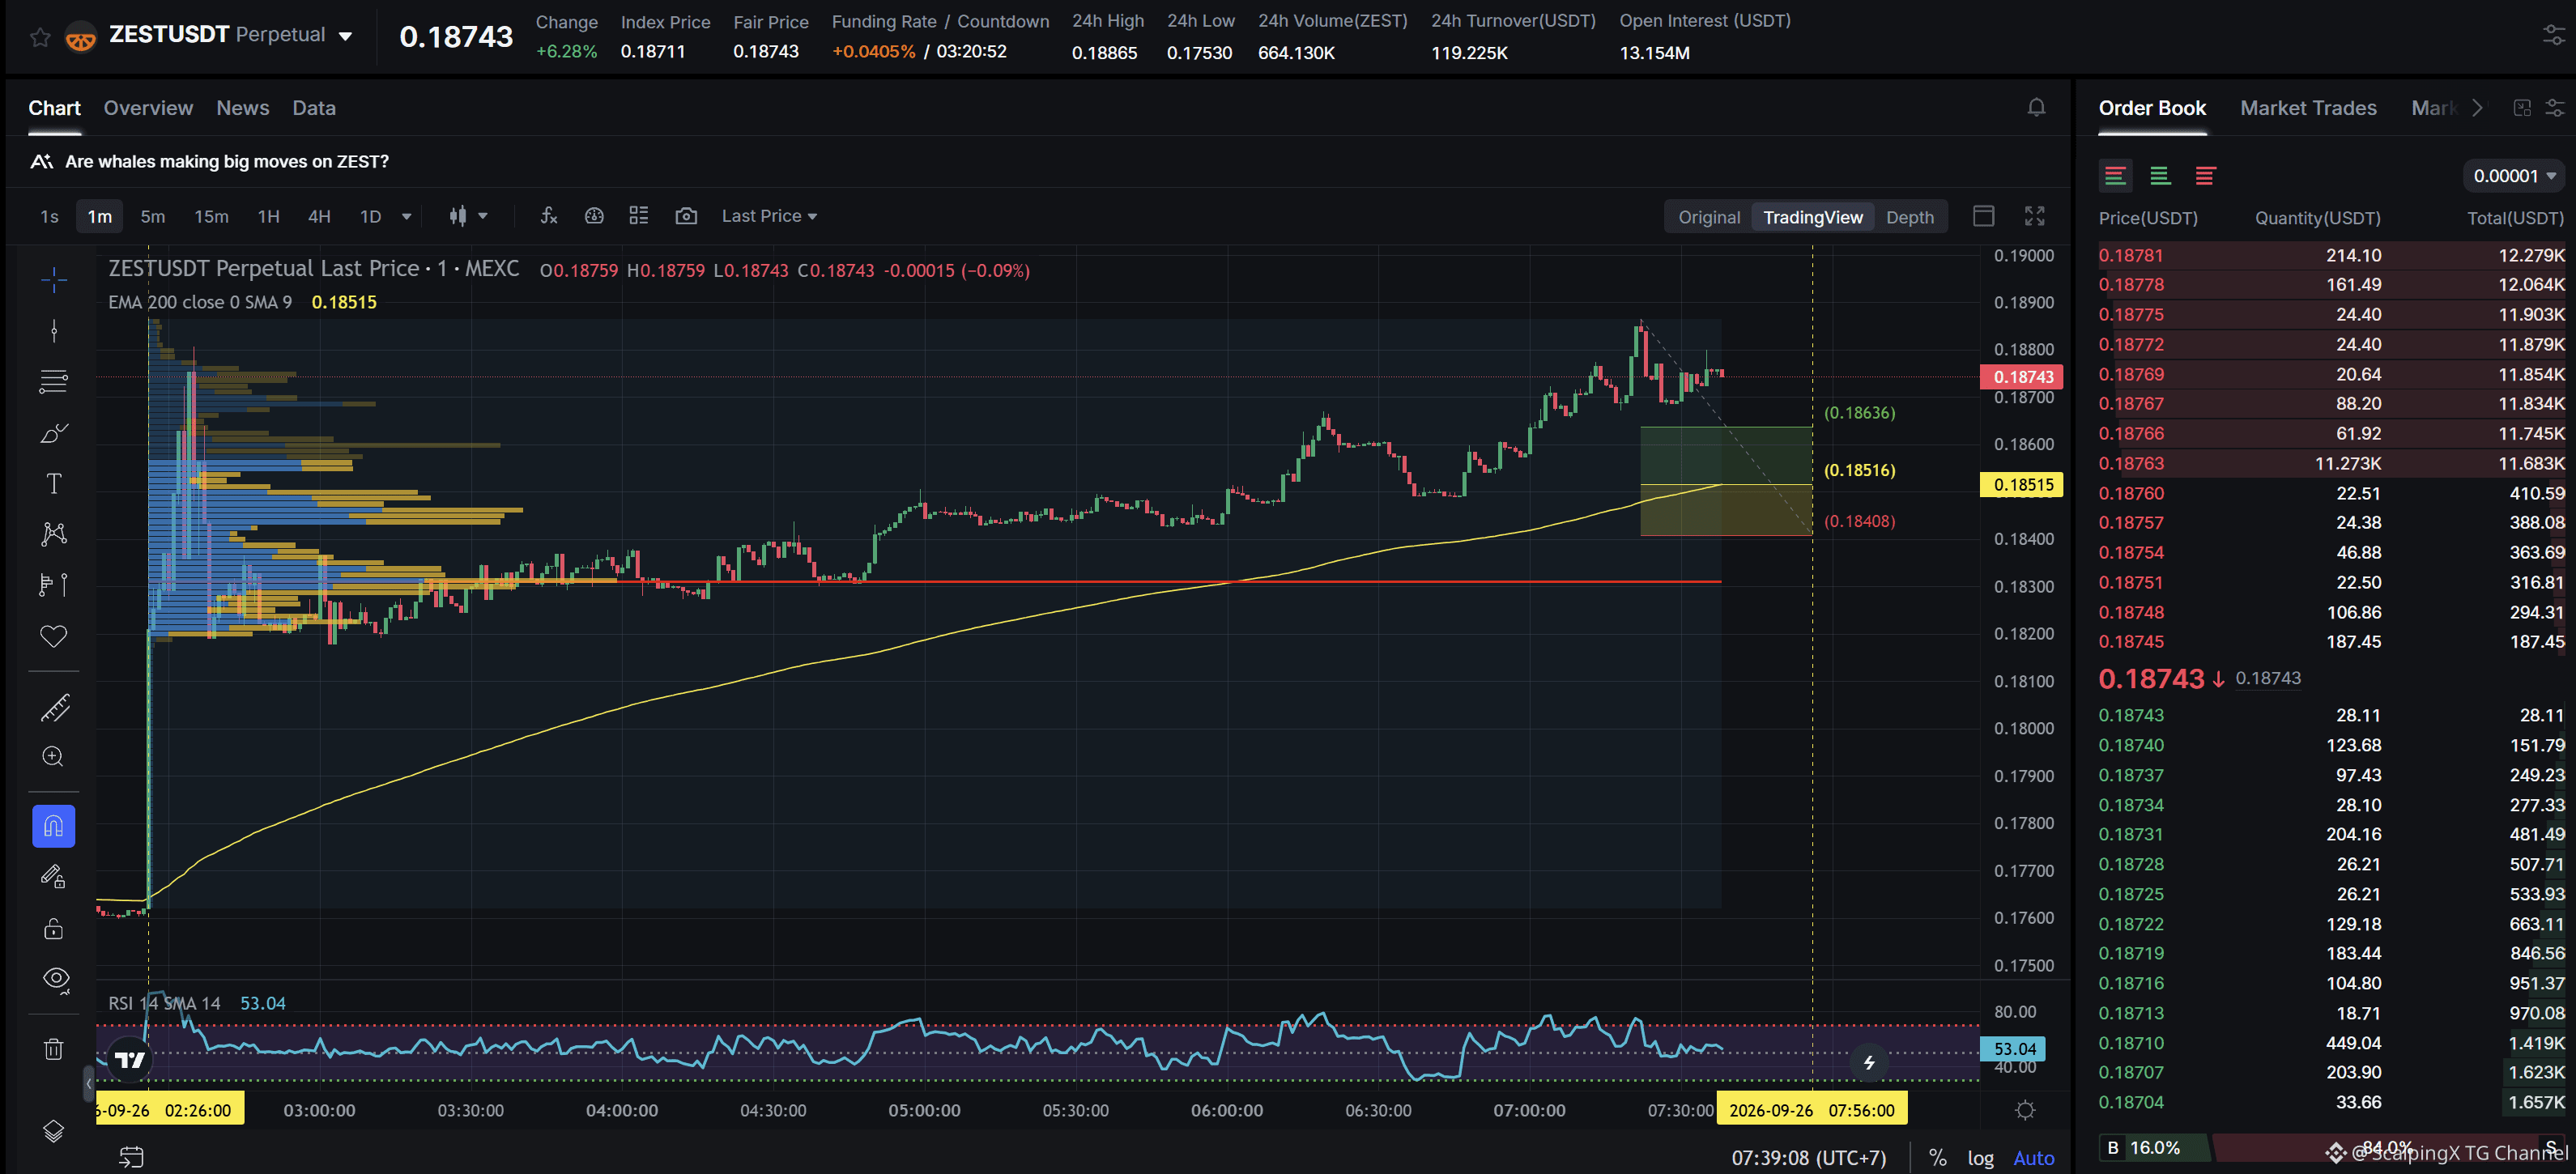
$ZEST - Mcap 27.34M$ - 24h Sentiment +6.00 Bullish SC02 M1 - pending Long order. Entry lies within HVN + not affected by any weak zone, the current support zone is approximately 0.57% wide. The uptrend has lasted 5 hours 14 minutes, with a maximum recorded price increase of 6.90%. If price loses this support zone, the trend is highly likely to reverse downward.
$ZEST - Mcap 27.34M$ - 24h Sentiment +6.00 Bullish SC02 M1 - pending Long order. Entry lies within HVN + not affected by any weak zone, the current support zone is approximately 0.57% wide. The uptrend has lasted 5 hours 14 minutes, with a maximum recorded price increase of 6.90%. If price loses this support zone, the trend is highly likely to reverse downward.
21
Xem bản dịch
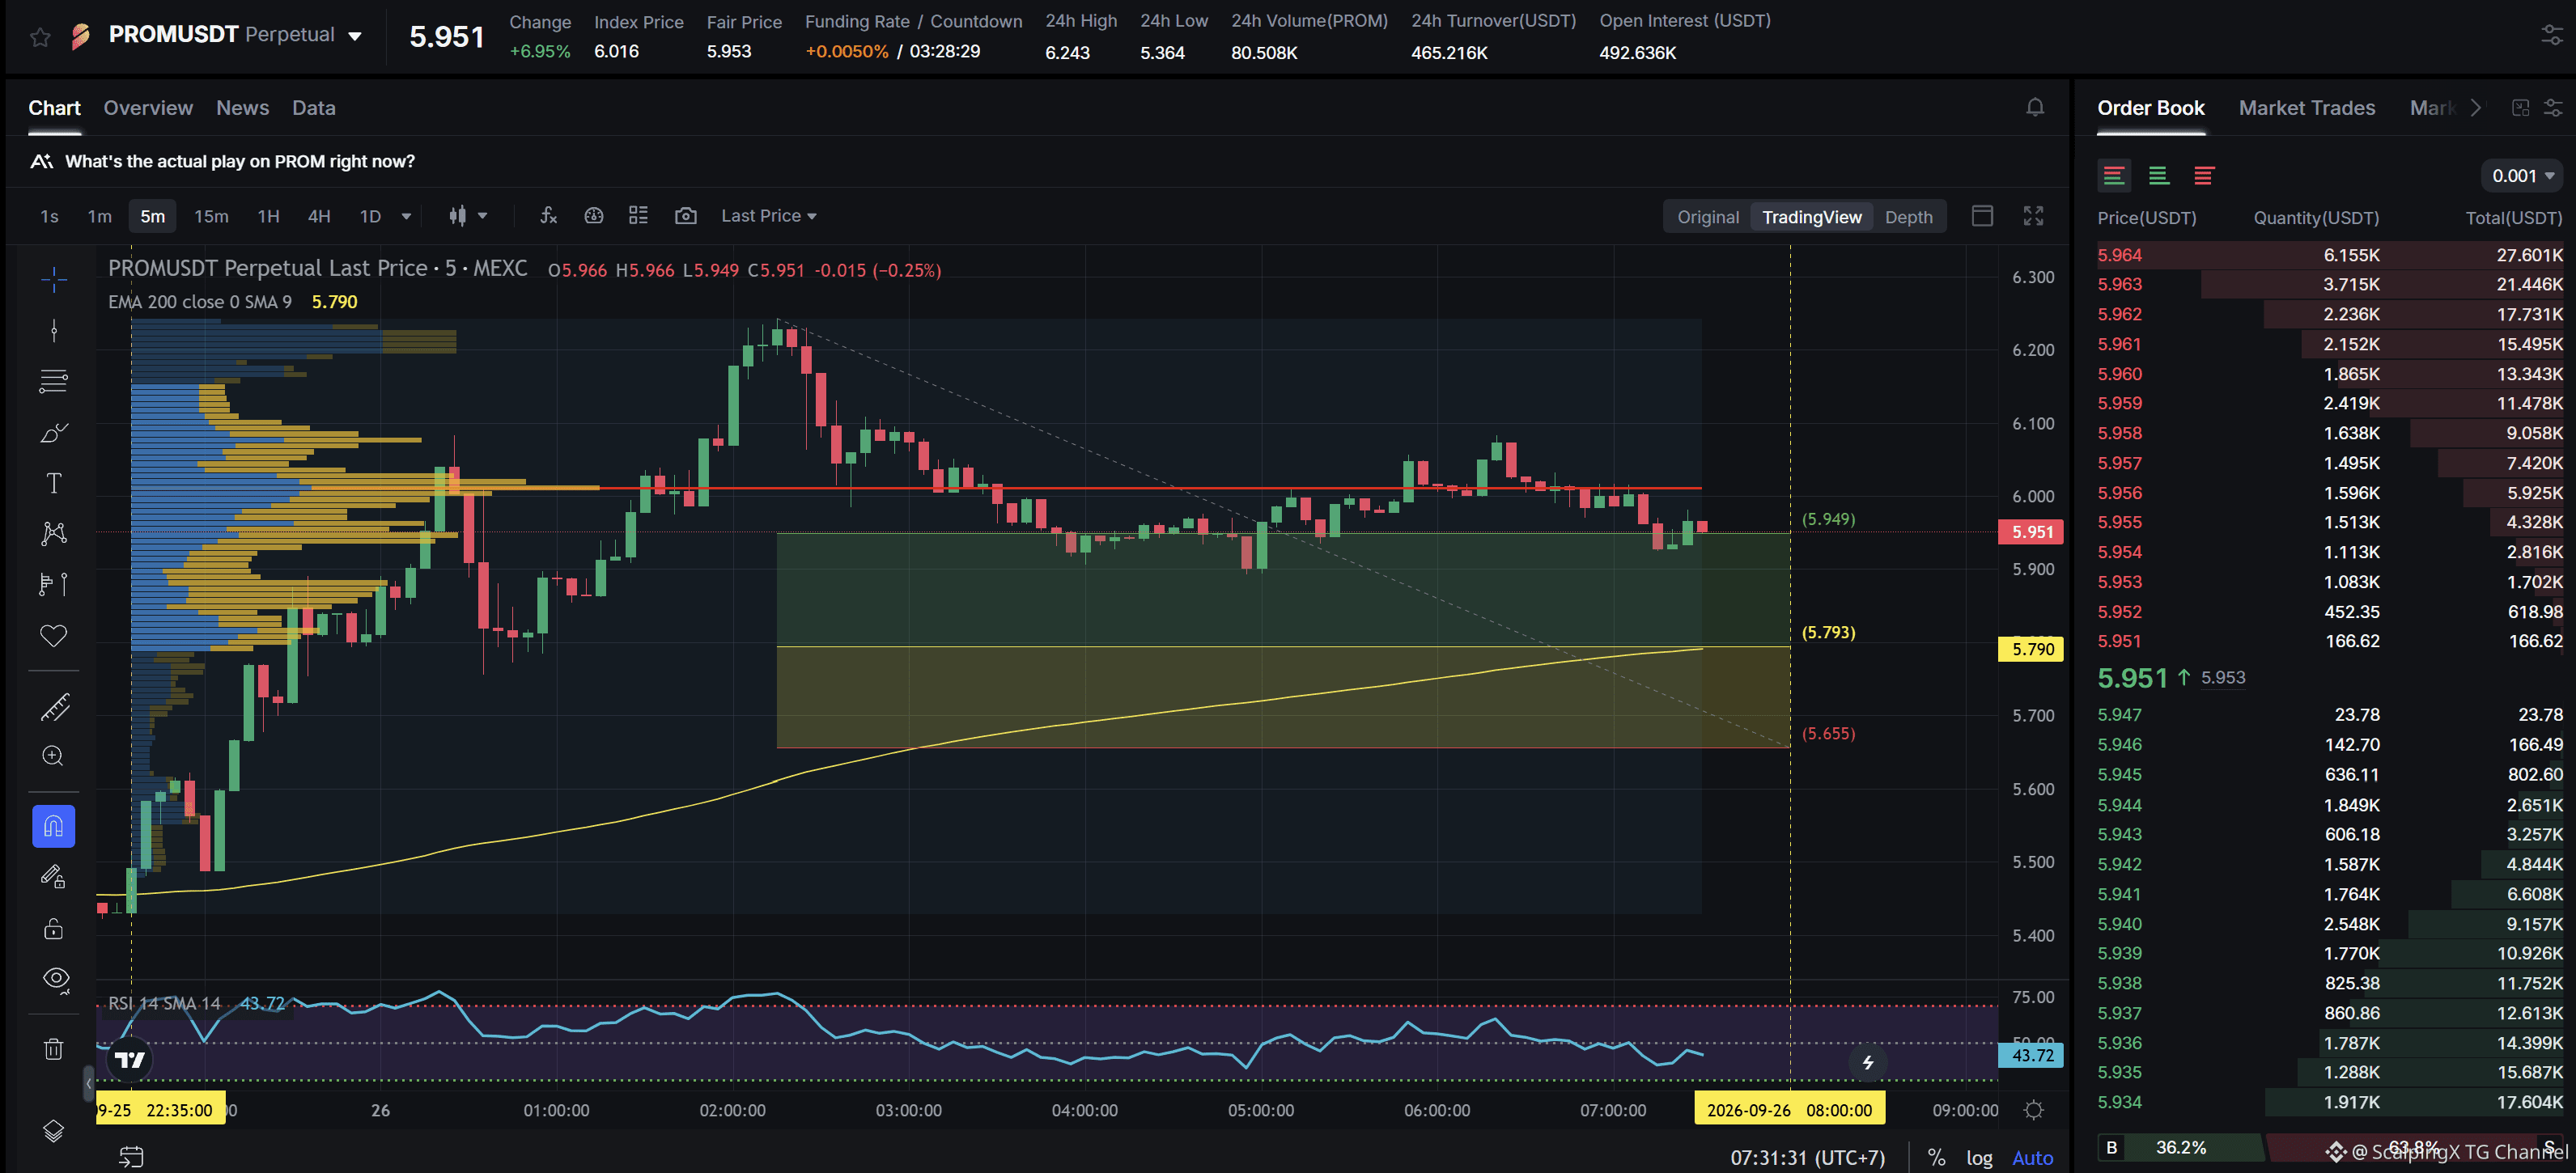
$PROM - Mcap 108.08M$ - 24h Sentiment +6.18 Bullish SC02 M5 - pending Long order. Entry lies within LVN + not affected by any weak zone, the current support zone is approximately 2.41% wide. The uptrend has lasted 8 hours 55 minutes, with a maximum recorded price increase of 14.39%. If price loses this support zone, the trend is highly likely to reverse downward.
$PROM - Mcap 108.08M$ - 24h Sentiment +6.18 Bullish SC02 M5 - pending Long order. Entry lies within LVN + not affected by any weak zone, the current support zone is approximately 2.41% wide. The uptrend has lasted 8 hours 55 minutes, with a maximum recorded price increase of 14.39%. If price loses this support zone, the trend is highly likely to reverse downward.
30
Xem bản dịch
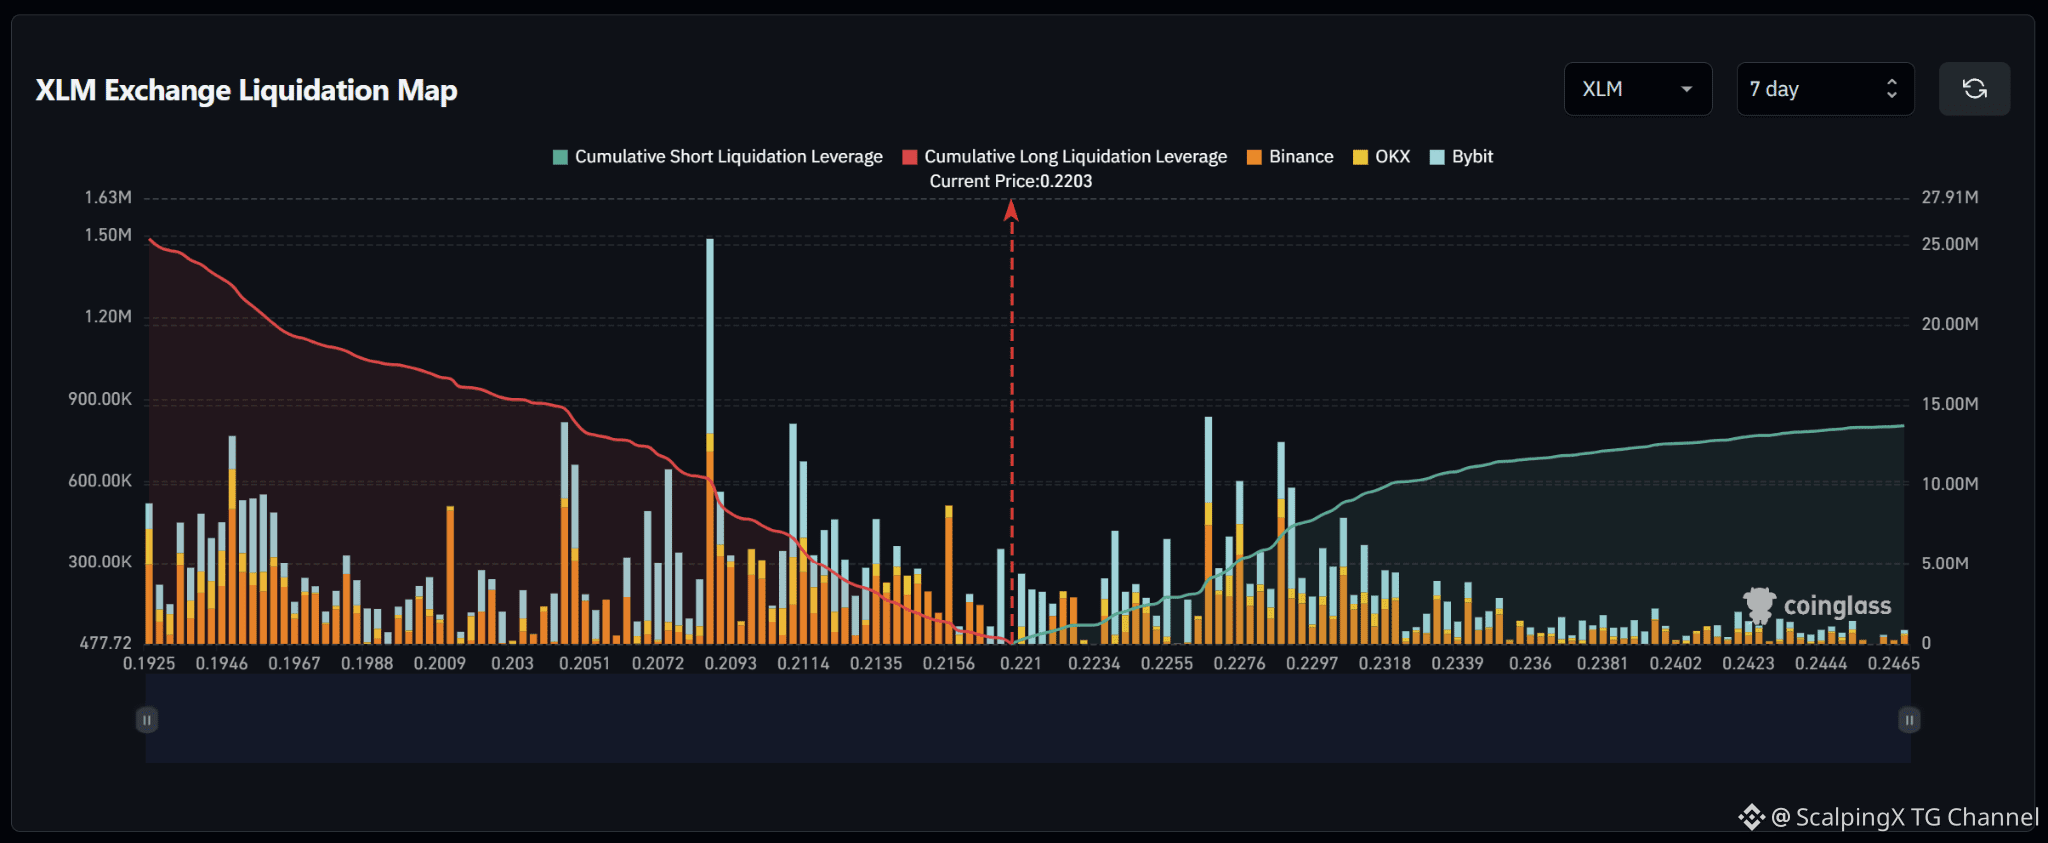
$XLM – Liquidation Map (7 Days) – Current Price 0.2203 🔎 The 7-day liquidation map shows roughly 25 million USD in long liquidations below the current price, significantly exceeding approximately 14 million USD in short liquidations above. The liquidity structure therefore favors the downside, with around 1.8 times more cumulative liquidity below the market. 📉 Below the market, long-liquidation liquidity is concentrated heavily across 0.205–0.214. The strongest cluster sits around 0.208–0.209 with a bar near 1.5 million USD; 0.211–0.212 also contains a bar around 0.8 million USD, while 0.204–0.205 holds another cluster above 0.8 million USD. Losing 0.216 would shift attention toward 0.214–0.211 and then 0.209–0.205. 📈 Above the market, short-liquidation liquidity is concentrated mainly across 0.225–0.231. The strongest cluster sits around 0.226–0.227 with a bar near 0.8 million USD, while 0.228–0.230 contains several bars around 0.6–0.75 million USD. Above 0.232, liquidity density declines noticeably. 🧭 The broader setup still favors the downside because long-liquidation exposure below is meaningfully larger. Losing 0.216 would increase the probability of a sweep toward 0.214–0.211, followed by 0.209–0.205. Breaking above 0.223 would instead expose 0.226–0.230 before price enters a thinner liquidity zone.
$XLM – Liquidation Map (7 Days) – Current Price 0.2203 🔎 The 7-day liquidation map shows roughly 25 million USD in long liquidations below the current price, significantly exceeding approximately 14 million USD in short liquidations above. The liquidity structure therefore favors the downside, with around 1.8 times more cumulative liquidity below the market. 📉 Below the market, long-liquidation liquidity is concentrated heavily across 0.205–0.214. The strongest cluster sits around 0.208–0.209 with a bar near 1.5 million USD; 0.211–0.212 also contains a bar around 0.8 million USD, while 0.204–0.205 holds another cluster above 0.8 million USD. Losing 0.216 would shift attention toward 0.214–0.211 and then 0.209–0.205. 📈 Above the market, short-liquidation liquidity is concentrated mainly across 0.225–0.231. The strongest cluster sits around 0.226–0.227 with a bar near 0.8 million USD, while 0.228–0.230 contains several bars around 0.6–0.75 million USD. Above 0.232, liquidity density declines noticeably. 🧭 The broader setup still favors the downside because long-liquidation exposure below is meaningfully larger. Losing 0.216 would increase the probability of a sweep toward 0.214–0.211, followed by 0.209–0.205. Breaking above 0.223 would instead expose 0.226–0.230 before price enters a thinner liquidity zone.
Xem bản dịch
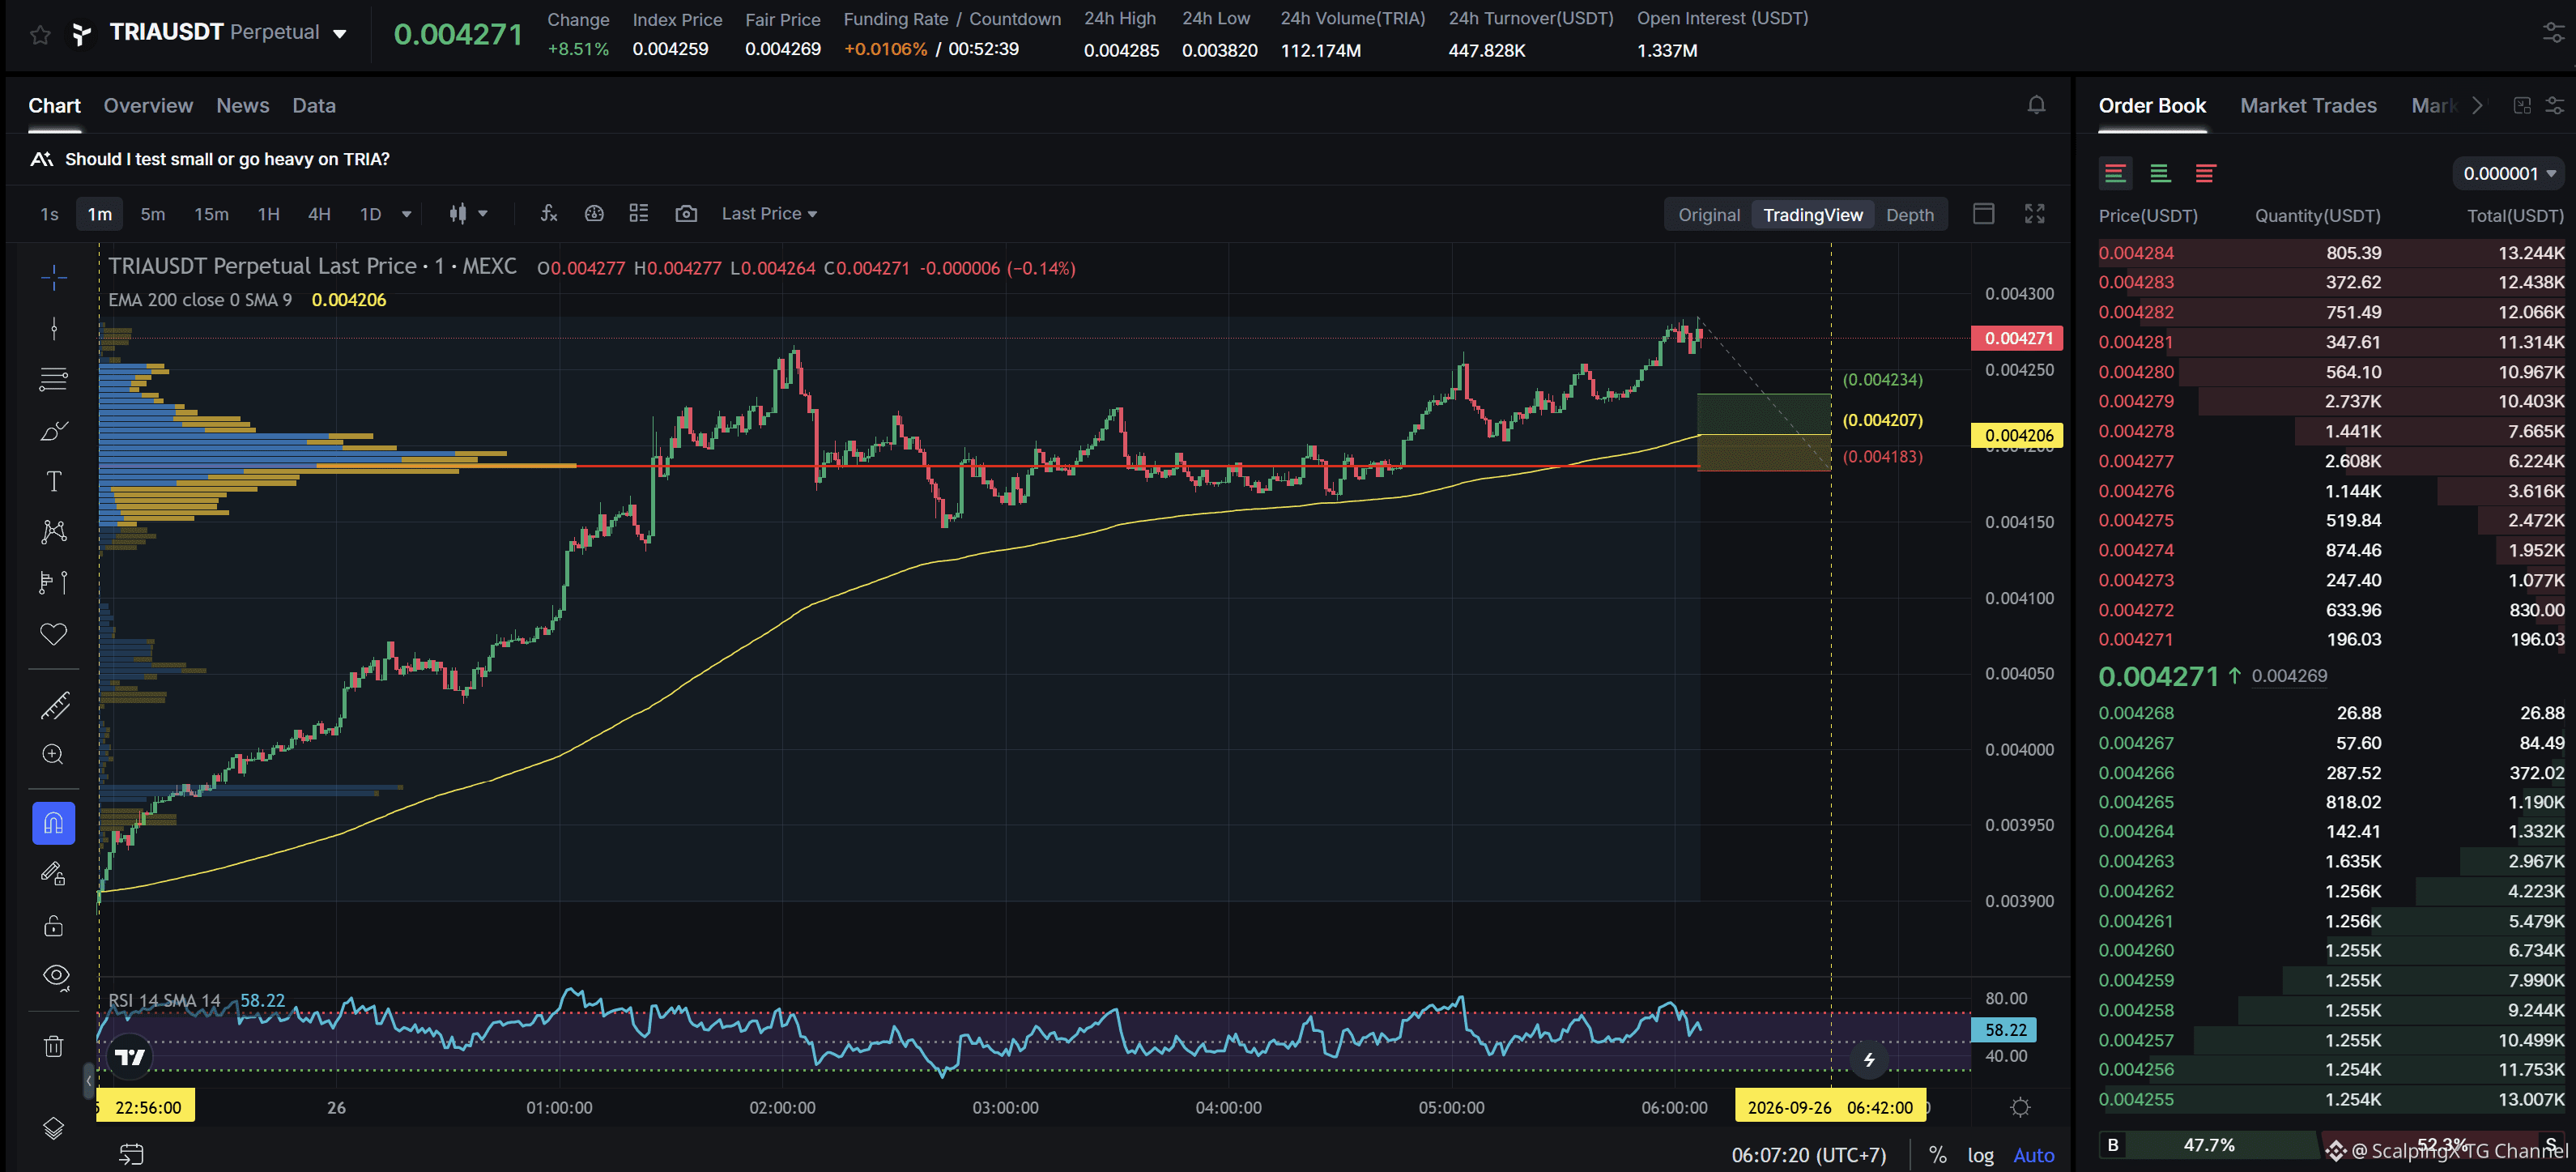
$TRIA - Mcap 9.12M$ - 24h Sentiment -8.00 Bearish SC02 M1 - pending Long order. Entry contains POC + not affected by any weak zone, the current support zone is approximately 0.58% wide. The uptrend has lasted 7 hours 12 minutes, with a maximum recorded price increase of 9.70%. If price loses this support zone, the trend is highly likely to reverse downward.
$TRIA - Mcap 9.12M$ - 24h Sentiment -8.00 Bearish SC02 M1 - pending Long order. Entry contains POC + not affected by any weak zone, the current support zone is approximately 0.58% wide. The uptrend has lasted 7 hours 12 minutes, with a maximum recorded price increase of 9.70%. If price loses this support zone, the trend is highly likely to reverse downward.
7
Xem bản dịch
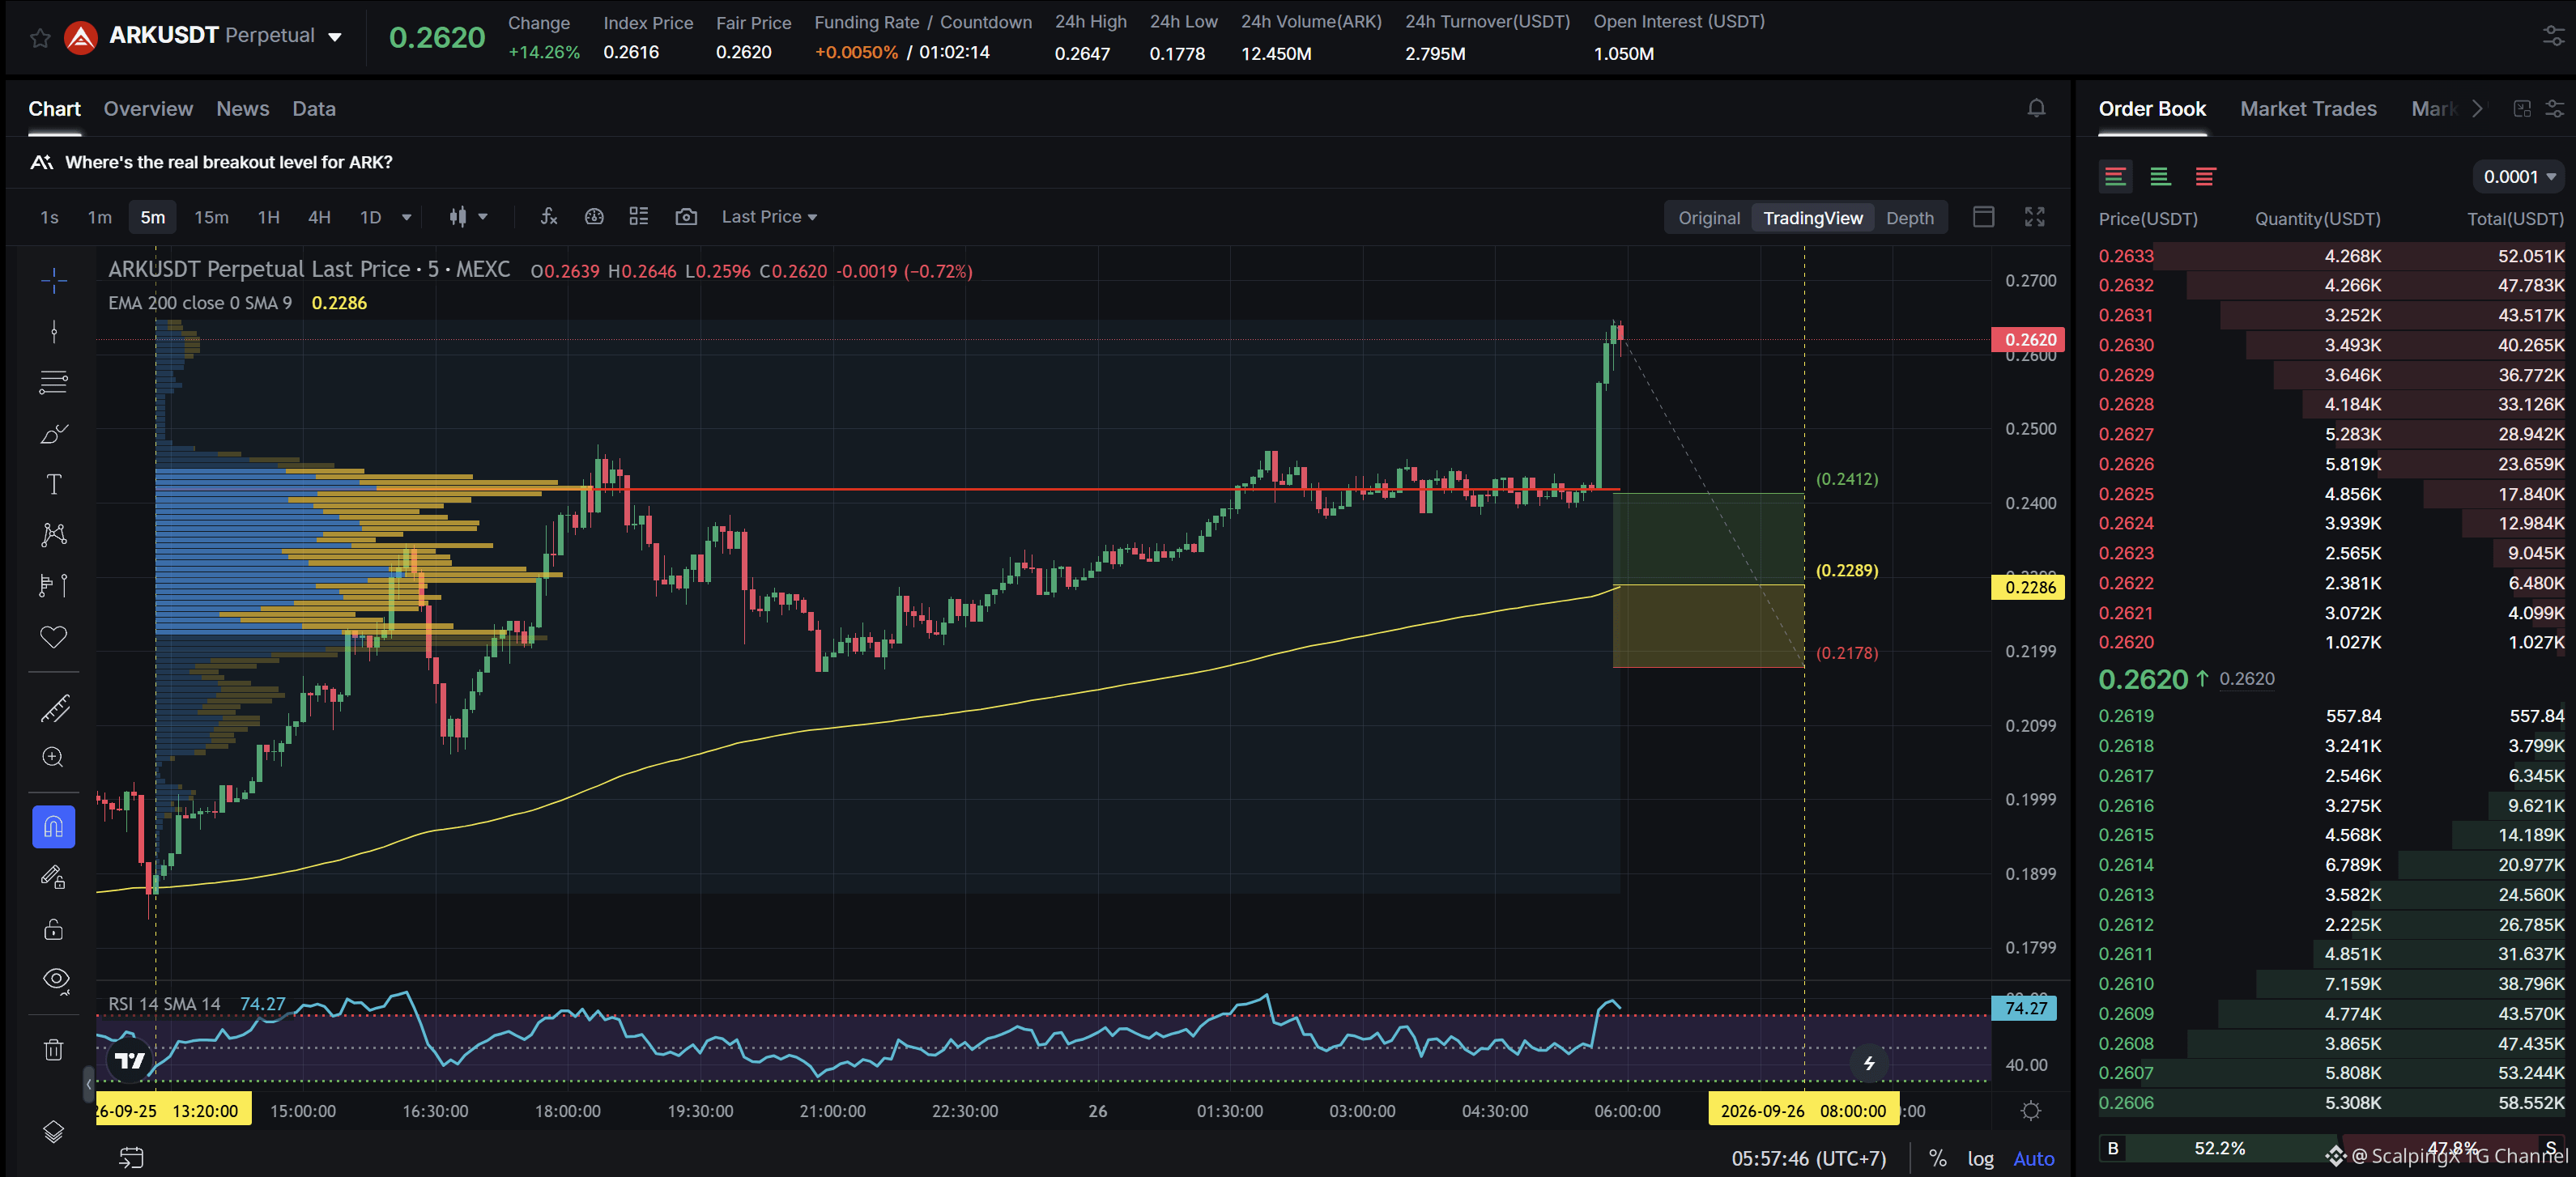
$ARK - Mcap 50.65M$ - 24h Sentiment +6.45 Bullish SC02 M5 - pending Long order. Entry lies within HVN + not affected by any weak zone, the current support zone is approximately 4.92% wide. The uptrend has lasted 16 hours 35 minutes, with a maximum recorded price increase of 40.73%. If price loses this support zone, the trend is highly likely to reverse downward.
$ARK - Mcap 50.65M$ - 24h Sentiment +6.45 Bullish SC02 M5 - pending Long order. Entry lies within HVN + not affected by any weak zone, the current support zone is approximately 4.92% wide. The uptrend has lasted 16 hours 35 minutes, with a maximum recorded price increase of 40.73%. If price loses this support zone, the trend is highly likely to reverse downward.
Xem bản dịch
Microsoft reshapes Copilot into a unified AI work platform
🧩 Microsoft is consolidating Copilot into a single app built around three main layers — Home, Code, and Autopilot — as it moves beyond a standalone chatbot toward a central interface for digital work.
💻 Home brings Chat, Cowork, and Office directly into Copilot, while Code lets users build apps, dashboards, and automations with natural language. Autopilot focuses on cloud-based agents that can keep working and coordinate through Teams or Outlook.
💰 A key shift is the commercial model, with Microsoft moving from fixed per-user pricing toward a mix of licensing and consumption-based billing. Heavier workloads such as Cowork, Code, Autopilot, and frontier models will be charged based on usage.
📌 Most features are still rolling out in stages, so the near-term impact is primarily strategic and competitive. The eventual revenue contribution will depend on deployment speed and enterprise adoption.
#Microsoft
$MSFT
Microsoft reshapes Copilot into a unified AI work platform
🧩 Microsoft is consolidating Copilot into a single app built around three main layers — Home, Code, and Autopilot — as it moves beyond a standalone chatbot toward a central interface for digital work.
💻 Home brings Chat, Cowork, and Office directly into Copilot, while Code lets users build apps, dashboards, and automations with natural language. Autopilot focuses on cloud-based agents that can keep working and coordinate through Teams or Outlook.
💰 A key shift is the commercial model, with Microsoft moving from fixed per-user pricing toward a mix of licensing and consumption-based billing. Heavier workloads such as Cowork, Code, Autopilot, and frontier models will be charged based on usage.
📌 Most features are still rolling out in stages, so the near-term impact is primarily strategic and competitive. The eventual revenue contribution will depend on deployment speed and enterprise adoption.
#Microsoft
$MSFT
🧩 Microsoft is consolidating Copilot into a single app built around three main layers — Home, Code, and Autopilot — as it moves beyond a standalone chatbot toward a central interface for digital work.
💻 Home brings Chat, Cowork, and Office directly into Copilot, while Code lets users build apps, dashboards, and automations with natural language. Autopilot focuses on cloud-based agents that can keep working and coordinate through Teams or Outlook.
💰 A key shift is the commercial model, with Microsoft moving from fixed per-user pricing toward a mix of licensing and consumption-based billing. Heavier workloads such as Cowork, Code, Autopilot, and frontier models will be charged based on usage.
📌 Most features are still rolling out in stages, so the near-term impact is primarily strategic and competitive. The eventual revenue contribution will depend on deployment speed and enterprise adoption.
#Microsoft
$MSFT

23
Xem bản dịch
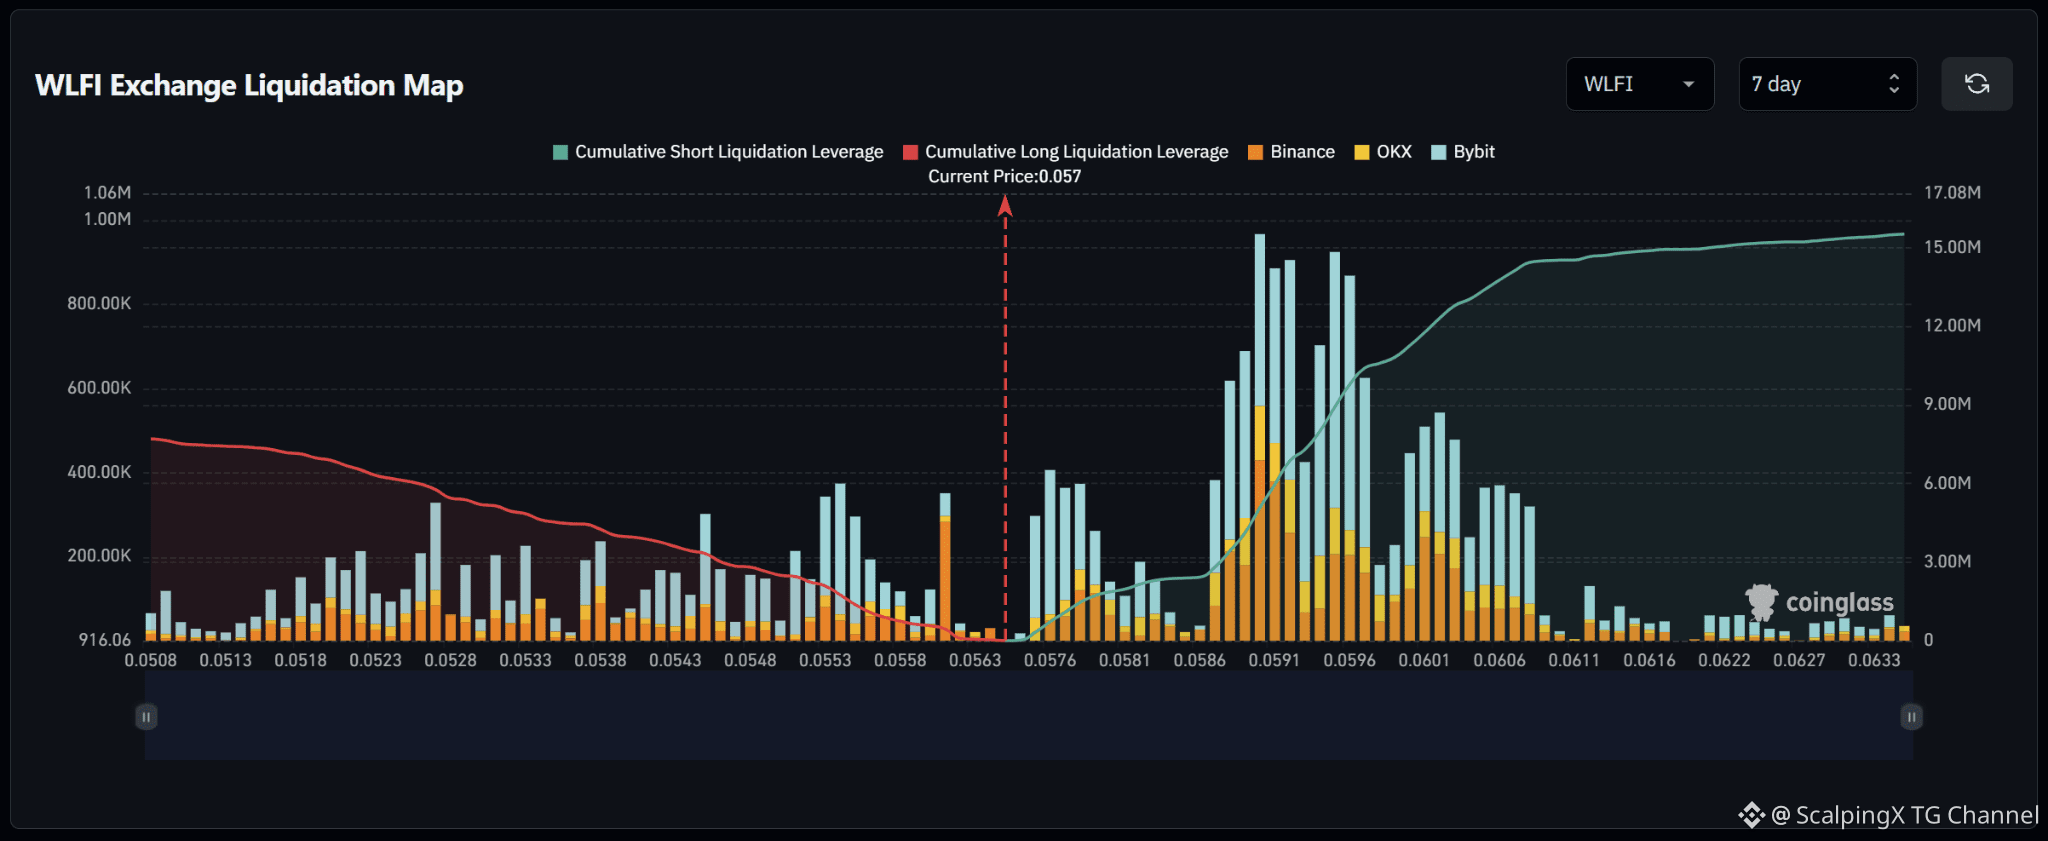
$WLFI – Liquidation Map (7 Days) – Current Price 0.057 🔎 The 7-day liquidation map shows roughly 15–16 million USD in short liquidations above the current price, significantly exceeding approximately 7–8 million USD in long liquidations below. The liquidity structure therefore clearly favors the upside, with around twice as much cumulative liquidity above the market. 📉 Below the market, long-liquidation liquidity is relatively dispersed. Notable clusters appear around 0.0552–0.0555 with a bar near 0.35–0.37 million USD, while the 0.0525–0.0545 area contains several smaller pockets around 0.15–0.30 million USD. Losing 0.0563 would shift attention toward 0.0555–0.0552 and then 0.0545–0.0538. 📈 Above the market, short-liquidation liquidity is heavily concentrated across 0.0586–0.0607. The strongest cluster sits around 0.0589–0.0596 with several bars near 0.7–0.95 million USD, while 0.0600–0.0604 also contains multiple bars around 0.45–0.55 million USD. This is currently the most prominent liquidity band on the map. 🧭 The broader setup clearly favors the upside because short-liquidation exposure above is roughly twice as large. Breaking above 0.0580 would expose 0.0589–0.0596; if momentum continues, 0.0600–0.0607 becomes the next major liquidity magnet. Losing 0.0563 would instead increase the probability of a sweep toward 0.0555–0.0552.
$WLFI – Liquidation Map (7 Days) – Current Price 0.057 🔎 The 7-day liquidation map shows roughly 15–16 million USD in short liquidations above the current price, significantly exceeding approximately 7–8 million USD in long liquidations below. The liquidity structure therefore clearly favors the upside, with around twice as much cumulative liquidity above the market. 📉 Below the market, long-liquidation liquidity is relatively dispersed. Notable clusters appear around 0.0552–0.0555 with a bar near 0.35–0.37 million USD, while the 0.0525–0.0545 area contains several smaller pockets around 0.15–0.30 million USD. Losing 0.0563 would shift attention toward 0.0555–0.0552 and then 0.0545–0.0538. 📈 Above the market, short-liquidation liquidity is heavily concentrated across 0.0586–0.0607. The strongest cluster sits around 0.0589–0.0596 with several bars near 0.7–0.95 million USD, while 0.0600–0.0604 also contains multiple bars around 0.45–0.55 million USD. This is currently the most prominent liquidity band on the map. 🧭 The broader setup clearly favors the upside because short-liquidation exposure above is roughly twice as large. Breaking above 0.0580 would expose 0.0589–0.0596; if momentum continues, 0.0600–0.0607 becomes the next major liquidity magnet. Losing 0.0563 would instead increase the probability of a sweep toward 0.0555–0.0552.
Xem bản dịch
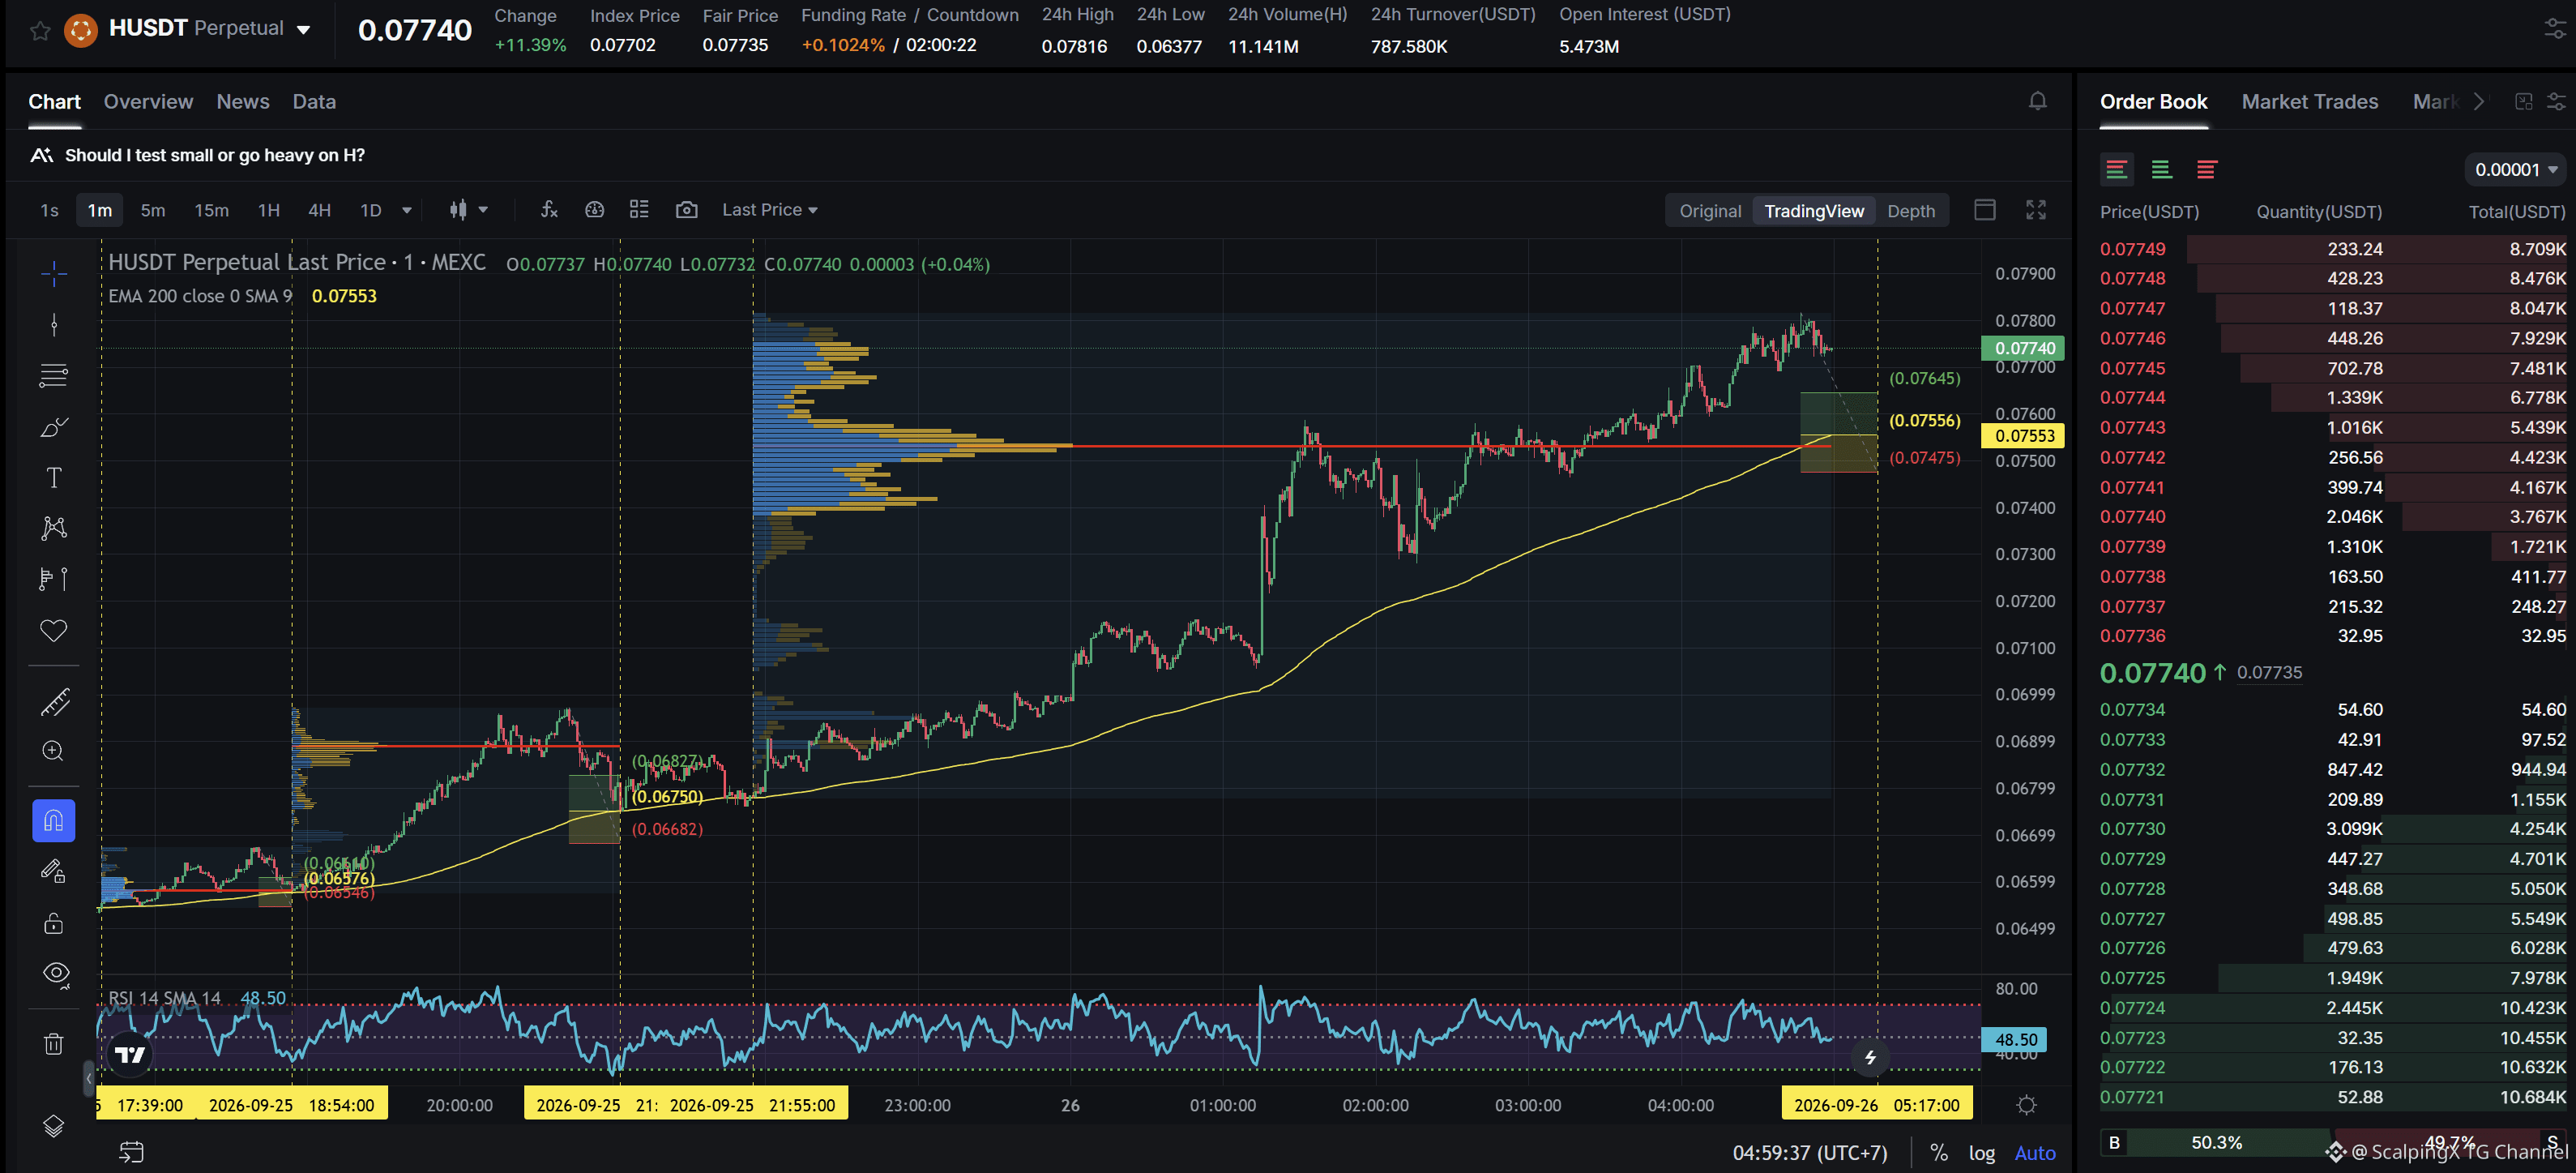
$H - Mcap 154.69M$ - 24h Sentiment +4.52 Bullish SC02 M1 - pending Long order. Entry contains POC + meets positive simplification with two consecutive previously highly profitable Long orders, the current support zone is approximately 1.09% wide. The uptrend has lasted 7 hours 7 minutes, with a maximum recorded price increase of 15.29%. If price loses this support zone, the trend is highly likely to reverse downward.
$H - Mcap 154.69M$ - 24h Sentiment +4.52 Bullish SC02 M1 - pending Long order. Entry contains POC + meets positive simplification with two consecutive previously highly profitable Long orders, the current support zone is approximately 1.09% wide. The uptrend has lasted 7 hours 7 minutes, with a maximum recorded price increase of 15.29%. If price loses this support zone, the trend is highly likely to reverse downward.
Xem bản dịch
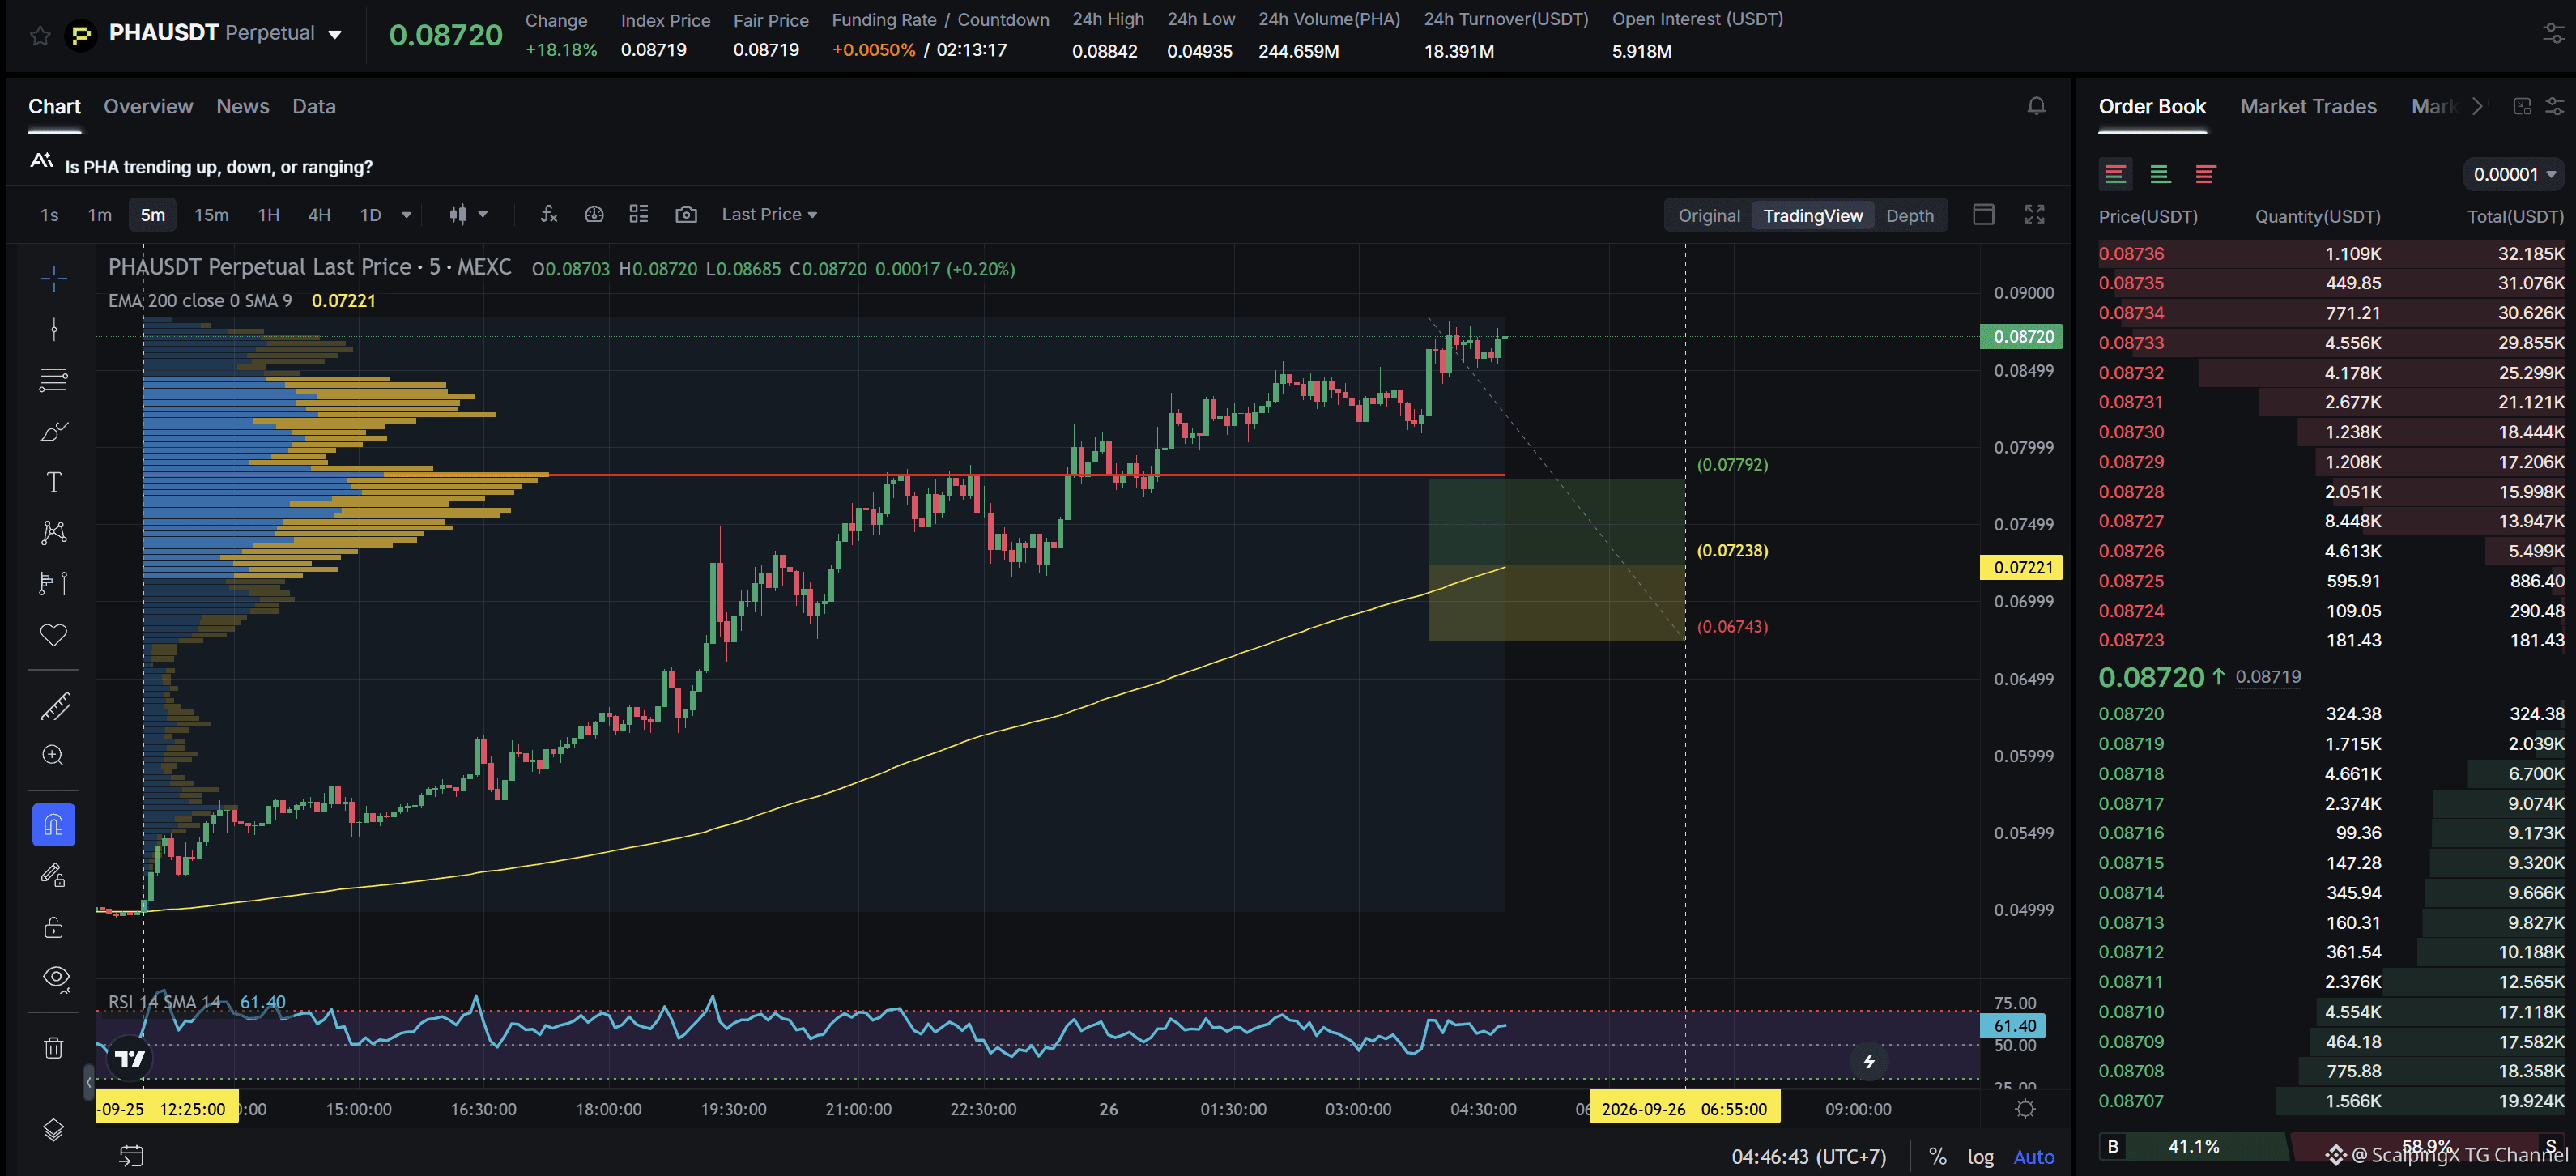
$PHA - Mcap 75.5M$ - 24h Sentiment +4.65 Bullish SC02 M5 - pending Long order. Entry lies within LVN + not affected by any weak zone, the current support zone is approximately 6.87% wide. The uptrend has lasted 16 hours 20 minutes, with a maximum recorded price increase of 79.55%. If price loses this support zone, the trend is highly likely to reverse downward.
$PHA - Mcap 75.5M$ - 24h Sentiment +4.65 Bullish SC02 M5 - pending Long order. Entry lies within LVN + not affected by any weak zone, the current support zone is approximately 6.87% wide. The uptrend has lasted 16 hours 20 minutes, with a maximum recorded price increase of 79.55%. If price loses this support zone, the trend is highly likely to reverse downward.
Xem bản dịch
US consumer sentiment falls to a four-month low as inflation expectations remain elevated
📉 The University of Michigan’s final September consumer sentiment index came in at 48.1, slightly above the preliminary 47.8 and expectations around 47.5–47.6, but still down 7% from August.
🔎 Weakness was concentrated in the outlook, with the Expectations Index falling 10.1% to 46.3, while Current Conditions declined only 1.9%. This suggests consumers are more concerned about the months ahead than about current conditions.
🔥 One-year inflation expectations held at 4.6%, while the five-year measure rose to 3.4%. Higher fuel costs and trade-related pressures continue to weigh on sentiment, leaving growth concerns elevated alongside persistent price risks.
🏦 The final reading did not deliver a new negative shock, as most of the deterioration was already visible in the preliminary release. Still, weak sentiment combined with elevated inflation expectations keeps the outlook for Fed policy easing more complicated.
#USMacro
$ETH
US consumer sentiment falls to a four-month low as inflation expectations remain elevated
📉 The University of Michigan’s final September consumer sentiment index came in at 48.1, slightly above the preliminary 47.8 and expectations around 47.5–47.6, but still down 7% from August.
🔎 Weakness was concentrated in the outlook, with the Expectations Index falling 10.1% to 46.3, while Current Conditions declined only 1.9%. This suggests consumers are more concerned about the months ahead than about current conditions.
🔥 One-year inflation expectations held at 4.6%, while the five-year measure rose to 3.4%. Higher fuel costs and trade-related pressures continue to weigh on sentiment, leaving growth concerns elevated alongside persistent price risks.
🏦 The final reading did not deliver a new negative shock, as most of the deterioration was already visible in the preliminary release. Still, weak sentiment combined with elevated inflation expectations keeps the outlook for Fed policy easing more complicated.
#USMacro
$ETH
📉 The University of Michigan’s final September consumer sentiment index came in at 48.1, slightly above the preliminary 47.8 and expectations around 47.5–47.6, but still down 7% from August.
🔎 Weakness was concentrated in the outlook, with the Expectations Index falling 10.1% to 46.3, while Current Conditions declined only 1.9%. This suggests consumers are more concerned about the months ahead than about current conditions.
🔥 One-year inflation expectations held at 4.6%, while the five-year measure rose to 3.4%. Higher fuel costs and trade-related pressures continue to weigh on sentiment, leaving growth concerns elevated alongside persistent price risks.
🏦 The final reading did not deliver a new negative shock, as most of the deterioration was already visible in the preliminary release. Still, weak sentiment combined with elevated inflation expectations keeps the outlook for Fed policy easing more complicated.
#USMacro
$ETH

2
Xem bản dịch
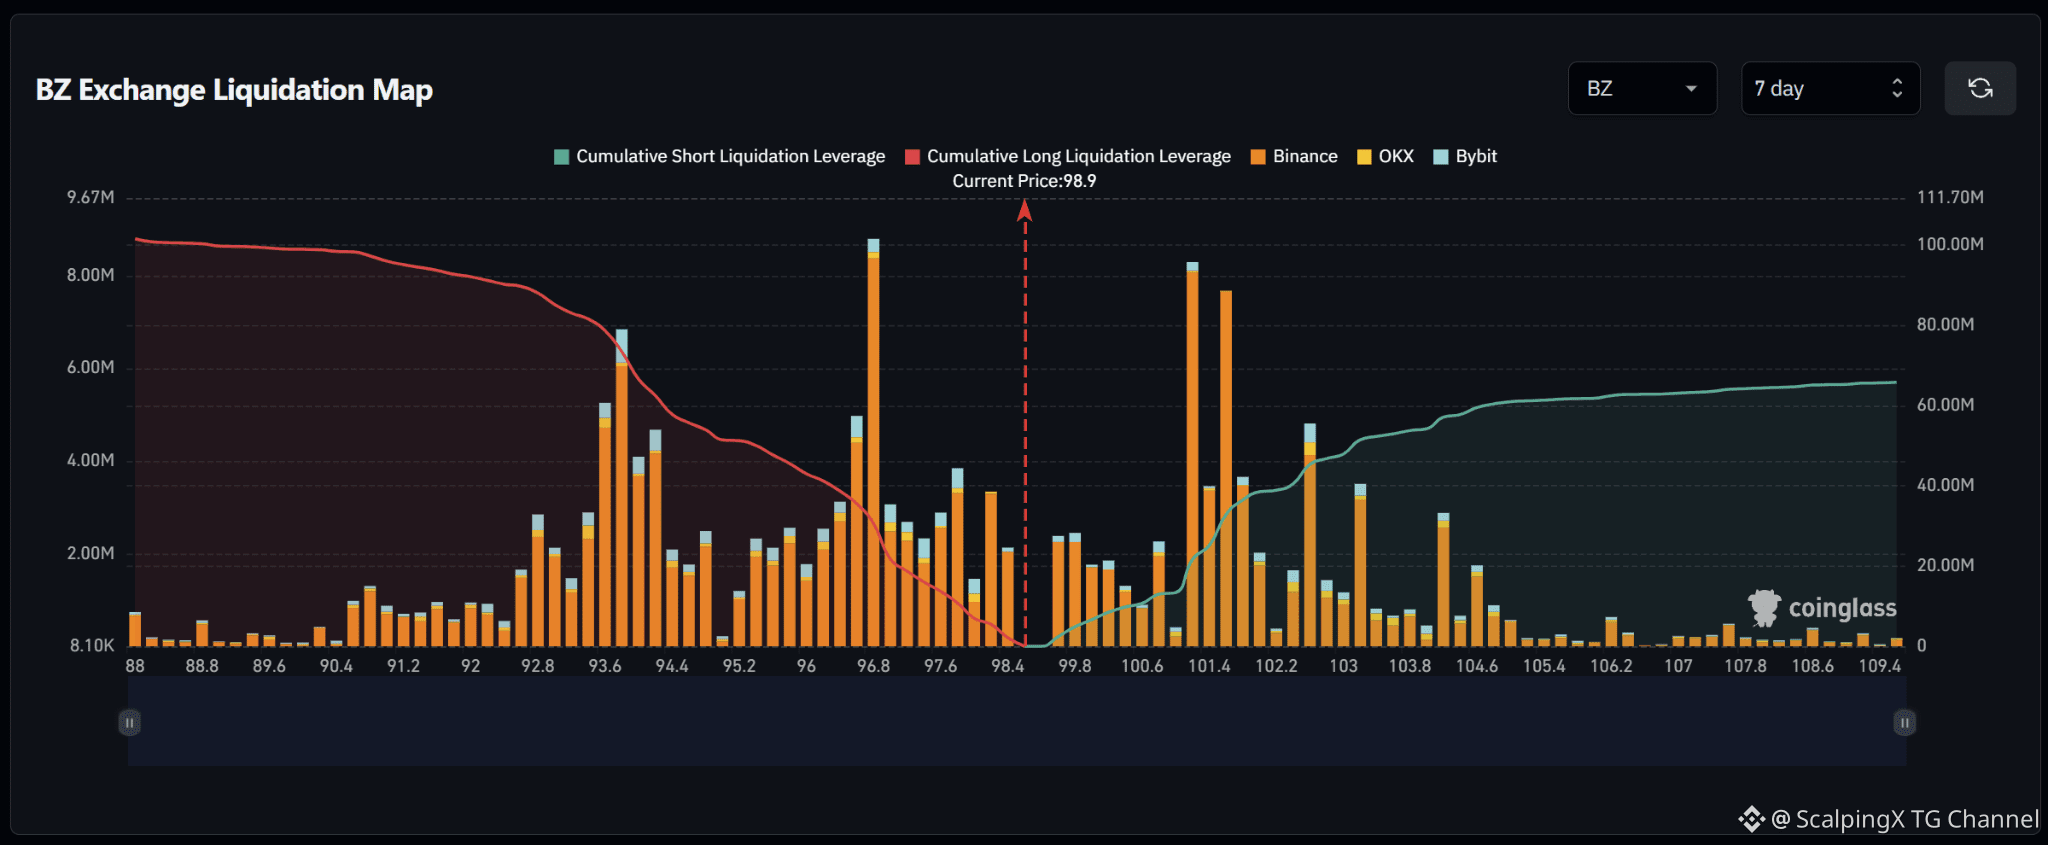
$BZ – Liquidation Map (7 Days) – Current Price 98.9 🔎 The 7-day liquidation map shows roughly 100 million USD in long liquidations below the current price, significantly exceeding approximately 65 million USD in short liquidations above. The liquidity structure therefore favors the downside, with around 1.5 times more cumulative liquidity below the market. 📉 Below the market, long-liquidation liquidity is concentrated heavily across 93.5–97.8. The strongest cluster sits around 96.7–96.9 with a bar close to 9 million USD; 93.5–94.2 also contains several bars around 4–7 million USD, while 97.5–97.8 holds another cluster near 4 million USD. Losing 98.4 would shift attention toward 97.8–96.7 and then 94.2–93.5. 📈 Above the market, short-liquidation liquidity is concentrated mainly across 101–103. The two strongest clusters sit around 101.2 and 101.6 with bars near 8 million USD, while 102.6–103.2 contains several pockets around 3–5 million USD. Further out, 104.2–104.6 still holds some notable liquidity. 🧭 The broader setup favors the downside because long-liquidation exposure below is larger. Losing 98.4 would increase the probability of a sweep toward 97.8–96.7, followed by 94.2–93.5. Breaking above 100.6 would instead expose 101.2–101.6 and then 102.6–103.2.
$BZ – Liquidation Map (7 Days) – Current Price 98.9 🔎 The 7-day liquidation map shows roughly 100 million USD in long liquidations below the current price, significantly exceeding approximately 65 million USD in short liquidations above. The liquidity structure therefore favors the downside, with around 1.5 times more cumulative liquidity below the market. 📉 Below the market, long-liquidation liquidity is concentrated heavily across 93.5–97.8. The strongest cluster sits around 96.7–96.9 with a bar close to 9 million USD; 93.5–94.2 also contains several bars around 4–7 million USD, while 97.5–97.8 holds another cluster near 4 million USD. Losing 98.4 would shift attention toward 97.8–96.7 and then 94.2–93.5. 📈 Above the market, short-liquidation liquidity is concentrated mainly across 101–103. The two strongest clusters sit around 101.2 and 101.6 with bars near 8 million USD, while 102.6–103.2 contains several pockets around 3–5 million USD. Further out, 104.2–104.6 still holds some notable liquidity. 🧭 The broader setup favors the downside because long-liquidation exposure below is larger. Losing 98.4 would increase the probability of a sweep toward 97.8–96.7, followed by 94.2–93.5. Breaking above 100.6 would instead expose 101.2–101.6 and then 102.6–103.2.
1
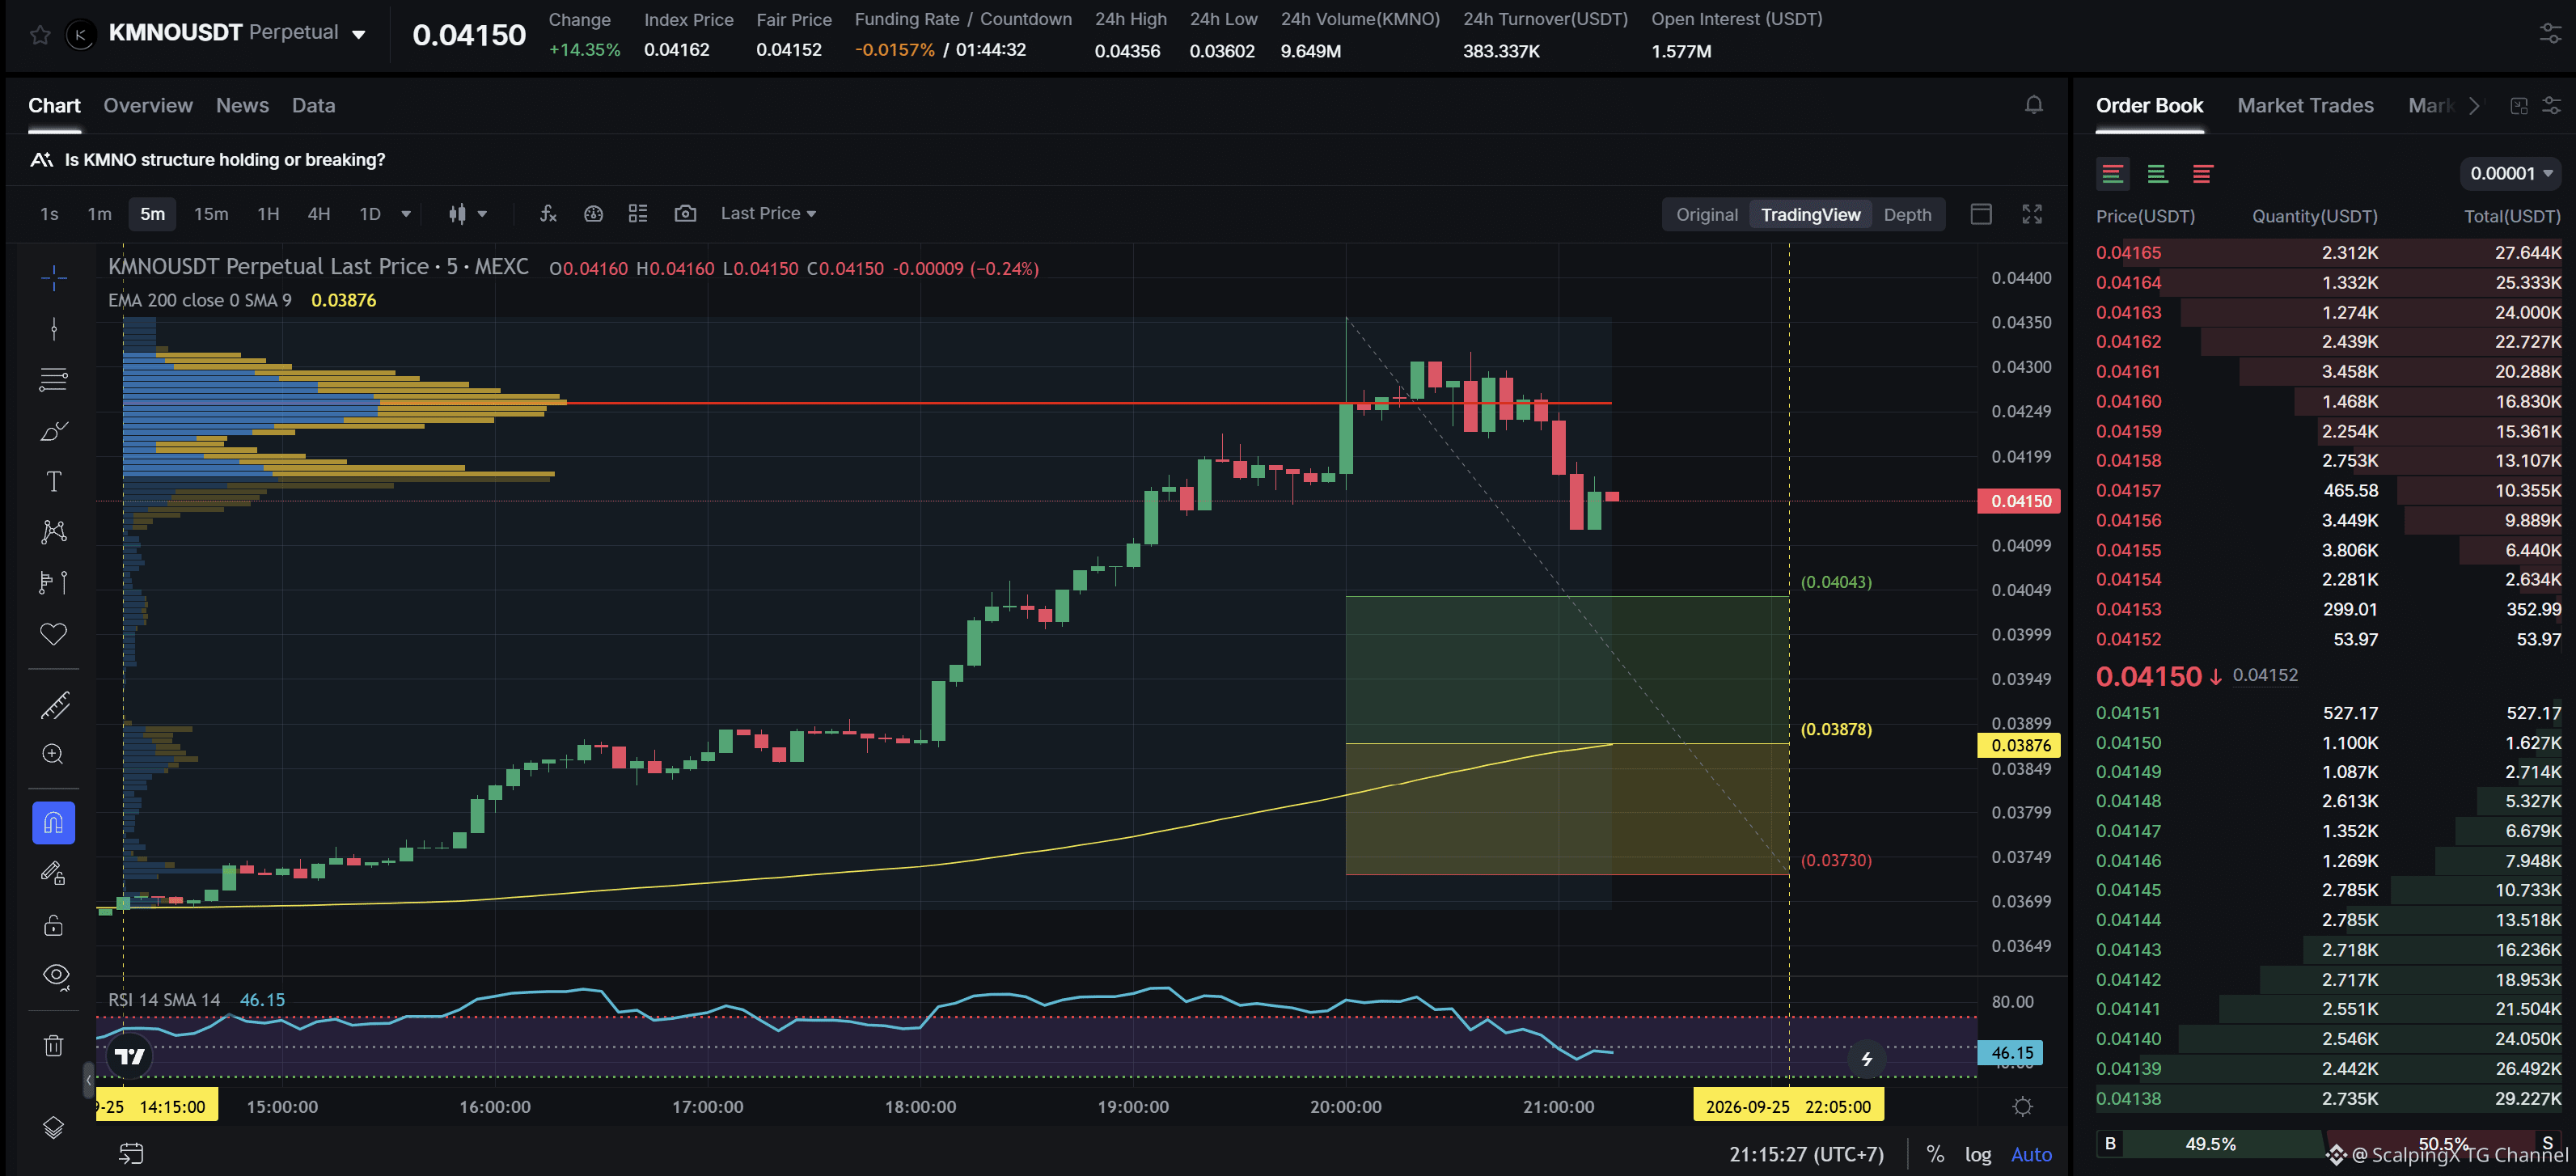
$KMNO - Mcap 235.4M$ - 24h Tâm lý Trung tính SC02 M5 - đang chờ Lệnh lớn. Điểm vào nằm trong LVN + không bị ảnh hưởng bởi bất kỳ vùng yếu nào; vùng hỗ trợ hiện tại có độ rộng khoảng 3,85%. Xu hướng tăng đã kéo dài 7 giờ, với mức tăng giá tối đa ghi nhận là 17,91%. Nếu giá mất vùng hỗ trợ này, khả năng cao xu hướng sẽ đảo chiều đi xuống.
$KMNO - Mcap 235.4M$ - 24h Tâm lý Trung tính SC02 M5 - đang chờ Lệnh lớn. Điểm vào nằm trong LVN + không bị ảnh hưởng bởi bất kỳ vùng yếu nào; vùng hỗ trợ hiện tại có độ rộng khoảng 3,85%. Xu hướng tăng đã kéo dài 7 giờ, với mức tăng giá tối đa ghi nhận là 17,91%. Nếu giá mất vùng hỗ trợ này, khả năng cao xu hướng sẽ đảo chiều đi xuống.
Xem bản dịch
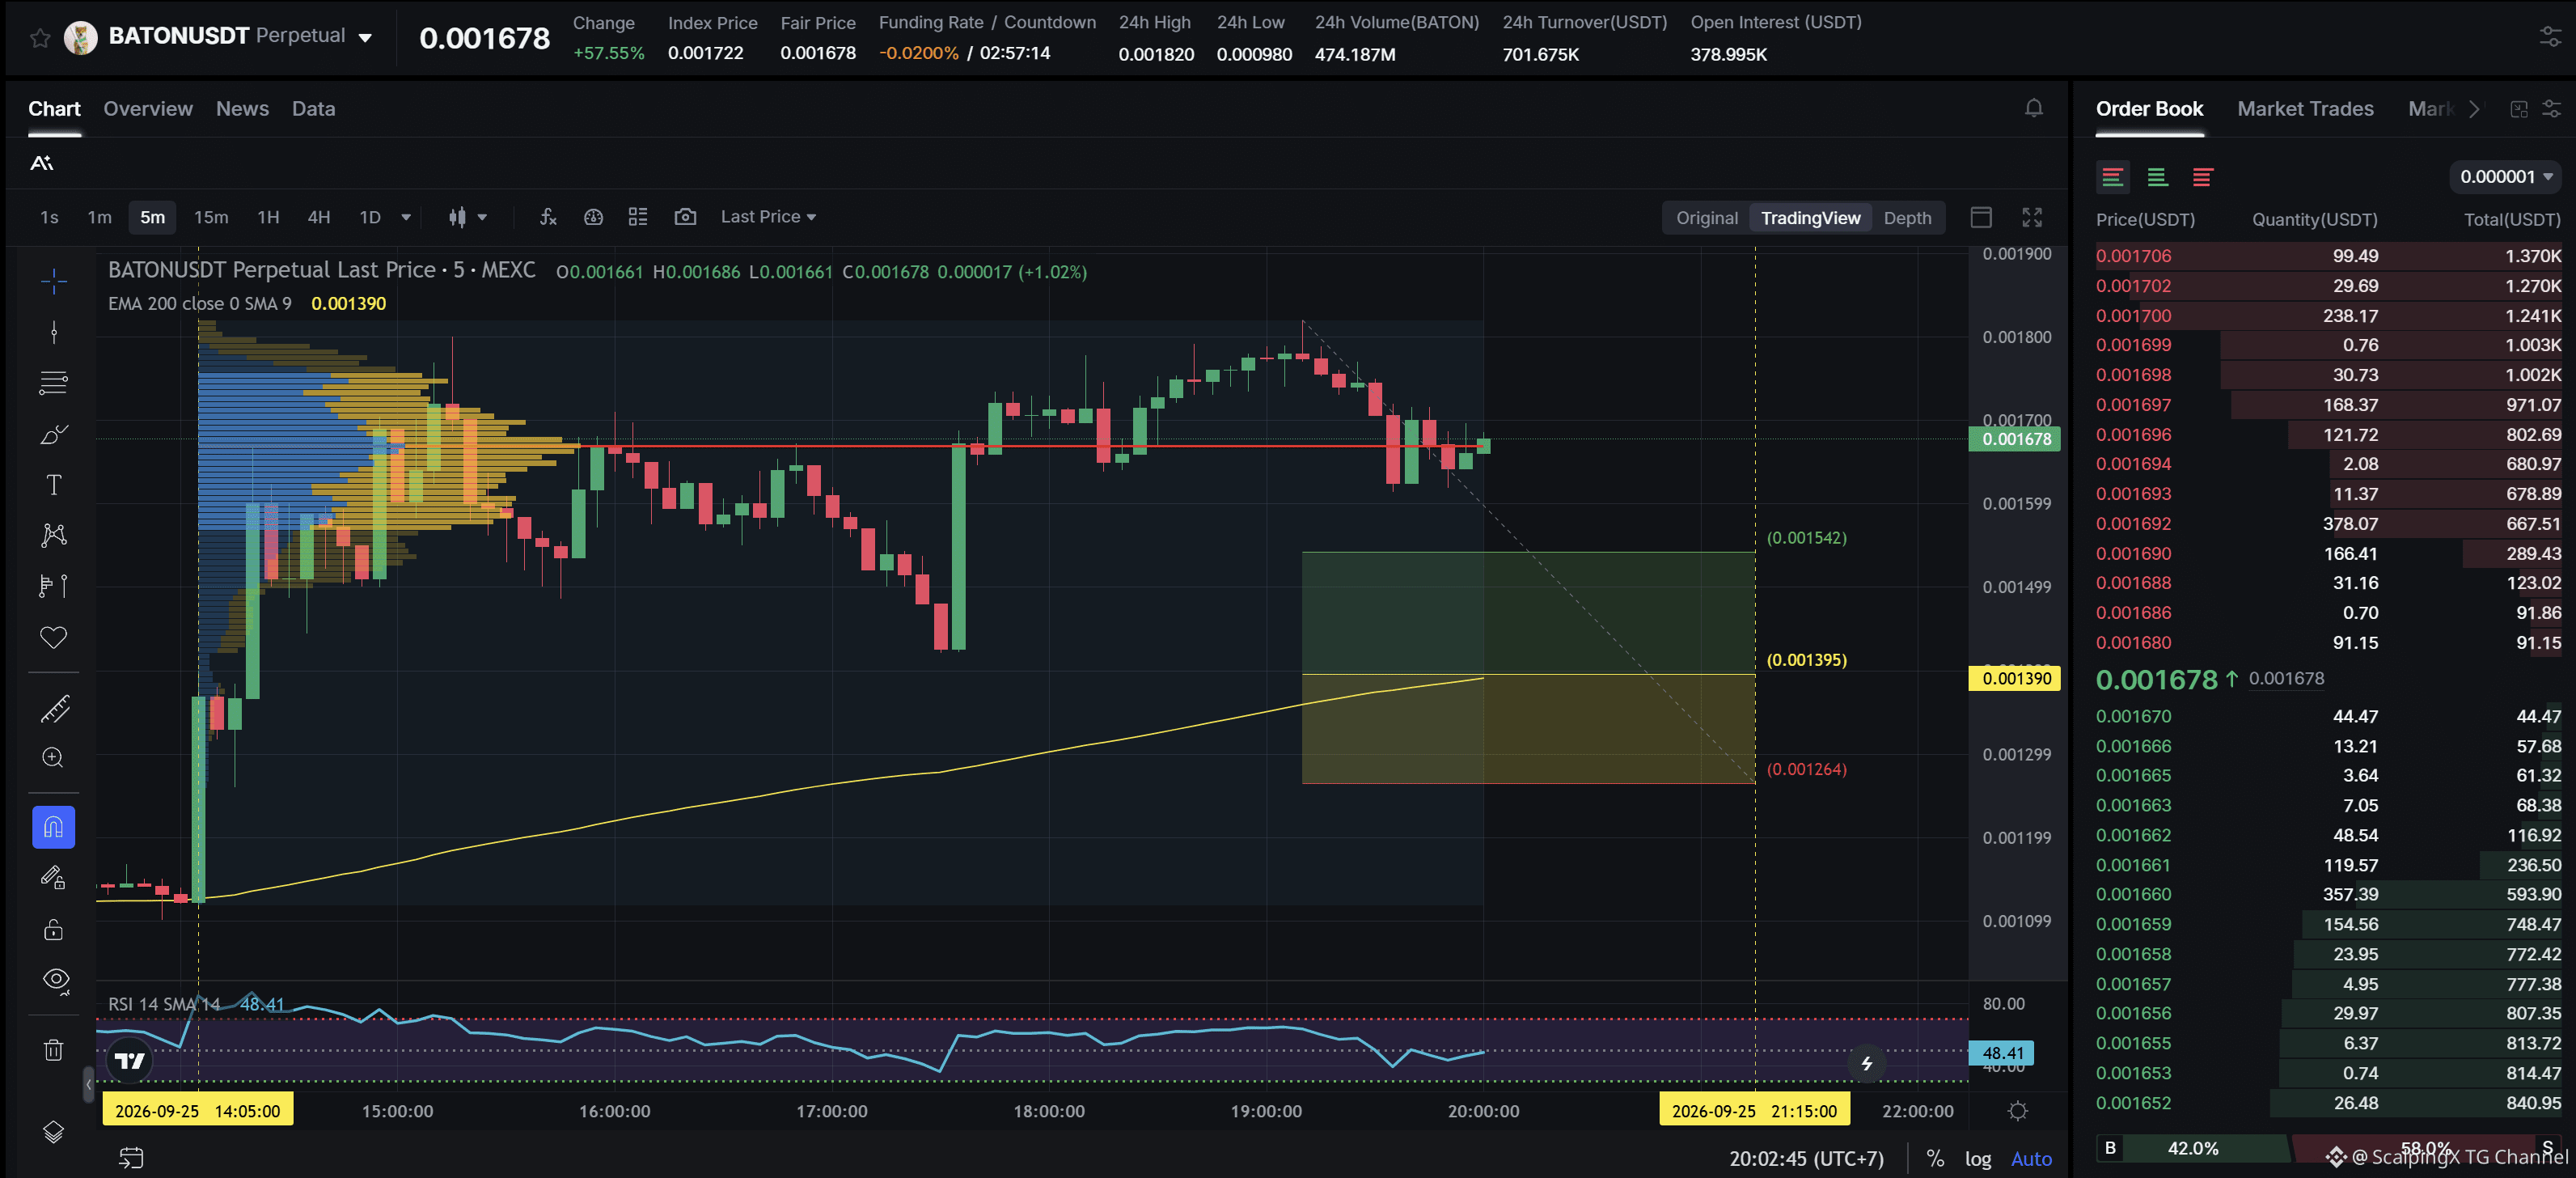
$BATON - FDV 1.7M$ SC02 M5 - pending Long order. Entry lies within LVN + not affected by any weak zone, the current support zone is approximately 9.14% wide. The uptrend has lasted 5 hours 55 minutes, with a maximum recorded price increase of 61.86%. If price loses this support zone, the trend is highly likely to reverse downward.
$BATON - FDV 1.7M$ SC02 M5 - pending Long order. Entry lies within LVN + not affected by any weak zone, the current support zone is approximately 9.14% wide. The uptrend has lasted 5 hours 55 minutes, with a maximum recorded price increase of 61.86%. If price loses this support zone, the trend is highly likely to reverse downward.
1
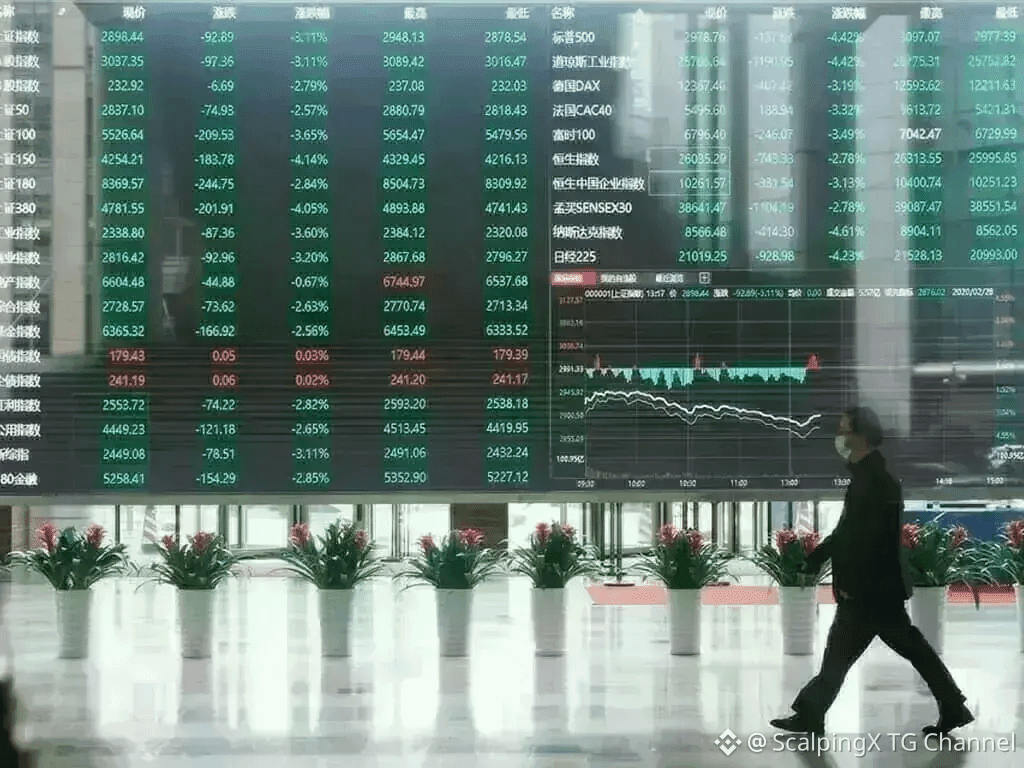
Chỉ số Hang Seng giảm phiên thứ ba liên tiếp, đóng cửa gần mức thấp nhất trong hai tháng
📉 Chỉ số Hang Seng đóng cửa vào ngày 25/9 ở mức 24.510,09, giảm 1,01%, ghi nhận phiên giảm thứ ba liên tiếp. Chỉ số Hang Seng Tech giảm 1,13% xuống 4.311,78, khi nhóm cổ phiếu công nghệ và bảo hiểm tiếp tục gây áp lực lên thị trường.
📊 HSI giảm gần 2% trong phiên xuống 24.275,56 trước khi thu hẹp một phần đà giảm vào buổi chiều. Đà hồi phục cho thấy áp lực bán ra ban đầu đã hạ nhiệt, dù chỉ số vẫn kết phiên quanh mức thấp nhất trong khoảng hai tháng.
💧 Thanh khoản thị trường chỉ vào khoảng 102,2 tỷ HKD do Stock Connect không hoạt động và các thị trường Trung Quốc đại lục được nghỉ lễ. Việc mở cửa trở lại của đại lục vào ngày 28/9 sẽ là phép thử quan trọng tiếp theo để xem liệu áp lực bán hiện tại có còn duy trì hay không.
#MarketInsights
$BNB
Chỉ số Hang Seng giảm phiên thứ ba liên tiếp, đóng cửa gần mức thấp nhất trong hai tháng
📉 Chỉ số Hang Seng đóng cửa vào ngày 25/9 ở mức 24.510,09, giảm 1,01%, ghi nhận phiên giảm thứ ba liên tiếp. Chỉ số Hang Seng Tech giảm 1,13% xuống 4.311,78, khi nhóm cổ phiếu công nghệ và bảo hiểm tiếp tục gây áp lực lên thị trường.
📊 HSI giảm gần 2% trong phiên xuống 24.275,56 trước khi thu hẹp một phần đà giảm vào buổi chiều. Đà hồi phục cho thấy áp lực bán ra ban đầu đã hạ nhiệt, dù chỉ số vẫn kết phiên quanh mức thấp nhất trong khoảng hai tháng.
💧 Thanh khoản thị trường chỉ vào khoảng 102,2 tỷ HKD do Stock Connect không hoạt động và các thị trường Trung Quốc đại lục được nghỉ lễ. Việc mở cửa trở lại của đại lục vào ngày 28/9 sẽ là phép thử quan trọng tiếp theo để xem liệu áp lực bán hiện tại có còn duy trì hay không.
#MarketInsights
$BNB
📉 Chỉ số Hang Seng đóng cửa vào ngày 25/9 ở mức 24.510,09, giảm 1,01%, ghi nhận phiên giảm thứ ba liên tiếp. Chỉ số Hang Seng Tech giảm 1,13% xuống 4.311,78, khi nhóm cổ phiếu công nghệ và bảo hiểm tiếp tục gây áp lực lên thị trường.
📊 HSI giảm gần 2% trong phiên xuống 24.275,56 trước khi thu hẹp một phần đà giảm vào buổi chiều. Đà hồi phục cho thấy áp lực bán ra ban đầu đã hạ nhiệt, dù chỉ số vẫn kết phiên quanh mức thấp nhất trong khoảng hai tháng.
💧 Thanh khoản thị trường chỉ vào khoảng 102,2 tỷ HKD do Stock Connect không hoạt động và các thị trường Trung Quốc đại lục được nghỉ lễ. Việc mở cửa trở lại của đại lục vào ngày 28/9 sẽ là phép thử quan trọng tiếp theo để xem liệu áp lực bán hiện tại có còn duy trì hay không.
#MarketInsights
$BNB
2
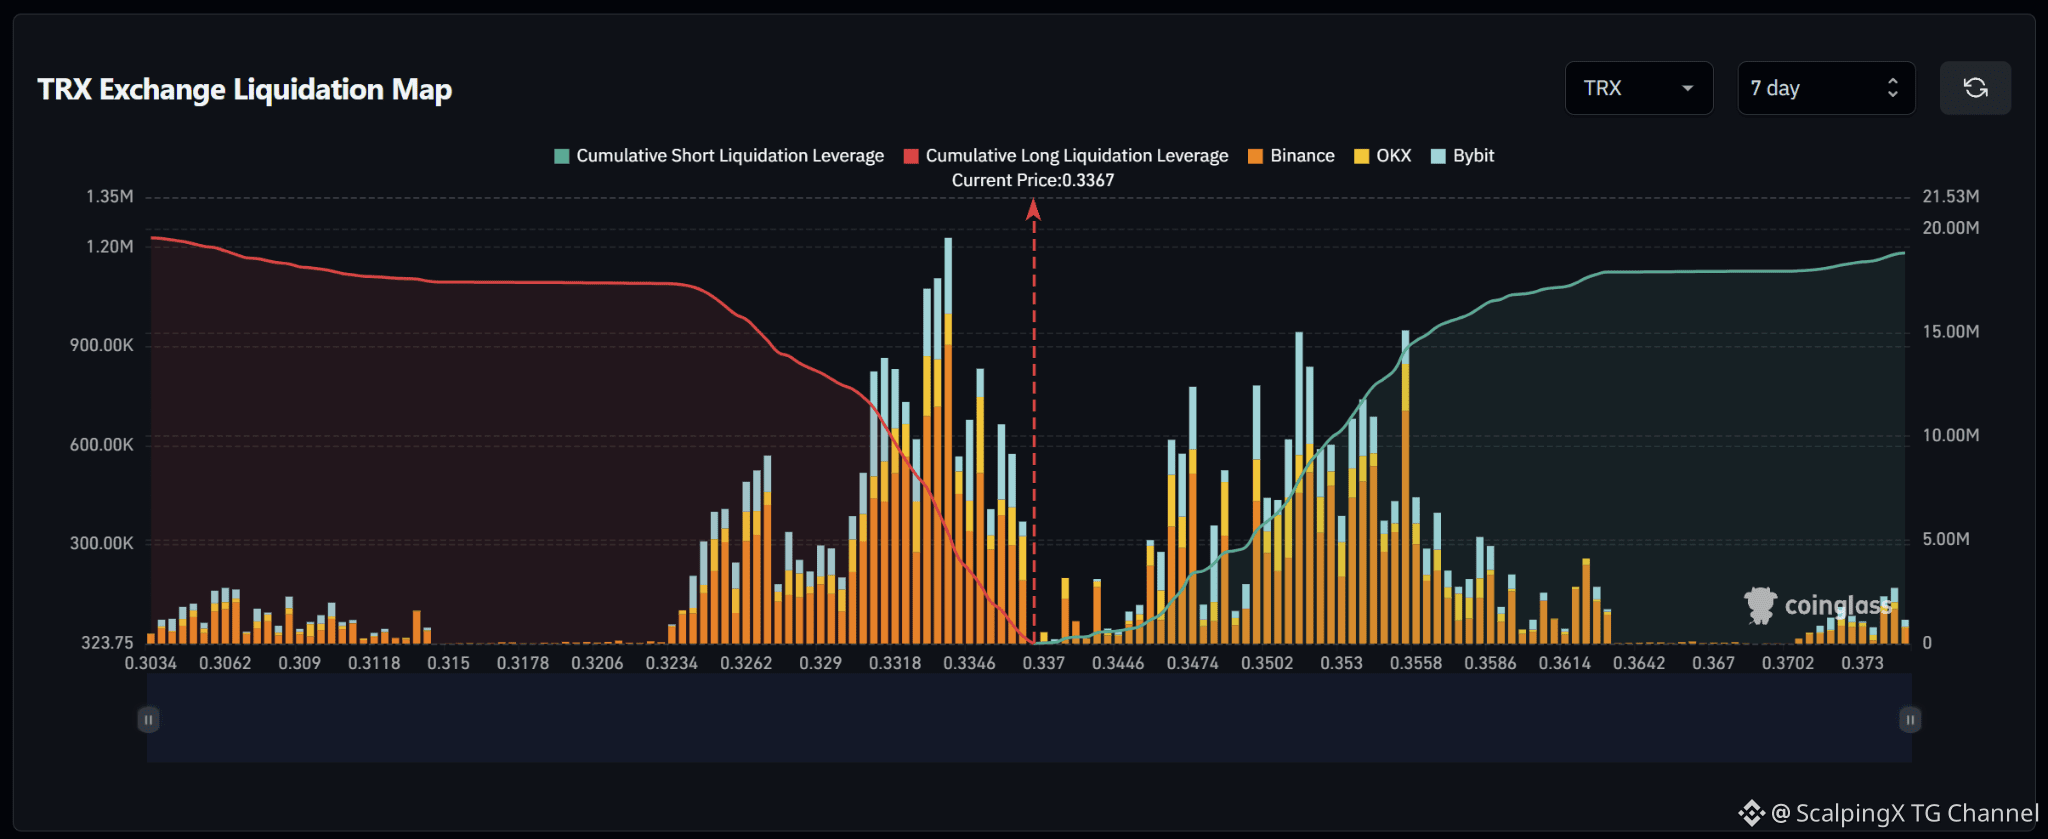
$TRX – Bản đồ thanh lý (7 ngày) – Giá hiện tại 0.3367 🔎 Bản đồ thanh lý trong 7 ngày cho thấy một cấu trúc tương đối cân bằng, với cả thanh lý long ở dưới và thanh lý short ở trên cùng nằm quanh 19–20 triệu USD. Khối lượng phơi nhiễm thanh lý long chỉ nhỉnh hơn một chút, tạo ra độ nghiêng nhẹ về hướng giảm thay vì mất cân bằng mạnh về một phía. 📉 Dưới giá thị trường, thanh khoản thanh lý long tập trung dày đặc trong khoảng 0.326–0.335. Cụm mạnh nhất nằm quanh 0.333–0.334, với một cột trên 1.2 triệu USD, trong khi 0.331–0.333 cũng có một số cột quanh 0.8–1.1 triệu USD. Nếu mất mốc 0.331, sự chú ý sẽ chuyển sang 0.329–0.326. 📈 Phía trên giá, thanh khoản thanh lý short chủ yếu tập trung trong khoảng 0.347–0.356. Các cụm đáng chú ý xuất hiện quanh 0.351–0.353 và 0.355–0.356, với nhiều cột gần 0.7–0.95 triệu USD. Thanh khoản mỏng đi rõ rệt khi vượt quá 0.359. 🧭 Cấu trúc tổng thể khá cân bằng. Mất 0.331 sẽ làm tăng xác suất quét về phía 0.329–0.326. Ngược lại, phá lên trên 0.347 sẽ khiến giá tiếp cận vùng 0.351–0.356 trước khi bước vào khu vực thanh khoản mỏng hơn.
$TRX – Bản đồ thanh lý (7 ngày) – Giá hiện tại 0.3367 🔎 Bản đồ thanh lý trong 7 ngày cho thấy một cấu trúc tương đối cân bằng, với cả thanh lý long ở dưới và thanh lý short ở trên cùng nằm quanh 19–20 triệu USD. Khối lượng phơi nhiễm thanh lý long chỉ nhỉnh hơn một chút, tạo ra độ nghiêng nhẹ về hướng giảm thay vì mất cân bằng mạnh về một phía. 📉 Dưới giá thị trường, thanh khoản thanh lý long tập trung dày đặc trong khoảng 0.326–0.335. Cụm mạnh nhất nằm quanh 0.333–0.334, với một cột trên 1.2 triệu USD, trong khi 0.331–0.333 cũng có một số cột quanh 0.8–1.1 triệu USD. Nếu mất mốc 0.331, sự chú ý sẽ chuyển sang 0.329–0.326. 📈 Phía trên giá, thanh khoản thanh lý short chủ yếu tập trung trong khoảng 0.347–0.356. Các cụm đáng chú ý xuất hiện quanh 0.351–0.353 và 0.355–0.356, với nhiều cột gần 0.7–0.95 triệu USD. Thanh khoản mỏng đi rõ rệt khi vượt quá 0.359. 🧭 Cấu trúc tổng thể khá cân bằng. Mất 0.331 sẽ làm tăng xác suất quét về phía 0.329–0.326. Ngược lại, phá lên trên 0.347 sẽ khiến giá tiếp cận vùng 0.351–0.356 trước khi bước vào khu vực thanh khoản mỏng hơn.
Xem bản dịch
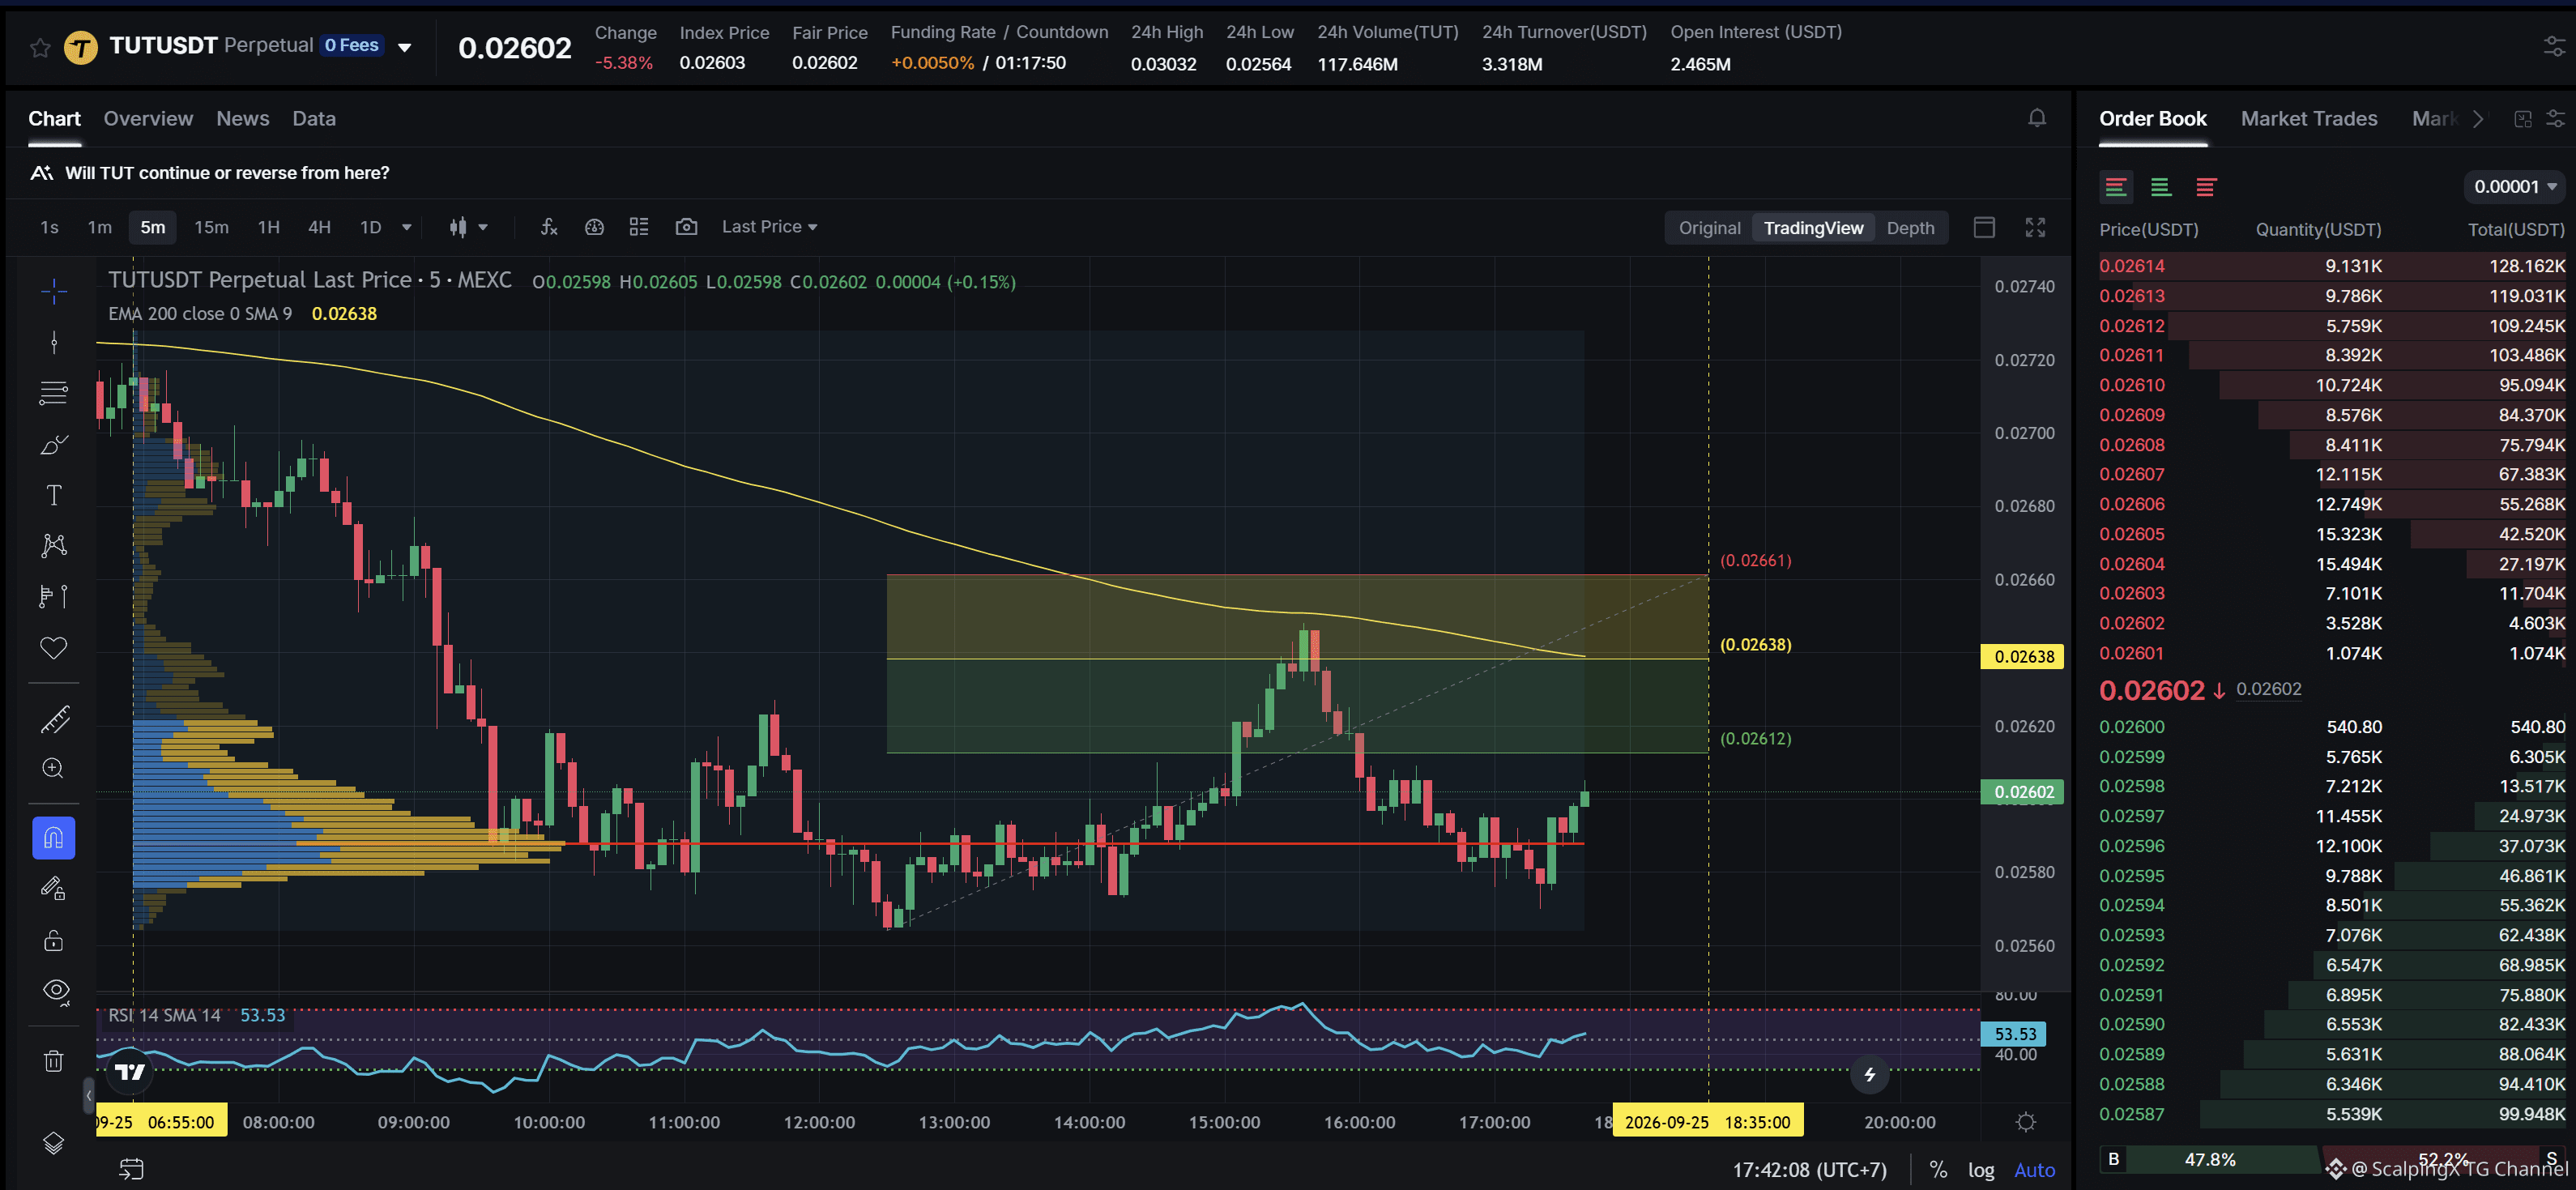
$TUT - Mcap 21.52M$ - 24h Sentiment +4.01 Bullish SC02 M5 - pending Short order. Entry lies within LVN + not affected by any weak zone, the current resistance zone is approximately 0.88% wide. The downtrend has lasted 10 hours 50 minutes, with a maximum recorded price decline of 5.93%. If price breaks above this resistance zone, the trend is highly likely to reverse upward.
$TUT - Mcap 21.52M$ - 24h Sentiment +4.01 Bullish SC02 M5 - pending Short order. Entry lies within LVN + not affected by any weak zone, the current resistance zone is approximately 0.88% wide. The downtrend has lasted 10 hours 50 minutes, with a maximum recorded price decline of 5.93%. If price breaks above this resistance zone, the trend is highly likely to reverse upward.
Xem bản dịch
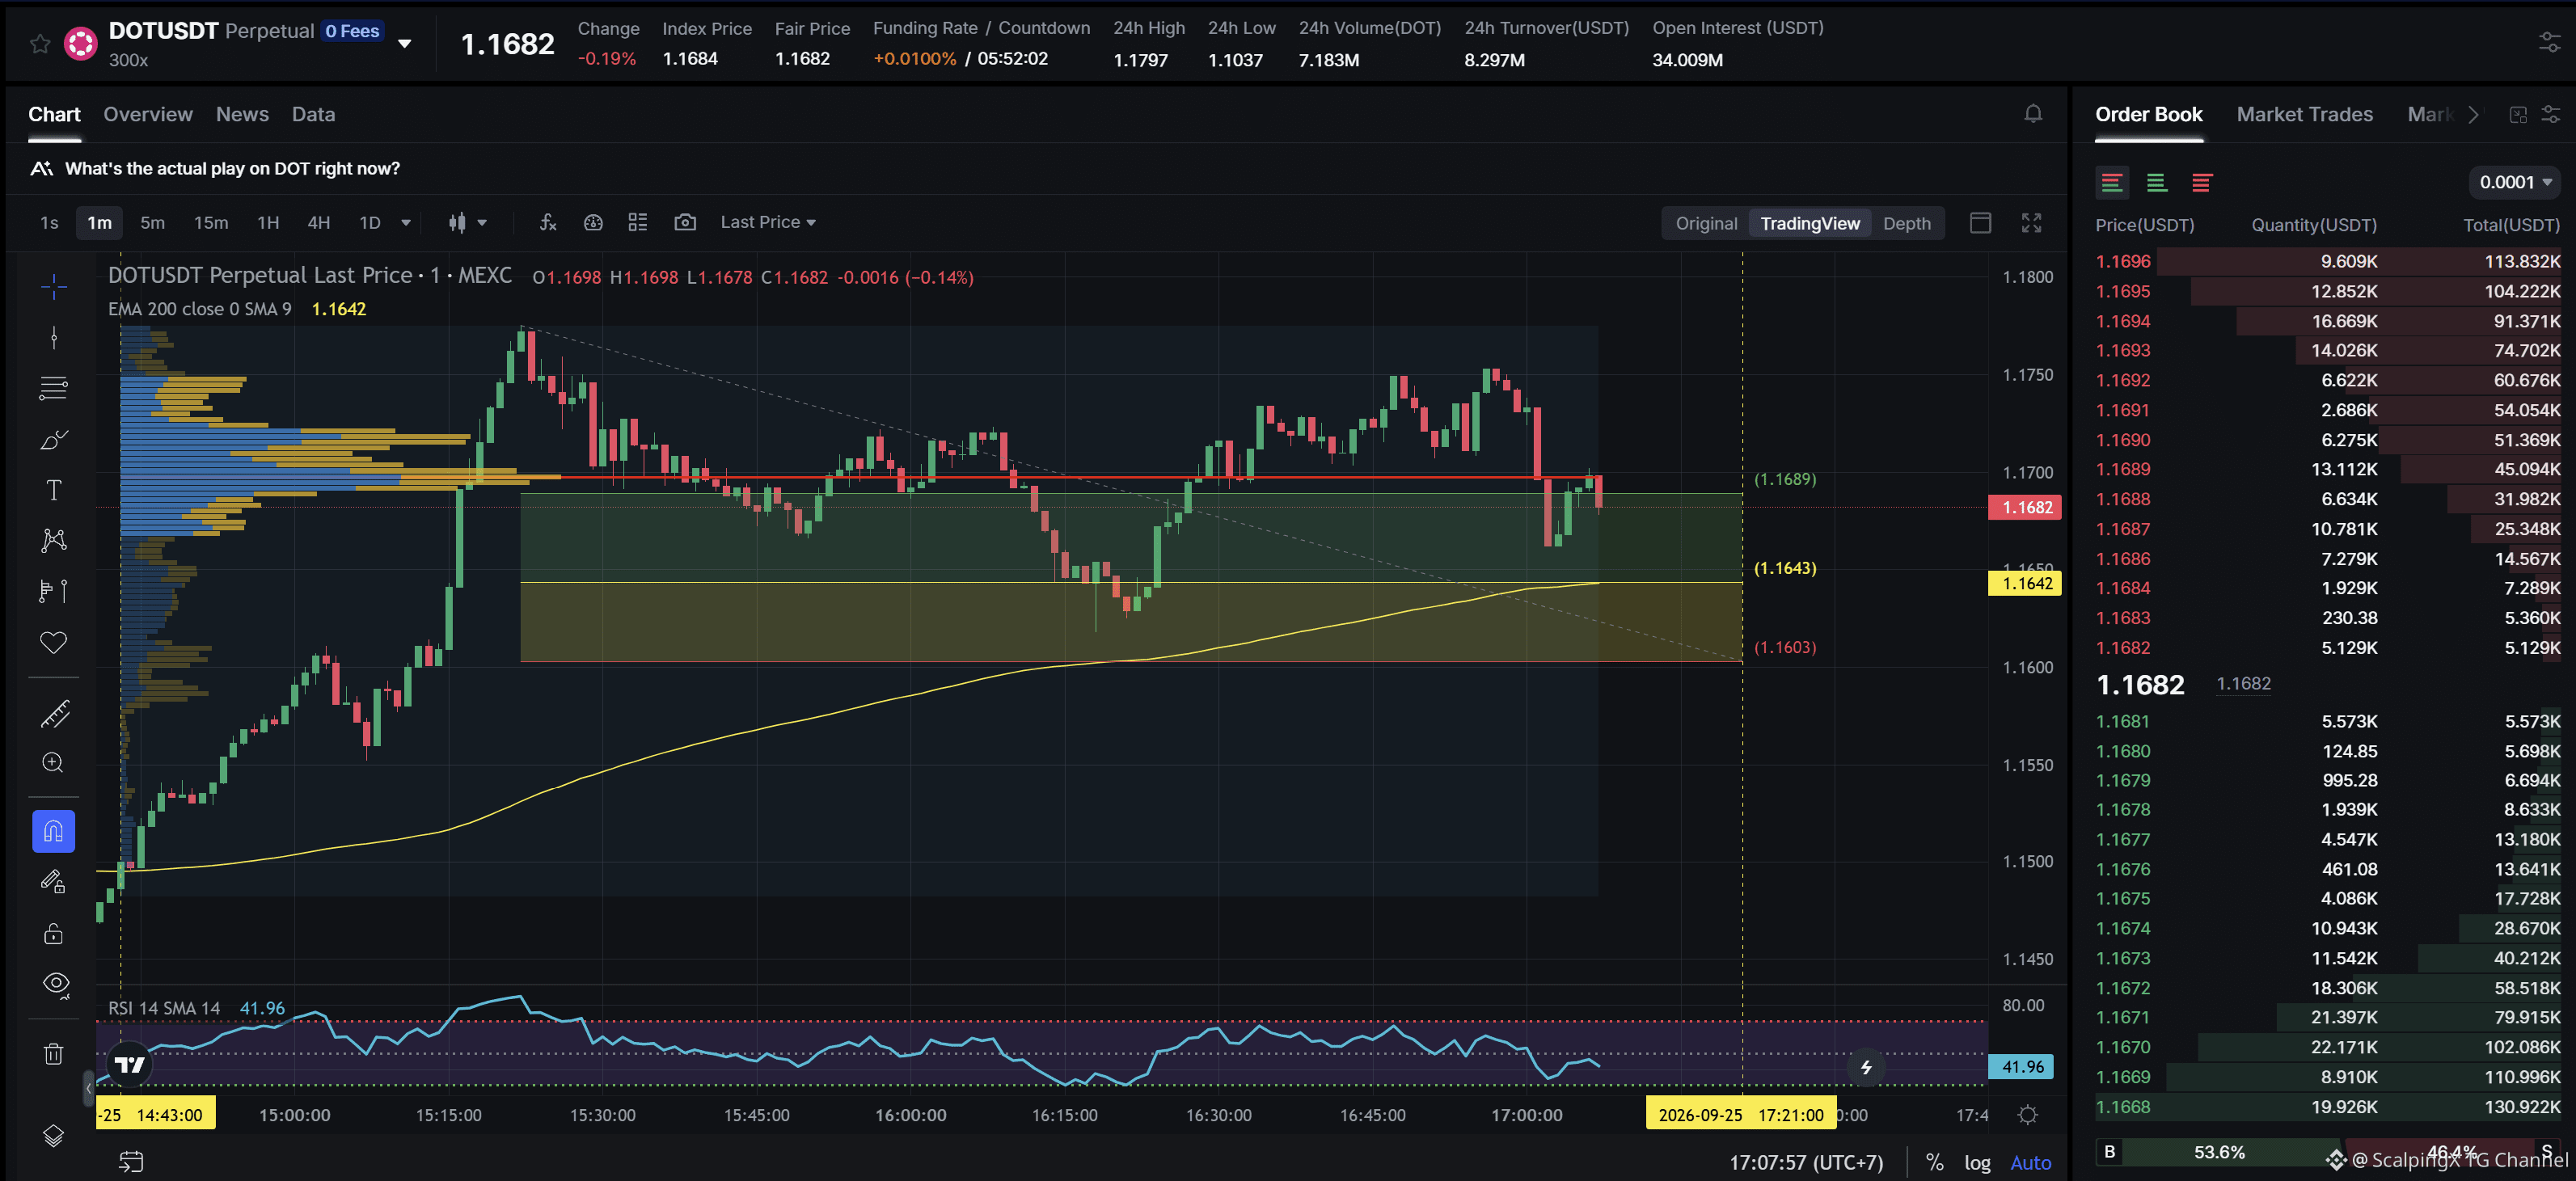
$DOT - Mcap 1.99B$ - 24h Sentiment +2.57 Bullish SC02 M1 - pending Long order. Entry lies within LVN + not affected by any weak zone, the current support zone is approximately 0.35% wide. The uptrend has lasted 2 hours 26 minutes, with a maximum recorded price increase of 2.42%. If price loses this support zone, the trend is highly likely to reverse downward.
$DOT - Mcap 1.99B$ - 24h Sentiment +2.57 Bullish SC02 M1 - pending Long order. Entry lies within LVN + not affected by any weak zone, the current support zone is approximately 0.35% wide. The uptrend has lasted 2 hours 26 minutes, with a maximum recorded price increase of 2.42%. If price loses this support zone, the trend is highly likely to reverse downward.
Lợi suất Mỹ hạ nhiệt nhẹ, nhưng thị trường châu Á vẫn chia rẽ
📉 Lợi suất Trái phiếu kho bạc Mỹ đã ổn định sau đợt bán tháo gần đây, với lợi suất kỳ hạn 10 năm quanh 5,19% và kỳ hạn 30 năm gần 5,48%. Áp lực không còn gia tăng mạnh mẽ như trong hai phiên trước đó, nhưng lợi suất dài hạn vẫn ở mức cao.
🛢 Dầu Brent giảm khoảng 0,8% xuống quanh 105,7 USD sau hai phiên tăng mạnh. Việc dầu điều chỉnh giúp giảm bớt áp lực lạm phát ngắn hạn, dù giá vẫn trên 100 USD tiếp tục củng cố câu chuyện về lãi suất “cao trong thời gian dài”.
📊 Cổ phiếu châu Á không cho thấy một làn sóng tăng rủi ro trên diện rộng. Nikkei tăng khoảng 1%, trong khi chứng khoán Hong Kong và Australia giảm, và MSCI châu Á (không gồm Nhật Bản) gần như đi ngang.
⚖️ Bối cảnh hiện tại giống với sự ổn định trở lại sau đợt bán tháo hơn là một sự chuyển dịch rõ ràng trở lại sang tâm lý ưa rủi ro.
#MarketInsight
$USDT
Lợi suất Mỹ hạ nhiệt nhẹ, nhưng thị trường châu Á vẫn chia rẽ
📉 Lợi suất Trái phiếu kho bạc Mỹ đã ổn định sau đợt bán tháo gần đây, với lợi suất kỳ hạn 10 năm quanh 5,19% và kỳ hạn 30 năm gần 5,48%. Áp lực không còn gia tăng mạnh mẽ như trong hai phiên trước đó, nhưng lợi suất dài hạn vẫn ở mức cao.
🛢 Dầu Brent giảm khoảng 0,8% xuống quanh 105,7 USD sau hai phiên tăng mạnh. Việc dầu điều chỉnh giúp giảm bớt áp lực lạm phát ngắn hạn, dù giá vẫn trên 100 USD tiếp tục củng cố câu chuyện về lãi suất “cao trong thời gian dài”.
📊 Cổ phiếu châu Á không cho thấy một làn sóng tăng rủi ro trên diện rộng. Nikkei tăng khoảng 1%, trong khi chứng khoán Hong Kong và Australia giảm, và MSCI châu Á (không gồm Nhật Bản) gần như đi ngang.
⚖️ Bối cảnh hiện tại giống với sự ổn định trở lại sau đợt bán tháo hơn là một sự chuyển dịch rõ ràng trở lại sang tâm lý ưa rủi ro.
#MarketInsight
$USDT
📉 Lợi suất Trái phiếu kho bạc Mỹ đã ổn định sau đợt bán tháo gần đây, với lợi suất kỳ hạn 10 năm quanh 5,19% và kỳ hạn 30 năm gần 5,48%. Áp lực không còn gia tăng mạnh mẽ như trong hai phiên trước đó, nhưng lợi suất dài hạn vẫn ở mức cao.
🛢 Dầu Brent giảm khoảng 0,8% xuống quanh 105,7 USD sau hai phiên tăng mạnh. Việc dầu điều chỉnh giúp giảm bớt áp lực lạm phát ngắn hạn, dù giá vẫn trên 100 USD tiếp tục củng cố câu chuyện về lãi suất “cao trong thời gian dài”.
📊 Cổ phiếu châu Á không cho thấy một làn sóng tăng rủi ro trên diện rộng. Nikkei tăng khoảng 1%, trong khi chứng khoán Hong Kong và Australia giảm, và MSCI châu Á (không gồm Nhật Bản) gần như đi ngang.
⚖️ Bối cảnh hiện tại giống với sự ổn định trở lại sau đợt bán tháo hơn là một sự chuyển dịch rõ ràng trở lại sang tâm lý ưa rủi ro.
#MarketInsight
$USDT

1
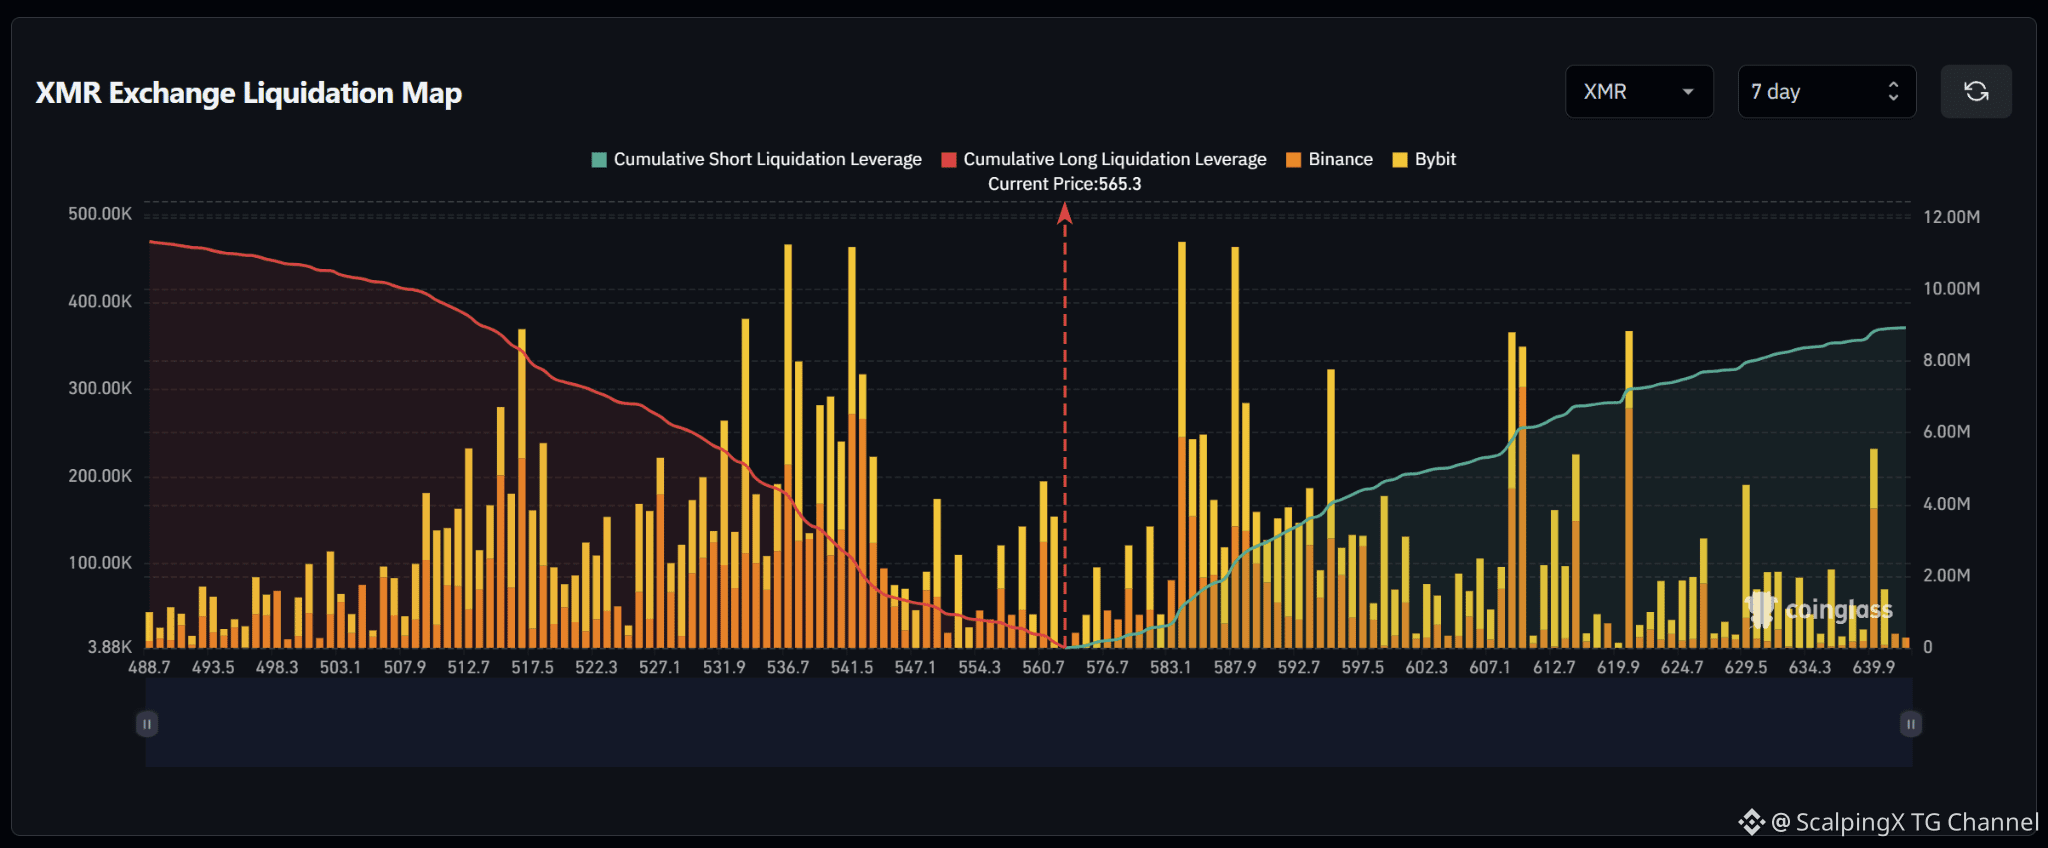
$XMR – Bản đồ thanh lý (7 ngày) – Giá hiện tại 565.3 🔎 Bản đồ thanh lý 7 ngày cho thấy khoảng 11–11,5 triệu USD trong các lệnh thanh lý LONG nằm dưới giá hiện tại, cao hơn khoảng 8,5–9 triệu USD trong các lệnh thanh lý SHORT nằm phía trên. Do đó, cấu trúc thanh khoản nghiêng nhẹ về mặt giảm, với tổng thanh khoản tích lũy bên dưới lớn hơn khoảng 1,3 lần so với bên trên. 📉 Bên dưới mức giá, thanh khoản thanh lý LONG chủ yếu tập trung trong khoảng 512–542. Các cụm mạnh nhất nằm quanh 536–537 và 541–542 với các cột gần 0,46 triệu USD, trong khi 516–518 và 531–533 cũng giữ một số “túi” thanh khoản tương đối lớn. Mất 560 sẽ chuyển sự chú ý sang 547–542 rồi đến 537–532. 📈 Bên trên mức giá, thanh khoản thanh lý SHORT tập trung mạnh trong khoảng 582–589. Hai cụm mạnh nhất nằm quanh 583–584 và 587–588 với các cột khoảng 0,46–0,47 triệu USD. Xa hơn nữa, 608–610 và 619–620 cũng chứa các túi đáng chú ý quanh 0,35–0,37 triệu USD. 🧭 Thiết lập tổng thể nghiêng nhẹ về phía giảm vì mức độ phơi nhiễm thanh lý LONG nằm bên dưới vẫn lớn hơn. Mất 560 sẽ làm tăng xác suất quét về 547–542, sau đó là 537–532. Ngược lại, vượt lên trên 576 sẽ khiến 583–588 lộ diện trước khi sự chú ý chuyển sang 608–620.
$XMR – Bản đồ thanh lý (7 ngày) – Giá hiện tại 565.3 🔎 Bản đồ thanh lý 7 ngày cho thấy khoảng 11–11,5 triệu USD trong các lệnh thanh lý LONG nằm dưới giá hiện tại, cao hơn khoảng 8,5–9 triệu USD trong các lệnh thanh lý SHORT nằm phía trên. Do đó, cấu trúc thanh khoản nghiêng nhẹ về mặt giảm, với tổng thanh khoản tích lũy bên dưới lớn hơn khoảng 1,3 lần so với bên trên. 📉 Bên dưới mức giá, thanh khoản thanh lý LONG chủ yếu tập trung trong khoảng 512–542. Các cụm mạnh nhất nằm quanh 536–537 và 541–542 với các cột gần 0,46 triệu USD, trong khi 516–518 và 531–533 cũng giữ một số “túi” thanh khoản tương đối lớn. Mất 560 sẽ chuyển sự chú ý sang 547–542 rồi đến 537–532. 📈 Bên trên mức giá, thanh khoản thanh lý SHORT tập trung mạnh trong khoảng 582–589. Hai cụm mạnh nhất nằm quanh 583–584 và 587–588 với các cột khoảng 0,46–0,47 triệu USD. Xa hơn nữa, 608–610 và 619–620 cũng chứa các túi đáng chú ý quanh 0,35–0,37 triệu USD. 🧭 Thiết lập tổng thể nghiêng nhẹ về phía giảm vì mức độ phơi nhiễm thanh lý LONG nằm bên dưới vẫn lớn hơn. Mất 560 sẽ làm tăng xác suất quét về 547–542, sau đó là 537–532. Ngược lại, vượt lên trên 576 sẽ khiến 583–588 lộ diện trước khi sự chú ý chuyển sang 608–620.
Đăng nhập để khám phá thêm nội dung
Tham gia cùng người dùng tiền mã hóa toàn cầu trên Binance Square
⚡️ Nhận thông tin mới nhất và hữu ích về tiền mã hóa.
💬 Được tin cậy bởi sàn giao dịch tiền mã hóa lớn nhất thế giới.
👍 Khám phá những thông tin chuyên sâu thực tế từ những nhà sáng tạo đã xác minh.
Email / Số điện thoại