
asiftahsin
2.3k Bài đăng

asiftahsin
Báo cáo
Chặn người dùng
Share Crypto Related Market Analysis, Share Crypto Related knowledge for my follower(brother and Sister)
32 Đang theo dõi
335 Người theo dõi
1.3K+ Đã thích
Bài đăng
Tất cả
Trích dẫn
·
--
Bài viết
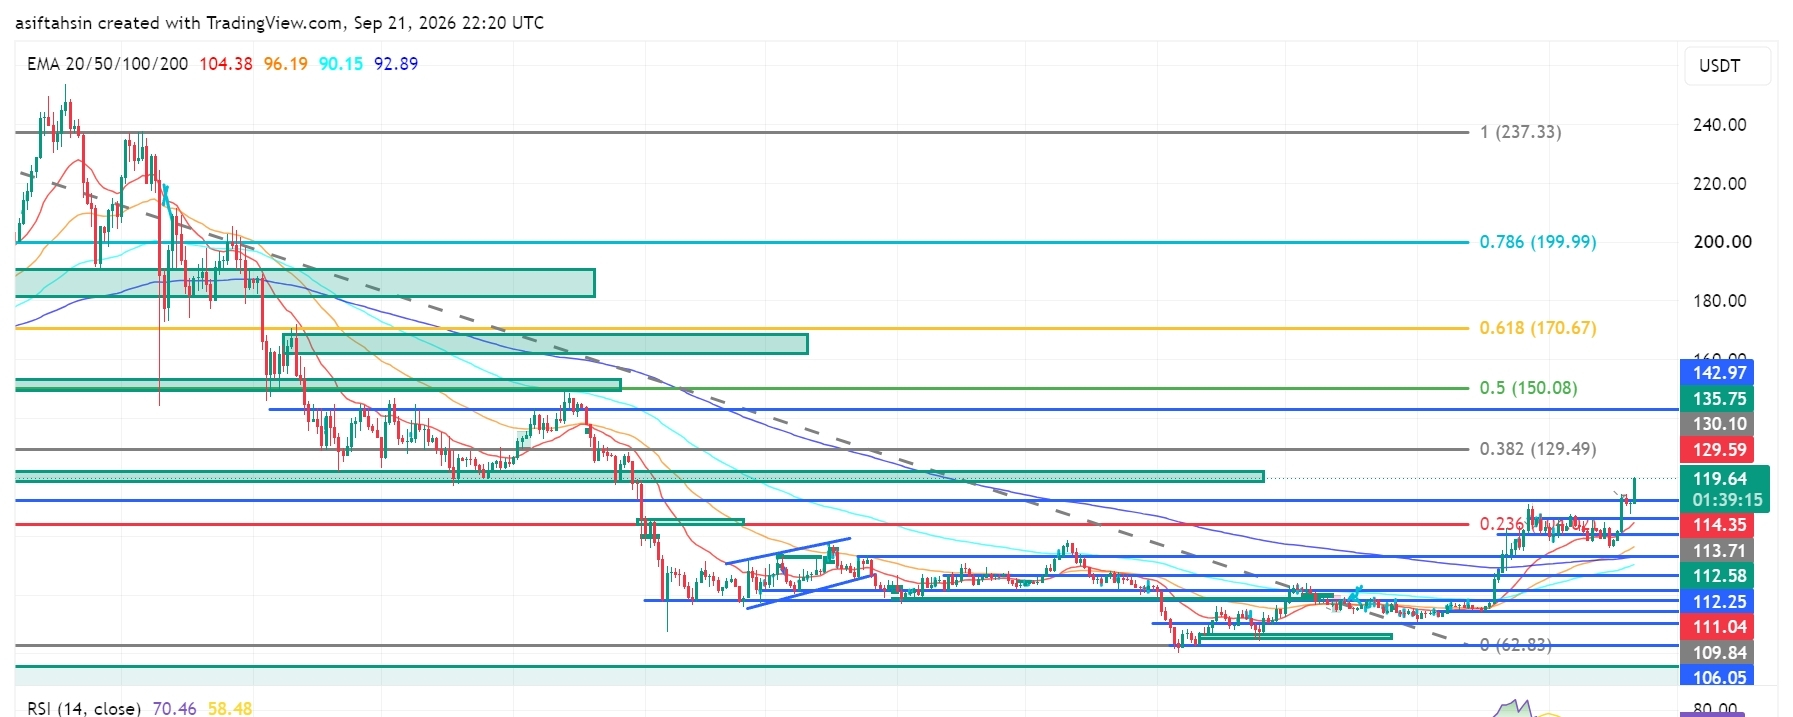
Triển vọng Kỹ thuật SOL: Solana Tiến Gần $120 khi Cấu Trúc Đột Phá Tăng CườngHiện tại, SOL đang giao dịch quanh $119.61, giữ vững tốt phía trên vùng $112–$114 sau một đợt phục hồi mạnh từ vùng hỗ trợ $104–$110.
Cấu trúc tổng thể đã cải thiện đáng kể, khi SOL quay lại vùng $110–$114 và hiện đang thử nghiệm khu vực kháng cự $119–$120. Nếu có một đột phá duy trì vững chắc vượt qua vùng này, các mức Fibonacci cao hơn sẽ lại được đưa vào tầm ngắm.
📈 Cấu trúc EMA
20 EMA: $104.38
50 EMA: $96.19
100 EMA: $90.15
200 EMA: $92.89
SOL đang giao dịch cao hơn đáng kể so với cả bốn đường EMA chính.
Triển vọng Kỹ thuật SOL: Solana Tiến Gần $120 khi Cấu Trúc Đột Phá Tăng Cường
Hiện tại, SOL đang giao dịch quanh $119.61, giữ vững tốt phía trên vùng $112–$114 sau một đợt phục hồi mạnh từ vùng hỗ trợ $104–$110.
Cấu trúc tổng thể đã cải thiện đáng kể, khi SOL quay lại vùng $110–$114 và hiện đang thử nghiệm khu vực kháng cự $119–$120. Nếu có một đột phá duy trì vững chắc vượt qua vùng này, các mức Fibonacci cao hơn sẽ lại được đưa vào tầm ngắm.
📈 Cấu trúc EMA
20 EMA: $104.38
50 EMA: $96.19
100 EMA: $90.15
200 EMA: $92.89
SOL đang giao dịch cao hơn đáng kể so với cả bốn đường EMA chính.
Cấu trúc tổng thể đã cải thiện đáng kể, khi SOL quay lại vùng $110–$114 và hiện đang thử nghiệm khu vực kháng cự $119–$120. Nếu có một đột phá duy trì vững chắc vượt qua vùng này, các mức Fibonacci cao hơn sẽ lại được đưa vào tầm ngắm.
📈 Cấu trúc EMA
20 EMA: $104.38
50 EMA: $96.19
100 EMA: $90.15
200 EMA: $92.89
SOL đang giao dịch cao hơn đáng kể so với cả bốn đường EMA chính.
35
·
--
Bài viết
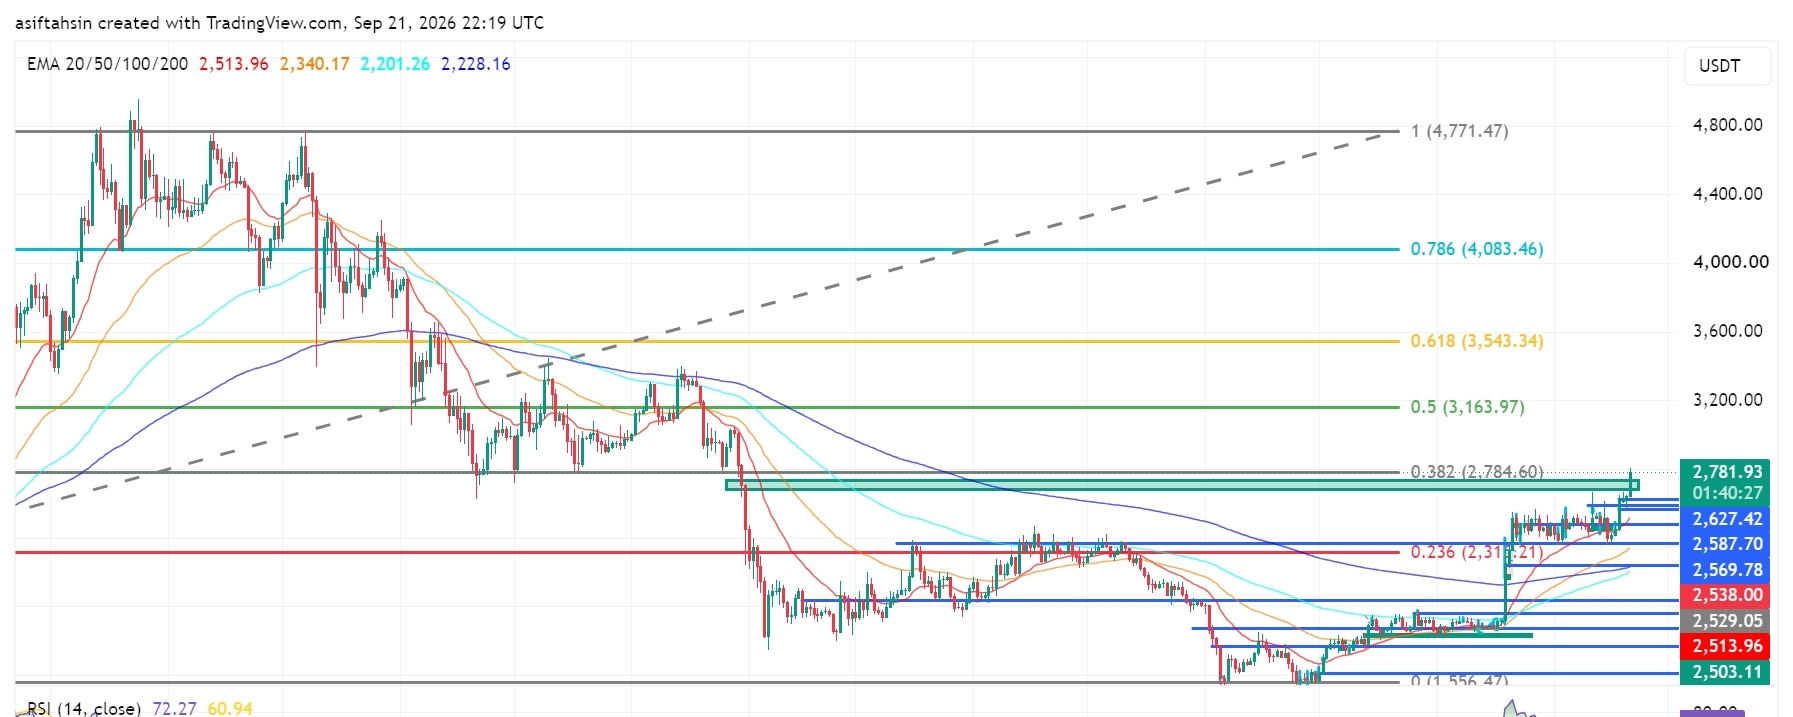
Triển vọng kỹ thuật ETH: Ethereum giành lại mốc $2.78K khi cấu trúc đột phá được củng cốHiện tại ETH đang giao dịch quanh $2,781.93, đẩy tiến vào kháng cự Fibonacci chính tại $2,784.60 sau một đợt phục hồi mạnh từ vùng $2,475–$2,500.
Cấu trúc tổng thể đã được cải thiện đáng kể, khi ETH giành lại vùng $2,500–$2,600 và phá vỡ khỏi phạm vi tích lũy trước đó. Nếu duy trì một đợt đột phá bền vững trên $2,784.60, các mức Fibonacci cao hơn sẽ được đưa vào tầm ngắm.
📈 Cấu trúc EMA
EMA 20: $2,513.96
EMA 50: $2,340.17
EMA 100: $2,201.26
EMA 200: $2,228.16
ETH đang giao dịch tốt hơn hẳn so với cả bốn đường EMA quan trọng.
Triển vọng kỹ thuật ETH: Ethereum giành lại mốc $2.78K khi cấu trúc đột phá được củng cố
Hiện tại ETH đang giao dịch quanh $2,781.93, đẩy tiến vào kháng cự Fibonacci chính tại $2,784.60 sau một đợt phục hồi mạnh từ vùng $2,475–$2,500.
Cấu trúc tổng thể đã được cải thiện đáng kể, khi ETH giành lại vùng $2,500–$2,600 và phá vỡ khỏi phạm vi tích lũy trước đó. Nếu duy trì một đợt đột phá bền vững trên $2,784.60, các mức Fibonacci cao hơn sẽ được đưa vào tầm ngắm.
📈 Cấu trúc EMA
EMA 20: $2,513.96
EMA 50: $2,340.17
EMA 100: $2,201.26
EMA 200: $2,228.16
ETH đang giao dịch tốt hơn hẳn so với cả bốn đường EMA quan trọng.
Cấu trúc tổng thể đã được cải thiện đáng kể, khi ETH giành lại vùng $2,500–$2,600 và phá vỡ khỏi phạm vi tích lũy trước đó. Nếu duy trì một đợt đột phá bền vững trên $2,784.60, các mức Fibonacci cao hơn sẽ được đưa vào tầm ngắm.
📈 Cấu trúc EMA
EMA 20: $2,513.96
EMA 50: $2,340.17
EMA 100: $2,201.26
EMA 200: $2,228.16
ETH đang giao dịch tốt hơn hẳn so với cả bốn đường EMA quan trọng.
58
·
--
Bài viết
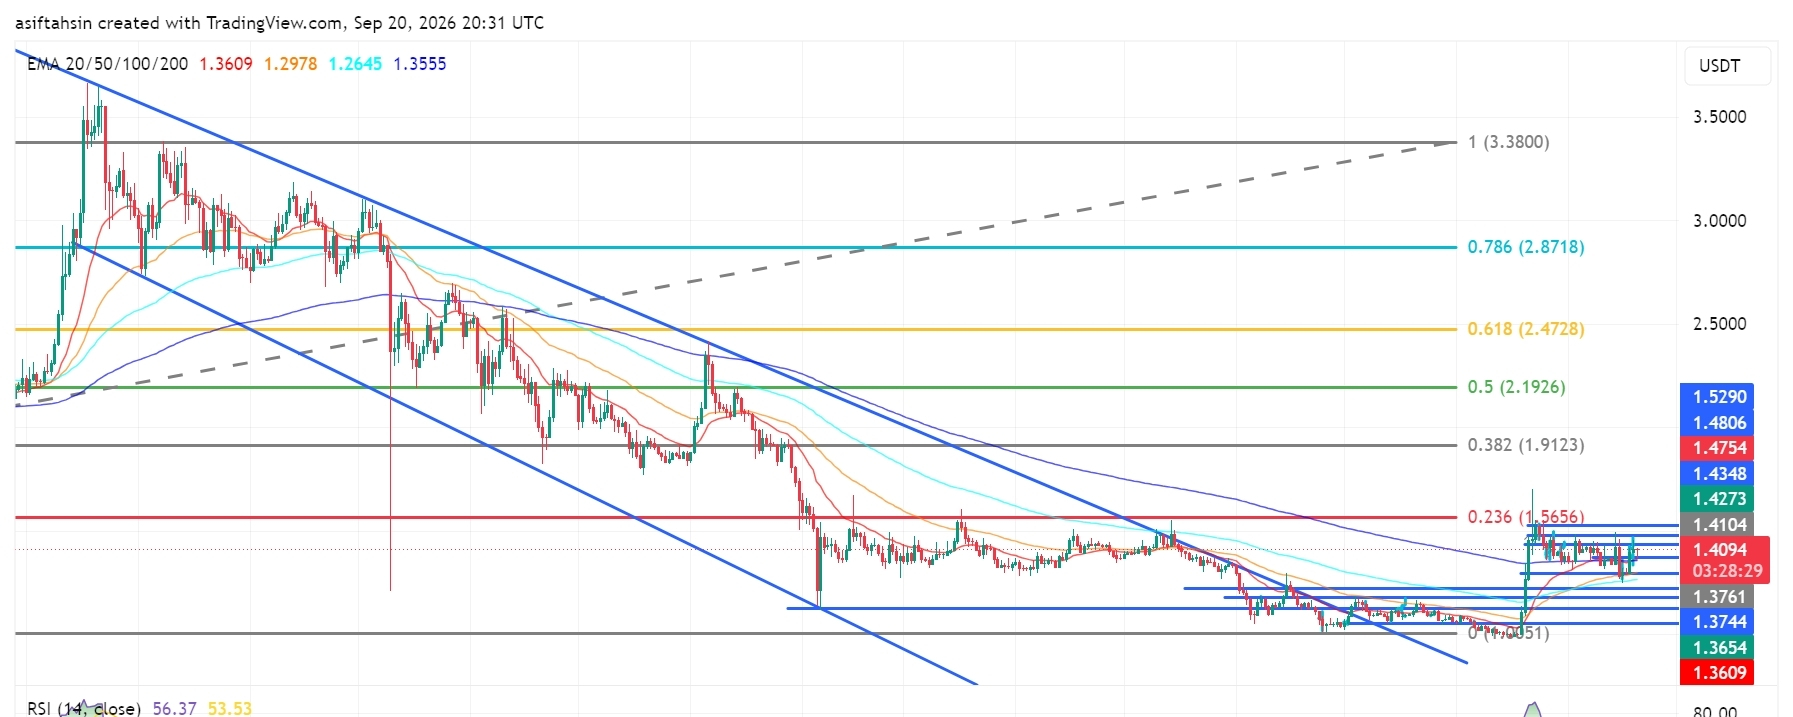
Triển vọng kỹ thuật XRP: XRP giữ vững trên $1.40 khi cấu trúc phục hồi được củng cốTriển vọng kỹ thuật XRP: XRP giữ vững trên $1.40 khi cấu trúc phục hồi được củng cố
Hiện tại XRP đang giao dịch quanh $1.41, duy trì phía trên vùng $1.37–$1.40 sau đợt phục hồi gần đây từ vùng hỗ trợ $1.25–$1.30.
Cấu trúc tổng thể đã được cải thiện, với giá quay lại chiếm lại vùng $1.40 và hướng tới lại vùng kháng cự quan trọng $1.41–$1.48. Nếu giá duy trì một đà đi xuyên qua vùng này, các mốc Fibonacci cao hơn sẽ lại được đưa vào tầm chú ý.
Các bình luận gần đây của thị trường cũng xác định vùng $1.40 là một mức kháng cự/chiếm lại quan trọng, dù vậy động lượng ngắn hạn vẫn nhạy cảm quanh khu vực này.
Triển vọng kỹ thuật XRP: XRP giữ vững trên $1.40 khi cấu trúc phục hồi được củng cố
Triển vọng kỹ thuật XRP: XRP giữ vững trên $1.40 khi cấu trúc phục hồi được củng cố
Hiện tại XRP đang giao dịch quanh $1.41, duy trì phía trên vùng $1.37–$1.40 sau đợt phục hồi gần đây từ vùng hỗ trợ $1.25–$1.30.
Cấu trúc tổng thể đã được cải thiện, với giá quay lại chiếm lại vùng $1.40 và hướng tới lại vùng kháng cự quan trọng $1.41–$1.48. Nếu giá duy trì một đà đi xuyên qua vùng này, các mốc Fibonacci cao hơn sẽ lại được đưa vào tầm chú ý.
Các bình luận gần đây của thị trường cũng xác định vùng $1.40 là một mức kháng cự/chiếm lại quan trọng, dù vậy động lượng ngắn hạn vẫn nhạy cảm quanh khu vực này.
Hiện tại XRP đang giao dịch quanh $1.41, duy trì phía trên vùng $1.37–$1.40 sau đợt phục hồi gần đây từ vùng hỗ trợ $1.25–$1.30.
Cấu trúc tổng thể đã được cải thiện, với giá quay lại chiếm lại vùng $1.40 và hướng tới lại vùng kháng cự quan trọng $1.41–$1.48. Nếu giá duy trì một đà đi xuyên qua vùng này, các mốc Fibonacci cao hơn sẽ lại được đưa vào tầm chú ý.
Các bình luận gần đây của thị trường cũng xác định vùng $1.40 là một mức kháng cự/chiếm lại quan trọng, dù vậy động lượng ngắn hạn vẫn nhạy cảm quanh khu vực này.
2
1.2k
·
--
Bài viết
Xem bản dịch
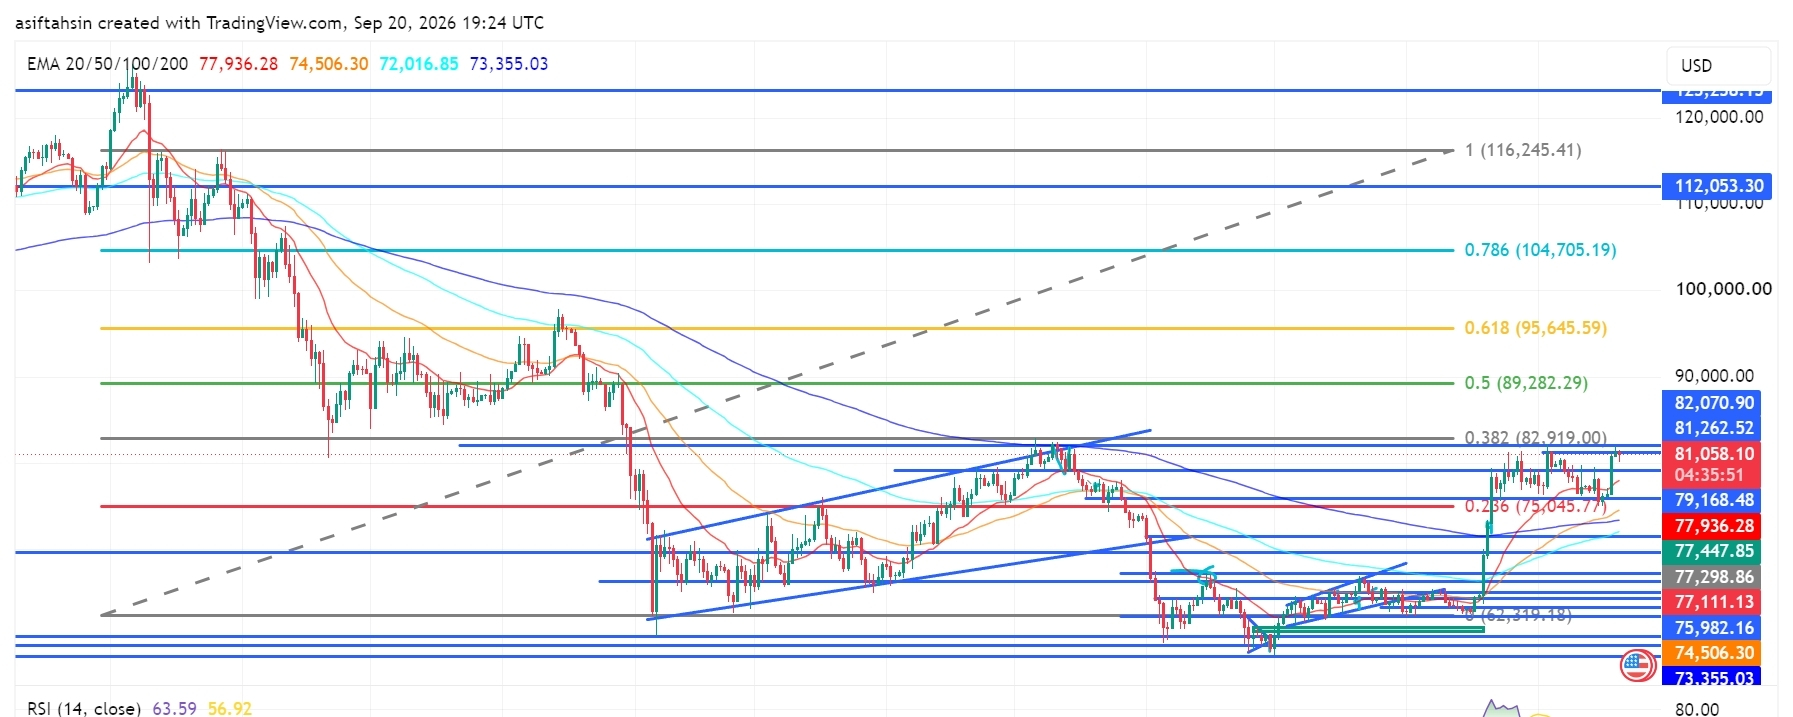
BTC Technical Outlook: Bitcoin Reclaims $81K as Recovery Structure StrengthensBTC is currently trading around $81,058, holding above the $79K–$80K region after the recent recovery from the $72K–$75K support area.
The broader structure has improved, with price reclaiming the $80K area and moving back toward the major $81.26K–$82.92K resistance zone. A sustained move through this area would put the higher Fibonacci levels back into focus.
📈 EMA Structure
20 EMA: $77,936.12
50 EMA: $74,506.24
100 EMA: $72,016.82
200 EMA: $73,355.02
BTC is currently trading well above the 20 EMA at $77,936.
The recovery above the 50 EMA at $74,506, 100 EMA at $72,016, and 200 EMA at $73,355 keeps the broader recovery structure constructive.
The 20 EMA remains above the longer-term EMA levels, showing improving short-term structure.
The $77.9K area remains an important dynamic support during any short-term pullback.
📐 Fibonacci Levels
Key Fibonacci levels:
0.236: $75,045.77
0.382: $82,919.00
0.5: $89,282.29
0.618: $95,645.59
0.786: $104,705.19
1.0: $116,245.41
BTC is currently trading above the 0.236 Fibonacci level at $75,045.77.
The next major Fibonacci reference is $82,919 — 0.382 Fib.
A sustained move above the $81K–$82.9K resistance area could bring $89,282 into focus, followed by $95,645.
🟢 Bullish Scenario
BTC has recovered strongly from the lower support structure and is now consolidating around $80K–$81K.
Immediate resistance:
$81,262.52
$82,070.90
$82,919.00 — 0.382 Fibonacci
$89,282.29 — 0.5 Fibonacci
$95,645.59 — 0.618 Fibonacci
A clean breakout and sustained close above $82K–$82.92K would provide stronger confirmation of continued recovery.
🎯 Target 1: $82,070.90
🎯 Target 2: $82,919.00 — 0.382 Fibonacci
🎯 Target 3: $89,282.29 — 0.5 Fibonacci
🎯 Target 4: $95,645.59 — 0.618 Fibonacci
🎯 Target 5: $104,705.19 — 0.786 Fibonacci
🎯 Target 6: $112,053.30
🎯 Target 7: $116,245.41 — 1.0 Fibonacci
A confirmed move through the $82.92K zone could strengthen the medium-term recovery structure and bring the $89K–$95K region into focus.
🔴 Pullback Scenario
After the recent expansion from the $75K region toward $81K, a retest of the breakout area would be normal.
Key supports:
$79,168.48
$77,936.12 — 20 EMA
$77,447.85
$77,298.86
$77,111.13
$75,982.16
$75,045.77 — 0.236 Fibonacci
$74,506.24 — 50 EMA
$73,355.02 — 200 EMA
$72,016.82 — 100 EMA
The $77K–$79K zone is particularly important.
If BTC continues to hold this area during a pullback, the current recovery structure remains active.
A sustained loss of $75,045 would weaken the current structure and bring the lower EMA support region back into focus.
🧠 Market Structure & Liquidity
BTC has formed a recovery structure after sweeping liquidity around the $72K–$75K region.
The recent move produced a strong recovery through $75K, followed by a breakout toward $80K–$81K.
BTC is now moving through an important:
Liquidity Sweep → Accumulation → Higher Lows → Breakout → Expansion → Retest → Consolidation → Continuation
structure.
The major upside liquidity and resistance are concentrated around the $81.26K–$82.92K region.
A decisive move through this area would place $89,282 as the next major Fibonacci reference.
📊 RSI Momentum
RSI (14): 63.59
RSI MA: 56.92
RSI has moved above the neutral 50 level and remains firmly in positive territory after the recent expansion.
The current reading around 63.59 shows stronger short-term momentum while remaining below the traditional 70 overbought threshold.
A sustained RSI above 60 would keep momentum supportive, while a move back below 50 would indicate increasing short-term weakness.
🎯 Key Levels
🔴 Major Resistance:
$81,262.52 → $82,070.90 → $82,919.00 → $89,282.29 → $95,645.59
🟢 Major Support:
$79,168.48 → $77,936.12 → $77,447.85 → $77,298.86 → $77,111.13 → $75,982.16 → $75,045.77
📉 Dynamic EMA Support:
$77,936.12 — 20 EMA | $74,506.24 — 50 EMA | $73,355.02 — 200 EMA | $72,016.82 — 100 EMA
🚀 Upside References:
$82,919 → $89,282 → $95,645 → $104,705 → $112,053 → $116,245
📌 Final Outlook
BTC's broader structure has strengthened after the recent recovery, with price now holding around $81K and above the major $75K–$79K support structure.
The $77K–$79K area is now an important short-term support region, while $81.26K–$82.92K remains the immediate major resistance zone.
A confirmed move above $82,919 could open the path toward $89,282, followed by $95,645 and $104,705.
However, rejection from the upper resistance area followed by a sustained loss of $75,045 would weaken the current recovery structure and bring the lower support zones back into focus.
Bias: 🟢 Recovery structure intact above $75,045. A sustained move above $82,919 could open the path toward $89,282, with $95,645 as the next major Fibonacci reference.
$BTC
{future}(BTCUSDT)
BTC Technical Outlook: Bitcoin Reclaims $81K as Recovery Structure Strengthens
BTC is currently trading around $81,058, holding above the $79K–$80K region after the recent recovery from the $72K–$75K support area.
The broader structure has improved, with price reclaiming the $80K area and moving back toward the major $81.26K–$82.92K resistance zone. A sustained move through this area would put the higher Fibonacci levels back into focus.
📈 EMA Structure
20 EMA: $77,936.12
50 EMA: $74,506.24
100 EMA: $72,016.82
200 EMA: $73,355.02
BTC is currently trading well above the 20 EMA at $77,936.
The recovery above the 50 EMA at $74,506, 100 EMA at $72,016, and 200 EMA at $73,355 keeps the broader recovery structure constructive.
The 20 EMA remains above the longer-term EMA levels, showing improving short-term structure.
The $77.9K area remains an important dynamic support during any short-term pullback.
📐 Fibonacci Levels
Key Fibonacci levels:
0.236: $75,045.77
0.382: $82,919.00
0.5: $89,282.29
0.618: $95,645.59
0.786: $104,705.19
1.0: $116,245.41
BTC is currently trading above the 0.236 Fibonacci level at $75,045.77.
The next major Fibonacci reference is $82,919 — 0.382 Fib.
A sustained move above the $81K–$82.9K resistance area could bring $89,282 into focus, followed by $95,645.
🟢 Bullish Scenario
BTC has recovered strongly from the lower support structure and is now consolidating around $80K–$81K.
Immediate resistance:
$81,262.52
$82,070.90
$82,919.00 — 0.382 Fibonacci
$89,282.29 — 0.5 Fibonacci
$95,645.59 — 0.618 Fibonacci
A clean breakout and sustained close above $82K–$82.92K would provide stronger confirmation of continued recovery.
🎯 Target 1: $82,070.90
🎯 Target 2: $82,919.00 — 0.382 Fibonacci
🎯 Target 3: $89,282.29 — 0.5 Fibonacci
🎯 Target 4: $95,645.59 — 0.618 Fibonacci
🎯 Target 5: $104,705.19 — 0.786 Fibonacci
🎯 Target 6: $112,053.30
🎯 Target 7: $116,245.41 — 1.0 Fibonacci
A confirmed move through the $82.92K zone could strengthen the medium-term recovery structure and bring the $89K–$95K region into focus.
🔴 Pullback Scenario
After the recent expansion from the $75K region toward $81K, a retest of the breakout area would be normal.
Key supports:
$79,168.48
$77,936.12 — 20 EMA
$77,447.85
$77,298.86
$77,111.13
$75,982.16
$75,045.77 — 0.236 Fibonacci
$74,506.24 — 50 EMA
$73,355.02 — 200 EMA
$72,016.82 — 100 EMA
The $77K–$79K zone is particularly important.
If BTC continues to hold this area during a pullback, the current recovery structure remains active.
A sustained loss of $75,045 would weaken the current structure and bring the lower EMA support region back into focus.
🧠 Market Structure & Liquidity
BTC has formed a recovery structure after sweeping liquidity around the $72K–$75K region.
The recent move produced a strong recovery through $75K, followed by a breakout toward $80K–$81K.
BTC is now moving through an important:
Liquidity Sweep → Accumulation → Higher Lows → Breakout → Expansion → Retest → Consolidation → Continuation
structure.
The major upside liquidity and resistance are concentrated around the $81.26K–$82.92K region.
A decisive move through this area would place $89,282 as the next major Fibonacci reference.
📊 RSI Momentum
RSI (14): 63.59
RSI MA: 56.92
RSI has moved above the neutral 50 level and remains firmly in positive territory after the recent expansion.
The current reading around 63.59 shows stronger short-term momentum while remaining below the traditional 70 overbought threshold.
A sustained RSI above 60 would keep momentum supportive, while a move back below 50 would indicate increasing short-term weakness.
🎯 Key Levels
🔴 Major Resistance:
$81,262.52 → $82,070.90 → $82,919.00 → $89,282.29 → $95,645.59
🟢 Major Support:
$79,168.48 → $77,936.12 → $77,447.85 → $77,298.86 → $77,111.13 → $75,982.16 → $75,045.77
📉 Dynamic EMA Support:
$77,936.12 — 20 EMA | $74,506.24 — 50 EMA | $73,355.02 — 200 EMA | $72,016.82 — 100 EMA
🚀 Upside References:
$82,919 → $89,282 → $95,645 → $104,705 → $112,053 → $116,245
📌 Final Outlook
BTC's broader structure has strengthened after the recent recovery, with price now holding around $81K and above the major $75K–$79K support structure.
The $77K–$79K area is now an important short-term support region, while $81.26K–$82.92K remains the immediate major resistance zone.
A confirmed move above $82,919 could open the path toward $89,282, followed by $95,645 and $104,705.
However, rejection from the upper resistance area followed by a sustained loss of $75,045 would weaken the current recovery structure and bring the lower support zones back into focus.
Bias: 🟢 Recovery structure intact above $75,045. A sustained move above $82,919 could open the path toward $89,282, with $95,645 as the next major Fibonacci reference.
$BTC
The broader structure has improved, with price reclaiming the $80K area and moving back toward the major $81.26K–$82.92K resistance zone. A sustained move through this area would put the higher Fibonacci levels back into focus.
📈 EMA Structure
20 EMA: $77,936.12
50 EMA: $74,506.24
100 EMA: $72,016.82
200 EMA: $73,355.02
BTC is currently trading well above the 20 EMA at $77,936.
The recovery above the 50 EMA at $74,506, 100 EMA at $72,016, and 200 EMA at $73,355 keeps the broader recovery structure constructive.
The 20 EMA remains above the longer-term EMA levels, showing improving short-term structure.
The $77.9K area remains an important dynamic support during any short-term pullback.
📐 Fibonacci Levels
Key Fibonacci levels:
0.236: $75,045.77
0.382: $82,919.00
0.5: $89,282.29
0.618: $95,645.59
0.786: $104,705.19
1.0: $116,245.41
BTC is currently trading above the 0.236 Fibonacci level at $75,045.77.
The next major Fibonacci reference is $82,919 — 0.382 Fib.
A sustained move above the $81K–$82.9K resistance area could bring $89,282 into focus, followed by $95,645.
🟢 Bullish Scenario
BTC has recovered strongly from the lower support structure and is now consolidating around $80K–$81K.
Immediate resistance:
$81,262.52
$82,070.90
$82,919.00 — 0.382 Fibonacci
$89,282.29 — 0.5 Fibonacci
$95,645.59 — 0.618 Fibonacci
A clean breakout and sustained close above $82K–$82.92K would provide stronger confirmation of continued recovery.
🎯 Target 1: $82,070.90
🎯 Target 2: $82,919.00 — 0.382 Fibonacci
🎯 Target 3: $89,282.29 — 0.5 Fibonacci
🎯 Target 4: $95,645.59 — 0.618 Fibonacci
🎯 Target 5: $104,705.19 — 0.786 Fibonacci
🎯 Target 6: $112,053.30
🎯 Target 7: $116,245.41 — 1.0 Fibonacci
A confirmed move through the $82.92K zone could strengthen the medium-term recovery structure and bring the $89K–$95K region into focus.
🔴 Pullback Scenario
After the recent expansion from the $75K region toward $81K, a retest of the breakout area would be normal.
Key supports:
$79,168.48
$77,936.12 — 20 EMA
$77,447.85
$77,298.86
$77,111.13
$75,982.16
$75,045.77 — 0.236 Fibonacci
$74,506.24 — 50 EMA
$73,355.02 — 200 EMA
$72,016.82 — 100 EMA
The $77K–$79K zone is particularly important.
If BTC continues to hold this area during a pullback, the current recovery structure remains active.
A sustained loss of $75,045 would weaken the current structure and bring the lower EMA support region back into focus.
🧠 Market Structure & Liquidity
BTC has formed a recovery structure after sweeping liquidity around the $72K–$75K region.
The recent move produced a strong recovery through $75K, followed by a breakout toward $80K–$81K.
BTC is now moving through an important:
Liquidity Sweep → Accumulation → Higher Lows → Breakout → Expansion → Retest → Consolidation → Continuation
structure.
The major upside liquidity and resistance are concentrated around the $81.26K–$82.92K region.
A decisive move through this area would place $89,282 as the next major Fibonacci reference.
📊 RSI Momentum
RSI (14): 63.59
RSI MA: 56.92
RSI has moved above the neutral 50 level and remains firmly in positive territory after the recent expansion.
The current reading around 63.59 shows stronger short-term momentum while remaining below the traditional 70 overbought threshold.
A sustained RSI above 60 would keep momentum supportive, while a move back below 50 would indicate increasing short-term weakness.
🎯 Key Levels
🔴 Major Resistance:
$81,262.52 → $82,070.90 → $82,919.00 → $89,282.29 → $95,645.59
🟢 Major Support:
$79,168.48 → $77,936.12 → $77,447.85 → $77,298.86 → $77,111.13 → $75,982.16 → $75,045.77
📉 Dynamic EMA Support:
$77,936.12 — 20 EMA | $74,506.24 — 50 EMA | $73,355.02 — 200 EMA | $72,016.82 — 100 EMA
🚀 Upside References:
$82,919 → $89,282 → $95,645 → $104,705 → $112,053 → $116,245
📌 Final Outlook
BTC's broader structure has strengthened after the recent recovery, with price now holding around $81K and above the major $75K–$79K support structure.
The $77K–$79K area is now an important short-term support region, while $81.26K–$82.92K remains the immediate major resistance zone.
A confirmed move above $82,919 could open the path toward $89,282, followed by $95,645 and $104,705.
However, rejection from the upper resistance area followed by a sustained loss of $75,045 would weaken the current recovery structure and bring the lower support zones back into focus.
Bias: 🟢 Recovery structure intact above $75,045. A sustained move above $82,919 could open the path toward $89,282, with $95,645 as the next major Fibonacci reference.
$BTC
43
·
--
Bài viết
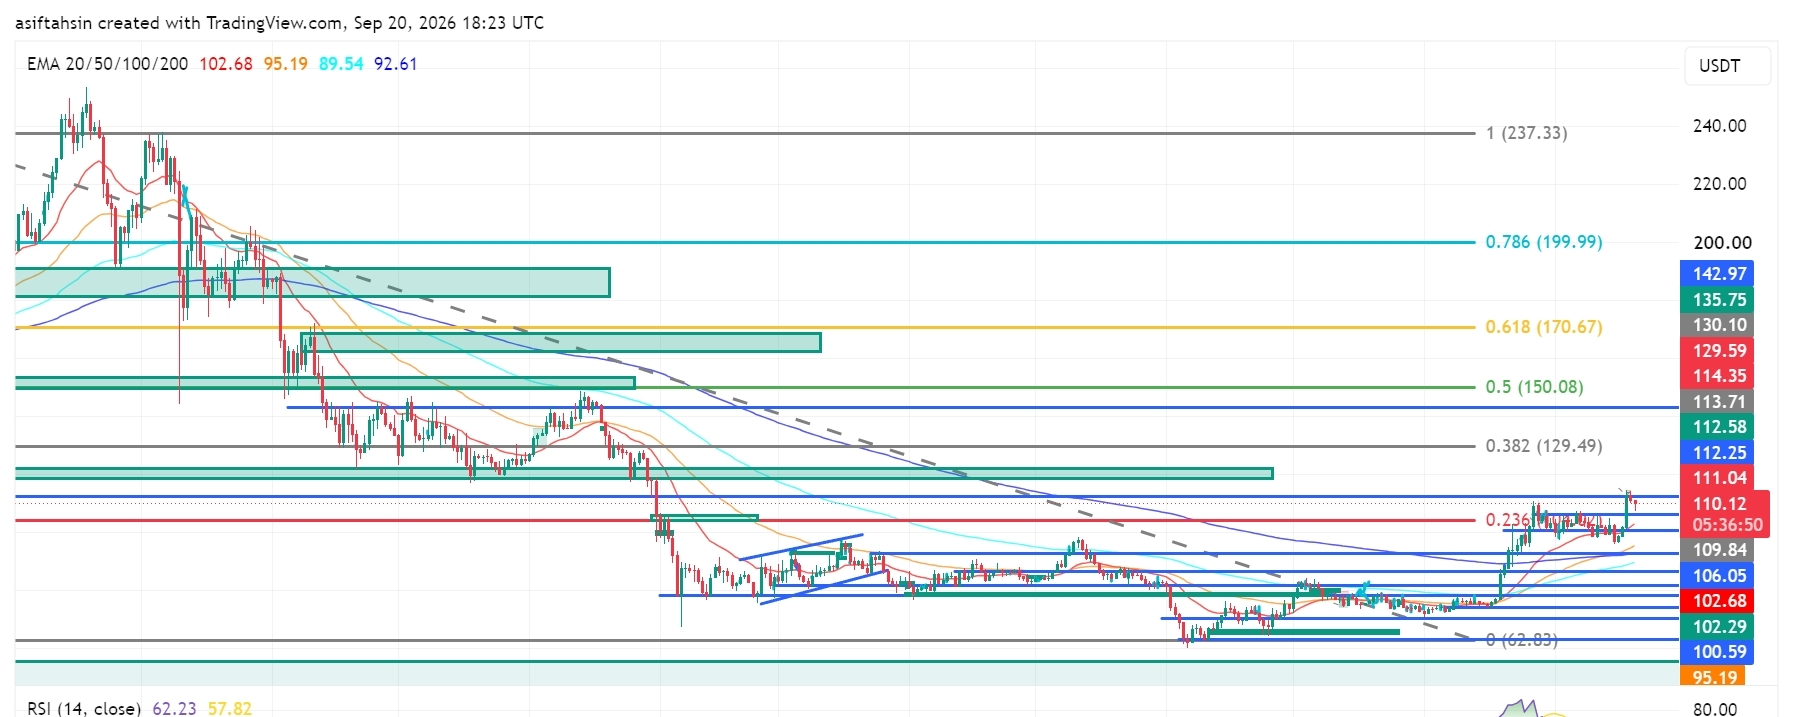
Triển vọng kỹ thuật SOL: Solana lấy lại $110 khi cấu trúc phục hồi vững mạnh hơnSOL hiện đang giao dịch quanh $110.1, giữ vững trên vùng $106–$109 sau đợt phục hồi gần đây từ khu vực hỗ trợ $92–$100.
Cấu trúc tổng thể đã được cải thiện: giá đã quay trở lại vùng $100 và di chuyển tiến gần khu vực kháng cự quan trọng $111–$114. Nếu giá duy trì một nhịp vượt qua khu vực này, các mốc Fibonacci cao hơn sẽ lại được chú ý.
📈 Cấu trúc EMA
20 EMA: $102.68
50 EMA: $95.19
100 EMA: $89.54
200 EMA: $92.61
SOL hiện đang giao dịch cao hơn đáng kể so với đường EMA 20 tại mức $102.68.
Việc phục hồi trở lại trên EMA 50 ở mức $95.19, EMA 100 ở mức $89.54 và EMA 200 ở mức $92.61 giúp cấu trúc phục hồi chung trở nên tích cực.
Triển vọng kỹ thuật SOL: Solana lấy lại $110 khi cấu trúc phục hồi vững mạnh hơn
SOL hiện đang giao dịch quanh $110.1, giữ vững trên vùng $106–$109 sau đợt phục hồi gần đây từ khu vực hỗ trợ $92–$100.
Cấu trúc tổng thể đã được cải thiện: giá đã quay trở lại vùng $100 và di chuyển tiến gần khu vực kháng cự quan trọng $111–$114. Nếu giá duy trì một nhịp vượt qua khu vực này, các mốc Fibonacci cao hơn sẽ lại được chú ý.
📈 Cấu trúc EMA
20 EMA: $102.68
50 EMA: $95.19
100 EMA: $89.54
200 EMA: $92.61
SOL hiện đang giao dịch cao hơn đáng kể so với đường EMA 20 tại mức $102.68.
Việc phục hồi trở lại trên EMA 50 ở mức $95.19, EMA 100 ở mức $89.54 và EMA 200 ở mức $92.61 giúp cấu trúc phục hồi chung trở nên tích cực.
Cấu trúc tổng thể đã được cải thiện: giá đã quay trở lại vùng $100 và di chuyển tiến gần khu vực kháng cự quan trọng $111–$114. Nếu giá duy trì một nhịp vượt qua khu vực này, các mốc Fibonacci cao hơn sẽ lại được chú ý.
📈 Cấu trúc EMA
20 EMA: $102.68
50 EMA: $95.19
100 EMA: $89.54
200 EMA: $92.61
SOL hiện đang giao dịch cao hơn đáng kể so với đường EMA 20 tại mức $102.68.
Việc phục hồi trở lại trên EMA 50 ở mức $95.19, EMA 100 ở mức $89.54 và EMA 200 ở mức $92.61 giúp cấu trúc phục hồi chung trở nên tích cực.
1.1k
·
--
Bài viết
Xem bản dịch
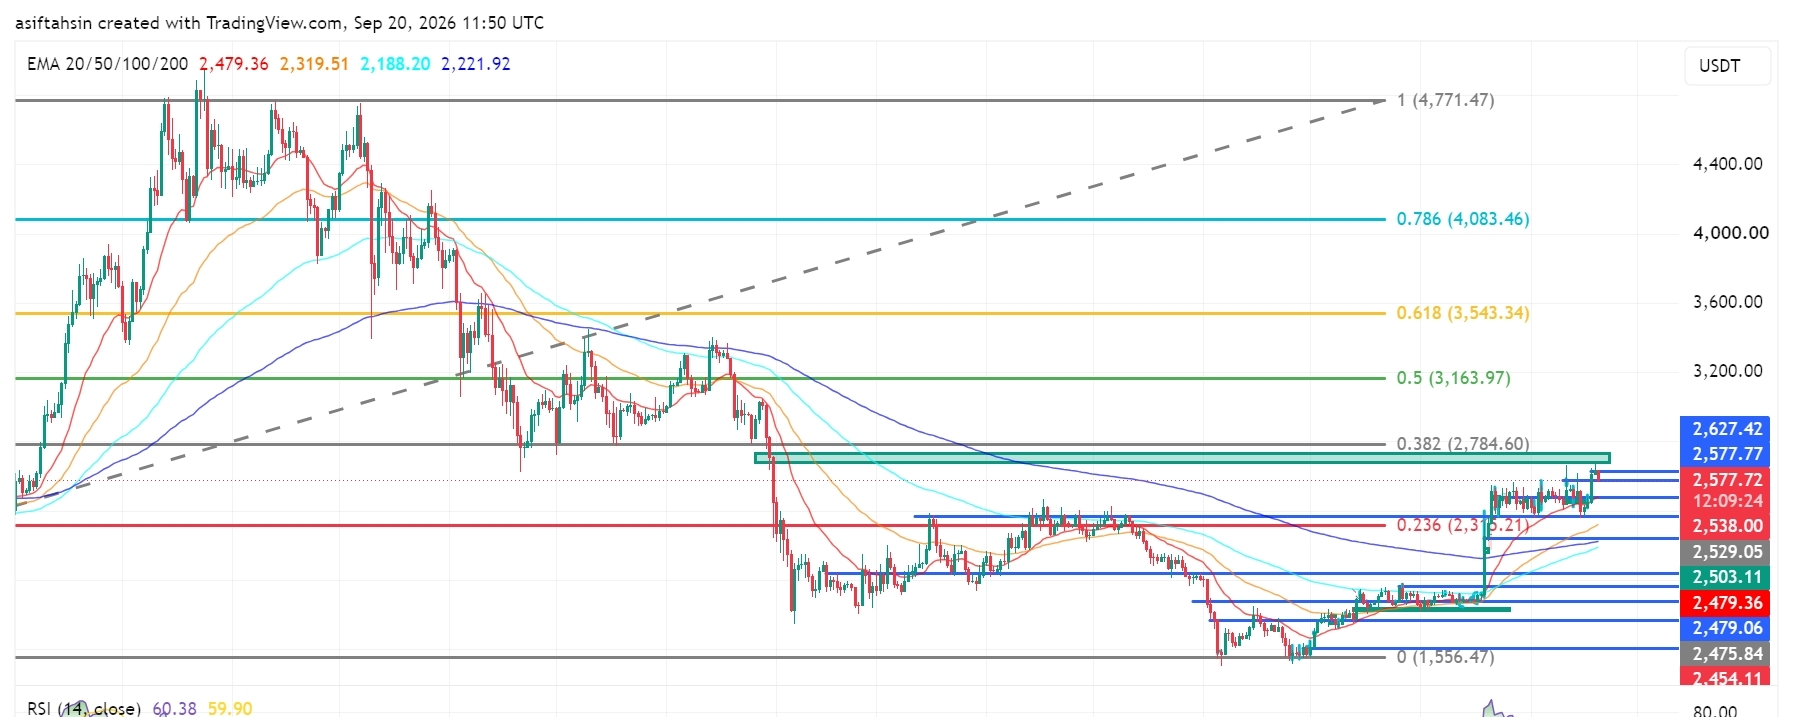
ETH Technical Outlook: Ethereum Holds Near $2.58K as Recovery ContinuesETH is currently trading around $2,577, holding above the $2,500–$2,540 support area after the recent recovery from the $2,280–$2,360 demand zone.
The broader recovery structure remains constructive, with price now approaching the important $2,627–$2,785 resistance zone. The $2,784.60 level is the major 0.382 Fibonacci reference on the chart.
📈 EMA Structure
20 EMA: $2,479.36
50 EMA: $2,319.51
100 EMA: $2,188.20
200 EMA: $2,221.92
ETH is currently trading well above the 20 EMA at $2,479.36.
The recovery above the 50 EMA at $2,319.51, 100 EMA at $2,188.20, and 200 EMA at $2,221.92 keeps the broader recovery structure constructive.
The 20 EMA is now acting as an important dynamic reference. A sustained hold above this level would keep the short-term structure supported.
📐 Fibonacci Levels
Key Fibonacci levels:
0.236: $2,315.21
0.382: $2,784.60
0.5: $3,163.97
0.618: $3,543.34
0.786: $4,083.46
1.0: $4,771.47
ETH has moved significantly above the 0.236 Fibonacci level at $2,315.21.
The next major Fibonacci resistance is $2,784.60 — 0.382 Fib.
A sustained move through the $2,627–$2,785 resistance structure would bring the higher Fibonacci levels into focus.
🟢 Upside Scenario
ETH is consolidating near $2,577 after the recent recovery and is now approaching the upper resistance structure.
Immediate resistance:
$2,577.77
$2,627.42
$2,784.60 — 0.382 Fibonacci
$3,163.97 — 0.5 Fibonacci
$3,543.34 — 0.618 Fibonacci
A clean breakout and sustained close above the $2,627–$2,785 zone would provide stronger confirmation of continued recovery.
🎯 Target 1: $2,627.42
🎯 Target 2: $2,784.60 — 0.382 Fibonacci
🎯 Target 3: $3,163.97 — 0.5 Fibonacci
🎯 Target 4: $3,543.34 — 0.618 Fibonacci
🎯 Target 5: $4,083.46 — 0.786 Fibonacci
🎯 Target 6: $4,771.47 — 1.0 Fibonacci
A sustained move above $2,784.60 could strengthen the medium-term recovery structure and bring the $3,164–$3,543 region into focus.
🔴 Pullback Scenario
After the recent expansion, a retest of the breakout area would be normal.
Key supports:
$2,538.00
$2,529.05
$2,503.11
$2,479.36 — 20 EMA
$2,479.06
$2,475.84
$2,454.11
$2,405.75
$2,319.51 — 50 EMA
The $2,475–$2,540 zone is particularly important.
If ETH continues to hold this area during a pullback, the current recovery structure remains active.
A sustained loss of the $2,475–$2,454 area would weaken the short-term structure and could expose the lower $2,405–$2,320 region.
🧠 Market Structure & Liquidity
ETH has formed a clear recovery structure after sweeping liquidity around the $2,280–$2,360 region.
The recent move produced a strong breakout from the previous consolidation and pushed price toward the $2,600 area.
ETH is now moving through an important:
Recovery → Breakout → Consolidation → Continuation
structure.
The major upside liquidity is concentrated around $2,627–$2,785. A decisive move through this zone would place $3,163.97 as the next major Fibonacci reference.
📊 RSI Momentum
RSI (14): 60.38
RSI remains above the neutral 50 level and is currently around 60, showing positive momentum.
The RSI signal line is around 59.90, keeping momentum relatively balanced near the 60 area.
A sustained RSI above 60 would support continued momentum, while a move back below 50 would indicate increasing short-term weakness.
🎯 Key Levels
🔴 Major Resistance: $2,627.42 → $2,784.60 → $3,163.97 → $3,543.34
🟢 Major Support: $2,538.00 → $2,529.05 → $2,503.11 → $2,479.36 → $2,454.11
📉 Dynamic EMA Support: $2,479.36 — 20 EMA | $2,319.51 — 50 EMA | $2,221.92 — 200 EMA | $2,188.20 — 100 EMA
🚀 Upside References: $2,784.60 → $3,163.97 → $3,543.34 → $4,083.46
📌 Final Outlook
ETH's broader structure remains constructive after the recent recovery, with price now holding around $2,577 and above the major $2,475–$2,540 support structure.
The $2,475–$2,540 area is now an important short-term support region, while $2,627–$2,785 remains the immediate major resistance zone.
A confirmed move above $2,784.60 could open the path toward $3,163.97, followed by $3,543.34 and potentially $4,083.46.
However, rejection from the upper resistance area followed by a sustained loss of $2,454.11 would weaken the current structure and bring the lower support zones back into focus.
Bias: 🟢 Recovery structure intact above $2,454.11. A sustained move above $2,784.60 could open the path toward $3,163.97, with $3,543.34 as the next major Fibonacci reference.
$ETH
{future}(ETHUSDT)
ETH Technical Outlook: Ethereum Holds Near $2.58K as Recovery Continues
ETH is currently trading around $2,577, holding above the $2,500–$2,540 support area after the recent recovery from the $2,280–$2,360 demand zone.
The broader recovery structure remains constructive, with price now approaching the important $2,627–$2,785 resistance zone. The $2,784.60 level is the major 0.382 Fibonacci reference on the chart.
📈 EMA Structure
20 EMA: $2,479.36
50 EMA: $2,319.51
100 EMA: $2,188.20
200 EMA: $2,221.92
ETH is currently trading well above the 20 EMA at $2,479.36.
The recovery above the 50 EMA at $2,319.51, 100 EMA at $2,188.20, and 200 EMA at $2,221.92 keeps the broader recovery structure constructive.
The 20 EMA is now acting as an important dynamic reference. A sustained hold above this level would keep the short-term structure supported.
📐 Fibonacci Levels
Key Fibonacci levels:
0.236: $2,315.21
0.382: $2,784.60
0.5: $3,163.97
0.618: $3,543.34
0.786: $4,083.46
1.0: $4,771.47
ETH has moved significantly above the 0.236 Fibonacci level at $2,315.21.
The next major Fibonacci resistance is $2,784.60 — 0.382 Fib.
A sustained move through the $2,627–$2,785 resistance structure would bring the higher Fibonacci levels into focus.
🟢 Upside Scenario
ETH is consolidating near $2,577 after the recent recovery and is now approaching the upper resistance structure.
Immediate resistance:
$2,577.77
$2,627.42
$2,784.60 — 0.382 Fibonacci
$3,163.97 — 0.5 Fibonacci
$3,543.34 — 0.618 Fibonacci
A clean breakout and sustained close above the $2,627–$2,785 zone would provide stronger confirmation of continued recovery.
🎯 Target 1: $2,627.42
🎯 Target 2: $2,784.60 — 0.382 Fibonacci
🎯 Target 3: $3,163.97 — 0.5 Fibonacci
🎯 Target 4: $3,543.34 — 0.618 Fibonacci
🎯 Target 5: $4,083.46 — 0.786 Fibonacci
🎯 Target 6: $4,771.47 — 1.0 Fibonacci
A sustained move above $2,784.60 could strengthen the medium-term recovery structure and bring the $3,164–$3,543 region into focus.
🔴 Pullback Scenario
After the recent expansion, a retest of the breakout area would be normal.
Key supports:
$2,538.00
$2,529.05
$2,503.11
$2,479.36 — 20 EMA
$2,479.06
$2,475.84
$2,454.11
$2,405.75
$2,319.51 — 50 EMA
The $2,475–$2,540 zone is particularly important.
If ETH continues to hold this area during a pullback, the current recovery structure remains active.
A sustained loss of the $2,475–$2,454 area would weaken the short-term structure and could expose the lower $2,405–$2,320 region.
🧠 Market Structure & Liquidity
ETH has formed a clear recovery structure after sweeping liquidity around the $2,280–$2,360 region.
The recent move produced a strong breakout from the previous consolidation and pushed price toward the $2,600 area.
ETH is now moving through an important:
Recovery → Breakout → Consolidation → Continuation
structure.
The major upside liquidity is concentrated around $2,627–$2,785. A decisive move through this zone would place $3,163.97 as the next major Fibonacci reference.
📊 RSI Momentum
RSI (14): 60.38
RSI remains above the neutral 50 level and is currently around 60, showing positive momentum.
The RSI signal line is around 59.90, keeping momentum relatively balanced near the 60 area.
A sustained RSI above 60 would support continued momentum, while a move back below 50 would indicate increasing short-term weakness.
🎯 Key Levels
🔴 Major Resistance: $2,627.42 → $2,784.60 → $3,163.97 → $3,543.34
🟢 Major Support: $2,538.00 → $2,529.05 → $2,503.11 → $2,479.36 → $2,454.11
📉 Dynamic EMA Support: $2,479.36 — 20 EMA | $2,319.51 — 50 EMA | $2,221.92 — 200 EMA | $2,188.20 — 100 EMA
🚀 Upside References: $2,784.60 → $3,163.97 → $3,543.34 → $4,083.46
📌 Final Outlook
ETH's broader structure remains constructive after the recent recovery, with price now holding around $2,577 and above the major $2,475–$2,540 support structure.
The $2,475–$2,540 area is now an important short-term support region, while $2,627–$2,785 remains the immediate major resistance zone.
A confirmed move above $2,784.60 could open the path toward $3,163.97, followed by $3,543.34 and potentially $4,083.46.
However, rejection from the upper resistance area followed by a sustained loss of $2,454.11 would weaken the current structure and bring the lower support zones back into focus.
Bias: 🟢 Recovery structure intact above $2,454.11. A sustained move above $2,784.60 could open the path toward $3,163.97, with $3,543.34 as the next major Fibonacci reference.
$ETH
The broader recovery structure remains constructive, with price now approaching the important $2,627–$2,785 resistance zone. The $2,784.60 level is the major 0.382 Fibonacci reference on the chart.
📈 EMA Structure
20 EMA: $2,479.36
50 EMA: $2,319.51
100 EMA: $2,188.20
200 EMA: $2,221.92
ETH is currently trading well above the 20 EMA at $2,479.36.
The recovery above the 50 EMA at $2,319.51, 100 EMA at $2,188.20, and 200 EMA at $2,221.92 keeps the broader recovery structure constructive.
The 20 EMA is now acting as an important dynamic reference. A sustained hold above this level would keep the short-term structure supported.
📐 Fibonacci Levels
Key Fibonacci levels:
0.236: $2,315.21
0.382: $2,784.60
0.5: $3,163.97
0.618: $3,543.34
0.786: $4,083.46
1.0: $4,771.47
ETH has moved significantly above the 0.236 Fibonacci level at $2,315.21.
The next major Fibonacci resistance is $2,784.60 — 0.382 Fib.
A sustained move through the $2,627–$2,785 resistance structure would bring the higher Fibonacci levels into focus.
🟢 Upside Scenario
ETH is consolidating near $2,577 after the recent recovery and is now approaching the upper resistance structure.
Immediate resistance:
$2,577.77
$2,627.42
$2,784.60 — 0.382 Fibonacci
$3,163.97 — 0.5 Fibonacci
$3,543.34 — 0.618 Fibonacci
A clean breakout and sustained close above the $2,627–$2,785 zone would provide stronger confirmation of continued recovery.
🎯 Target 1: $2,627.42
🎯 Target 2: $2,784.60 — 0.382 Fibonacci
🎯 Target 3: $3,163.97 — 0.5 Fibonacci
🎯 Target 4: $3,543.34 — 0.618 Fibonacci
🎯 Target 5: $4,083.46 — 0.786 Fibonacci
🎯 Target 6: $4,771.47 — 1.0 Fibonacci
A sustained move above $2,784.60 could strengthen the medium-term recovery structure and bring the $3,164–$3,543 region into focus.
🔴 Pullback Scenario
After the recent expansion, a retest of the breakout area would be normal.
Key supports:
$2,538.00
$2,529.05
$2,503.11
$2,479.36 — 20 EMA
$2,479.06
$2,475.84
$2,454.11
$2,405.75
$2,319.51 — 50 EMA
The $2,475–$2,540 zone is particularly important.
If ETH continues to hold this area during a pullback, the current recovery structure remains active.
A sustained loss of the $2,475–$2,454 area would weaken the short-term structure and could expose the lower $2,405–$2,320 region.
🧠 Market Structure & Liquidity
ETH has formed a clear recovery structure after sweeping liquidity around the $2,280–$2,360 region.
The recent move produced a strong breakout from the previous consolidation and pushed price toward the $2,600 area.
ETH is now moving through an important:
Recovery → Breakout → Consolidation → Continuation
structure.
The major upside liquidity is concentrated around $2,627–$2,785. A decisive move through this zone would place $3,163.97 as the next major Fibonacci reference.
📊 RSI Momentum
RSI (14): 60.38
RSI remains above the neutral 50 level and is currently around 60, showing positive momentum.
The RSI signal line is around 59.90, keeping momentum relatively balanced near the 60 area.
A sustained RSI above 60 would support continued momentum, while a move back below 50 would indicate increasing short-term weakness.
🎯 Key Levels
🔴 Major Resistance: $2,627.42 → $2,784.60 → $3,163.97 → $3,543.34
🟢 Major Support: $2,538.00 → $2,529.05 → $2,503.11 → $2,479.36 → $2,454.11
📉 Dynamic EMA Support: $2,479.36 — 20 EMA | $2,319.51 — 50 EMA | $2,221.92 — 200 EMA | $2,188.20 — 100 EMA
🚀 Upside References: $2,784.60 → $3,163.97 → $3,543.34 → $4,083.46
📌 Final Outlook
ETH's broader structure remains constructive after the recent recovery, with price now holding around $2,577 and above the major $2,475–$2,540 support structure.
The $2,475–$2,540 area is now an important short-term support region, while $2,627–$2,785 remains the immediate major resistance zone.
A confirmed move above $2,784.60 could open the path toward $3,163.97, followed by $3,543.34 and potentially $4,083.46.
However, rejection from the upper resistance area followed by a sustained loss of $2,454.11 would weaken the current structure and bring the lower support zones back into focus.
Bias: 🟢 Recovery structure intact above $2,454.11. A sustained move above $2,784.60 could open the path toward $3,163.97, with $3,543.34 as the next major Fibonacci reference.
$ETH
65
·
--
Bài viết
Xem bản dịch
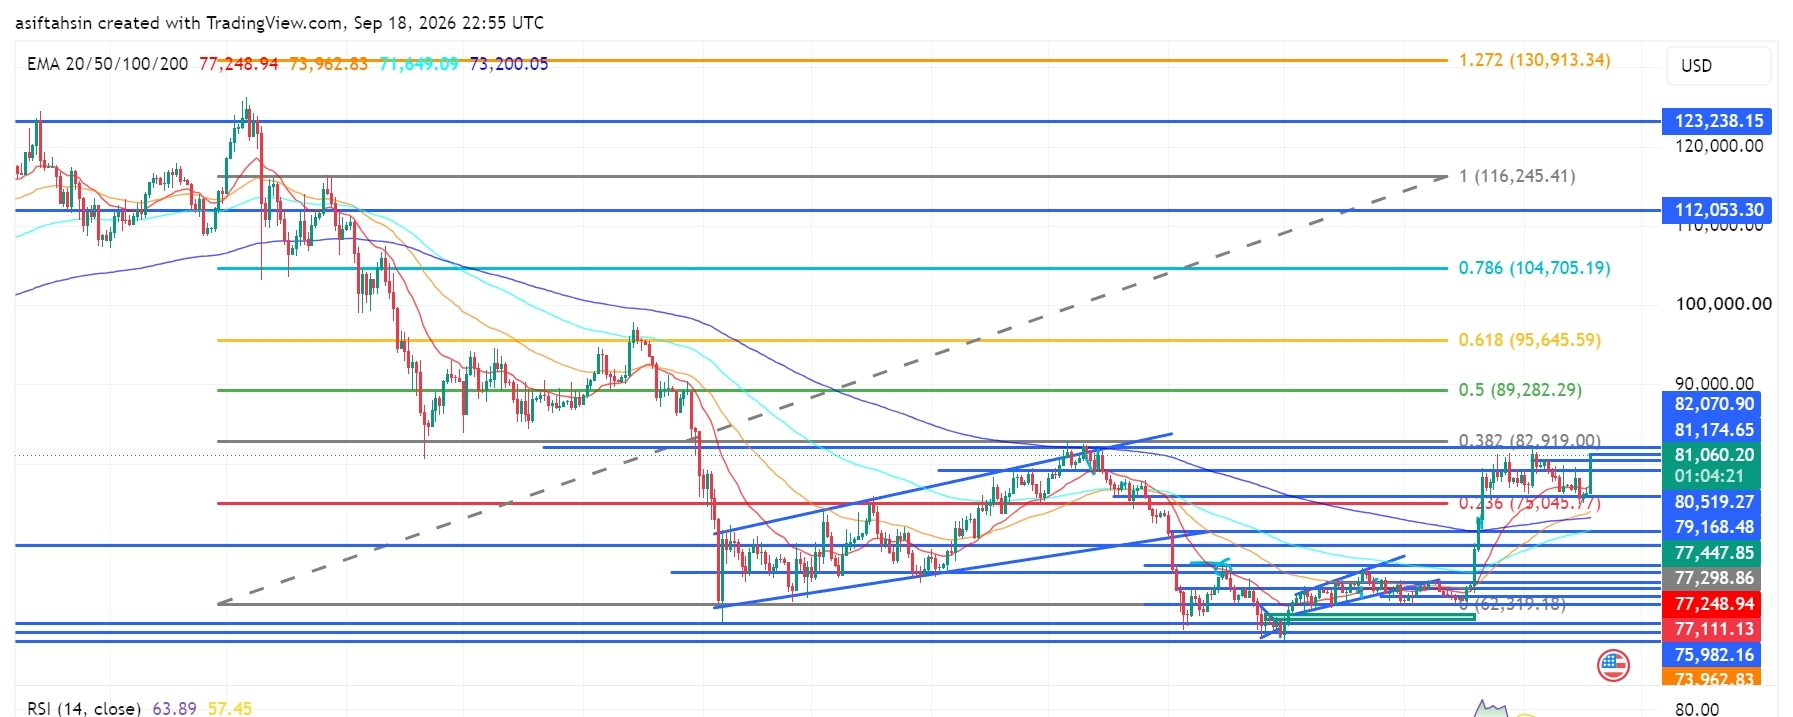
BTC Technical Outlook: Bitcoin Reclaims $81K as Recovery Structure StrengthensBTC is currently trading around $81,060, holding above the $79,000–$80,000 region after the recent recovery from the $73,000–$76,000 demand area.
The broader structure has improved, with price reclaiming the $80K area and moving back toward the major $82,070–$82,919 resistance zone. A sustained move through this area would put the higher Fibonacci levels back into focus.
📈 EMA Structure
20 EMA: $77,248.95
50 EMA: $73,962.83
100 EMA: $71,649.09
200 EMA: $73,200.05
BTC is currently trading well above the 20 EMA at $77,248.95.
The recovery above the 50 EMA at $73,962.83, 100 EMA at $71,649.09, and 200 EMA at $73,200.05 keeps the broader recovery structure constructive.
The 20 EMA has moved above the longer-term EMA levels, showing improving short-term structure.
📐 Fibonacci Levels
Key Fibonacci levels:
0.236: $75,045.77
0.382: $82,919.00
0.5: $89,282.29
0.618: $95,645.59
0.786: $104,705.19
1.0: $116,245.41
1.272: $130,913.34
BTC is currently trading between the 0.236 and 0.382 Fibonacci levels.
The next major Fibonacci reference is $82,919 — 0.382 Fib.
A sustained move above the $82,070–$82,919 zone could bring $89,282 into focus, followed by $95,645.
🟢 Bullish Scenario
BTC has recovered strongly from the lower support structure and is now consolidating around $80K–$81K.
Immediate resistance:
$81,174.65
$82,070.90
$82,919.00 — 0.382 Fibonacci
$89,282.29 — 0.5 Fibonacci
$95,645.59 — 0.618 Fibonacci
A clean breakout and sustained close above $82,070–$82,919 would provide stronger confirmation of continued recovery.
🎯 Target 1: $82,070
🎯 Target 2: $82,919 — 0.382 Fibonacci
🎯 Target 3: $89,282 — 0.5 Fibonacci
🎯 Target 4: $95,645 — 0.618 Fibonacci
🎯 Target 5: $104,705 — 0.786 Fibonacci
🎯 Target 6: $116,245 — 1.0 Fibonacci
A confirmed move through the $82K–$83K zone could strengthen the medium-term recovery structure and bring the $89K–$95K region into focus.
🔴 Pullback Scenario
After the recent expansion above $80K, a retest of the breakout area would be normal.
Key supports:
$80,519.27
$79,168.48
$77,447.85
$77,298.86
$77,248.95 — 20 EMA
$77,111.13
$75,982.16
$75,045.77 — 0.236 Fibonacci
$73,962.83 — 50 EMA
$73,200.05 — 200 EMA
The $77K–$80K zone is particularly important.
If BTC continues to hold this area during a pullback, the current recovery structure remains active.
A sustained loss of $75,045 would weaken the current recovery structure and bring the lower EMA region back into focus.
🧠 Market Structure & Liquidity
BTC has formed a recovery structure after sweeping liquidity around the $73K–$76K region.
The recent move produced a strong recovery through $77K, followed by a breakout above $80K.
BTC is now moving through an important:
Recovery → Breakout → Retest → Consolidation → Continuation
structure.
The major upside liquidity is concentrated around $81K–$83K. A decisive move through this area would place $89,282 as the next major Fibonacci reference.
📊 RSI Momentum
RSI (14): 63.89
RSI has moved above the neutral 50 level and remains in positive territory after the recent expansion.
The current reading shows stronger short-term momentum, while still remaining below the traditional 70 overbought threshold.
A sustained RSI above 60 would keep momentum supportive, while a move back below 50 would indicate increasing short-term weakness.
🎯 Key Levels
🔴 Major Resistance: $81,174.65 → $82,070.90 → $82,919 → $89,282 → $95,645
🟢 Major Support: $80,519 → $79,168 → $77,447 → $77,249 → $75,982 → $75,045
📉 Dynamic EMA Support: $77,248.95 — 20 EMA | $73,962.83 — 50 EMA | $73,200.05 — 200 EMA | $71,649.09 — 100 EMA
🚀 Upside References: $82,919 → $89,282 → $95,645 → $104,705 → $116,245
📌 Final Outlook
BTC's broader structure has strengthened after the recent recovery, with price now holding around $81K and above the major $77K–$80K support structure.
The $77K–$80K area is now an important short-term support region, while $82K–$83K remains the immediate major resistance zone.
A confirmed move above $82,919 could open the path toward $89,282, followed by $95,645 and $104,705.
However, rejection from the upper resistance area followed by a sustained loss of $75,045 would weaken the current recovery structure and bring the lower support zones back into focus.
Bias: 🟢 Recovery structure intact above $75,045. A sustained move above $82,919 could open the path toward $89,282, with $95,645 as the next major Fibonacci reference.
$BTC
{future}(BTCUSDT)
BTC Technical Outlook: Bitcoin Reclaims $81K as Recovery Structure Strengthens
BTC is currently trading around $81,060, holding above the $79,000–$80,000 region after the recent recovery from the $73,000–$76,000 demand area.
The broader structure has improved, with price reclaiming the $80K area and moving back toward the major $82,070–$82,919 resistance zone. A sustained move through this area would put the higher Fibonacci levels back into focus.
📈 EMA Structure
20 EMA: $77,248.95
50 EMA: $73,962.83
100 EMA: $71,649.09
200 EMA: $73,200.05
BTC is currently trading well above the 20 EMA at $77,248.95.
The recovery above the 50 EMA at $73,962.83, 100 EMA at $71,649.09, and 200 EMA at $73,200.05 keeps the broader recovery structure constructive.
The 20 EMA has moved above the longer-term EMA levels, showing improving short-term structure.
📐 Fibonacci Levels
Key Fibonacci levels:
0.236: $75,045.77
0.382: $82,919.00
0.5: $89,282.29
0.618: $95,645.59
0.786: $104,705.19
1.0: $116,245.41
1.272: $130,913.34
BTC is currently trading between the 0.236 and 0.382 Fibonacci levels.
The next major Fibonacci reference is $82,919 — 0.382 Fib.
A sustained move above the $82,070–$82,919 zone could bring $89,282 into focus, followed by $95,645.
🟢 Bullish Scenario
BTC has recovered strongly from the lower support structure and is now consolidating around $80K–$81K.
Immediate resistance:
$81,174.65
$82,070.90
$82,919.00 — 0.382 Fibonacci
$89,282.29 — 0.5 Fibonacci
$95,645.59 — 0.618 Fibonacci
A clean breakout and sustained close above $82,070–$82,919 would provide stronger confirmation of continued recovery.
🎯 Target 1: $82,070
🎯 Target 2: $82,919 — 0.382 Fibonacci
🎯 Target 3: $89,282 — 0.5 Fibonacci
🎯 Target 4: $95,645 — 0.618 Fibonacci
🎯 Target 5: $104,705 — 0.786 Fibonacci
🎯 Target 6: $116,245 — 1.0 Fibonacci
A confirmed move through the $82K–$83K zone could strengthen the medium-term recovery structure and bring the $89K–$95K region into focus.
🔴 Pullback Scenario
After the recent expansion above $80K, a retest of the breakout area would be normal.
Key supports:
$80,519.27
$79,168.48
$77,447.85
$77,298.86
$77,248.95 — 20 EMA
$77,111.13
$75,982.16
$75,045.77 — 0.236 Fibonacci
$73,962.83 — 50 EMA
$73,200.05 — 200 EMA
The $77K–$80K zone is particularly important.
If BTC continues to hold this area during a pullback, the current recovery structure remains active.
A sustained loss of $75,045 would weaken the current recovery structure and bring the lower EMA region back into focus.
🧠 Market Structure & Liquidity
BTC has formed a recovery structure after sweeping liquidity around the $73K–$76K region.
The recent move produced a strong recovery through $77K, followed by a breakout above $80K.
BTC is now moving through an important:
Recovery → Breakout → Retest → Consolidation → Continuation
structure.
The major upside liquidity is concentrated around $81K–$83K. A decisive move through this area would place $89,282 as the next major Fibonacci reference.
📊 RSI Momentum
RSI (14): 63.89
RSI has moved above the neutral 50 level and remains in positive territory after the recent expansion.
The current reading shows stronger short-term momentum, while still remaining below the traditional 70 overbought threshold.
A sustained RSI above 60 would keep momentum supportive, while a move back below 50 would indicate increasing short-term weakness.
🎯 Key Levels
🔴 Major Resistance: $81,174.65 → $82,070.90 → $82,919 → $89,282 → $95,645
🟢 Major Support: $80,519 → $79,168 → $77,447 → $77,249 → $75,982 → $75,045
📉 Dynamic EMA Support: $77,248.95 — 20 EMA | $73,962.83 — 50 EMA | $73,200.05 — 200 EMA | $71,649.09 — 100 EMA
🚀 Upside References: $82,919 → $89,282 → $95,645 → $104,705 → $116,245
📌 Final Outlook
BTC's broader structure has strengthened after the recent recovery, with price now holding around $81K and above the major $77K–$80K support structure.
The $77K–$80K area is now an important short-term support region, while $82K–$83K remains the immediate major resistance zone.
A confirmed move above $82,919 could open the path toward $89,282, followed by $95,645 and $104,705.
However, rejection from the upper resistance area followed by a sustained loss of $75,045 would weaken the current recovery structure and bring the lower support zones back into focus.
Bias: 🟢 Recovery structure intact above $75,045. A sustained move above $82,919 could open the path toward $89,282, with $95,645 as the next major Fibonacci reference.
$BTC
The broader structure has improved, with price reclaiming the $80K area and moving back toward the major $82,070–$82,919 resistance zone. A sustained move through this area would put the higher Fibonacci levels back into focus.
📈 EMA Structure
20 EMA: $77,248.95
50 EMA: $73,962.83
100 EMA: $71,649.09
200 EMA: $73,200.05
BTC is currently trading well above the 20 EMA at $77,248.95.
The recovery above the 50 EMA at $73,962.83, 100 EMA at $71,649.09, and 200 EMA at $73,200.05 keeps the broader recovery structure constructive.
The 20 EMA has moved above the longer-term EMA levels, showing improving short-term structure.
📐 Fibonacci Levels
Key Fibonacci levels:
0.236: $75,045.77
0.382: $82,919.00
0.5: $89,282.29
0.618: $95,645.59
0.786: $104,705.19
1.0: $116,245.41
1.272: $130,913.34
BTC is currently trading between the 0.236 and 0.382 Fibonacci levels.
The next major Fibonacci reference is $82,919 — 0.382 Fib.
A sustained move above the $82,070–$82,919 zone could bring $89,282 into focus, followed by $95,645.
🟢 Bullish Scenario
BTC has recovered strongly from the lower support structure and is now consolidating around $80K–$81K.
Immediate resistance:
$81,174.65
$82,070.90
$82,919.00 — 0.382 Fibonacci
$89,282.29 — 0.5 Fibonacci
$95,645.59 — 0.618 Fibonacci
A clean breakout and sustained close above $82,070–$82,919 would provide stronger confirmation of continued recovery.
🎯 Target 1: $82,070
🎯 Target 2: $82,919 — 0.382 Fibonacci
🎯 Target 3: $89,282 — 0.5 Fibonacci
🎯 Target 4: $95,645 — 0.618 Fibonacci
🎯 Target 5: $104,705 — 0.786 Fibonacci
🎯 Target 6: $116,245 — 1.0 Fibonacci
A confirmed move through the $82K–$83K zone could strengthen the medium-term recovery structure and bring the $89K–$95K region into focus.
🔴 Pullback Scenario
After the recent expansion above $80K, a retest of the breakout area would be normal.
Key supports:
$80,519.27
$79,168.48
$77,447.85
$77,298.86
$77,248.95 — 20 EMA
$77,111.13
$75,982.16
$75,045.77 — 0.236 Fibonacci
$73,962.83 — 50 EMA
$73,200.05 — 200 EMA
The $77K–$80K zone is particularly important.
If BTC continues to hold this area during a pullback, the current recovery structure remains active.
A sustained loss of $75,045 would weaken the current recovery structure and bring the lower EMA region back into focus.
🧠 Market Structure & Liquidity
BTC has formed a recovery structure after sweeping liquidity around the $73K–$76K region.
The recent move produced a strong recovery through $77K, followed by a breakout above $80K.
BTC is now moving through an important:
Recovery → Breakout → Retest → Consolidation → Continuation
structure.
The major upside liquidity is concentrated around $81K–$83K. A decisive move through this area would place $89,282 as the next major Fibonacci reference.
📊 RSI Momentum
RSI (14): 63.89
RSI has moved above the neutral 50 level and remains in positive territory after the recent expansion.
The current reading shows stronger short-term momentum, while still remaining below the traditional 70 overbought threshold.
A sustained RSI above 60 would keep momentum supportive, while a move back below 50 would indicate increasing short-term weakness.
🎯 Key Levels
🔴 Major Resistance: $81,174.65 → $82,070.90 → $82,919 → $89,282 → $95,645
🟢 Major Support: $80,519 → $79,168 → $77,447 → $77,249 → $75,982 → $75,045
📉 Dynamic EMA Support: $77,248.95 — 20 EMA | $73,962.83 — 50 EMA | $73,200.05 — 200 EMA | $71,649.09 — 100 EMA
🚀 Upside References: $82,919 → $89,282 → $95,645 → $104,705 → $116,245
📌 Final Outlook
BTC's broader structure has strengthened after the recent recovery, with price now holding around $81K and above the major $77K–$80K support structure.
The $77K–$80K area is now an important short-term support region, while $82K–$83K remains the immediate major resistance zone.
A confirmed move above $82,919 could open the path toward $89,282, followed by $95,645 and $104,705.
However, rejection from the upper resistance area followed by a sustained loss of $75,045 would weaken the current recovery structure and bring the lower support zones back into focus.
Bias: 🟢 Recovery structure intact above $75,045. A sustained move above $82,919 could open the path toward $89,282, with $95,645 as the next major Fibonacci reference.
$BTC
12
·
--
Bài viết
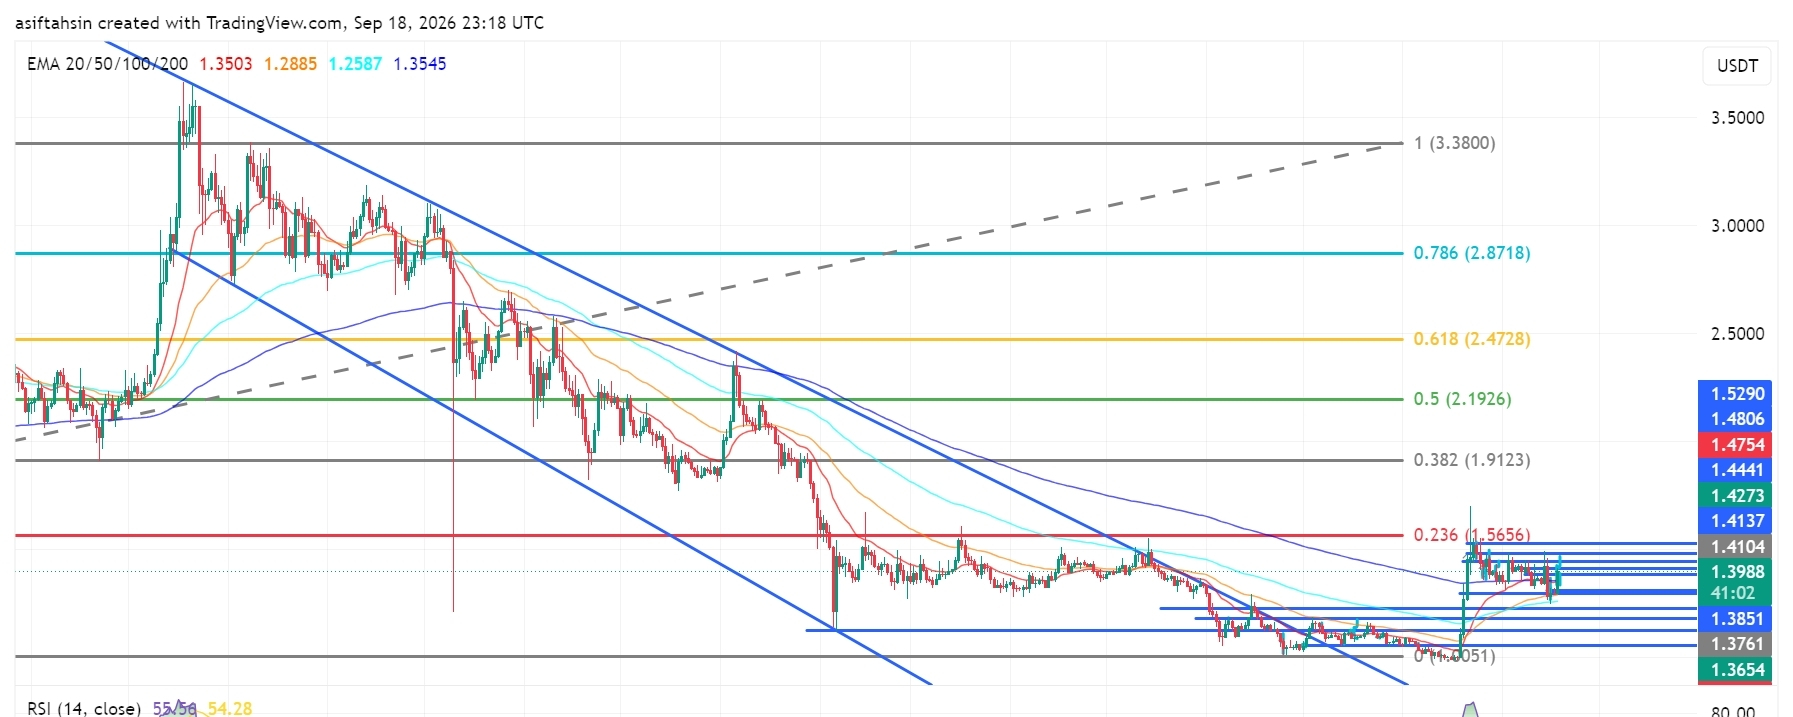
Triển vọng kỹ thuật XRP: XRP giữ gần $1.40 khi phe BULL bảo vệ đợt bứt pháHiện tại XRP đang giao dịch quanh $1.40, đang tích lũy sau một đợt phục hồi mạnh từ các đáy tháng 8 và một cú bứt phá mạnh khỏi cấu trúc giảm dần trước đó.
Cấu trúc tổng thể đã được cải thiện đáng kể: XRP đang giao dịch cao hơn các đường EMA 20, 50 và 100. Tuy nhiên, giá hiện đang đối mặt với một cụm kháng cự quan trọng quanh $1.41–$1.43. Bên mua cần một pha bứt phá rõ ràng lên trên vùng này để xác nhận thêm một đợt mở rộng tăng giá.
📈 Cấu trúc EMA
Đường EMA 20: $1.3503
Đường EMA 50: $1.2885
Đường EMA 100: $1.2586
Đường EMA 200: $1.3545
Hiện tại XRP đang giao dịch cao hơn tất cả bốn đường EMA chính, giúp cấu trúc phục hồi vẫn mang tính tích cực.
Triển vọng kỹ thuật XRP: XRP giữ gần $1.40 khi phe BULL bảo vệ đợt bứt phá
Hiện tại XRP đang giao dịch quanh $1.40, đang tích lũy sau một đợt phục hồi mạnh từ các đáy tháng 8 và một cú bứt phá mạnh khỏi cấu trúc giảm dần trước đó.
Cấu trúc tổng thể đã được cải thiện đáng kể: XRP đang giao dịch cao hơn các đường EMA 20, 50 và 100. Tuy nhiên, giá hiện đang đối mặt với một cụm kháng cự quan trọng quanh $1.41–$1.43. Bên mua cần một pha bứt phá rõ ràng lên trên vùng này để xác nhận thêm một đợt mở rộng tăng giá.
📈 Cấu trúc EMA
Đường EMA 20: $1.3503
Đường EMA 50: $1.2885
Đường EMA 100: $1.2586
Đường EMA 200: $1.3545
Hiện tại XRP đang giao dịch cao hơn tất cả bốn đường EMA chính, giúp cấu trúc phục hồi vẫn mang tính tích cực.
Cấu trúc tổng thể đã được cải thiện đáng kể: XRP đang giao dịch cao hơn các đường EMA 20, 50 và 100. Tuy nhiên, giá hiện đang đối mặt với một cụm kháng cự quan trọng quanh $1.41–$1.43. Bên mua cần một pha bứt phá rõ ràng lên trên vùng này để xác nhận thêm một đợt mở rộng tăng giá.
📈 Cấu trúc EMA
Đường EMA 20: $1.3503
Đường EMA 50: $1.2885
Đường EMA 100: $1.2586
Đường EMA 200: $1.3545
Hiện tại XRP đang giao dịch cao hơn tất cả bốn đường EMA chính, giúp cấu trúc phục hồi vẫn mang tính tích cực.
276
·
--
Bài viết
Xem bản dịch
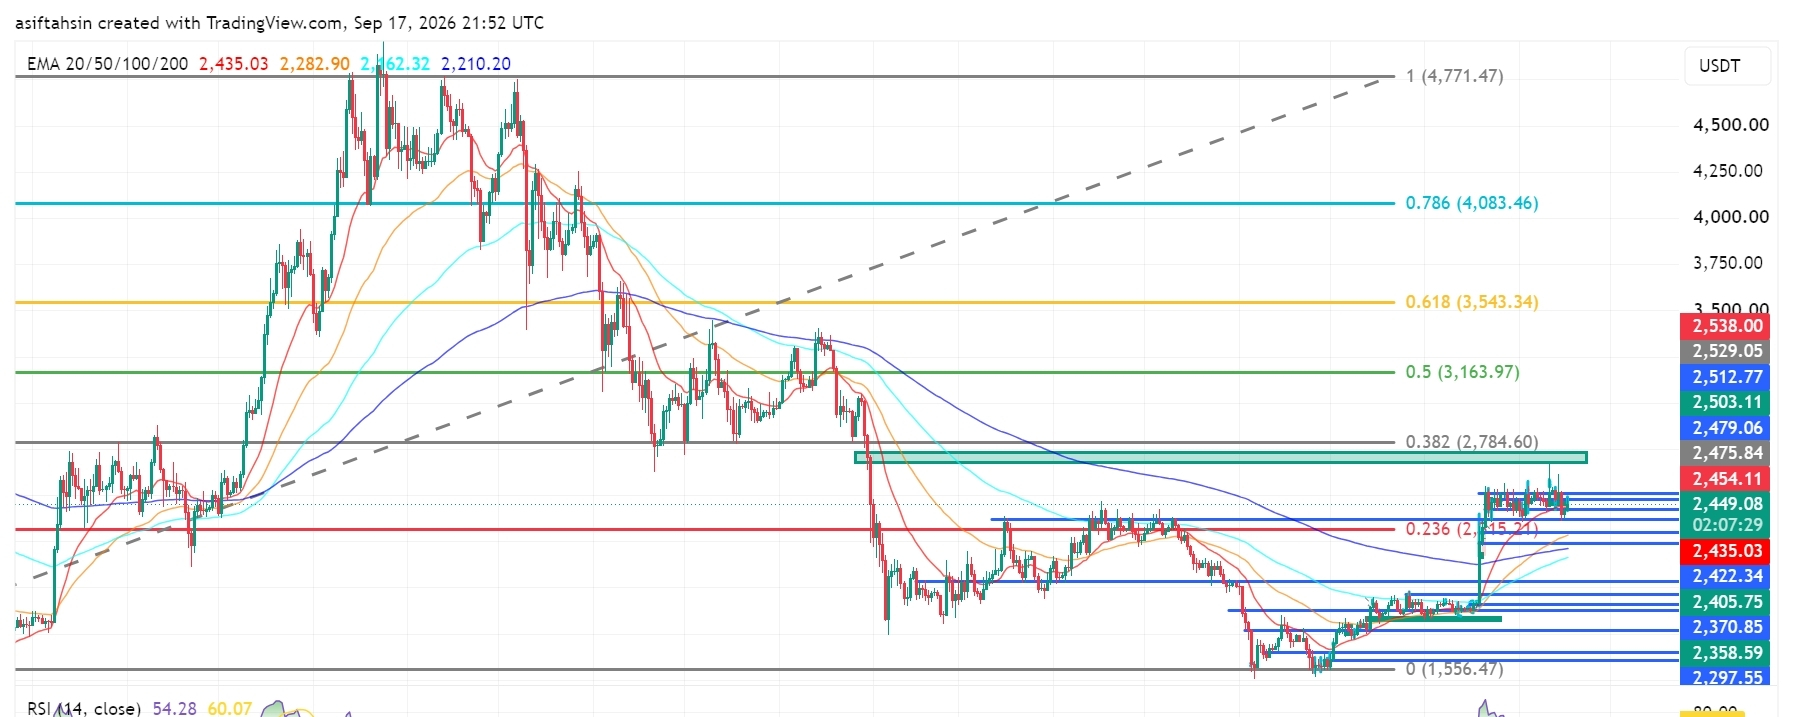
ETH Technical Outlook: Ethereum Holds Above $2.4K as Recovery Structure BuildsETH is currently trading around $2,450, holding above the $2,405–$2,435 support area after the recent recovery from the $2,300–$2,360 demand zone.
The broader structure is improving, but ETH is now consolidating below the $2,475–$2,538 resistance cluster. The next major chart area is around $2,784.60, which aligns with the 0.382 Fibonacci level.
📈 EMA Structure
20 EMA: $2,435.06
50 EMA: $2,282.92
100 EMA: $2,162.32
200 EMA: $2,210.20
ETH is currently trading above the 20 EMA at $2,435.06.
The recovery above the 50 EMA at $2,282.92, 100 EMA at $2,162.32, and 200 EMA at $2,210.20 keeps the broader recovery structure constructive.
A sustained hold above the 20 EMA would support short-term momentum, while losing the $2,210–$2,283 area would weaken the current structure.
📐 Fibonacci Levels
Key Fibonacci levels:
0.236: $2,315.21
0.382: $2,784.60
0.5: $3,163.97
0.618: $3,543.34
0.786: $4,083.46
1.0: $4,771.47
ETH is currently holding well above the 0.236 Fibonacci level at $2,315.21.
The next major Fibonacci resistance is $2,784.60 — 0.382 Fib.
A sustained move through the $2,475–$2,538 resistance structure could place the $2,784.60 region into focus.
🟢 Bullish Scenario
ETH is consolidating after the recent recovery and is currently holding above the $2,435 area.
Immediate resistance:
$2,454.11
$2,475.84
$2,479.06
$2,503.11
$2,512.77
$2,529.05
$2,538.00
$2,784.60 — 0.382 Fibonacci
A clean breakout and sustained close above the $2,529–$2,538 zone would provide stronger confirmation of continued recovery.
🎯 Target 1: $2,475.84
🎯 Target 2: $2,503.11
🎯 Target 3: $2,529.05
🎯 Target 4: $2,538.00
🎯 Target 5: $2,784.60 — 0.382 Fibonacci
🎯 Target 6: $3,163.97 — 0.5 Fibonacci
A confirmed move above $2,538 could strengthen the medium-term recovery structure and bring the $2,784–$3,164 region into focus.
🔴 Pullback Scenario
After the recent recovery, a retest of the breakout area would be normal.
Key supports:
$2,449.37
$2,435.06 — 20 EMA
$2,422.34
$2,405.75
$2,370.85
$2,358.59
$2,297.55
$2,282.92 — 50 EMA
$2,210.20 — 200 EMA
The $2,405–$2,435 zone is particularly important.
If ETH continues to hold this area during a pullback, the current recovery structure remains active.
A sustained loss of $2,282.92 would weaken the broader structure and could expose the $2,210–$2,162 area.
🧠 Market Structure & Liquidity
ETH has formed a clear recovery structure after sweeping liquidity around the $2,280–$2,360 region.
The recent move produced a strong recovery followed by a breakout above the previous consolidation area.
ETH is now moving through an important:
Recovery → Breakout → Retest → Consolidation
structure.
The major upside liquidity is concentrated around $2,475–$2,538. A decisive move through this zone would place $2,784.60 as the next major Fibonacci reference.
📊 RSI Momentum
RSI (14): 54.28
RSI remains above the neutral 50 level after the recent recovery.
The current reading shows moderately positive momentum, while the RSI signal line is around 60.07.
A sustained RSI move above 55–60 would indicate improving momentum toward the upper resistance area.
A move back below 50 would indicate increasing short-term momentum weakness.
🎯 Key Levels
🔴 Major Resistance: $2,454.11 → $2,475.84 → $2,503.11 → $2,529.05 → $2,538.00
🟢 Major Support: $2,435.06 → $2,422.34 → $2,405.75 → $2,370.85 → $2,358.59
📉 Dynamic EMA Support: $2,435.06 — 20 EMA | $2,282.92 — 50 EMA | $2,210.20 — 200 EMA | $2,162.32 — 100 EMA
🚀 Upside References: $2,538 → $2,784.60 → $3,163.97 → $3,543.34
📌 Final Outlook
ETH's broader structure remains constructive after the recent recovery, with price holding above the $2,405–$2,435 area.
The $2,405–$2,435 zone is now an important short-term support region. As long as ETH maintains this area, the current recovery structure remains active.
The immediate battle is around $2,475–$2,538. A confirmed move above $2,538 could open the path toward $2,784.60, followed by $3,163.97.
However, rejection from resistance followed by a sustained loss of $2,282.92 would weaken the broader structure and increase the possibility of a deeper retracement toward the $2,210–$2,162 area.
Bias: 🟢 Recovery structure intact above $2,282.92. A breakout above $2,538 could open the path toward $2,784.60, with $3,163.97 as the next major Fibonacci reference.
$ETH
{future}(ETHUSDT)
ETH Technical Outlook: Ethereum Holds Above $2.4K as Recovery Structure Builds
ETH is currently trading around $2,450, holding above the $2,405–$2,435 support area after the recent recovery from the $2,300–$2,360 demand zone.
The broader structure is improving, but ETH is now consolidating below the $2,475–$2,538 resistance cluster. The next major chart area is around $2,784.60, which aligns with the 0.382 Fibonacci level.
📈 EMA Structure
20 EMA: $2,435.06
50 EMA: $2,282.92
100 EMA: $2,162.32
200 EMA: $2,210.20
ETH is currently trading above the 20 EMA at $2,435.06.
The recovery above the 50 EMA at $2,282.92, 100 EMA at $2,162.32, and 200 EMA at $2,210.20 keeps the broader recovery structure constructive.
A sustained hold above the 20 EMA would support short-term momentum, while losing the $2,210–$2,283 area would weaken the current structure.
📐 Fibonacci Levels
Key Fibonacci levels:
0.236: $2,315.21
0.382: $2,784.60
0.5: $3,163.97
0.618: $3,543.34
0.786: $4,083.46
1.0: $4,771.47
ETH is currently holding well above the 0.236 Fibonacci level at $2,315.21.
The next major Fibonacci resistance is $2,784.60 — 0.382 Fib.
A sustained move through the $2,475–$2,538 resistance structure could place the $2,784.60 region into focus.
🟢 Bullish Scenario
ETH is consolidating after the recent recovery and is currently holding above the $2,435 area.
Immediate resistance:
$2,454.11
$2,475.84
$2,479.06
$2,503.11
$2,512.77
$2,529.05
$2,538.00
$2,784.60 — 0.382 Fibonacci
A clean breakout and sustained close above the $2,529–$2,538 zone would provide stronger confirmation of continued recovery.
🎯 Target 1: $2,475.84
🎯 Target 2: $2,503.11
🎯 Target 3: $2,529.05
🎯 Target 4: $2,538.00
🎯 Target 5: $2,784.60 — 0.382 Fibonacci
🎯 Target 6: $3,163.97 — 0.5 Fibonacci
A confirmed move above $2,538 could strengthen the medium-term recovery structure and bring the $2,784–$3,164 region into focus.
🔴 Pullback Scenario
After the recent recovery, a retest of the breakout area would be normal.
Key supports:
$2,449.37
$2,435.06 — 20 EMA
$2,422.34
$2,405.75
$2,370.85
$2,358.59
$2,297.55
$2,282.92 — 50 EMA
$2,210.20 — 200 EMA
The $2,405–$2,435 zone is particularly important.
If ETH continues to hold this area during a pullback, the current recovery structure remains active.
A sustained loss of $2,282.92 would weaken the broader structure and could expose the $2,210–$2,162 area.
🧠 Market Structure & Liquidity
ETH has formed a clear recovery structure after sweeping liquidity around the $2,280–$2,360 region.
The recent move produced a strong recovery followed by a breakout above the previous consolidation area.
ETH is now moving through an important:
Recovery → Breakout → Retest → Consolidation
structure.
The major upside liquidity is concentrated around $2,475–$2,538. A decisive move through this zone would place $2,784.60 as the next major Fibonacci reference.
📊 RSI Momentum
RSI (14): 54.28
RSI remains above the neutral 50 level after the recent recovery.
The current reading shows moderately positive momentum, while the RSI signal line is around 60.07.
A sustained RSI move above 55–60 would indicate improving momentum toward the upper resistance area.
A move back below 50 would indicate increasing short-term momentum weakness.
🎯 Key Levels
🔴 Major Resistance: $2,454.11 → $2,475.84 → $2,503.11 → $2,529.05 → $2,538.00
🟢 Major Support: $2,435.06 → $2,422.34 → $2,405.75 → $2,370.85 → $2,358.59
📉 Dynamic EMA Support: $2,435.06 — 20 EMA | $2,282.92 — 50 EMA | $2,210.20 — 200 EMA | $2,162.32 — 100 EMA
🚀 Upside References: $2,538 → $2,784.60 → $3,163.97 → $3,543.34
📌 Final Outlook
ETH's broader structure remains constructive after the recent recovery, with price holding above the $2,405–$2,435 area.
The $2,405–$2,435 zone is now an important short-term support region. As long as ETH maintains this area, the current recovery structure remains active.
The immediate battle is around $2,475–$2,538. A confirmed move above $2,538 could open the path toward $2,784.60, followed by $3,163.97.
However, rejection from resistance followed by a sustained loss of $2,282.92 would weaken the broader structure and increase the possibility of a deeper retracement toward the $2,210–$2,162 area.
Bias: 🟢 Recovery structure intact above $2,282.92. A breakout above $2,538 could open the path toward $2,784.60, with $3,163.97 as the next major Fibonacci reference.
$ETH
The broader structure is improving, but ETH is now consolidating below the $2,475–$2,538 resistance cluster. The next major chart area is around $2,784.60, which aligns with the 0.382 Fibonacci level.
📈 EMA Structure
20 EMA: $2,435.06
50 EMA: $2,282.92
100 EMA: $2,162.32
200 EMA: $2,210.20
ETH is currently trading above the 20 EMA at $2,435.06.
The recovery above the 50 EMA at $2,282.92, 100 EMA at $2,162.32, and 200 EMA at $2,210.20 keeps the broader recovery structure constructive.
A sustained hold above the 20 EMA would support short-term momentum, while losing the $2,210–$2,283 area would weaken the current structure.
📐 Fibonacci Levels
Key Fibonacci levels:
0.236: $2,315.21
0.382: $2,784.60
0.5: $3,163.97
0.618: $3,543.34
0.786: $4,083.46
1.0: $4,771.47
ETH is currently holding well above the 0.236 Fibonacci level at $2,315.21.
The next major Fibonacci resistance is $2,784.60 — 0.382 Fib.
A sustained move through the $2,475–$2,538 resistance structure could place the $2,784.60 region into focus.
🟢 Bullish Scenario
ETH is consolidating after the recent recovery and is currently holding above the $2,435 area.
Immediate resistance:
$2,454.11
$2,475.84
$2,479.06
$2,503.11
$2,512.77
$2,529.05
$2,538.00
$2,784.60 — 0.382 Fibonacci
A clean breakout and sustained close above the $2,529–$2,538 zone would provide stronger confirmation of continued recovery.
🎯 Target 1: $2,475.84
🎯 Target 2: $2,503.11
🎯 Target 3: $2,529.05
🎯 Target 4: $2,538.00
🎯 Target 5: $2,784.60 — 0.382 Fibonacci
🎯 Target 6: $3,163.97 — 0.5 Fibonacci
A confirmed move above $2,538 could strengthen the medium-term recovery structure and bring the $2,784–$3,164 region into focus.
🔴 Pullback Scenario
After the recent recovery, a retest of the breakout area would be normal.
Key supports:
$2,449.37
$2,435.06 — 20 EMA
$2,422.34
$2,405.75
$2,370.85
$2,358.59
$2,297.55
$2,282.92 — 50 EMA
$2,210.20 — 200 EMA
The $2,405–$2,435 zone is particularly important.
If ETH continues to hold this area during a pullback, the current recovery structure remains active.
A sustained loss of $2,282.92 would weaken the broader structure and could expose the $2,210–$2,162 area.
🧠 Market Structure & Liquidity
ETH has formed a clear recovery structure after sweeping liquidity around the $2,280–$2,360 region.
The recent move produced a strong recovery followed by a breakout above the previous consolidation area.
ETH is now moving through an important:
Recovery → Breakout → Retest → Consolidation
structure.
The major upside liquidity is concentrated around $2,475–$2,538. A decisive move through this zone would place $2,784.60 as the next major Fibonacci reference.
📊 RSI Momentum
RSI (14): 54.28
RSI remains above the neutral 50 level after the recent recovery.
The current reading shows moderately positive momentum, while the RSI signal line is around 60.07.
A sustained RSI move above 55–60 would indicate improving momentum toward the upper resistance area.
A move back below 50 would indicate increasing short-term momentum weakness.
🎯 Key Levels
🔴 Major Resistance: $2,454.11 → $2,475.84 → $2,503.11 → $2,529.05 → $2,538.00
🟢 Major Support: $2,435.06 → $2,422.34 → $2,405.75 → $2,370.85 → $2,358.59
📉 Dynamic EMA Support: $2,435.06 — 20 EMA | $2,282.92 — 50 EMA | $2,210.20 — 200 EMA | $2,162.32 — 100 EMA
🚀 Upside References: $2,538 → $2,784.60 → $3,163.97 → $3,543.34
📌 Final Outlook
ETH's broader structure remains constructive after the recent recovery, with price holding above the $2,405–$2,435 area.
The $2,405–$2,435 zone is now an important short-term support region. As long as ETH maintains this area, the current recovery structure remains active.
The immediate battle is around $2,475–$2,538. A confirmed move above $2,538 could open the path toward $2,784.60, followed by $3,163.97.
However, rejection from resistance followed by a sustained loss of $2,282.92 would weaken the broader structure and increase the possibility of a deeper retracement toward the $2,210–$2,162 area.
Bias: 🟢 Recovery structure intact above $2,282.92. A breakout above $2,538 could open the path toward $2,784.60, with $3,163.97 as the next major Fibonacci reference.
$ETH
75
·
--
Bài viết
Xem bản dịch
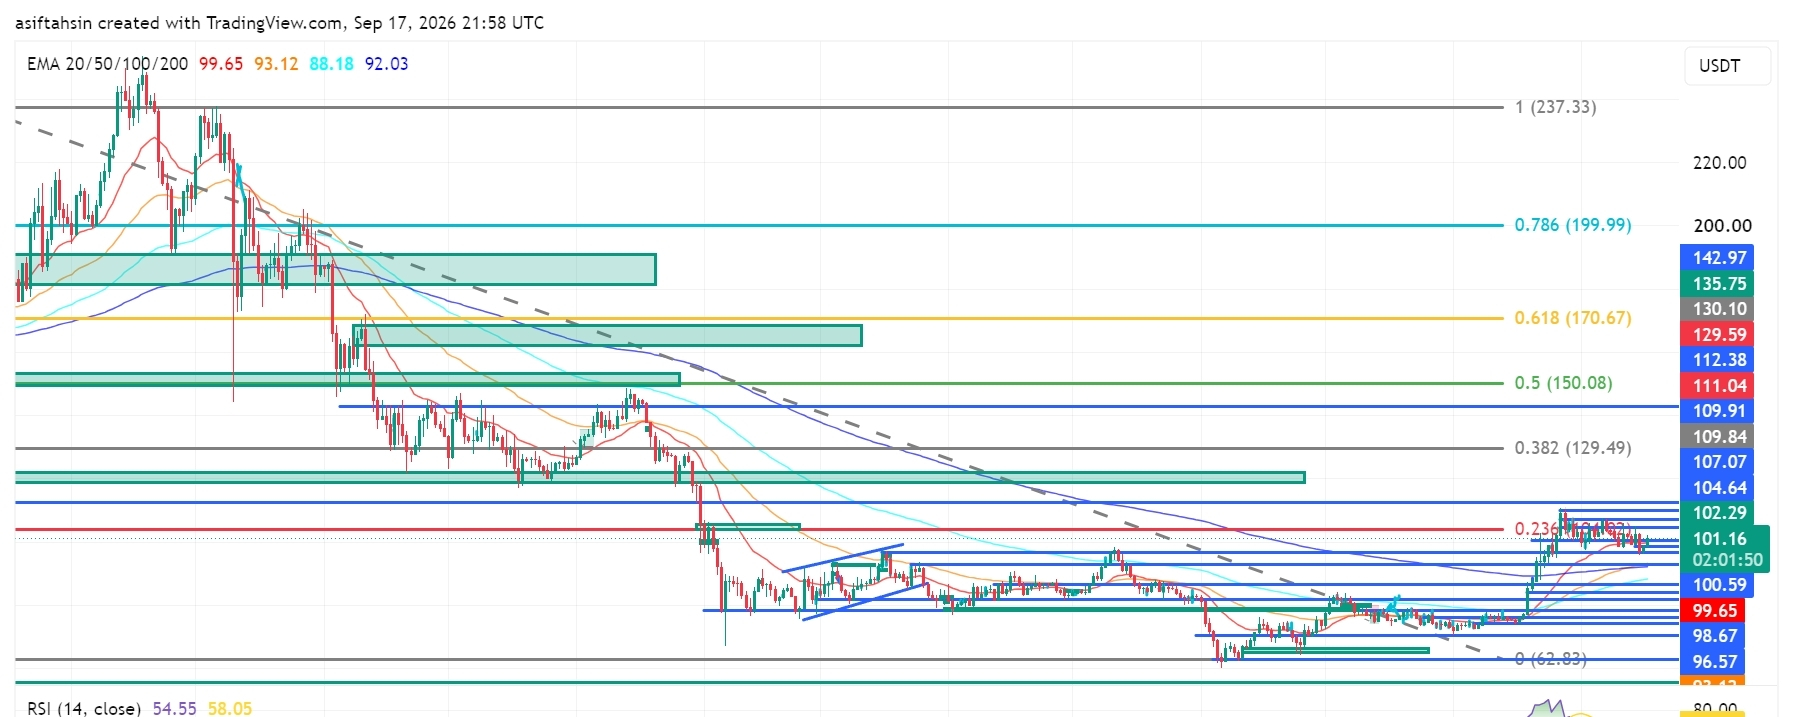
SOL Technical Outlook: Solana Holds Above $100 as Bulls Defend the RecoverySOL is currently trading around $101.16, holding above the $99–$100 breakout zone after the recent bullish expansion from the $92–$94 demand area.
The broader recovery structure remains constructive, but SOL is now consolidating below the $102.29–$107.07 resistance cluster. Bulls need to reclaim this area and break the $109.91–$112.38 zone for the next major upside expansion.
📈 EMA Structure
- 20 EMA: $99.65
- 50 EMA: $93.12
- 100 EMA: $88.18
- 200 EMA: $92.03
SOL is currently trading above the 20 EMA at $99.65.
The recovery above the 50 EMA at $93.12 and 200 EMA at $92.03 keeps the broader recovery structure intact.
A sustained hold above the 20 EMA would support short-term momentum, while losing the $93.12–$92.03 area would weaken the current structure.
📐 Fibonacci Levels
Key Fibonacci levels:
- 0.236: $104.64
- 0.382: $129.49
- 0.5: $150.08
- 0.618: $170.67
- 0.786: $199.99
- 1.0: $237.33
SOL is currently trading below the 0.236 Fibonacci level at $104.64.
The next major Fibonacci resistance is $129.49 — 0.382 Fib.
A sustained breakout through the $104–$112 resistance structure could open the path toward the $129.49 region.
🟢 Bullish Scenario
SOL is consolidating after the recent recovery and is currently maintaining acceptance above the $100 area.
Immediate resistance:
- $102.29
- $104.64 — 0.236 Fibonacci
- $107.07
- $109.84
- $109.91
- $111.04
- $112.38
A clean breakout and sustained close above $111.04–$112.38 would provide stronger confirmation of bullish continuation.
🎯 Target 1: $104.64
🎯 Target 2: $107.07
🎯 Target 3: $109.91
🎯 Target 4: $112.38
🎯 Target 5: $129.49 — 0.382 Fibonacci
🎯 Target 6: $150.08 — 0.5 Fibonacci
A confirmed breakout above the $111–$112 zone could strengthen the medium-term recovery structure and potentially accelerate SOL toward the $129–$150 region.
🔴 Pullback Scenario
After the recent bullish expansion, a retest of the breakout area would be normal.
Key supports:
- $100.59
- $99.65 — 20 EMA
- $98.67
- $96.57
- $93.12 — 50 EMA
- $92.94
- $92.03 — 200 EMA
- $88.18 — 100 EMA
The $96–$100 zone is particularly important.
If SOL continues to hold this area during a pullback, the current recovery structure remains active.
A sustained loss of $92.03 would weaken the current structure and could expose the $88.18 support zone.
🧠 Market Structure & Liquidity
SOL has formed a clear recovery structure after sweeping liquidity around the $92–$94 demand region.
The recent move produced a market-structure shift followed by a breakout and higher-low formation.
SOL is now moving through an important:
Breakout → Retest → Consolidation → Continuation
structure.
The major upside liquidity is concentrated around $102–$112. A decisive breakout above this zone would place $129.49 as the next major Fibonacci reference.
📊 RSI Momentum
RSI (14): 54.55
RSI remains above the neutral 50 level after cooling from the recent bullish expansion.
The current reading shows moderately positive momentum without reaching an extreme zone.
A sustained RSI move above 55–60 would indicate improving momentum toward the upper resistance area.
A move back below 50 would indicate increasing short-term momentum weakness.
🎯 Key Levels
🔴 Major Resistance: $102.29 → $104.64 → $107.07 → $109.91 → $111.04 → $112.38
🟢 Major Support: $100.59 → $99.65 → $98.67 → $96.57 → $93.12 → $92.03
📉 Dynamic EMA Support: $99.65 — 20 EMA | $93.12 — 50 EMA | $92.03 — 200 EMA | $88.18 — 100 EMA
🚀 Upside Targets: $112.38 → $129.49 → $150.08 → $170.67
📌 Final Outlook
SOL's broader structure remains constructive after the recent breakout, with price holding above the $99–$100 region.
The $96–$100 area is now an important short-term support region. As long as SOL maintains this area, the current recovery structure remains active.
The immediate battle is around $102–$112. A confirmed breakout above $112.38 could open the path toward $129.49, followed by $150.08 and potentially $170.67.
However, rejection from resistance followed by a sustained loss of $92.03 would weaken the current structure and increase the possibility of a deeper retracement toward the $88.18 area.
Bias: 🟢 Recovery structure intact above $92.03. A breakout above $112.38 could open the path toward $129.49, with $150.08 as the next major Fibonacci target.
$SOL
{future}(SOLUSDT)
SOL Technical Outlook: Solana Holds Above $100 as Bulls Defend the Recovery
SOL is currently trading around $101.16, holding above the $99–$100 breakout zone after the recent bullish expansion from the $92–$94 demand area.
The broader recovery structure remains constructive, but SOL is now consolidating below the $102.29–$107.07 resistance cluster. Bulls need to reclaim this area and break the $109.91–$112.38 zone for the next major upside expansion.
📈 EMA Structure
- 20 EMA: $99.65
- 50 EMA: $93.12
- 100 EMA: $88.18
- 200 EMA: $92.03
SOL is currently trading above the 20 EMA at $99.65.
The recovery above the 50 EMA at $93.12 and 200 EMA at $92.03 keeps the broader recovery structure intact.
A sustained hold above the 20 EMA would support short-term momentum, while losing the $93.12–$92.03 area would weaken the current structure.
📐 Fibonacci Levels
Key Fibonacci levels:
- 0.236: $104.64
- 0.382: $129.49
- 0.5: $150.08
- 0.618: $170.67
- 0.786: $199.99
- 1.0: $237.33
SOL is currently trading below the 0.236 Fibonacci level at $104.64.
The next major Fibonacci resistance is $129.49 — 0.382 Fib.
A sustained breakout through the $104–$112 resistance structure could open the path toward the $129.49 region.
🟢 Bullish Scenario
SOL is consolidating after the recent recovery and is currently maintaining acceptance above the $100 area.
Immediate resistance:
- $102.29
- $104.64 — 0.236 Fibonacci
- $107.07
- $109.84
- $109.91
- $111.04
- $112.38
A clean breakout and sustained close above $111.04–$112.38 would provide stronger confirmation of bullish continuation.
🎯 Target 1: $104.64
🎯 Target 2: $107.07
🎯 Target 3: $109.91
🎯 Target 4: $112.38
🎯 Target 5: $129.49 — 0.382 Fibonacci
🎯 Target 6: $150.08 — 0.5 Fibonacci
A confirmed breakout above the $111–$112 zone could strengthen the medium-term recovery structure and potentially accelerate SOL toward the $129–$150 region.
🔴 Pullback Scenario
After the recent bullish expansion, a retest of the breakout area would be normal.
Key supports:
- $100.59
- $99.65 — 20 EMA
- $98.67
- $96.57
- $93.12 — 50 EMA
- $92.94
- $92.03 — 200 EMA
- $88.18 — 100 EMA
The $96–$100 zone is particularly important.
If SOL continues to hold this area during a pullback, the current recovery structure remains active.
A sustained loss of $92.03 would weaken the current structure and could expose the $88.18 support zone.
🧠 Market Structure & Liquidity
SOL has formed a clear recovery structure after sweeping liquidity around the $92–$94 demand region.
The recent move produced a market-structure shift followed by a breakout and higher-low formation.
SOL is now moving through an important:
Breakout → Retest → Consolidation → Continuation
structure.
The major upside liquidity is concentrated around $102–$112. A decisive breakout above this zone would place $129.49 as the next major Fibonacci reference.
📊 RSI Momentum
RSI (14): 54.55
RSI remains above the neutral 50 level after cooling from the recent bullish expansion.
The current reading shows moderately positive momentum without reaching an extreme zone.
A sustained RSI move above 55–60 would indicate improving momentum toward the upper resistance area.
A move back below 50 would indicate increasing short-term momentum weakness.
🎯 Key Levels
🔴 Major Resistance: $102.29 → $104.64 → $107.07 → $109.91 → $111.04 → $112.38
🟢 Major Support: $100.59 → $99.65 → $98.67 → $96.57 → $93.12 → $92.03
📉 Dynamic EMA Support: $99.65 — 20 EMA | $93.12 — 50 EMA | $92.03 — 200 EMA | $88.18 — 100 EMA
🚀 Upside Targets: $112.38 → $129.49 → $150.08 → $170.67
📌 Final Outlook
SOL's broader structure remains constructive after the recent breakout, with price holding above the $99–$100 region.
The $96–$100 area is now an important short-term support region. As long as SOL maintains this area, the current recovery structure remains active.
The immediate battle is around $102–$112. A confirmed breakout above $112.38 could open the path toward $129.49, followed by $150.08 and potentially $170.67.
However, rejection from resistance followed by a sustained loss of $92.03 would weaken the current structure and increase the possibility of a deeper retracement toward the $88.18 area.
Bias: 🟢 Recovery structure intact above $92.03. A breakout above $112.38 could open the path toward $129.49, with $150.08 as the next major Fibonacci target.
$SOL
The broader recovery structure remains constructive, but SOL is now consolidating below the $102.29–$107.07 resistance cluster. Bulls need to reclaim this area and break the $109.91–$112.38 zone for the next major upside expansion.
📈 EMA Structure
- 20 EMA: $99.65
- 50 EMA: $93.12
- 100 EMA: $88.18
- 200 EMA: $92.03
SOL is currently trading above the 20 EMA at $99.65.
The recovery above the 50 EMA at $93.12 and 200 EMA at $92.03 keeps the broader recovery structure intact.
A sustained hold above the 20 EMA would support short-term momentum, while losing the $93.12–$92.03 area would weaken the current structure.
📐 Fibonacci Levels
Key Fibonacci levels:
- 0.236: $104.64
- 0.382: $129.49
- 0.5: $150.08
- 0.618: $170.67
- 0.786: $199.99
- 1.0: $237.33
SOL is currently trading below the 0.236 Fibonacci level at $104.64.
The next major Fibonacci resistance is $129.49 — 0.382 Fib.
A sustained breakout through the $104–$112 resistance structure could open the path toward the $129.49 region.
🟢 Bullish Scenario
SOL is consolidating after the recent recovery and is currently maintaining acceptance above the $100 area.
Immediate resistance:
- $102.29
- $104.64 — 0.236 Fibonacci
- $107.07
- $109.84
- $109.91
- $111.04
- $112.38
A clean breakout and sustained close above $111.04–$112.38 would provide stronger confirmation of bullish continuation.
🎯 Target 1: $104.64
🎯 Target 2: $107.07
🎯 Target 3: $109.91
🎯 Target 4: $112.38
🎯 Target 5: $129.49 — 0.382 Fibonacci
🎯 Target 6: $150.08 — 0.5 Fibonacci
A confirmed breakout above the $111–$112 zone could strengthen the medium-term recovery structure and potentially accelerate SOL toward the $129–$150 region.
🔴 Pullback Scenario
After the recent bullish expansion, a retest of the breakout area would be normal.
Key supports:
- $100.59
- $99.65 — 20 EMA
- $98.67
- $96.57
- $93.12 — 50 EMA
- $92.94
- $92.03 — 200 EMA
- $88.18 — 100 EMA
The $96–$100 zone is particularly important.
If SOL continues to hold this area during a pullback, the current recovery structure remains active.
A sustained loss of $92.03 would weaken the current structure and could expose the $88.18 support zone.
🧠 Market Structure & Liquidity
SOL has formed a clear recovery structure after sweeping liquidity around the $92–$94 demand region.
The recent move produced a market-structure shift followed by a breakout and higher-low formation.
SOL is now moving through an important:
Breakout → Retest → Consolidation → Continuation
structure.
The major upside liquidity is concentrated around $102–$112. A decisive breakout above this zone would place $129.49 as the next major Fibonacci reference.
📊 RSI Momentum
RSI (14): 54.55
RSI remains above the neutral 50 level after cooling from the recent bullish expansion.
The current reading shows moderately positive momentum without reaching an extreme zone.
A sustained RSI move above 55–60 would indicate improving momentum toward the upper resistance area.
A move back below 50 would indicate increasing short-term momentum weakness.
🎯 Key Levels
🔴 Major Resistance: $102.29 → $104.64 → $107.07 → $109.91 → $111.04 → $112.38
🟢 Major Support: $100.59 → $99.65 → $98.67 → $96.57 → $93.12 → $92.03
📉 Dynamic EMA Support: $99.65 — 20 EMA | $93.12 — 50 EMA | $92.03 — 200 EMA | $88.18 — 100 EMA
🚀 Upside Targets: $112.38 → $129.49 → $150.08 → $170.67
📌 Final Outlook
SOL's broader structure remains constructive after the recent breakout, with price holding above the $99–$100 region.
The $96–$100 area is now an important short-term support region. As long as SOL maintains this area, the current recovery structure remains active.
The immediate battle is around $102–$112. A confirmed breakout above $112.38 could open the path toward $129.49, followed by $150.08 and potentially $170.67.
However, rejection from resistance followed by a sustained loss of $92.03 would weaken the current structure and increase the possibility of a deeper retracement toward the $88.18 area.
Bias: 🟢 Recovery structure intact above $92.03. A breakout above $112.38 could open the path toward $129.49, with $150.08 as the next major Fibonacci target.
$SOL
73
·
--
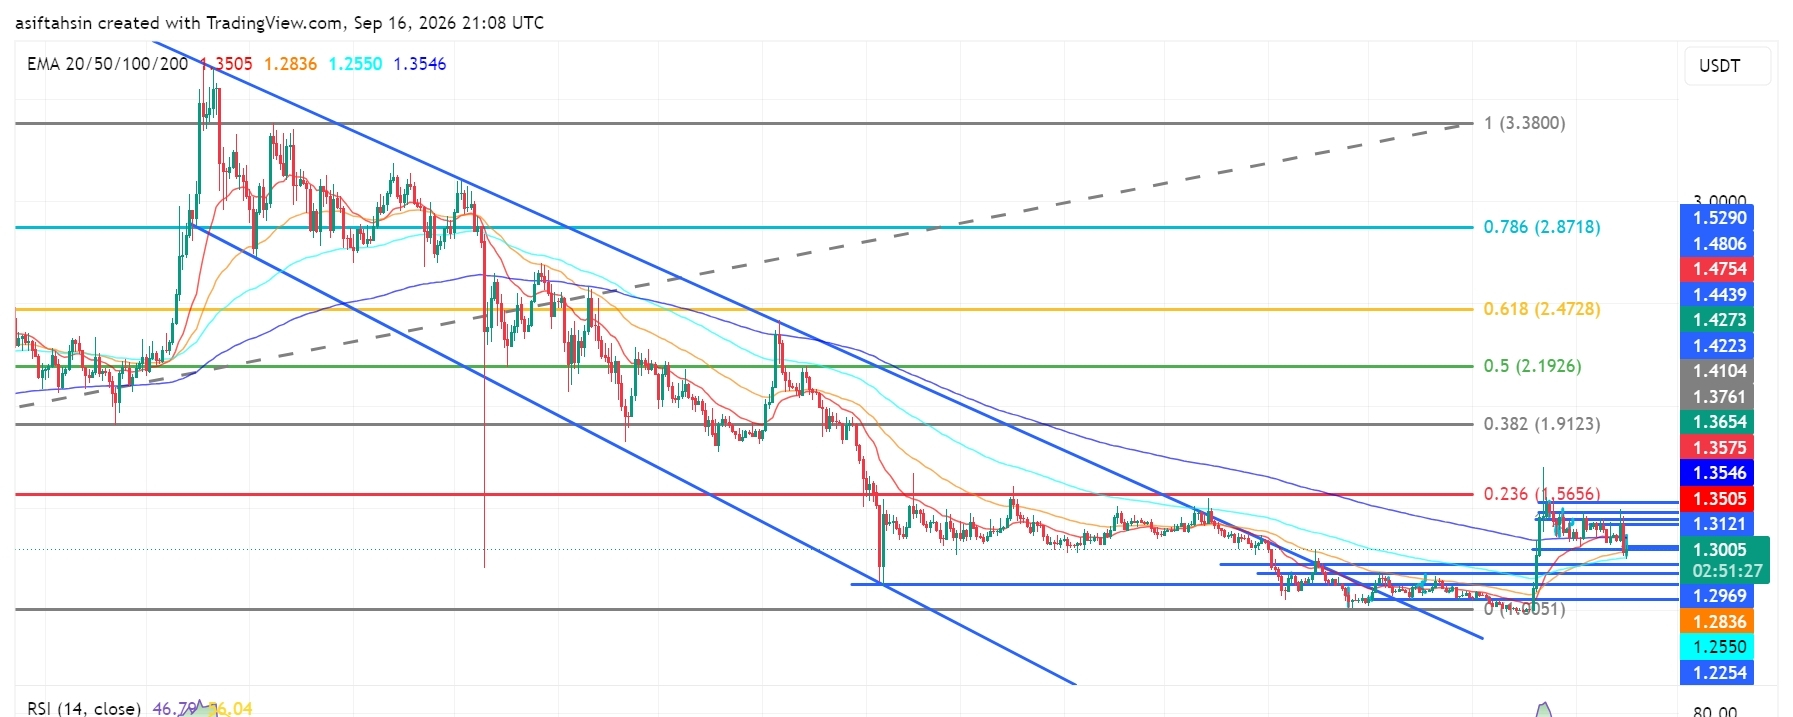
Bài viết
Triển vọng kỹ thuật XRP: XRP tích lũy gần $1.30 sau cú sụt mạnhXRP đang giao dịch quanh $1.30 trên biểu đồ sau một cú từ chối mạnh khỏi vùng $1.35–$1.43. Giá đã quay trở lại gần khu vực phá vỡ, trong khi toàn bộ biểu đồ vẫn trong giai đoạn phục hồi từ vùng $1.20–$1.25. Động lượng hiện tại ở trạng thái trung tính, với RSI dưới 50.
📈 Cấu trúc EMA
20 EMA: $1.3505
50 EMA: $1.2836
100 EMA: $1.2550
200 EMA: $1.3546
XRP hiện đang nằm dưới đường EMA 20 và EMA 200, trong khi các đường EMA 50 và 100 vẫn thấp hơn so với giá. Việc giành lại vùng $1.35 sẽ giúp cải thiện cấu trúc ngắn hạn.
Triển vọng kỹ thuật XRP: XRP tích lũy gần $1.30 sau cú sụt mạnh
XRP đang giao dịch quanh $1.30 trên biểu đồ sau một cú từ chối mạnh khỏi vùng $1.35–$1.43. Giá đã quay trở lại gần khu vực phá vỡ, trong khi toàn bộ biểu đồ vẫn trong giai đoạn phục hồi từ vùng $1.20–$1.25. Động lượng hiện tại ở trạng thái trung tính, với RSI dưới 50.
📈 Cấu trúc EMA
20 EMA: $1.3505
50 EMA: $1.2836
100 EMA: $1.2550
200 EMA: $1.3546
XRP hiện đang nằm dưới đường EMA 20 và EMA 200, trong khi các đường EMA 50 và 100 vẫn thấp hơn so với giá. Việc giành lại vùng $1.35 sẽ giúp cải thiện cấu trúc ngắn hạn.
📈 Cấu trúc EMA
20 EMA: $1.3505
50 EMA: $1.2836
100 EMA: $1.2550
200 EMA: $1.3546
XRP hiện đang nằm dưới đường EMA 20 và EMA 200, trong khi các đường EMA 50 và 100 vẫn thấp hơn so với giá. Việc giành lại vùng $1.35 sẽ giúp cải thiện cấu trúc ngắn hạn.
1
3
787
·
--
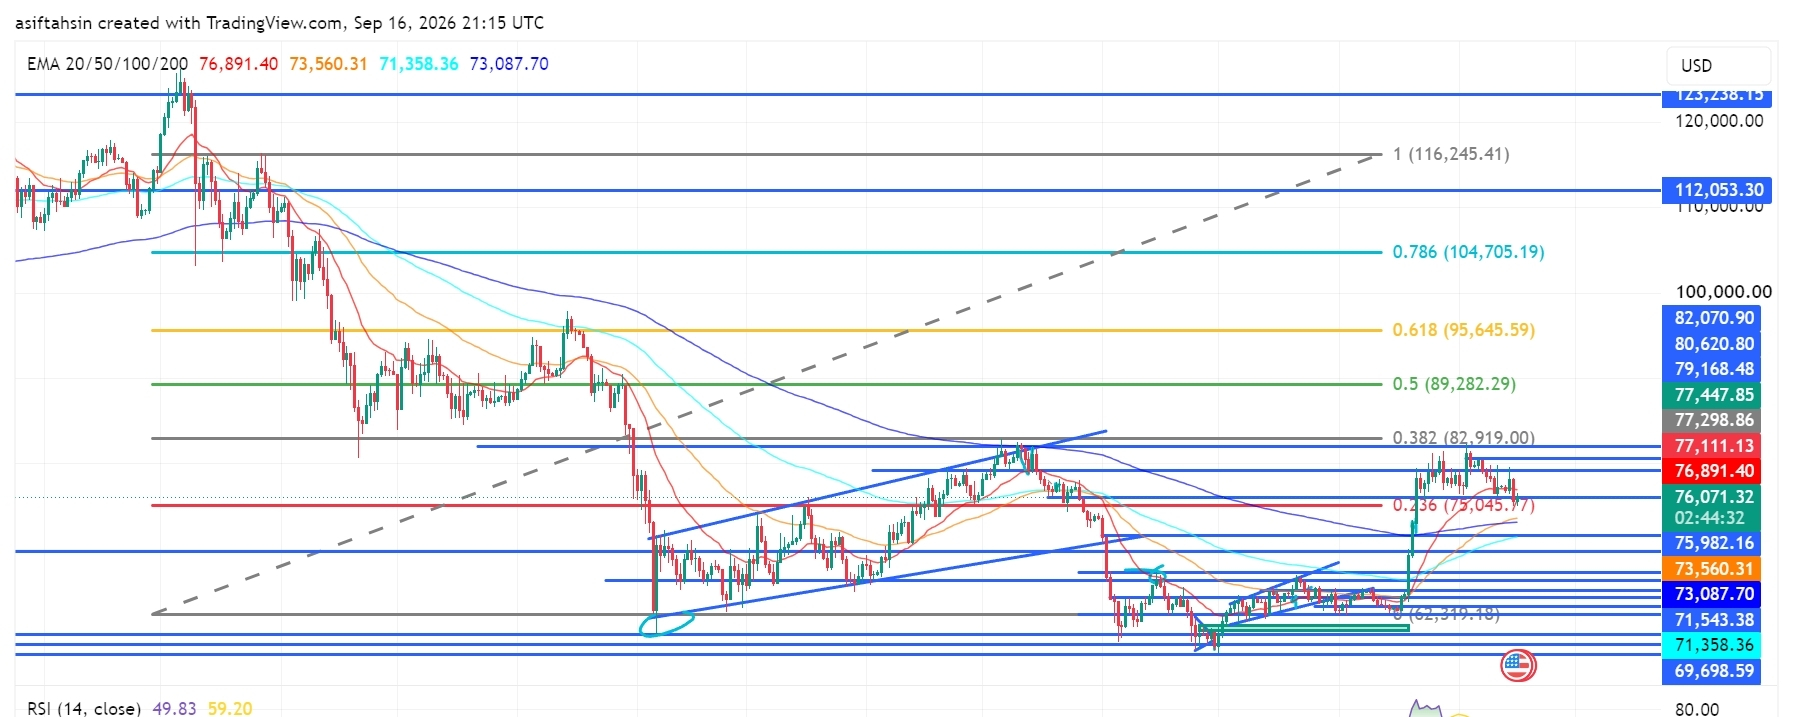
Bài viết
Triển vọng kỹ thuật BTC: Bitcoin Tích lũy Dưới $77K khi Bò Bảo vệ Đà Phục hồiBitcoin đang giao dịch quanh $76.9K, đang tích lũy sau đợt phục hồi gần đây từ vùng nhu cầu $69K–$71K. Giá vẫn nằm trên vùng hỗ trợ quan trọng $75K, nhưng đà tăng đã chậm lại khi BTC gặp khó khăn dưới vùng kháng cự $77.1K–$82.9K. Đợt bứt phá hoặc phá vỡ tiếp theo sẽ quyết định hướng đi trong ngắn hạn.
📈 Cấu trúc EMA
20 EMA: $76,891
50 EMA: $73,560
100 EMA: $71,358
200 EMA: $73,088
BTC hiện đang nằm quanh đường EMA 20, trong khi các đường EMA 50/100/200 vẫn thấp hơn giá. Việc giữ vững trên $75K giúp duy trì cấu trúc phục hồi tổng thể, nhưng nếu mất đường EMA 20 có thể dẫn đến một lần kiểm tra sâu hơn.
Triển vọng kỹ thuật BTC: Bitcoin Tích lũy Dưới $77K khi Bò Bảo vệ Đà Phục hồi
Bitcoin đang giao dịch quanh $76.9K, đang tích lũy sau đợt phục hồi gần đây từ vùng nhu cầu $69K–$71K. Giá vẫn nằm trên vùng hỗ trợ quan trọng $75K, nhưng đà tăng đã chậm lại khi BTC gặp khó khăn dưới vùng kháng cự $77.1K–$82.9K. Đợt bứt phá hoặc phá vỡ tiếp theo sẽ quyết định hướng đi trong ngắn hạn.
📈 Cấu trúc EMA
20 EMA: $76,891
50 EMA: $73,560
100 EMA: $71,358
200 EMA: $73,088
BTC hiện đang nằm quanh đường EMA 20, trong khi các đường EMA 50/100/200 vẫn thấp hơn giá. Việc giữ vững trên $75K giúp duy trì cấu trúc phục hồi tổng thể, nhưng nếu mất đường EMA 20 có thể dẫn đến một lần kiểm tra sâu hơn.
📈 Cấu trúc EMA
20 EMA: $76,891
50 EMA: $73,560
100 EMA: $71,358
200 EMA: $73,088
BTC hiện đang nằm quanh đường EMA 20, trong khi các đường EMA 50/100/200 vẫn thấp hơn giá. Việc giữ vững trên $75K giúp duy trì cấu trúc phục hồi tổng thể, nhưng nếu mất đường EMA 20 có thể dẫn đến một lần kiểm tra sâu hơn.
61
·
--
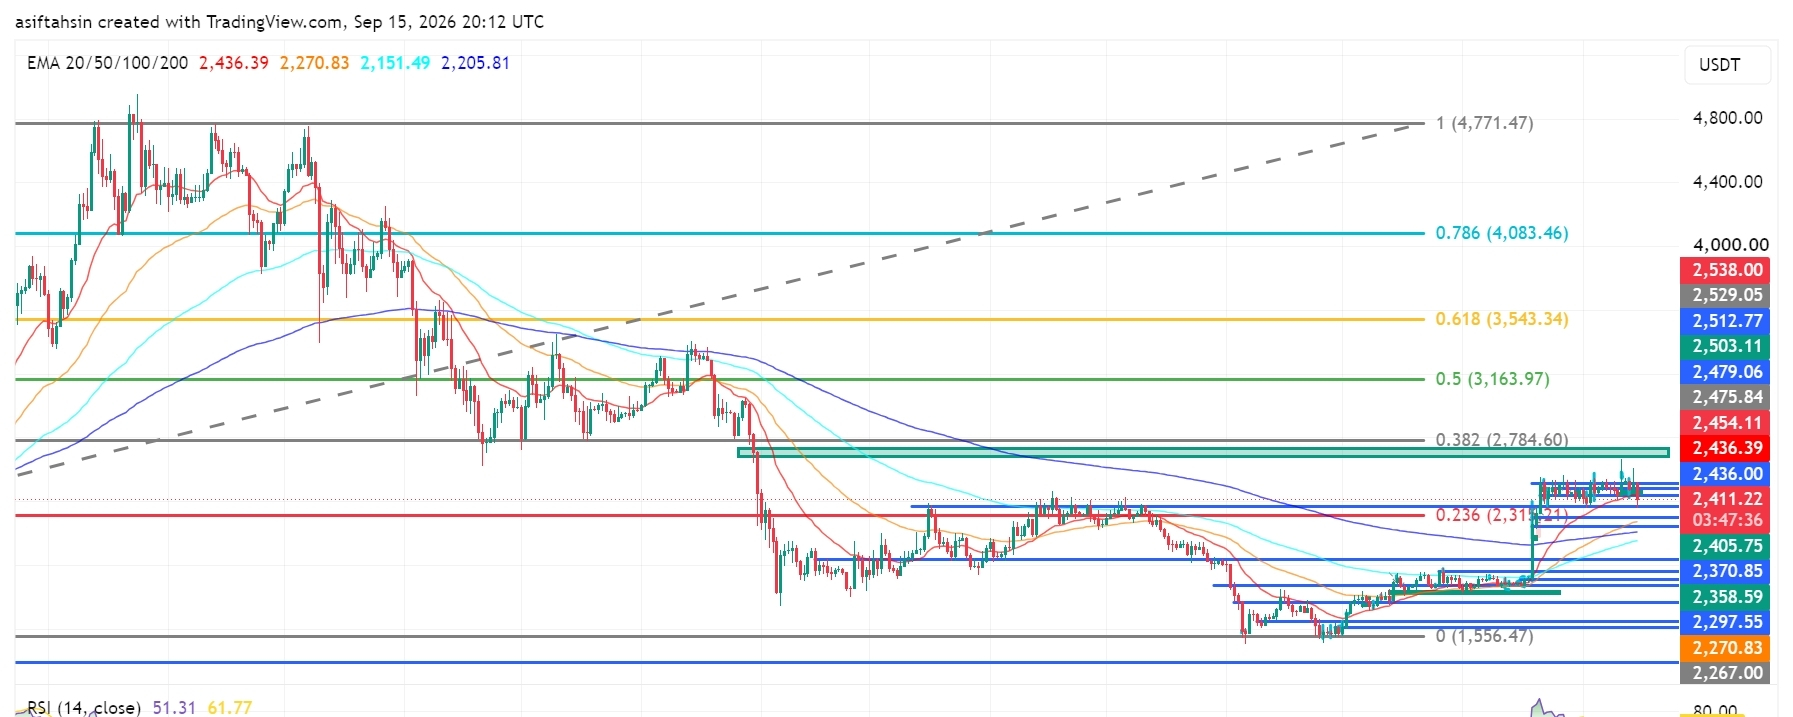
Bài viết
SOL Triển vọng Kỹ thuật: Solana Giữ Gần $100 Khi Bên Mua Bảo Vệ Vùng Phá VỡSOL hiện đang giao dịch quanh $99.6, giữ vững gần vùng phá vỡ $99–$100 sau đợt mở rộng tăng giá gần đây từ khu vực nhu cầu $92–$94.
Cấu trúc phục hồi tổng thể vẫn mang tính tích cực, nhưng SOL hiện đang củng cố dưới cụm kháng cự $100.59–$104.64. Bên mua cần giành lại khu vực này và phá vỡ vùng $107.07–$109.91 để mở ra đợt tăng giá mở rộng lớn tiếp theo.
📈 Cấu trúc EMA
EMA 20: $99.62
EMA 50: $92.58
EMA 100: $87.71
EMA 200: $91.88
SOL hiện đang kiểm tra đường EMA 20 tại $99.62.
SOL Triển vọng Kỹ thuật: Solana Giữ Gần $100 Khi Bên Mua Bảo Vệ Vùng Phá Vỡ
SOL hiện đang giao dịch quanh $99.6, giữ vững gần vùng phá vỡ $99–$100 sau đợt mở rộng tăng giá gần đây từ khu vực nhu cầu $92–$94.
Cấu trúc phục hồi tổng thể vẫn mang tính tích cực, nhưng SOL hiện đang củng cố dưới cụm kháng cự $100.59–$104.64. Bên mua cần giành lại khu vực này và phá vỡ vùng $107.07–$109.91 để mở ra đợt tăng giá mở rộng lớn tiếp theo.
📈 Cấu trúc EMA
EMA 20: $99.62
EMA 50: $92.58
EMA 100: $87.71
EMA 200: $91.88
SOL hiện đang kiểm tra đường EMA 20 tại $99.62.
Cấu trúc phục hồi tổng thể vẫn mang tính tích cực, nhưng SOL hiện đang củng cố dưới cụm kháng cự $100.59–$104.64. Bên mua cần giành lại khu vực này và phá vỡ vùng $107.07–$109.91 để mở ra đợt tăng giá mở rộng lớn tiếp theo.
📈 Cấu trúc EMA
EMA 20: $99.62
EMA 50: $92.58
EMA 100: $87.71
EMA 200: $91.88
SOL hiện đang kiểm tra đường EMA 20 tại $99.62.
62
·
--
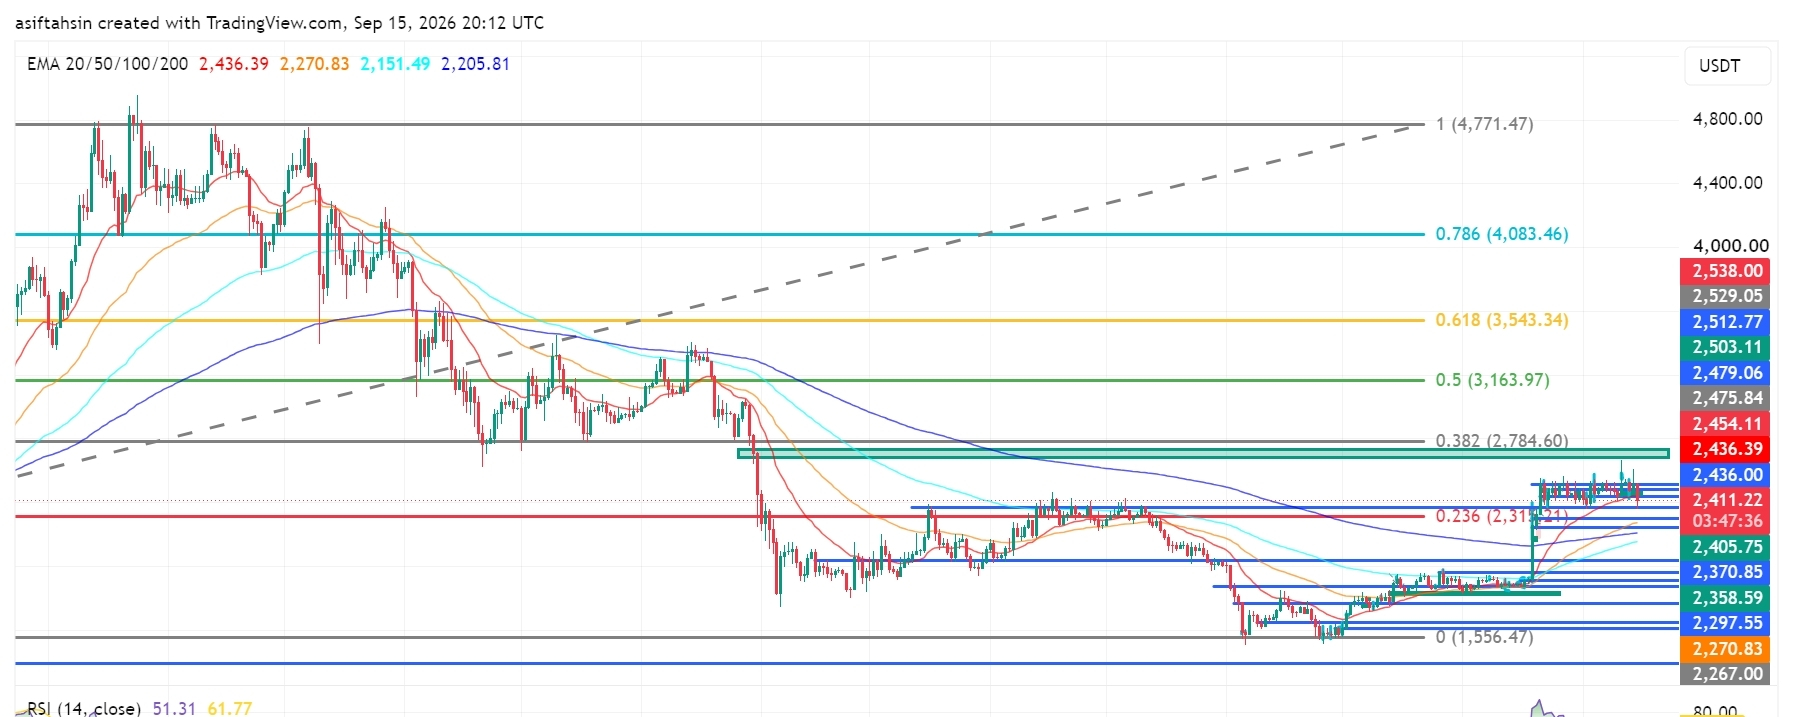
Bài viết
Triển vọng kỹ thuật ETH: Ethereum giữ vững trên $2.4K khi phe Bulls bảo vệ đà phục hồiHiện tại ETH đang giao dịch quanh $2.41K, giữ vững trên vùng hỗ trợ $2.40K–$2.41K sau đợt phục hồi gần đây từ vùng nhu cầu $2.27K–$2.30K.
Cấu trúc phục hồi tổng thể vẫn mang tính tích cực, nhưng hiện ETH đang tích lũy dưới cụm kháng cự $2.436K–$2.454K. Bên mua cần giành lại vùng này và vượt lên trên $2,538 để mở rộng đà tăng chính tiếp theo.
📈 Cấu trúc EMA
20 EMA: $2,436.39
50 EMA: $2,270.83
100 EMA: $2,151.49
200 EMA: $2,205.81
ETH vẫn đang nằm trên các đường EMA 50, 100 và 200.
EMA 20 tại $2,436.39 hiện đang là kháng cự ngắn hạn quan trọng. Nếu duy trì việc vượt lại trên mức này, cấu trúc phục hồi tăng giá sẽ được củng cố.
Triển vọng kỹ thuật ETH: Ethereum giữ vững trên $2.4K khi phe Bulls bảo vệ đà phục hồi
Hiện tại ETH đang giao dịch quanh $2.41K, giữ vững trên vùng hỗ trợ $2.40K–$2.41K sau đợt phục hồi gần đây từ vùng nhu cầu $2.27K–$2.30K.
Cấu trúc phục hồi tổng thể vẫn mang tính tích cực, nhưng hiện ETH đang tích lũy dưới cụm kháng cự $2.436K–$2.454K. Bên mua cần giành lại vùng này và vượt lên trên $2,538 để mở rộng đà tăng chính tiếp theo.
📈 Cấu trúc EMA
20 EMA: $2,436.39
50 EMA: $2,270.83
100 EMA: $2,151.49
200 EMA: $2,205.81
ETH vẫn đang nằm trên các đường EMA 50, 100 và 200.
EMA 20 tại $2,436.39 hiện đang là kháng cự ngắn hạn quan trọng. Nếu duy trì việc vượt lại trên mức này, cấu trúc phục hồi tăng giá sẽ được củng cố.
Cấu trúc phục hồi tổng thể vẫn mang tính tích cực, nhưng hiện ETH đang tích lũy dưới cụm kháng cự $2.436K–$2.454K. Bên mua cần giành lại vùng này và vượt lên trên $2,538 để mở rộng đà tăng chính tiếp theo.
📈 Cấu trúc EMA
20 EMA: $2,436.39
50 EMA: $2,270.83
100 EMA: $2,151.49
200 EMA: $2,205.81
ETH vẫn đang nằm trên các đường EMA 50, 100 và 200.
EMA 20 tại $2,436.39 hiện đang là kháng cự ngắn hạn quan trọng. Nếu duy trì việc vượt lại trên mức này, cấu trúc phục hồi tăng giá sẽ được củng cố.
63
·
--
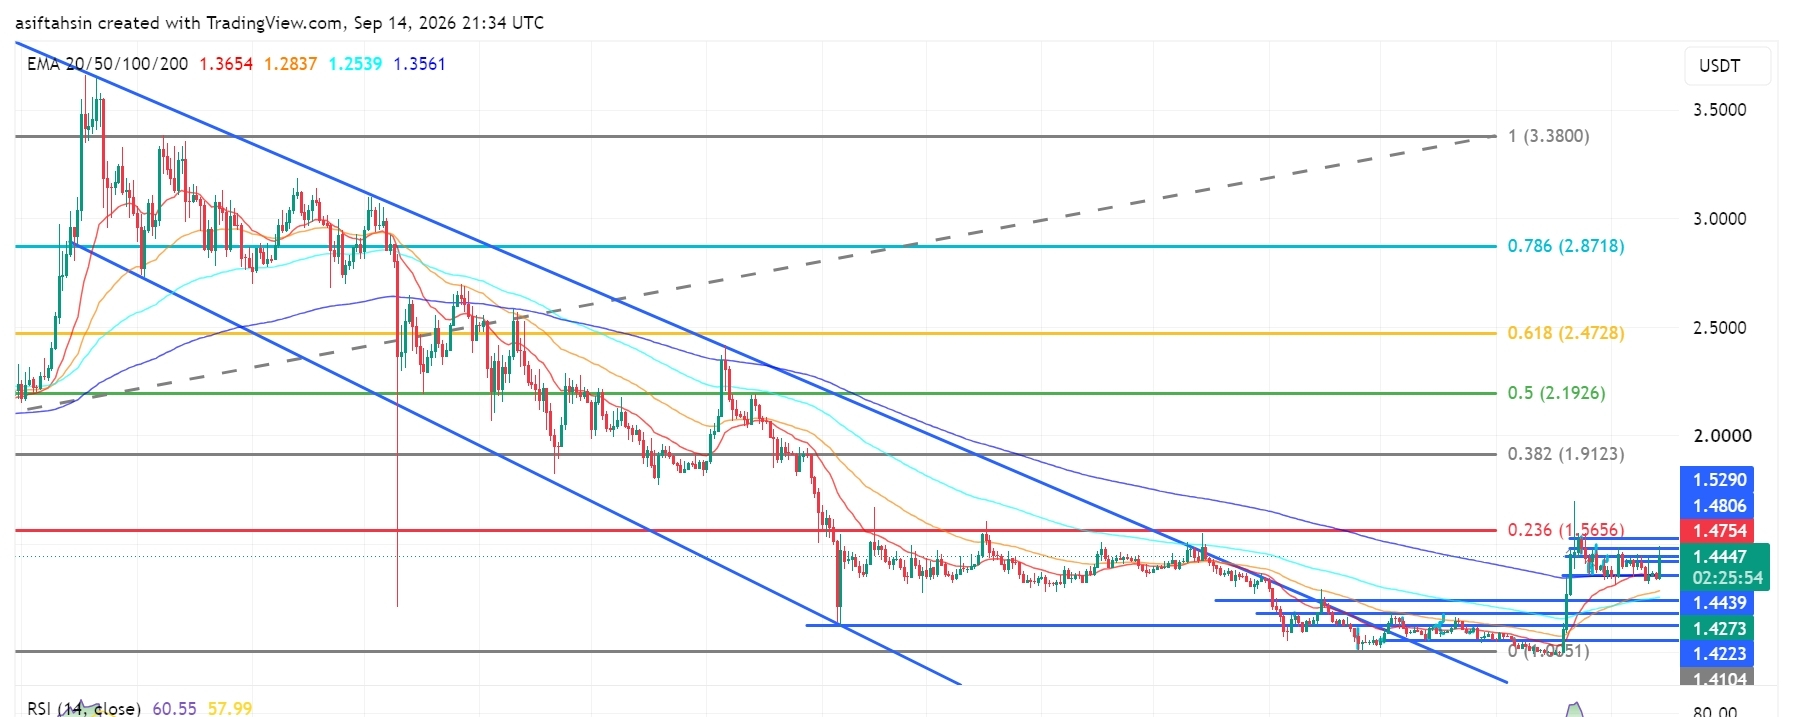
Bài viết
Triển vọng kỹ thuật XRP: XRP giữ vững trên 1,40 USD khi phe Bulls nhắm mục tiêu 1,56XRP hiện đang giao dịch quanh mức 1,44 USD, đang tích lũy trên ngưỡng tâm lý quan trọng 1,40 USD sau một đợt phục hồi mạnh từ các đáy trong giai đoạn Tháng 6–Tháng 7.
Cấu trúc tổng thể đã được cải thiện đáng kể, với XRP hiện giao dịch trên cả bốn đường EMA lớn. Tuy nhiên, giá đang tiến gần một vùng kháng cự then chốt quanh 1,475–1,53 USD. Bên mua cần một pha bứt phá rõ ràng vượt qua vùng này để mở đường hướng tới mức kháng cự Fibonacci 1,5656.
📈 Cấu trúc EMA
EMA 20: 1,3653 USD
EMA 50: 1,2837 USD
EMA 100: 1,2539 USD
EMA 200: 1,3561 USD
Triển vọng kỹ thuật XRP: XRP giữ vững trên 1,40 USD khi phe Bulls nhắm mục tiêu 1,56
XRP hiện đang giao dịch quanh mức 1,44 USD, đang tích lũy trên ngưỡng tâm lý quan trọng 1,40 USD sau một đợt phục hồi mạnh từ các đáy trong giai đoạn Tháng 6–Tháng 7.
Cấu trúc tổng thể đã được cải thiện đáng kể, với XRP hiện giao dịch trên cả bốn đường EMA lớn. Tuy nhiên, giá đang tiến gần một vùng kháng cự then chốt quanh 1,475–1,53 USD. Bên mua cần một pha bứt phá rõ ràng vượt qua vùng này để mở đường hướng tới mức kháng cự Fibonacci 1,5656.
📈 Cấu trúc EMA
EMA 20: 1,3653 USD
EMA 50: 1,2837 USD
EMA 100: 1,2539 USD
EMA 200: 1,3561 USD
Cấu trúc tổng thể đã được cải thiện đáng kể, với XRP hiện giao dịch trên cả bốn đường EMA lớn. Tuy nhiên, giá đang tiến gần một vùng kháng cự then chốt quanh 1,475–1,53 USD. Bên mua cần một pha bứt phá rõ ràng vượt qua vùng này để mở đường hướng tới mức kháng cự Fibonacci 1,5656.
📈 Cấu trúc EMA
EMA 20: 1,3653 USD
EMA 50: 1,2837 USD
EMA 100: 1,2539 USD
EMA 200: 1,3561 USD
2
1
1.2k
·
--
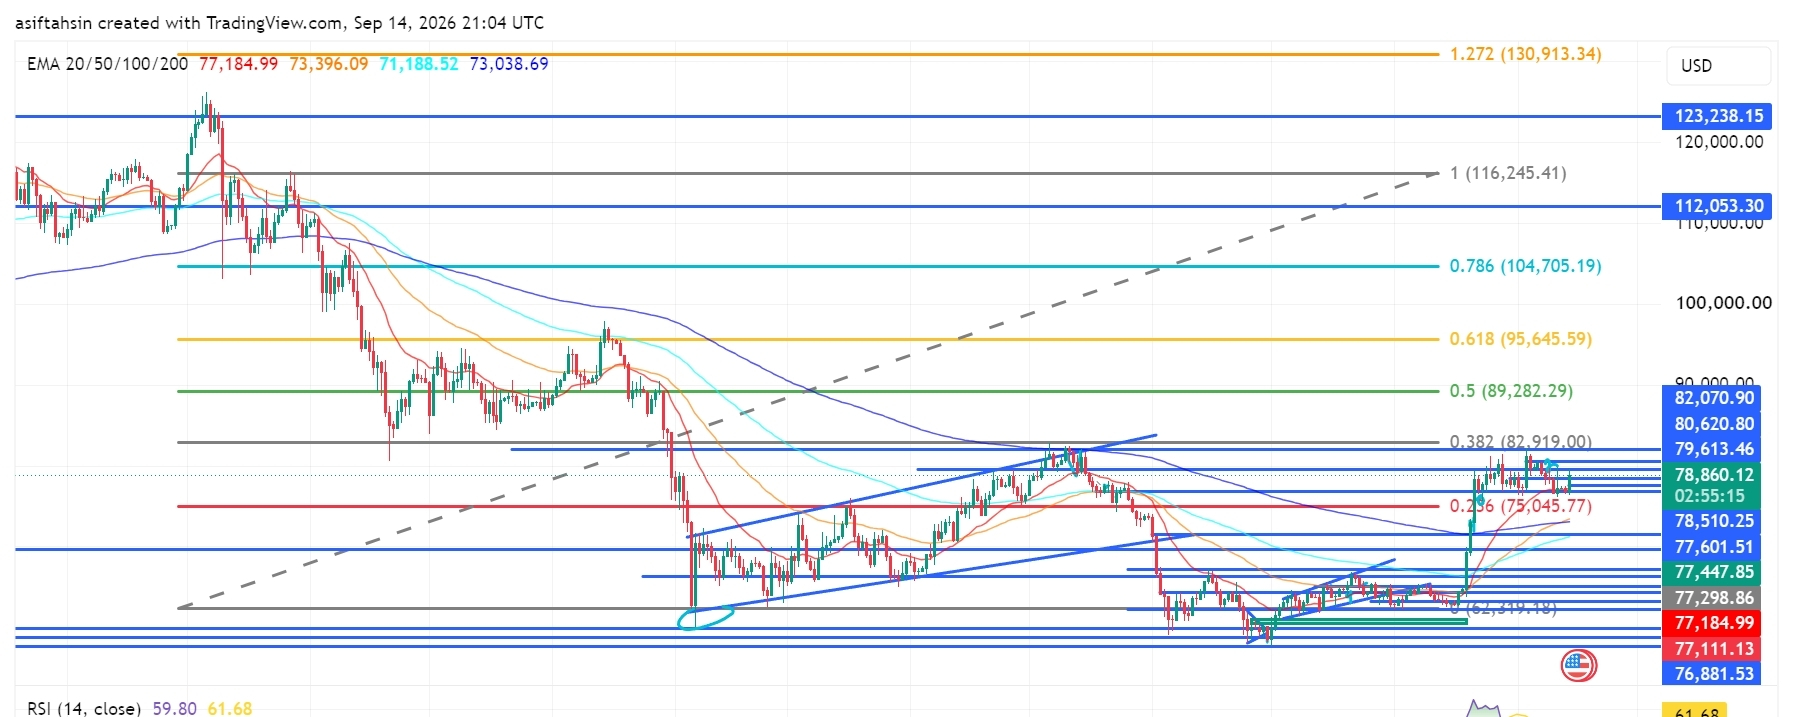
Bài viết
Triển vọng kỹ thuật Bitcoin (BTC): BTC Giữ Vững Trên $78K Khi Bên Mua Hướng Tới Kháng Cự $80K–$83KHiện tại, BTC đang giao dịch quanh $78,860, đang tích lũy trên mốc $78K sau đợt phục hồi mạnh từ các đáy tháng 6.
Cấu trúc tổng thể vẫn mang tính tích cực, với BTC đang giao dịch cao hơn tất cả bốn đường EMA chính. Tuy nhiên, giá hiện đang tiến gần một cụm kháng cự quan trọng quanh $79,613–$82,070. Bên mua cần một đợt bứt phá rõ ràng vượt qua vùng này để mở lối đi hướng tới kháng cự Fibonacci tại $82,919 và có thể cao hơn nữa.
📈 Cấu trúc EMA
EMA 20: $77,182.98
EMA 50: $73,395.26
EMA 100: $71,188.10
Triển vọng kỹ thuật Bitcoin (BTC): BTC Giữ Vững Trên $78K Khi Bên Mua Hướng Tới Kháng Cự $80K–$83K
Hiện tại, BTC đang giao dịch quanh $78,860, đang tích lũy trên mốc $78K sau đợt phục hồi mạnh từ các đáy tháng 6.
Cấu trúc tổng thể vẫn mang tính tích cực, với BTC đang giao dịch cao hơn tất cả bốn đường EMA chính. Tuy nhiên, giá hiện đang tiến gần một cụm kháng cự quan trọng quanh $79,613–$82,070. Bên mua cần một đợt bứt phá rõ ràng vượt qua vùng này để mở lối đi hướng tới kháng cự Fibonacci tại $82,919 và có thể cao hơn nữa.
📈 Cấu trúc EMA
EMA 20: $77,182.98
EMA 50: $73,395.26
EMA 100: $71,188.10
Cấu trúc tổng thể vẫn mang tính tích cực, với BTC đang giao dịch cao hơn tất cả bốn đường EMA chính. Tuy nhiên, giá hiện đang tiến gần một cụm kháng cự quan trọng quanh $79,613–$82,070. Bên mua cần một đợt bứt phá rõ ràng vượt qua vùng này để mở lối đi hướng tới kháng cự Fibonacci tại $82,919 và có thể cao hơn nữa.
📈 Cấu trúc EMA
EMA 20: $77,182.98
EMA 50: $73,395.26
EMA 100: $71,188.10
69
·
--
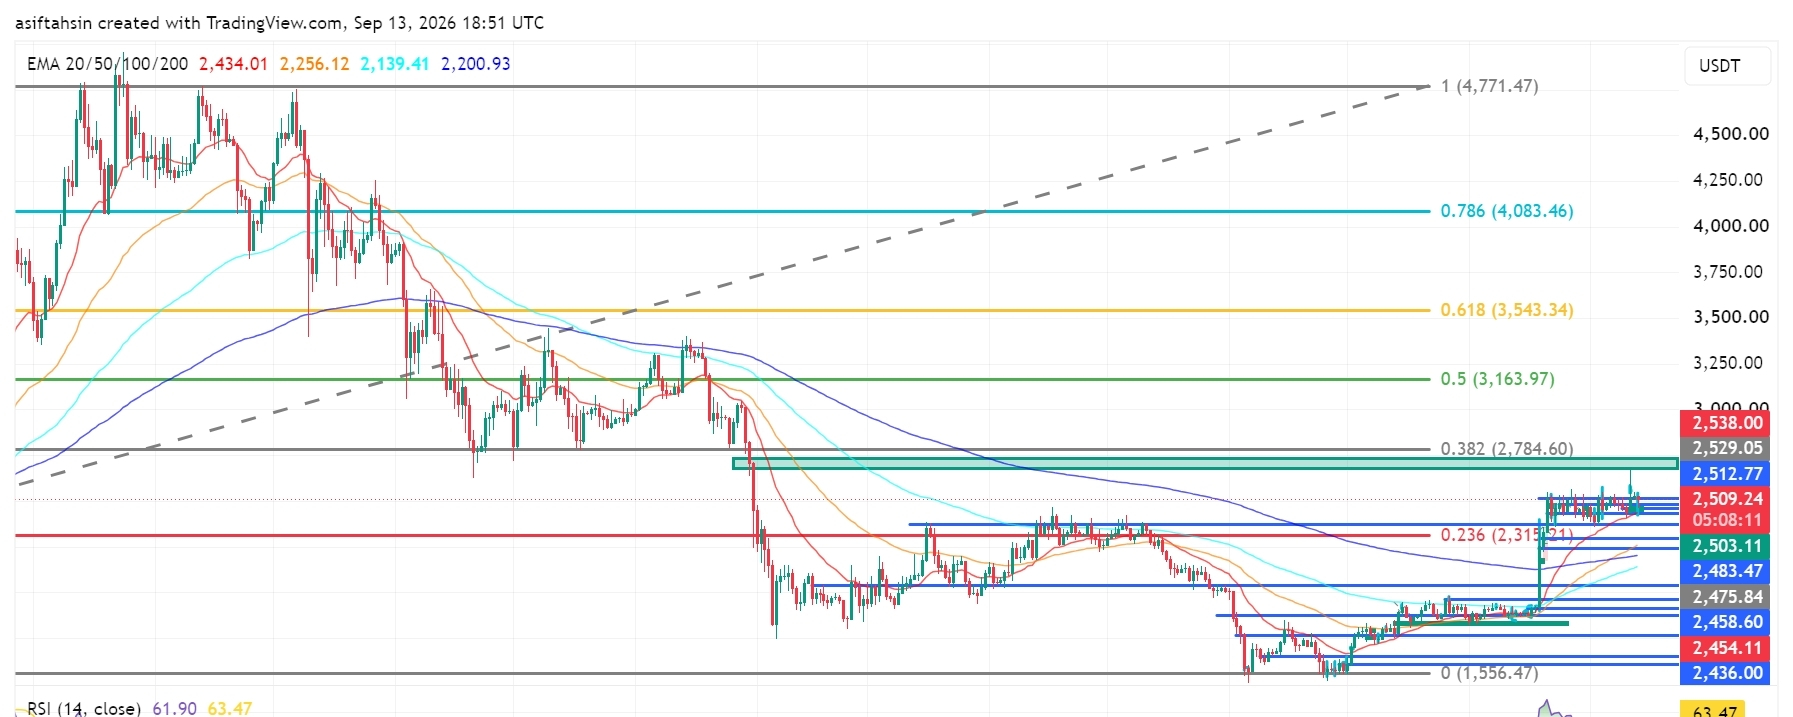
Bài viết
Xem bản dịch
Solana (SOL) Technical Outlook: SOL Holds Above $100 as Bulls Target Higher ResistanceSOL is currently trading around $101.25, consolidating above the psychological $100 level after a strong recovery from the June lows.
The broader structure is showing signs of improvement, with SOL now trading above all four major EMAs. However, price is facing a significant resistance cluster around $102.29–$104.64. Bulls need a clean breakout above this zone to open the path toward the $107–$109 area and the $129.49 Fibonacci resistance.
📈 EMA Structure
20 EMA: $99.76
50 EMA: $92.04
100 EMA: $87.25
200 EMA: $91.74
SOL is currently trading above all four major EMAs, supporting the ongoing recovery structure.
The $99.76 20 EMA is the key dynamic support. As long as SOL remains above this level, buyers maintain control of the current short-term structure.
📐 Fibonacci Levels
0.236: $104.00
0.382: $129.49
0.5: $150.08
0.618: $170.67
0.786: $199.99
1.0: $237.33
The $104.00 0.236 Fibonacci level is the immediate major resistance. A successful reclaim could strengthen the path toward $129.49.
🟢 Bullish Scenario
SOL is consolidating around the $100–$102 region after recovering from the recent lows.
A clean breakout and sustained close above $104.64 could trigger another bullish expansion.
🎯 Target 1: $107.07
🎯 Target 2: $109.84
🎯 Target 3: $112.00
🎯 Target 4: $129.49
🎯 Target 5: $150.08
🎯 Target 6: $170.67
A decisive reclaim of $129.49 would be an important confirmation that SOL is transitioning into a stronger medium-term recovery phase.
🔴 Pullback Scenario
If SOL fails to break the $102.29–$104.64 resistance cluster, a short-term pullback could develop.
Key supports:
$100.59
$99.76
$96.33
$92.94
$92.04
$91.74 — 200 EMA
$87.25 — 100 EMA
$86.69
The $100.59–$99.76 region is particularly important. A successful retest here could provide a base for another attempt at the $104 resistance.
A sustained break below the 20 EMA at $99.76 would weaken the short-term bullish structure.
🧠 Market Structure & Liquidity
SOL's recent structure can be viewed as:
Liquidity Sweep → Accumulation → Higher Lows → MSS/BOS → Breakout → Reclaim → Consolidation → Potential Continuation
The June low created a major liquidity event, followed by a prolonged accumulation phase and gradual recovery.
SOL has now reclaimed the $100 psychological level and is holding above the major EMA cluster.
The next major structural test is $102.29–$104.64, followed by the $107–$112 resistance area.
📊 RSI Momentum
RSI: 56.24
RSI MA: 61.94
RSI remains above 50, indicating that bullish momentum is still present.
However, RSI is currently below its moving average, suggesting that momentum has cooled from the recent upside move. A renewed push above 60–62 would strengthen the continuation setup.
🎯 Key Levels
Resistance:
$102.29 → $104.00 → $104.64 → $107.07 → $109.84 → $112.00 → $129.49
Support:
$100.59 → $99.76 → $96.33 → $92.94 → $92.04 → $91.74 → $87.25 → $86.69
📌 Final Outlook
SOL remains in a constructive recovery structure while holding above the $100 area and all major EMAs.
The immediate battle is $102.29–$104.64. A decisive breakout above this zone could push SOL toward $107 → $109.84 → $112, while a sustained move beyond these levels could open the path toward $129.49.
On the downside, $99.76 is the key dynamic support. As long as SOL holds above this level, the broader recovery structure remains intact.
Bias: 🟢 Bullish above $99.76 | Stronger above $104.64
$SOL
{future}(SOLUSDT)
Solana (SOL) Technical Outlook: SOL Holds Above $100 as Bulls Target Higher Resistance
SOL is currently trading around $101.25, consolidating above the psychological $100 level after a strong recovery from the June lows.
The broader structure is showing signs of improvement, with SOL now trading above all four major EMAs. However, price is facing a significant resistance cluster around $102.29–$104.64. Bulls need a clean breakout above this zone to open the path toward the $107–$109 area and the $129.49 Fibonacci resistance.
📈 EMA Structure
20 EMA: $99.76
50 EMA: $92.04
100 EMA: $87.25
200 EMA: $91.74
SOL is currently trading above all four major EMAs, supporting the ongoing recovery structure.
The $99.76 20 EMA is the key dynamic support. As long as SOL remains above this level, buyers maintain control of the current short-term structure.
📐 Fibonacci Levels
0.236: $104.00
0.382: $129.49
0.5: $150.08
0.618: $170.67
0.786: $199.99
1.0: $237.33
The $104.00 0.236 Fibonacci level is the immediate major resistance. A successful reclaim could strengthen the path toward $129.49.
🟢 Bullish Scenario
SOL is consolidating around the $100–$102 region after recovering from the recent lows.
A clean breakout and sustained close above $104.64 could trigger another bullish expansion.
🎯 Target 1: $107.07
🎯 Target 2: $109.84
🎯 Target 3: $112.00
🎯 Target 4: $129.49
🎯 Target 5: $150.08
🎯 Target 6: $170.67
A decisive reclaim of $129.49 would be an important confirmation that SOL is transitioning into a stronger medium-term recovery phase.
🔴 Pullback Scenario
If SOL fails to break the $102.29–$104.64 resistance cluster, a short-term pullback could develop.
Key supports:
$100.59
$99.76
$96.33
$92.94
$92.04
$91.74 — 200 EMA
$87.25 — 100 EMA
$86.69
The $100.59–$99.76 region is particularly important. A successful retest here could provide a base for another attempt at the $104 resistance.
A sustained break below the 20 EMA at $99.76 would weaken the short-term bullish structure.
🧠 Market Structure & Liquidity
SOL's recent structure can be viewed as:
Liquidity Sweep → Accumulation → Higher Lows → MSS/BOS → Breakout → Reclaim → Consolidation → Potential Continuation
The June low created a major liquidity event, followed by a prolonged accumulation phase and gradual recovery.
SOL has now reclaimed the $100 psychological level and is holding above the major EMA cluster.
The next major structural test is $102.29–$104.64, followed by the $107–$112 resistance area.
📊 RSI Momentum
RSI: 56.24
RSI MA: 61.94
RSI remains above 50, indicating that bullish momentum is still present.
However, RSI is currently below its moving average, suggesting that momentum has cooled from the recent upside move. A renewed push above 60–62 would strengthen the continuation setup.
🎯 Key Levels
Resistance:
$102.29 → $104.00 → $104.64 → $107.07 → $109.84 → $112.00 → $129.49
Support:
$100.59 → $99.76 → $96.33 → $92.94 → $92.04 → $91.74 → $87.25 → $86.69
📌 Final Outlook
SOL remains in a constructive recovery structure while holding above the $100 area and all major EMAs.
The immediate battle is $102.29–$104.64. A decisive breakout above this zone could push SOL toward $107 → $109.84 → $112, while a sustained move beyond these levels could open the path toward $129.49.
On the downside, $99.76 is the key dynamic support. As long as SOL holds above this level, the broader recovery structure remains intact.
Bias: 🟢 Bullish above $99.76 | Stronger above $104.64
$SOL
The broader structure is showing signs of improvement, with SOL now trading above all four major EMAs. However, price is facing a significant resistance cluster around $102.29–$104.64. Bulls need a clean breakout above this zone to open the path toward the $107–$109 area and the $129.49 Fibonacci resistance.
📈 EMA Structure
20 EMA: $99.76
50 EMA: $92.04
100 EMA: $87.25
200 EMA: $91.74
SOL is currently trading above all four major EMAs, supporting the ongoing recovery structure.
The $99.76 20 EMA is the key dynamic support. As long as SOL remains above this level, buyers maintain control of the current short-term structure.
📐 Fibonacci Levels
0.236: $104.00
0.382: $129.49
0.5: $150.08
0.618: $170.67
0.786: $199.99
1.0: $237.33
The $104.00 0.236 Fibonacci level is the immediate major resistance. A successful reclaim could strengthen the path toward $129.49.
🟢 Bullish Scenario
SOL is consolidating around the $100–$102 region after recovering from the recent lows.
A clean breakout and sustained close above $104.64 could trigger another bullish expansion.
🎯 Target 1: $107.07
🎯 Target 2: $109.84
🎯 Target 3: $112.00
🎯 Target 4: $129.49
🎯 Target 5: $150.08
🎯 Target 6: $170.67
A decisive reclaim of $129.49 would be an important confirmation that SOL is transitioning into a stronger medium-term recovery phase.
🔴 Pullback Scenario
If SOL fails to break the $102.29–$104.64 resistance cluster, a short-term pullback could develop.
Key supports:
$100.59
$99.76
$96.33
$92.94
$92.04
$91.74 — 200 EMA
$87.25 — 100 EMA
$86.69
The $100.59–$99.76 region is particularly important. A successful retest here could provide a base for another attempt at the $104 resistance.
A sustained break below the 20 EMA at $99.76 would weaken the short-term bullish structure.
🧠 Market Structure & Liquidity
SOL's recent structure can be viewed as:
Liquidity Sweep → Accumulation → Higher Lows → MSS/BOS → Breakout → Reclaim → Consolidation → Potential Continuation
The June low created a major liquidity event, followed by a prolonged accumulation phase and gradual recovery.
SOL has now reclaimed the $100 psychological level and is holding above the major EMA cluster.
The next major structural test is $102.29–$104.64, followed by the $107–$112 resistance area.
📊 RSI Momentum
RSI: 56.24
RSI MA: 61.94
RSI remains above 50, indicating that bullish momentum is still present.
However, RSI is currently below its moving average, suggesting that momentum has cooled from the recent upside move. A renewed push above 60–62 would strengthen the continuation setup.
🎯 Key Levels
Resistance:
$102.29 → $104.00 → $104.64 → $107.07 → $109.84 → $112.00 → $129.49
Support:
$100.59 → $99.76 → $96.33 → $92.94 → $92.04 → $91.74 → $87.25 → $86.69
📌 Final Outlook
SOL remains in a constructive recovery structure while holding above the $100 area and all major EMAs.
The immediate battle is $102.29–$104.64. A decisive breakout above this zone could push SOL toward $107 → $109.84 → $112, while a sustained move beyond these levels could open the path toward $129.49.
On the downside, $99.76 is the key dynamic support. As long as SOL holds above this level, the broader recovery structure remains intact.
Bias: 🟢 Bullish above $99.76 | Stronger above $104.64
$SOL
61
·
--
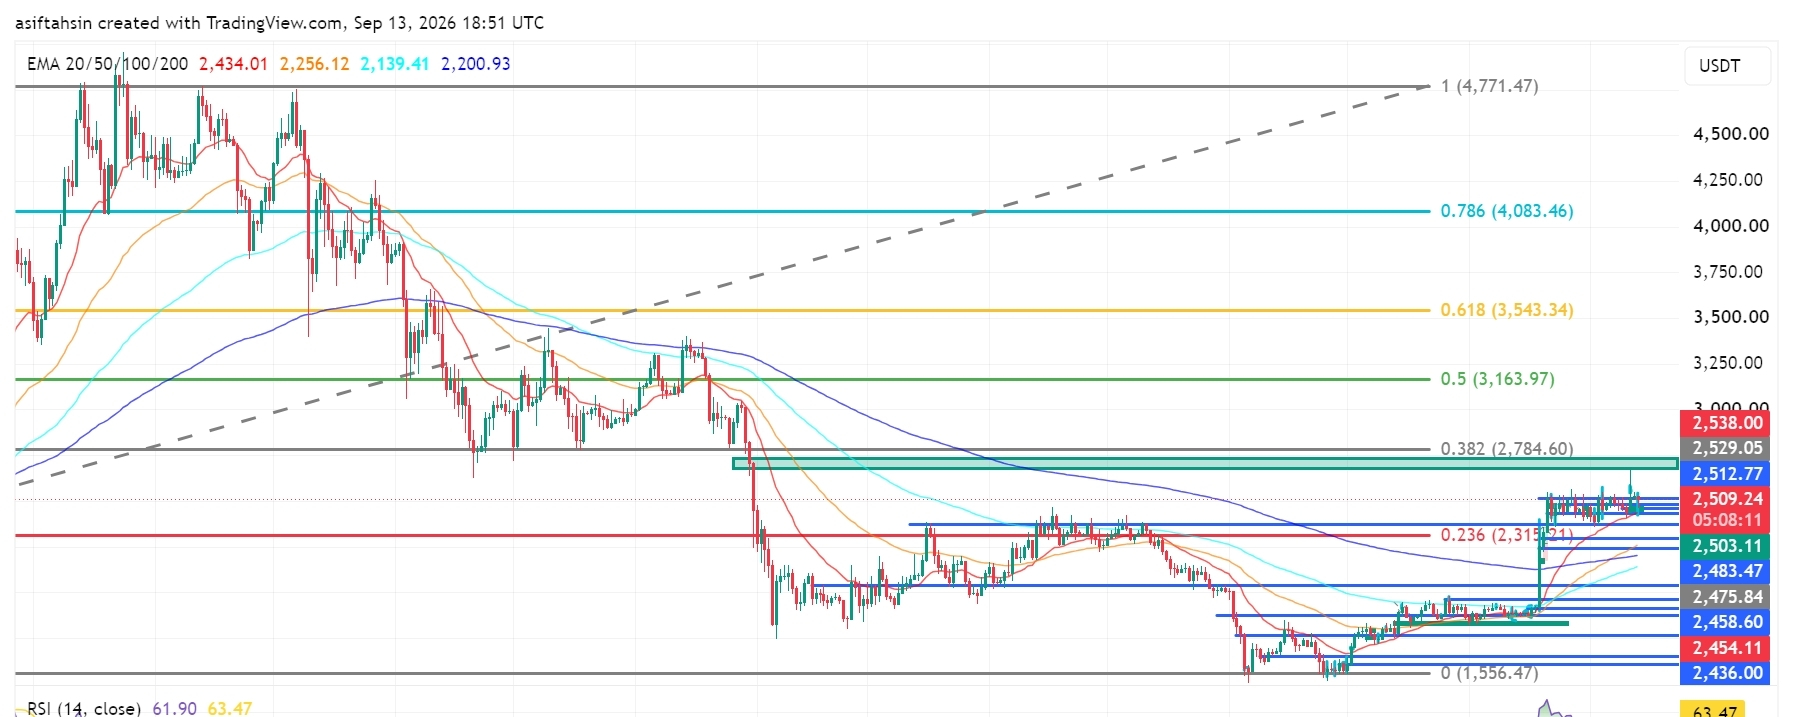
Bài viết
Xem bản dịch
ETH Technical Outlook: Ethereum Holds Above $2.5K as Bulls Target Higher ResistanceETH is currently trading around $2,509, consolidating above the psychological $2,500 level after a strong recovery from the June lows.
The broader structure remains constructive, with ETH trading well above all four major EMAs. However, price is now approaching a significant resistance cluster around $2,512–$2,538. Bulls need a clean breakout above this zone to open the path toward the $2,784 Fibonacci resistance.
📈 EMA Structure
20 EMA: $2,434.01
50 EMA: $2,256.12
100 EMA: $2,139.41
200 EMA: $2,200.93
ETH remains comfortably above all four major EMAs, keeping the medium-term recovery structure bullish.
The $2,434 20 EMA is now the key dynamic support. As long as ETH remains above this level, buyers maintain control of the current recovery.
📐 Fibonacci Levels
0.236: $2,315.21
0.382: $2,784.60
0.5: $3,163.97
0.618: $3,543.34
0.786: $4,083.46
1.0: $4,771.47
The $2,784.60 0.382 Fibonacci level is the next major upside objective after the current resistance cluster.
🟢 Bullish Scenario
ETH is consolidating just below the $2,512–$2,538 resistance zone.
A clean breakout and sustained close above $2,538 could trigger another bullish expansion.
🎯 Target 1: $2,550
🎯 Target 2: $2,600
🎯 Target 3: $2,700
🎯 Target 4: $2,784.60
🎯 Target 5: $3,163.97
🎯 Target 6: $3,543.34
A decisive reclaim of $2,784.60 would be an important confirmation that ETH is transitioning into a stronger medium-term recovery phase.
🔴 Pullback Scenario
If ETH fails to break the $2,512–$2,538 resistance cluster, a short-term pullback could develop.
Key supports:
$2,503.11
$2,483.47
$2,475.84
$2,458.60
$2,454.11
$2,434.01 — 20 EMA
$2,315.21 — 0.236 Fib
The $2,454–$2,434 region is particularly important. A successful retest here could provide a base for another attempt at the $2,538 resistance.
A sustained break below the 20 EMA would weaken the short-term bullish structure.
🧠 Market Structure & Liquidity
ETH's recent structure can be viewed as:
Liquidity Sweep → Accumulation → Higher Lows → Breakout → Reclaim → Consolidation → Potential Continuation
The June low around $1,556 created a major liquidity sweep, followed by a strong recovery and a series of higher lows.
ETH has now reclaimed the $2,500 psychological level and is consolidating near the recent highs.
The next major structural test is $2,538, followed by the $2,784.60 Fibonacci resistance.
📊 RSI Momentum
RSI: 61.90
RSI MA: 63.47
RSI remains above 60, confirming that bullish momentum is still present.
However, RSI is slightly below its moving average, suggesting momentum has cooled from the recent spike. A renewed move above 63–65 would strengthen the continuation setup.
🎯 Key Levels
Resistance:
$2,512.77 → $2,529.05 → $2,538 → $2,784.60 → $3,163.97 → $3,543.34
Support:
$2,503.11 → $2,483.47 → $2,475.84 → $2,458.60 → $2,454.11 → $2,434.01 → $2,315.21
📌 Final Outlook
ETH remains in a constructive recovery structure while holding above the $2,500 area and all major EMAs.
The immediate battle is $2,512–$2,538. A decisive breakout above this zone could push ETH toward $2,600 → $2,700 → $2,784.60, while a confirmed break above $2,784 could open the path toward $3,163.97.
On the downside, $2,434 is the key dynamic support. As long as ETH holds above this level, the broader bullish recovery remains intact.
Bias: 🟢 Bullish above $2,434 | Stronger above $2,538
$ETH
{future}(ETHUSDT)
ETH Technical Outlook: Ethereum Holds Above $2.5K as Bulls Target Higher Resistance
ETH is currently trading around $2,509, consolidating above the psychological $2,500 level after a strong recovery from the June lows.
The broader structure remains constructive, with ETH trading well above all four major EMAs. However, price is now approaching a significant resistance cluster around $2,512–$2,538. Bulls need a clean breakout above this zone to open the path toward the $2,784 Fibonacci resistance.
📈 EMA Structure
20 EMA: $2,434.01
50 EMA: $2,256.12
100 EMA: $2,139.41
200 EMA: $2,200.93
ETH remains comfortably above all four major EMAs, keeping the medium-term recovery structure bullish.
The $2,434 20 EMA is now the key dynamic support. As long as ETH remains above this level, buyers maintain control of the current recovery.
📐 Fibonacci Levels
0.236: $2,315.21
0.382: $2,784.60
0.5: $3,163.97
0.618: $3,543.34
0.786: $4,083.46
1.0: $4,771.47
The $2,784.60 0.382 Fibonacci level is the next major upside objective after the current resistance cluster.
🟢 Bullish Scenario
ETH is consolidating just below the $2,512–$2,538 resistance zone.
A clean breakout and sustained close above $2,538 could trigger another bullish expansion.
🎯 Target 1: $2,550
🎯 Target 2: $2,600
🎯 Target 3: $2,700
🎯 Target 4: $2,784.60
🎯 Target 5: $3,163.97
🎯 Target 6: $3,543.34
A decisive reclaim of $2,784.60 would be an important confirmation that ETH is transitioning into a stronger medium-term recovery phase.
🔴 Pullback Scenario
If ETH fails to break the $2,512–$2,538 resistance cluster, a short-term pullback could develop.
Key supports:
$2,503.11
$2,483.47
$2,475.84
$2,458.60
$2,454.11
$2,434.01 — 20 EMA
$2,315.21 — 0.236 Fib
The $2,454–$2,434 region is particularly important. A successful retest here could provide a base for another attempt at the $2,538 resistance.
A sustained break below the 20 EMA would weaken the short-term bullish structure.
🧠 Market Structure & Liquidity
ETH's recent structure can be viewed as:
Liquidity Sweep → Accumulation → Higher Lows → Breakout → Reclaim → Consolidation → Potential Continuation
The June low around $1,556 created a major liquidity sweep, followed by a strong recovery and a series of higher lows.
ETH has now reclaimed the $2,500 psychological level and is consolidating near the recent highs.
The next major structural test is $2,538, followed by the $2,784.60 Fibonacci resistance.
📊 RSI Momentum
RSI: 61.90
RSI MA: 63.47
RSI remains above 60, confirming that bullish momentum is still present.
However, RSI is slightly below its moving average, suggesting momentum has cooled from the recent spike. A renewed move above 63–65 would strengthen the continuation setup.
🎯 Key Levels
Resistance:
$2,512.77 → $2,529.05 → $2,538 → $2,784.60 → $3,163.97 → $3,543.34
Support:
$2,503.11 → $2,483.47 → $2,475.84 → $2,458.60 → $2,454.11 → $2,434.01 → $2,315.21
📌 Final Outlook
ETH remains in a constructive recovery structure while holding above the $2,500 area and all major EMAs.
The immediate battle is $2,512–$2,538. A decisive breakout above this zone could push ETH toward $2,600 → $2,700 → $2,784.60, while a confirmed break above $2,784 could open the path toward $3,163.97.
On the downside, $2,434 is the key dynamic support. As long as ETH holds above this level, the broader bullish recovery remains intact.
Bias: 🟢 Bullish above $2,434 | Stronger above $2,538
$ETH
The broader structure remains constructive, with ETH trading well above all four major EMAs. However, price is now approaching a significant resistance cluster around $2,512–$2,538. Bulls need a clean breakout above this zone to open the path toward the $2,784 Fibonacci resistance.
📈 EMA Structure
20 EMA: $2,434.01
50 EMA: $2,256.12
100 EMA: $2,139.41
200 EMA: $2,200.93
ETH remains comfortably above all four major EMAs, keeping the medium-term recovery structure bullish.
The $2,434 20 EMA is now the key dynamic support. As long as ETH remains above this level, buyers maintain control of the current recovery.
📐 Fibonacci Levels
0.236: $2,315.21
0.382: $2,784.60
0.5: $3,163.97
0.618: $3,543.34
0.786: $4,083.46
1.0: $4,771.47
The $2,784.60 0.382 Fibonacci level is the next major upside objective after the current resistance cluster.
🟢 Bullish Scenario
ETH is consolidating just below the $2,512–$2,538 resistance zone.
A clean breakout and sustained close above $2,538 could trigger another bullish expansion.
🎯 Target 1: $2,550
🎯 Target 2: $2,600
🎯 Target 3: $2,700
🎯 Target 4: $2,784.60
🎯 Target 5: $3,163.97
🎯 Target 6: $3,543.34
A decisive reclaim of $2,784.60 would be an important confirmation that ETH is transitioning into a stronger medium-term recovery phase.
🔴 Pullback Scenario
If ETH fails to break the $2,512–$2,538 resistance cluster, a short-term pullback could develop.
Key supports:
$2,503.11
$2,483.47
$2,475.84
$2,458.60
$2,454.11
$2,434.01 — 20 EMA
$2,315.21 — 0.236 Fib
The $2,454–$2,434 region is particularly important. A successful retest here could provide a base for another attempt at the $2,538 resistance.
A sustained break below the 20 EMA would weaken the short-term bullish structure.
🧠 Market Structure & Liquidity
ETH's recent structure can be viewed as:
Liquidity Sweep → Accumulation → Higher Lows → Breakout → Reclaim → Consolidation → Potential Continuation
The June low around $1,556 created a major liquidity sweep, followed by a strong recovery and a series of higher lows.
ETH has now reclaimed the $2,500 psychological level and is consolidating near the recent highs.
The next major structural test is $2,538, followed by the $2,784.60 Fibonacci resistance.
📊 RSI Momentum
RSI: 61.90
RSI MA: 63.47
RSI remains above 60, confirming that bullish momentum is still present.
However, RSI is slightly below its moving average, suggesting momentum has cooled from the recent spike. A renewed move above 63–65 would strengthen the continuation setup.
🎯 Key Levels
Resistance:
$2,512.77 → $2,529.05 → $2,538 → $2,784.60 → $3,163.97 → $3,543.34
Support:
$2,503.11 → $2,483.47 → $2,475.84 → $2,458.60 → $2,454.11 → $2,434.01 → $2,315.21
📌 Final Outlook
ETH remains in a constructive recovery structure while holding above the $2,500 area and all major EMAs.
The immediate battle is $2,512–$2,538. A decisive breakout above this zone could push ETH toward $2,600 → $2,700 → $2,784.60, while a confirmed break above $2,784 could open the path toward $3,163.97.
On the downside, $2,434 is the key dynamic support. As long as ETH holds above this level, the broader bullish recovery remains intact.
Bias: 🟢 Bullish above $2,434 | Stronger above $2,538
$ETH
83
·
--
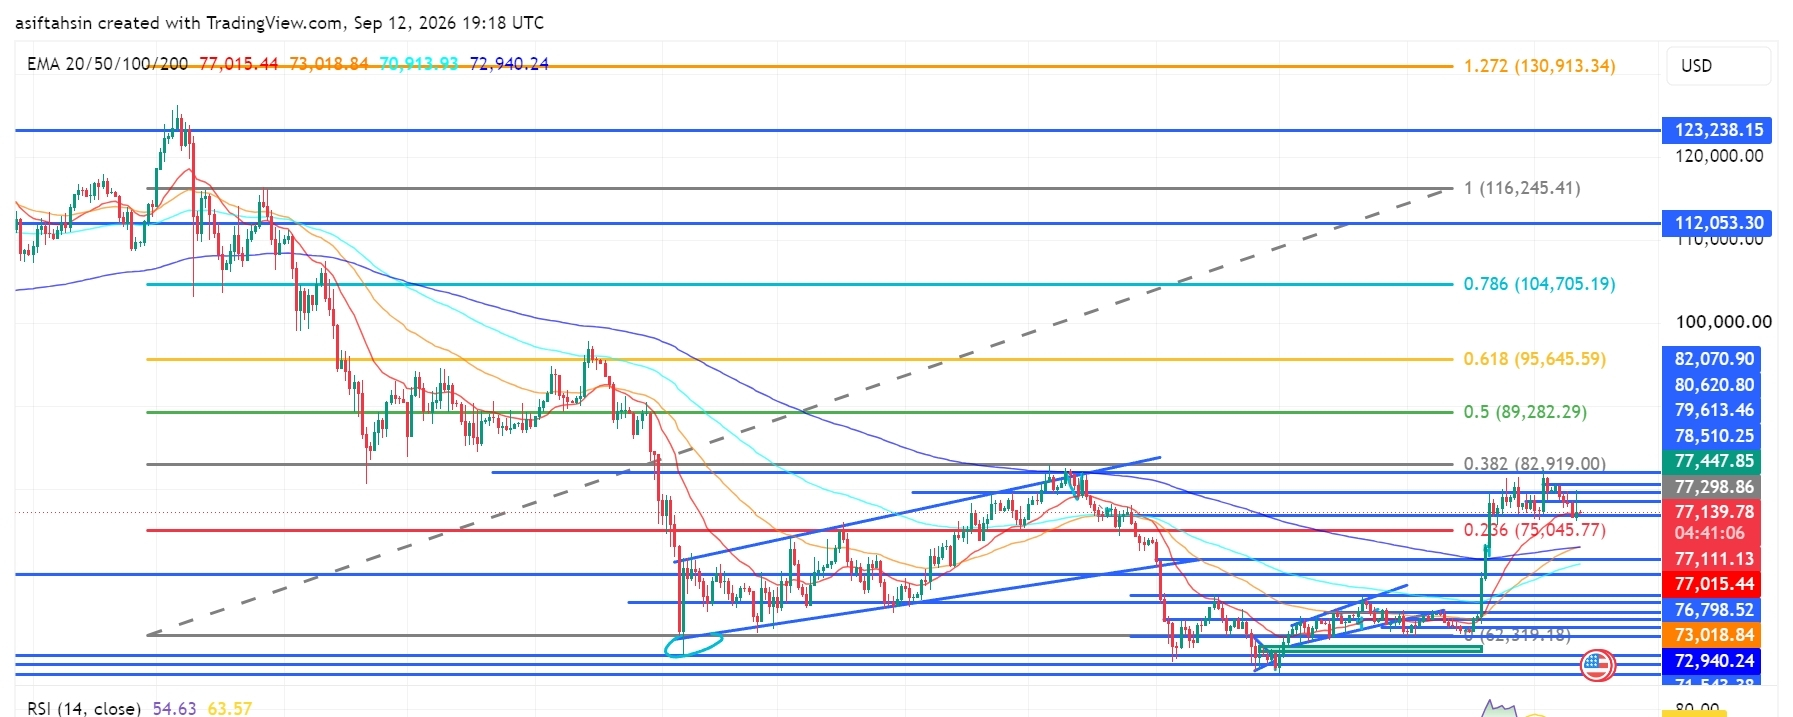
Bài viết
Xem bản dịch
BTC Technical Outlook: Bitcoin Holds Above $77K as Bulls Defend the BreakoutBTC is currently trading around $77.1K, consolidating above the $75K–$77K breakout zone after the recent bullish recovery.
The broader structure remains constructive, but BTC is facing strong resistance around $77.4K–$82.9K. Bulls need to reclaim this resistance cluster and break the $82,919 Fibonacci level to unlock the next major upside expansion.
📈 EMA Structure
20 EMA: $77,015.44
50 EMA: $73,018.84
100 EMA: $70,913.93
200 EMA: $72,940.24
BTC is currently holding just above the 20 EMA, while remaining above the 50, 100 and 200 EMAs.
The $77,015 20 EMA is now an important short-term pivot. Holding above it keeps the recent recovery structure intact.
📐 Fibonacci Levels
0.236: $75,045.77
0.382: $82,919.00
0.5: $89,282.29
0.618: $95,645.59
0.786: $104,705.19
1.0: $116,245.41
1.272: $130,913.34
The $82,919 0.382 Fibonacci level is the key breakout point. A sustained move above it would significantly strengthen the medium-term bullish structure.
🟢 Bullish Scenario
BTC is currently consolidating below the $77.4K–$80.6K resistance cluster.
A clean breakout above $78,510–$79,614 could bring the next resistance levels into play.
🎯 Target 1: $80,620
🎯 Target 2: $82,070
🎯 Target 3: $82,919
🎯 Target 4: $89,282
🎯 Target 5: $95,645
🎯 Target 6: $104,705
If BTC successfully reclaims $82,919, the broader recovery could accelerate toward $89K and $95.6K.
🔴 Pullback Scenario
If BTC fails to break the current resistance zone, sellers could push price back toward the EMA and Fibonacci support structure.
Key supports:
$77,015 — 20 EMA
$76,798
$75,045 — 0.236 Fib
$73,018 — 50 EMA
$72,940 — 200 EMA
$71,543
$70,913 — 100 EMA
The $75,045–$77,015 region is particularly important. A successful retest here could provide the foundation for another attempt at $80K+.
However, losing $72,940–$70,913 would significantly weaken the current recovery structure.
🧠 Market Structure & Liquidity
BTC's recent structure can be viewed as:
Liquidity Sweep → Accumulation → Higher Highs/Higher Lows → Breakout → Retest → Consolidation → Potential Continuation
The June/July lows created a major liquidity area, followed by a strong recovery and breakout through the previous consolidation range.
BTC is now attempting to establish acceptance above $77K. The next major structural test is the $82K–$82.9K region, where previous price action and the 0.382 Fibonacci level converge.
📊 RSI Momentum
RSI: 54.63
RSI MA: 63.57
RSI remains above the neutral 50 level, indicating that bullish momentum is still present.
However, RSI is below its moving average, showing that momentum has cooled from the recent spike. A move back above 60–63 would strengthen the continuation setup.
🎯 Key Levels
Resistance:
$77,447 → $78,510 → $79,614 → $80,620 → $82,070 → $82,919 → $89,282 → $95,645
Support:
$77,015 → $76,798 → $75,045 → $73,018 → $72,940 → $71,543 → $70,913
📌 Final Outlook
BTC remains in a constructive recovery structure while holding above the $75K–$77K zone and the major EMA support cluster.
The immediate battle is $77.4K–$80.6K. A decisive breakout above this region could send BTC toward $82K–$82.9K, while a confirmed break above $82,919 would open the path toward $89.2K → $95.6K → $104.7K.
On the downside, $75,045 is the key Fibonacci support, while $72.9K–$70.9K is the major structural defense.
Bias: 🟢 Bullish above $75,045 | Stronger above $82,919
$BTC
{future}(BTCUSDT)
BTC Technical Outlook: Bitcoin Holds Above $77K as Bulls Defend the Breakout
BTC is currently trading around $77.1K, consolidating above the $75K–$77K breakout zone after the recent bullish recovery.
The broader structure remains constructive, but BTC is facing strong resistance around $77.4K–$82.9K. Bulls need to reclaim this resistance cluster and break the $82,919 Fibonacci level to unlock the next major upside expansion.
📈 EMA Structure
20 EMA: $77,015.44
50 EMA: $73,018.84
100 EMA: $70,913.93
200 EMA: $72,940.24
BTC is currently holding just above the 20 EMA, while remaining above the 50, 100 and 200 EMAs.
The $77,015 20 EMA is now an important short-term pivot. Holding above it keeps the recent recovery structure intact.
📐 Fibonacci Levels
0.236: $75,045.77
0.382: $82,919.00
0.5: $89,282.29
0.618: $95,645.59
0.786: $104,705.19
1.0: $116,245.41
1.272: $130,913.34
The $82,919 0.382 Fibonacci level is the key breakout point. A sustained move above it would significantly strengthen the medium-term bullish structure.
🟢 Bullish Scenario
BTC is currently consolidating below the $77.4K–$80.6K resistance cluster.
A clean breakout above $78,510–$79,614 could bring the next resistance levels into play.
🎯 Target 1: $80,620
🎯 Target 2: $82,070
🎯 Target 3: $82,919
🎯 Target 4: $89,282
🎯 Target 5: $95,645
🎯 Target 6: $104,705
If BTC successfully reclaims $82,919, the broader recovery could accelerate toward $89K and $95.6K.
🔴 Pullback Scenario
If BTC fails to break the current resistance zone, sellers could push price back toward the EMA and Fibonacci support structure.
Key supports:
$77,015 — 20 EMA
$76,798
$75,045 — 0.236 Fib
$73,018 — 50 EMA
$72,940 — 200 EMA
$71,543
$70,913 — 100 EMA
The $75,045–$77,015 region is particularly important. A successful retest here could provide the foundation for another attempt at $80K+.
However, losing $72,940–$70,913 would significantly weaken the current recovery structure.
🧠 Market Structure & Liquidity
BTC's recent structure can be viewed as:
Liquidity Sweep → Accumulation → Higher Highs/Higher Lows → Breakout → Retest → Consolidation → Potential Continuation
The June/July lows created a major liquidity area, followed by a strong recovery and breakout through the previous consolidation range.
BTC is now attempting to establish acceptance above $77K. The next major structural test is the $82K–$82.9K region, where previous price action and the 0.382 Fibonacci level converge.
📊 RSI Momentum
RSI: 54.63
RSI MA: 63.57
RSI remains above the neutral 50 level, indicating that bullish momentum is still present.
However, RSI is below its moving average, showing that momentum has cooled from the recent spike. A move back above 60–63 would strengthen the continuation setup.
🎯 Key Levels
Resistance:
$77,447 → $78,510 → $79,614 → $80,620 → $82,070 → $82,919 → $89,282 → $95,645
Support:
$77,015 → $76,798 → $75,045 → $73,018 → $72,940 → $71,543 → $70,913
📌 Final Outlook
BTC remains in a constructive recovery structure while holding above the $75K–$77K zone and the major EMA support cluster.
The immediate battle is $77.4K–$80.6K. A decisive breakout above this region could send BTC toward $82K–$82.9K, while a confirmed break above $82,919 would open the path toward $89.2K → $95.6K → $104.7K.
On the downside, $75,045 is the key Fibonacci support, while $72.9K–$70.9K is the major structural defense.
Bias: 🟢 Bullish above $75,045 | Stronger above $82,919
$BTC
The broader structure remains constructive, but BTC is facing strong resistance around $77.4K–$82.9K. Bulls need to reclaim this resistance cluster and break the $82,919 Fibonacci level to unlock the next major upside expansion.
📈 EMA Structure
20 EMA: $77,015.44
50 EMA: $73,018.84
100 EMA: $70,913.93
200 EMA: $72,940.24
BTC is currently holding just above the 20 EMA, while remaining above the 50, 100 and 200 EMAs.
The $77,015 20 EMA is now an important short-term pivot. Holding above it keeps the recent recovery structure intact.
📐 Fibonacci Levels
0.236: $75,045.77
0.382: $82,919.00
0.5: $89,282.29
0.618: $95,645.59
0.786: $104,705.19
1.0: $116,245.41
1.272: $130,913.34
The $82,919 0.382 Fibonacci level is the key breakout point. A sustained move above it would significantly strengthen the medium-term bullish structure.
🟢 Bullish Scenario
BTC is currently consolidating below the $77.4K–$80.6K resistance cluster.
A clean breakout above $78,510–$79,614 could bring the next resistance levels into play.
🎯 Target 1: $80,620
🎯 Target 2: $82,070
🎯 Target 3: $82,919
🎯 Target 4: $89,282
🎯 Target 5: $95,645
🎯 Target 6: $104,705
If BTC successfully reclaims $82,919, the broader recovery could accelerate toward $89K and $95.6K.
🔴 Pullback Scenario
If BTC fails to break the current resistance zone, sellers could push price back toward the EMA and Fibonacci support structure.
Key supports:
$77,015 — 20 EMA
$76,798
$75,045 — 0.236 Fib
$73,018 — 50 EMA
$72,940 — 200 EMA
$71,543
$70,913 — 100 EMA
The $75,045–$77,015 region is particularly important. A successful retest here could provide the foundation for another attempt at $80K+.
However, losing $72,940–$70,913 would significantly weaken the current recovery structure.
🧠 Market Structure & Liquidity
BTC's recent structure can be viewed as:
Liquidity Sweep → Accumulation → Higher Highs/Higher Lows → Breakout → Retest → Consolidation → Potential Continuation
The June/July lows created a major liquidity area, followed by a strong recovery and breakout through the previous consolidation range.
BTC is now attempting to establish acceptance above $77K. The next major structural test is the $82K–$82.9K region, where previous price action and the 0.382 Fibonacci level converge.
📊 RSI Momentum
RSI: 54.63
RSI MA: 63.57
RSI remains above the neutral 50 level, indicating that bullish momentum is still present.
However, RSI is below its moving average, showing that momentum has cooled from the recent spike. A move back above 60–63 would strengthen the continuation setup.
🎯 Key Levels
Resistance:
$77,447 → $78,510 → $79,614 → $80,620 → $82,070 → $82,919 → $89,282 → $95,645
Support:
$77,015 → $76,798 → $75,045 → $73,018 → $72,940 → $71,543 → $70,913
📌 Final Outlook
BTC remains in a constructive recovery structure while holding above the $75K–$77K zone and the major EMA support cluster.
The immediate battle is $77.4K–$80.6K. A decisive breakout above this region could send BTC toward $82K–$82.9K, while a confirmed break above $82,919 would open the path toward $89.2K → $95.6K → $104.7K.
On the downside, $75,045 is the key Fibonacci support, while $72.9K–$70.9K is the major structural defense.
Bias: 🟢 Bullish above $75,045 | Stronger above $82,919
$BTC
37
Đăng nhập để khám phá thêm nội dung
Tham gia cùng người dùng tiền mã hóa toàn cầu trên Binance Square
⚡️ Nhận thông tin mới nhất và hữu ích về tiền mã hóa.
💬 Được tin cậy bởi sàn giao dịch tiền mã hóa lớn nhất thế giới.
👍 Khám phá những thông tin chuyên sâu thực tế từ những nhà sáng tạo đã xác minh.
Email / Số điện thoại
Chủ đề thịnh hành
AIStocksWhatNext
83,605 lượt xem
1,030 đang thảo luận
Chia sẻ & Nhận thưởng Lưu lượng trong chiến dịch Hashtag Xu hướng của chúng tôi
✨Chủ đề: Những cơ hội đầu tư nào khác vẫn còn khi các cổ phiếu AI tiếp tục tăng?
👉Cách tham gia:
Đăng một bài viết ngắn hoặc bài viết kèm hashtag #AIStocksWhatNext
Chia sẻ bạn đang lạc quan hay bi quan, và đăng danh mục nắm giữ hoặc giao dịch cổ phiếu AI của bạn — việc sử dụng widget giao dịch có thể giúp bạn đủ điều kiện tốt hơn.
Bạn cũng có thể tăng sức thuyết phục cho bài đăng bằng cách chia sẻ dữ liệu hoặc biểu đồ và tránh sử dụng hình ảnh do AI tạo.
✍️Tạo nội dung dựa trên các góc dưới đây:
- Nvidia cho biết doanh số chip sẽ tăng gấp đôi vào năm tới, và các công ty AI hàng đầu tiếp tục đạt doanh thu kỷ lục, khoản chi cho năng lực tính toán phía sau điều đó còn đáng kinh ngạc hơn. Nhu cầu AI thực sự đang bùng nổ sao? Và có thể kéo dài trong bao lâu? Các cổ phiếu AI đang tăng trên toàn bảng. Đây có phải là một đợt bứt phá thật sự hay chỉ là một nhịp hồi ngắn hạn?
- Các nhà lãnh đạo ngành kêu gọi chậm lại việc phát triển AI, trong khi Trump dự định xây dựng “AI Force”, cho rằng AI có thể đóng góp 25% GDP của Mỹ trong tương lai. Bạn đứng về phía nào? Việc được hậu thuẫn ở cấp bang liệu có phải là một thắng lợi dài hạn cho các cổ phiếu AI không?
- Bạn có đang mua cổ phiếu AI không? Chia sẻ hoạt động giao dịch/nắm giữ liên quan đến AI của bạn với widget chia sẻ giao dịch của chúng tôi.
⏰Thời gian chiến dịch:
- 2026-09-22 7:00 - 2026-09-24 4:00 UTC
🎁Phần thưởng:
- Các bài đăng đủ điều kiện tuân thủ hướng dẫn trên và có hơn 100 từ sẽ được xem xét và có thể nhận một lượt tăng lưu lượng ngẫu nhiên từ 500 đến 3.000 lượt xem. Bạn sẽ nhận được thông báo từ thư ký feed nếu bài đăng của bạn được chọn.
- Nhận cơ hội để bài viết của bạn được đăng trên Binance Square Official
Cần ý tưởng cho bài đăng của bạn? Hãy truy cập trang chủ đề #AIStocksWhatNext hoặc Square Guide on How to Post for Better Reach.
Binance Square Official
·186 lượt thích
·274.8k lượt xem
TheoDõiFOMC
89,762 lượt xem
574 đang thảo luận
TinFed
80,173 lượt xem
380 đang thảo luận