
Arajlal Tudu
8 Bài đăng

Arajlal Tudu
Báo cáo
Chặn người dùng
Giao dịch mở
Trader thường xuyên
{thời gian} năm
0 Đang theo dõi
0 Người theo dõi
0 Đã thích
Bài đăng
Danh mục đầu tư
·
--
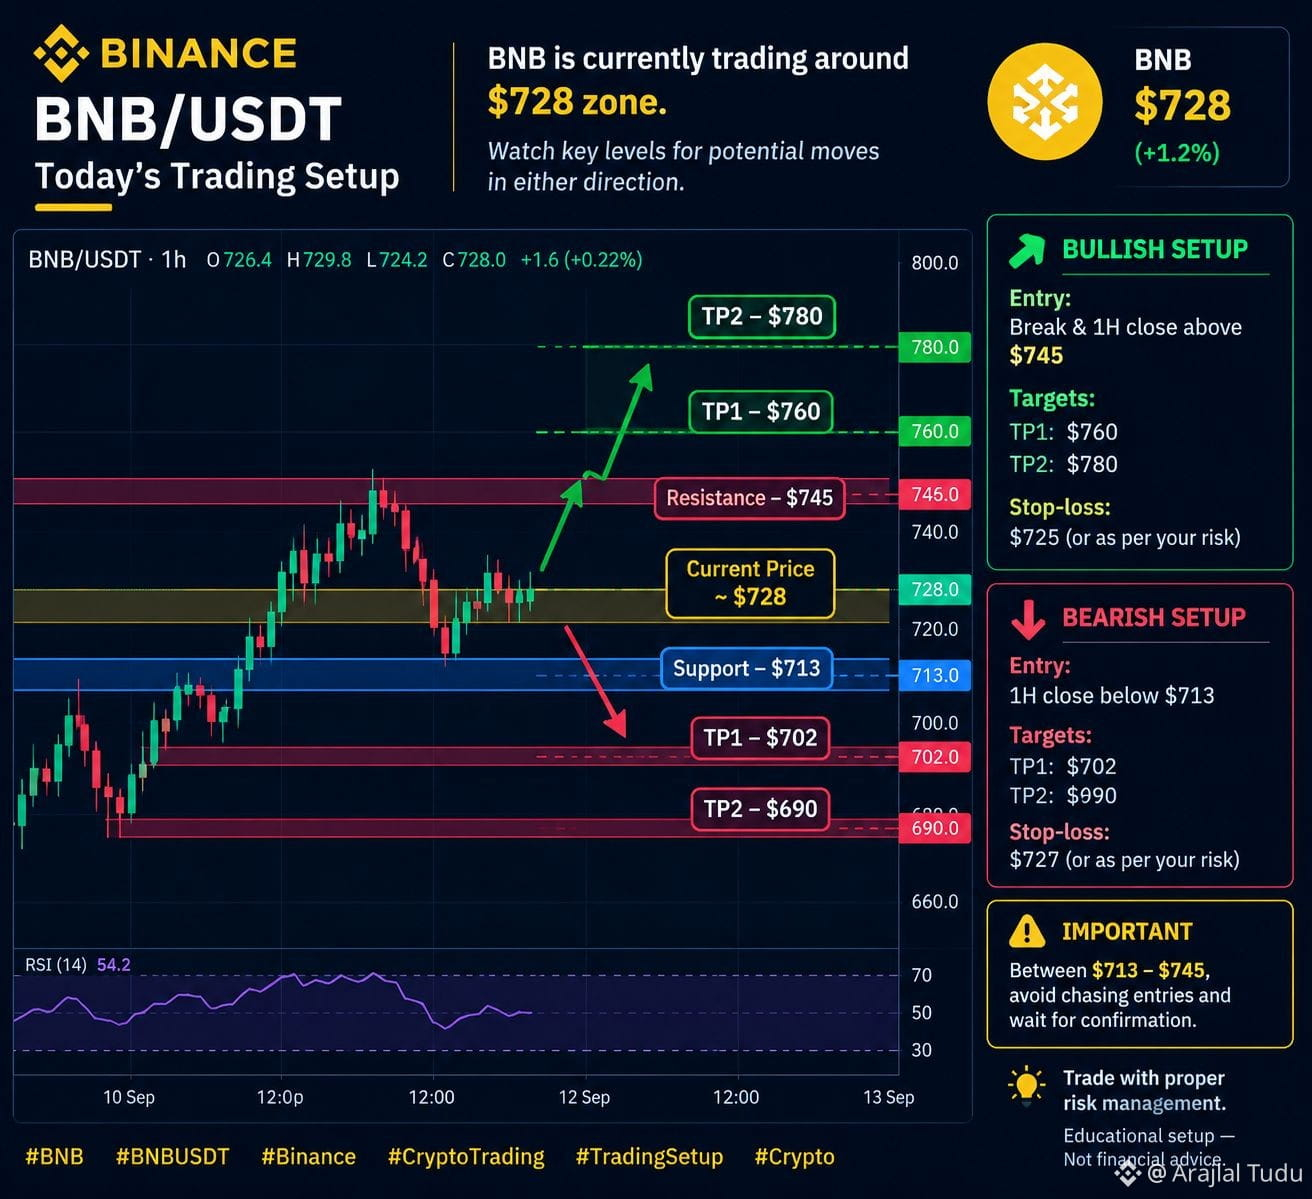
📊 Thiết lập giao dịch BNB/USDT hôm nay
BNB hiện đang giao dịch quanh vùng $728.
🟢 Thiết lập tăng giá:
Vượt & đóng cửa 1H trên $745
🎯 TP1: $760
🎯 TP2: $780
🔴 Thiết lập giảm giá:
Đóng cửa 1H dưới $713
🎯 TP1: $702
🎯 TP2: $690
⚠️ Giữa $713–$745, tránh đuổi theo lệnh và chờ xác nhận.$BNB
{spot}(BNBUSDT)
📊 Thiết lập giao dịch BNB/USDT hôm nay
BNB hiện đang giao dịch quanh vùng $728.
🟢 Thiết lập tăng giá:
Vượt & đóng cửa 1H trên $745
🎯 TP1: $760
🎯 TP2: $780
🔴 Thiết lập giảm giá:
Đóng cửa 1H dưới $713
🎯 TP1: $702
🎯 TP2: $690
⚠️ Giữa $713–$745, tránh đuổi theo lệnh và chờ xác nhận.$BNB
BNB hiện đang giao dịch quanh vùng $728.
🟢 Thiết lập tăng giá:
Vượt & đóng cửa 1H trên $745
🎯 TP1: $760
🎯 TP2: $780
🔴 Thiết lập giảm giá:
Đóng cửa 1H dưới $713
🎯 TP1: $702
🎯 TP2: $690
⚠️ Giữa $713–$745, tránh đuổi theo lệnh và chờ xác nhận.$BNB
38
·
--
Giảm giá
$NEAR
{spot}(NEARUSDT)
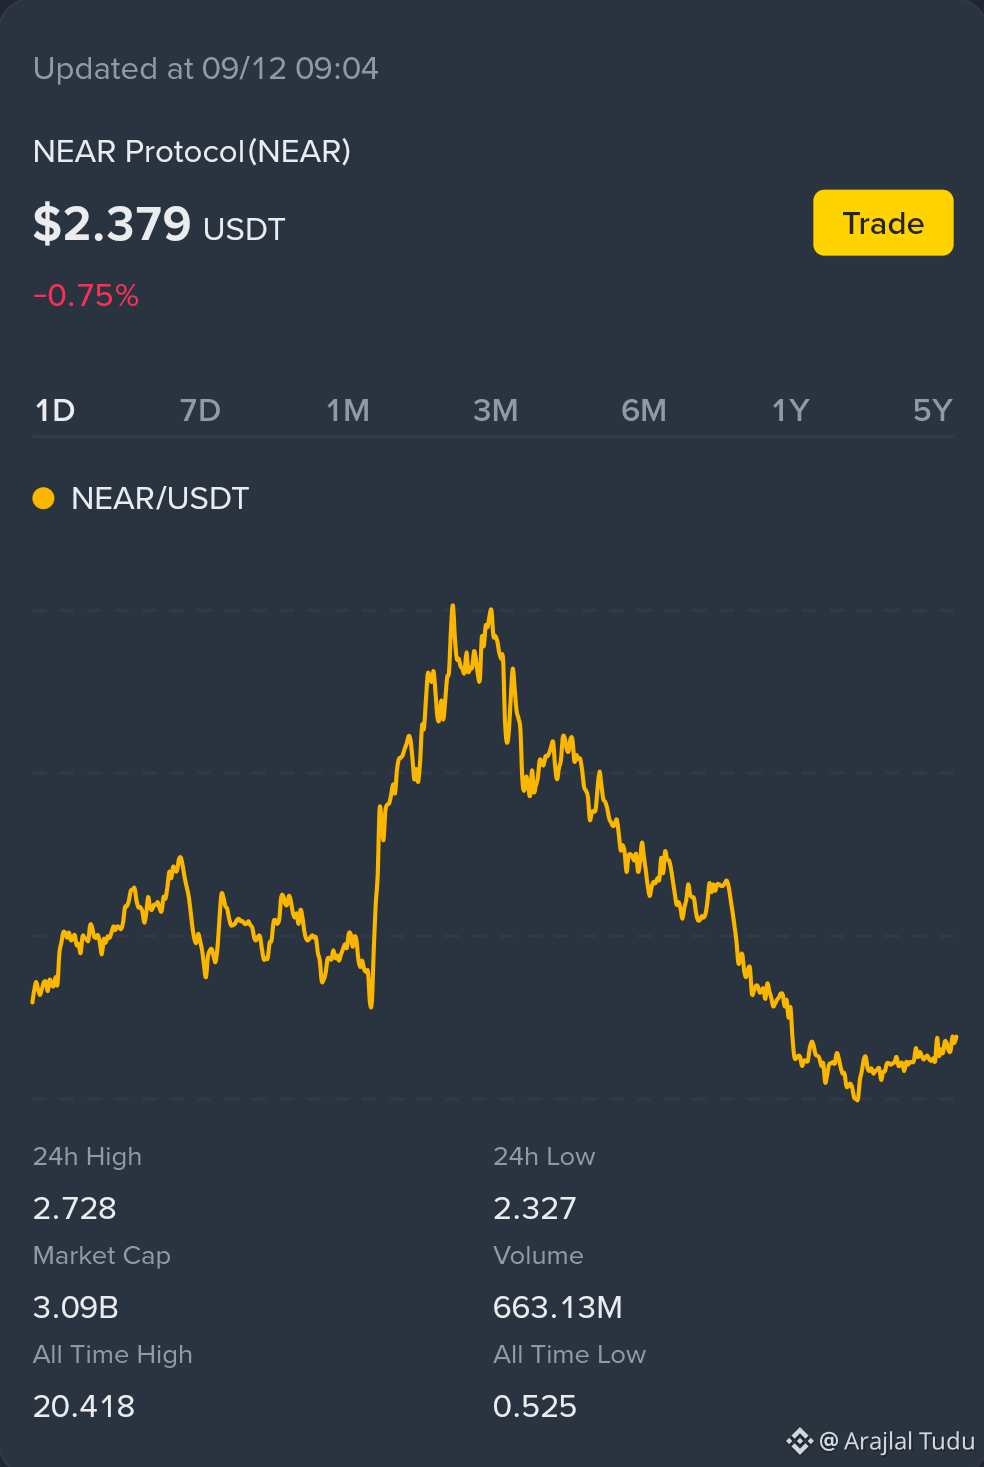
hiện quanh mức 2,38 USD vào ngày 2026-09-12, tăng +0,55% so với 00:00 UTC. Đưa ra lời khuyên đầu tư ở đây sẽ đồng nghĩa với việc quyết định xem nên chọn ý tưởng short sớm hơn hay giao dịch ngược lại; dữ liệu hiện tại chưa đủ để chắc chắn cho cả hai kịch bản.
Hãy dùng checklist này trước khi mạo hiểm tiền:
Giá và độ biến động: Biên độ 24 giờ gần đây của NEAR khá rộng—khoảng 2,33 đến 2,73 USD—vì vậy một vị thế sử dụng đòn bẩy có thể dao động mạnh theo cả hai hướng.
Cơ cấu vị thế: 66,7% tổng số tài khoản đang long, trong khi các nhà giao dịch hàng đầu đang long 74,2% theo giá trị vị thế. Nếu thị trường “đông” vị thế, các biến động có thể được khuếch đại khi trader buộc phải đóng lệnh.
Funding và lãi suất mở (open interest): Funding ở mức -0,0061%, nghĩa là shorts đã trả cho longs tại kỳ thanh toán gần nhất; open interest giảm -0,74% trong một giờ, cho thấy một số vị thế đang bị thu hẹp hơn là có sự gia tăng mạnh về niềm tin mới.
Động lượng: RSI khung 1 giờ đang ở trạng thái quá bán, có thể cùng tồn tại với sự suy yếu tiếp diễn nhưng cũng làm tăng khả năng xảy ra một nhịp bật lại nhanh.
Rủi ro chính khi hành động ngay lúc này là đòn bẩy chéo 20× có thể khuếch đại một đợt đảo chiều nhỏ thành khoản lỗ lớn và có thể rút thêm từ số dư futures của bạn. Rủi ro của việc không hành động là bỏ lỡ một đợt tăng/giảm tiếp theo nếu thị trường tiếp tục đi theo hướng bạn kỳ vọng. Chỉ cân nhắc số tiền bạn có thể chấp nhận mất, khung thời gian của bạn, và mức lỗ tối đa mà cá nhân bạn thấy thoải mái trước khi đưa ra quyết định độc lập.$NEAR $USDT
$NEAR
hiện quanh mức 2,38 USD vào ngày 2026-09-12, tăng +0,55% so với 00:00 UTC. Đưa ra lời khuyên đầu tư ở đây sẽ đồng nghĩa với việc quyết định xem nên chọn ý tưởng short sớm hơn hay giao dịch ngược lại; dữ liệu hiện tại chưa đủ để chắc chắn cho cả hai kịch bản.
Hãy dùng checklist này trước khi mạo hiểm tiền:
Giá và độ biến động: Biên độ 24 giờ gần đây của NEAR khá rộng—khoảng 2,33 đến 2,73 USD—vì vậy một vị thế sử dụng đòn bẩy có thể dao động mạnh theo cả hai hướng.
Cơ cấu vị thế: 66,7% tổng số tài khoản đang long, trong khi các nhà giao dịch hàng đầu đang long 74,2% theo giá trị vị thế. Nếu thị trường “đông” vị thế, các biến động có thể được khuếch đại khi trader buộc phải đóng lệnh.
Funding và lãi suất mở (open interest): Funding ở mức -0,0061%, nghĩa là shorts đã trả cho longs tại kỳ thanh toán gần nhất; open interest giảm -0,74% trong một giờ, cho thấy một số vị thế đang bị thu hẹp hơn là có sự gia tăng mạnh về niềm tin mới.
Động lượng: RSI khung 1 giờ đang ở trạng thái quá bán, có thể cùng tồn tại với sự suy yếu tiếp diễn nhưng cũng làm tăng khả năng xảy ra một nhịp bật lại nhanh.
Rủi ro chính khi hành động ngay lúc này là đòn bẩy chéo 20× có thể khuếch đại một đợt đảo chiều nhỏ thành khoản lỗ lớn và có thể rút thêm từ số dư futures của bạn. Rủi ro của việc không hành động là bỏ lỡ một đợt tăng/giảm tiếp theo nếu thị trường tiếp tục đi theo hướng bạn kỳ vọng. Chỉ cân nhắc số tiền bạn có thể chấp nhận mất, khung thời gian của bạn, và mức lỗ tối đa mà cá nhân bạn thấy thoải mái trước khi đưa ra quyết định độc lập.$NEAR $USDT
hiện quanh mức 2,38 USD vào ngày 2026-09-12, tăng +0,55% so với 00:00 UTC. Đưa ra lời khuyên đầu tư ở đây sẽ đồng nghĩa với việc quyết định xem nên chọn ý tưởng short sớm hơn hay giao dịch ngược lại; dữ liệu hiện tại chưa đủ để chắc chắn cho cả hai kịch bản.
Hãy dùng checklist này trước khi mạo hiểm tiền:
Giá và độ biến động: Biên độ 24 giờ gần đây của NEAR khá rộng—khoảng 2,33 đến 2,73 USD—vì vậy một vị thế sử dụng đòn bẩy có thể dao động mạnh theo cả hai hướng.
Cơ cấu vị thế: 66,7% tổng số tài khoản đang long, trong khi các nhà giao dịch hàng đầu đang long 74,2% theo giá trị vị thế. Nếu thị trường “đông” vị thế, các biến động có thể được khuếch đại khi trader buộc phải đóng lệnh.
Funding và lãi suất mở (open interest): Funding ở mức -0,0061%, nghĩa là shorts đã trả cho longs tại kỳ thanh toán gần nhất; open interest giảm -0,74% trong một giờ, cho thấy một số vị thế đang bị thu hẹp hơn là có sự gia tăng mạnh về niềm tin mới.
Động lượng: RSI khung 1 giờ đang ở trạng thái quá bán, có thể cùng tồn tại với sự suy yếu tiếp diễn nhưng cũng làm tăng khả năng xảy ra một nhịp bật lại nhanh.
Rủi ro chính khi hành động ngay lúc này là đòn bẩy chéo 20× có thể khuếch đại một đợt đảo chiều nhỏ thành khoản lỗ lớn và có thể rút thêm từ số dư futures của bạn. Rủi ro của việc không hành động là bỏ lỡ một đợt tăng/giảm tiếp theo nếu thị trường tiếp tục đi theo hướng bạn kỳ vọng. Chỉ cân nhắc số tiền bạn có thể chấp nhận mất, khung thời gian của bạn, và mức lỗ tối đa mà cá nhân bạn thấy thoải mái trước khi đưa ra quyết định độc lập.$NEAR $USDT
72
·
--
Giảm giá
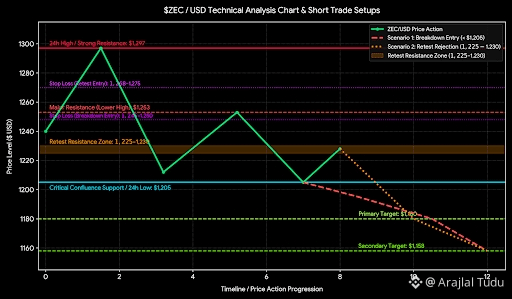
$ZEC Phân tích kỹ thuật & Tổng quan thiết lập
| Thông số chính | Mức giá / Vùng | Mô tả |
|---|---|---|
| Đỉnh 24h (Kháng cự mạnh) | $1,297 | Đỉnh lớn với sự từ chối (reject) mạnh kèm khối lượng cao. |
| Kháng cự chính | $1,253 | Đỉnh thấp hơn xác nhận cấu trúc xu hướng giảm ngắn hạn. |
| Vùng kháng cự cần kiểm tra lại | $1,225 – $1,230 | Vùng kháng cự chuyển từ hỗ trợ cũ, phù hợp cho các lệnh retest có xác suất cao. |
| Hỗ trợ hội tụ quan trọng (Confluence) | $1,205 | Đáy 24h; mức kích hoạt chính cho kịch bản phá vỡ. |
| Mục tiêu chính | $1,180 | Mục tiêu hỗ trợ ngay sau khi phá vỡ. |
| Mục tiêu phụ | $1,158 | Vùng mục tiêu mở rộng nếu áp lực bán tăng tốc. |
Các kịch bản thực hiện giao dịch
1. Vào lệnh khi phá vỡ (Nằm dưới $1,205)
* Kích hoạt: Nến đóng dứt khoát dưới mức hỗ trợ $1,205.
* Cắt lỗ: $1,245 – $1,250 (Rủi ro: ~$40–$45)
* Mục tiêu: $1,180 (Chính) / $1,158 (Phụ)
2. Vào lệnh khi bị từ chối ở lần retest ($1,225 – $1,230)
* Kích hoạt: Phục hồi thất bại (relief rally) đi vào vùng hỗ trợ cũ đã trở thành kháng cự, kèm dấu hiệu bên bán chiếm ưu thế.
* Cắt lỗ: $1,268 – $1,275 (Rủi ro: ~$40–$47)
* Mục tiêu: $1,180 (Chính) / $1,158 (Phụ) (Tỷ lệ Rủi ro/Lợi nhuận: ~1:1.6 so với mục tiêu phụ)$ZEC
{future}(ZECUSDT)
$ZEC Phân tích kỹ thuật & Tổng quan thiết lập
| Thông số chính | Mức giá / Vùng | Mô tả |
|---|---|---|
| Đỉnh 24h (Kháng cự mạnh) | $1,297 | Đỉnh lớn với sự từ chối (reject) mạnh kèm khối lượng cao. |
| Kháng cự chính | $1,253 | Đỉnh thấp hơn xác nhận cấu trúc xu hướng giảm ngắn hạn. |
| Vùng kháng cự cần kiểm tra lại | $1,225 – $1,230 | Vùng kháng cự chuyển từ hỗ trợ cũ, phù hợp cho các lệnh retest có xác suất cao. |
| Hỗ trợ hội tụ quan trọng (Confluence) | $1,205 | Đáy 24h; mức kích hoạt chính cho kịch bản phá vỡ. |
| Mục tiêu chính | $1,180 | Mục tiêu hỗ trợ ngay sau khi phá vỡ. |
| Mục tiêu phụ | $1,158 | Vùng mục tiêu mở rộng nếu áp lực bán tăng tốc. |
Các kịch bản thực hiện giao dịch
1. Vào lệnh khi phá vỡ (Nằm dưới $1,205)
* Kích hoạt: Nến đóng dứt khoát dưới mức hỗ trợ $1,205.
* Cắt lỗ: $1,245 – $1,250 (Rủi ro: ~$40–$45)
* Mục tiêu: $1,180 (Chính) / $1,158 (Phụ)
2. Vào lệnh khi bị từ chối ở lần retest ($1,225 – $1,230)
* Kích hoạt: Phục hồi thất bại (relief rally) đi vào vùng hỗ trợ cũ đã trở thành kháng cự, kèm dấu hiệu bên bán chiếm ưu thế.
* Cắt lỗ: $1,268 – $1,275 (Rủi ro: ~$40–$47)
* Mục tiêu: $1,180 (Chính) / $1,158 (Phụ) (Tỷ lệ Rủi ro/Lợi nhuận: ~1:1.6 so với mục tiêu phụ)$ZEC
| Thông số chính | Mức giá / Vùng | Mô tả |
|---|---|---|
| Đỉnh 24h (Kháng cự mạnh) | $1,297 | Đỉnh lớn với sự từ chối (reject) mạnh kèm khối lượng cao. |
| Kháng cự chính | $1,253 | Đỉnh thấp hơn xác nhận cấu trúc xu hướng giảm ngắn hạn. |
| Vùng kháng cự cần kiểm tra lại | $1,225 – $1,230 | Vùng kháng cự chuyển từ hỗ trợ cũ, phù hợp cho các lệnh retest có xác suất cao. |
| Hỗ trợ hội tụ quan trọng (Confluence) | $1,205 | Đáy 24h; mức kích hoạt chính cho kịch bản phá vỡ. |
| Mục tiêu chính | $1,180 | Mục tiêu hỗ trợ ngay sau khi phá vỡ. |
| Mục tiêu phụ | $1,158 | Vùng mục tiêu mở rộng nếu áp lực bán tăng tốc. |
Các kịch bản thực hiện giao dịch
1. Vào lệnh khi phá vỡ (Nằm dưới $1,205)
* Kích hoạt: Nến đóng dứt khoát dưới mức hỗ trợ $1,205.
* Cắt lỗ: $1,245 – $1,250 (Rủi ro: ~$40–$45)
* Mục tiêu: $1,180 (Chính) / $1,158 (Phụ)
2. Vào lệnh khi bị từ chối ở lần retest ($1,225 – $1,230)
* Kích hoạt: Phục hồi thất bại (relief rally) đi vào vùng hỗ trợ cũ đã trở thành kháng cự, kèm dấu hiệu bên bán chiếm ưu thế.
* Cắt lỗ: $1,268 – $1,275 (Rủi ro: ~$40–$47)
* Mục tiêu: $1,180 (Chính) / $1,158 (Phụ) (Tỷ lệ Rủi ro/Lợi nhuận: ~1:1.6 so với mục tiêu phụ)$ZEC
211
·
--
Tăng giá
Xem bản dịch
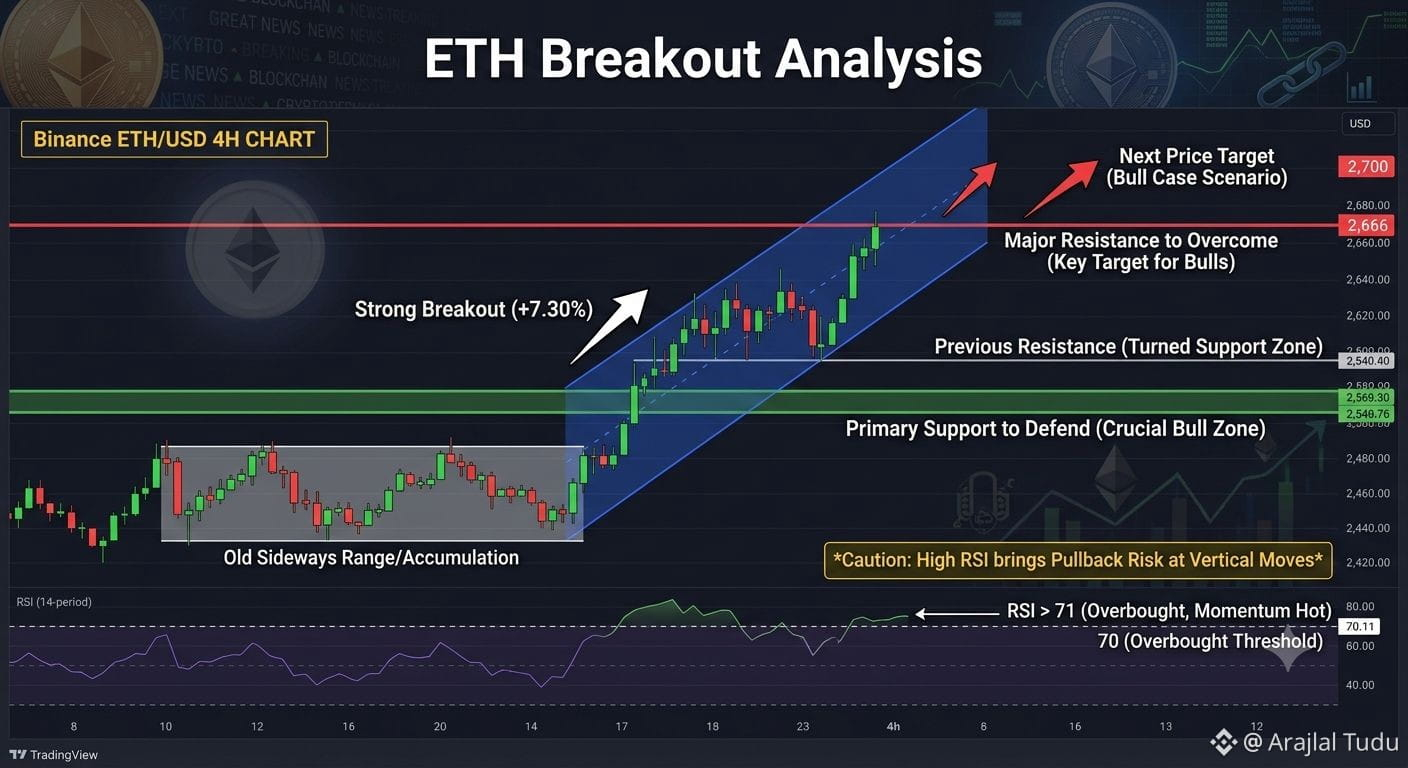
ET"ETH surges 7.30% in 24 hours. Buyers finally break the sideways range and push price toward $2,610.
The rally punched through $2,500–$2,540 and reached $2,666 before sellers stepped in. Now $2,666 is the level to beat. A strong 4-hour close above this resistance puts $2,700 in focus.
The bulls need to defend $2,540–$2,565. Hold this support, and the breakout keeps its strength. Lose $2,540, and $2,500 comes back into play.
RSI is already above 71. Momentum is hot, but chasing a vertical candle brings pullback risk. The next strong signal is buyers defending support and pushing through $2,666." means that ETH has risen sharply—7.30% over one day—and has moved out of a period where its price was trading mostly sideways.
The post identifies $2,666 as resistance, meaning it is a price area where selling pressure appeared. If ETH closes a 4-hour candle clearly above that level, it may indicate that buyers remain in control and that the market could then watch the $2,700 area.
It also highlights $2,540–$2,565 as support. This is the zone buyers would ideally need to hold to show that the breakout is still healthy. If ETH falls below about $2,540, the earlier $2,500 level may become relevant again as a possible area of market interest.
Finally, an RSI above 71 suggests momentum is strong but also relatively stretched. In simple terms, ETH has moved up quickly, so a short-term pullback or consolidation is possible. The post is not saying a pullback must happen; it is saying traders may look for confirmation through buyers holding the support zone and later overcoming the $2,666 resistance.$ETH $ETH
{spot}(ETHUSDT)
ET"ETH surges 7.30% in 24 hours. Buyers finally break the sideways range and push price toward $2,610.
The rally punched through $2,500–$2,540 and reached $2,666 before sellers stepped in. Now $2,666 is the level to beat. A strong 4-hour close above this resistance puts $2,700 in focus.
The bulls need to defend $2,540–$2,565. Hold this support, and the breakout keeps its strength. Lose $2,540, and $2,500 comes back into play.
RSI is already above 71. Momentum is hot, but chasing a vertical candle brings pullback risk. The next strong signal is buyers defending support and pushing through $2,666." means that ETH has risen sharply—7.30% over one day—and has moved out of a period where its price was trading mostly sideways.
The post identifies $2,666 as resistance, meaning it is a price area where selling pressure appeared. If ETH closes a 4-hour candle clearly above that level, it may indicate that buyers remain in control and that the market could then watch the $2,700 area.
It also highlights $2,540–$2,565 as support. This is the zone buyers would ideally need to hold to show that the breakout is still healthy. If ETH falls below about $2,540, the earlier $2,500 level may become relevant again as a possible area of market interest.
Finally, an RSI above 71 suggests momentum is strong but also relatively stretched. In simple terms, ETH has moved up quickly, so a short-term pullback or consolidation is possible. The post is not saying a pullback must happen; it is saying traders may look for confirmation through buyers holding the support zone and later overcoming the $2,666 resistance.$ETH $ETH
The rally punched through $2,500–$2,540 and reached $2,666 before sellers stepped in. Now $2,666 is the level to beat. A strong 4-hour close above this resistance puts $2,700 in focus.
The bulls need to defend $2,540–$2,565. Hold this support, and the breakout keeps its strength. Lose $2,540, and $2,500 comes back into play.
RSI is already above 71. Momentum is hot, but chasing a vertical candle brings pullback risk. The next strong signal is buyers defending support and pushing through $2,666." means that ETH has risen sharply—7.30% over one day—and has moved out of a period where its price was trading mostly sideways.
The post identifies $2,666 as resistance, meaning it is a price area where selling pressure appeared. If ETH closes a 4-hour candle clearly above that level, it may indicate that buyers remain in control and that the market could then watch the $2,700 area.
It also highlights $2,540–$2,565 as support. This is the zone buyers would ideally need to hold to show that the breakout is still healthy. If ETH falls below about $2,540, the earlier $2,500 level may become relevant again as a possible area of market interest.
Finally, an RSI above 71 suggests momentum is strong but also relatively stretched. In simple terms, ETH has moved up quickly, so a short-term pullback or consolidation is possible. The post is not saying a pullback must happen; it is saying traders may look for confirmation through buyers holding the support zone and later overcoming the $2,666 resistance.$ETH $ETH
65
·
--
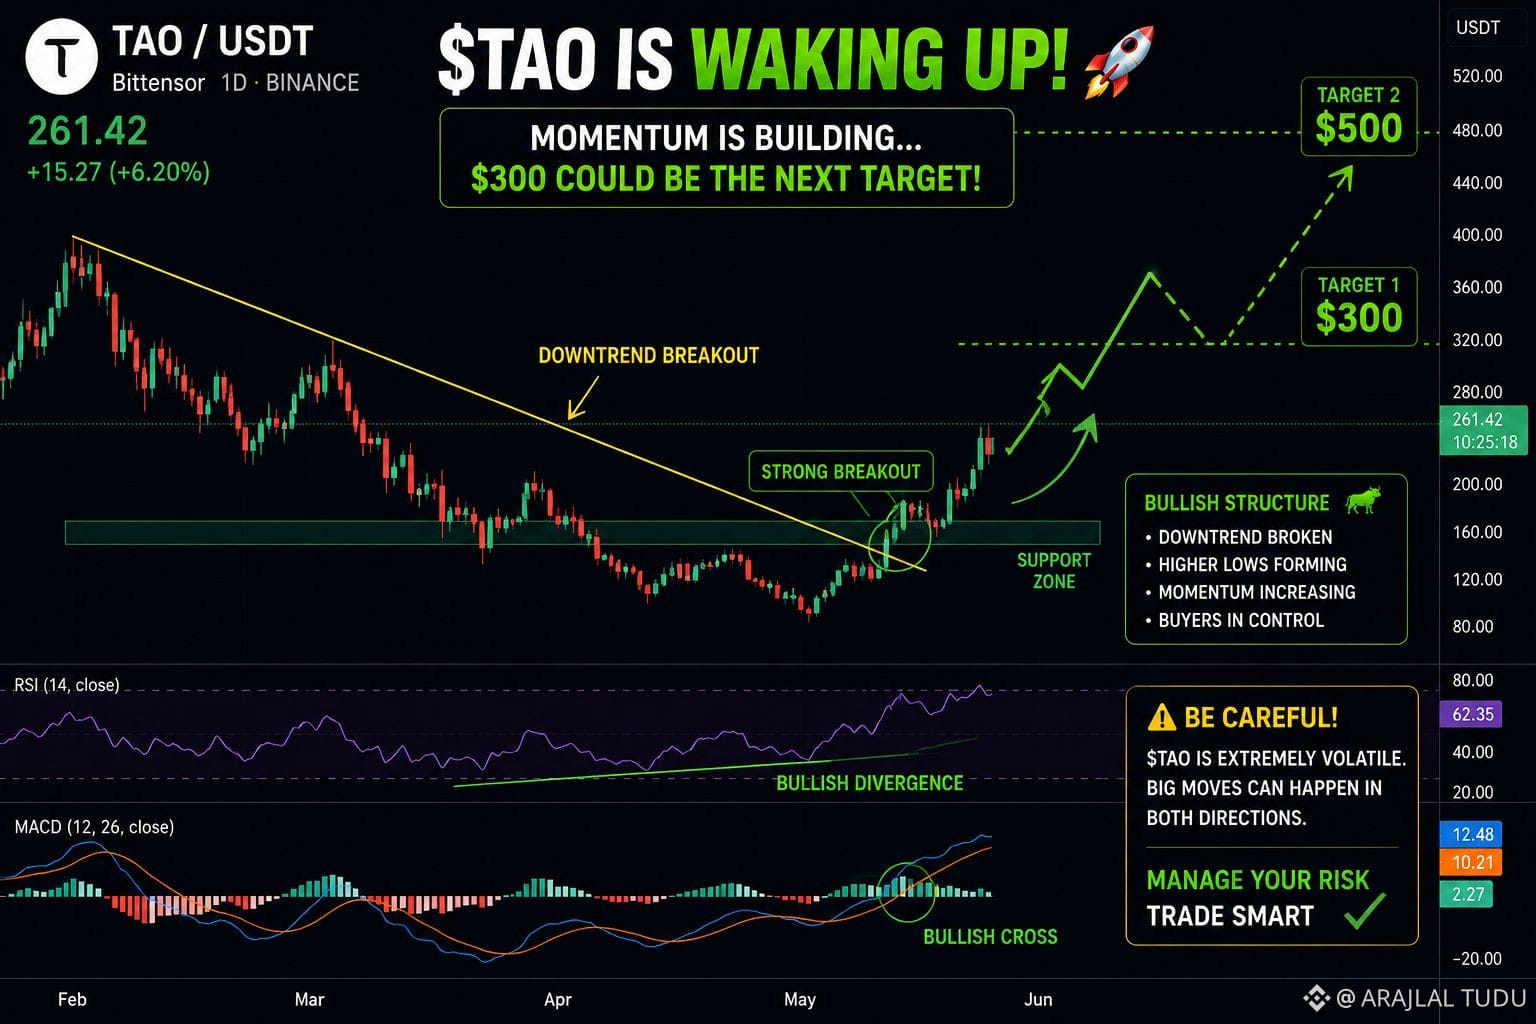
🚨 $TAO ĐANG TỈNH GIẤC! 👀🔥
Điều gì đó thú vị đang xảy ra với $TAO…
Nếu đà tăng tiếp tục và người mua nhập cuộc mạnh mẽ, $300 có thể trở thành mục tiêu lớn tiếp theo. 🚀
Và nếu phe bò thực sự nắm quyền kiểm soát… liệu cuối cùng chúng ta có thể thấy $500 không? 👀💰
Nhưng đừng quá phấn khích — $TAO nổi tiếng với mức biến động cực lớn. Một biến động mạnh có thể xảy ra theo cả hai hướng. ⚠️
📌 Theo dõi đà tăng
📌 Quản lý rủi ro của bạn
📌 Đừng FOMO vào một cú pump
Câu hỏi thực sự là:
Liệu $TAO có đang chuẩn bị cho một cú bứt phá lớn hơn không? 🚀
Mục tiêu $TAO của bạn là gì? 👇
$300, $500, hay thậm chí cao hơn?
#TAO #Bittensor #Crypto #BinanceSquare #Altcoins #CryptoTrading #Trading
🚨 $TAO ĐANG TỈNH GIẤC! 👀🔥
Điều gì đó thú vị đang xảy ra với $TAO…
Nếu đà tăng tiếp tục và người mua nhập cuộc mạnh mẽ, $300 có thể trở thành mục tiêu lớn tiếp theo. 🚀
Và nếu phe bò thực sự nắm quyền kiểm soát… liệu cuối cùng chúng ta có thể thấy $500 không? 👀💰
Nhưng đừng quá phấn khích — $TAO nổi tiếng với mức biến động cực lớn. Một biến động mạnh có thể xảy ra theo cả hai hướng. ⚠️
📌 Theo dõi đà tăng
📌 Quản lý rủi ro của bạn
📌 Đừng FOMO vào một cú pump
Câu hỏi thực sự là:
Liệu $TAO có đang chuẩn bị cho một cú bứt phá lớn hơn không? 🚀
Mục tiêu $TAO của bạn là gì? 👇
$300, $500, hay thậm chí cao hơn?
#TAO #Bittensor #Crypto #BinanceSquare #Altcoins #CryptoTrading #Trading
Điều gì đó thú vị đang xảy ra với $TAO…
Nếu đà tăng tiếp tục và người mua nhập cuộc mạnh mẽ, $300 có thể trở thành mục tiêu lớn tiếp theo. 🚀
Và nếu phe bò thực sự nắm quyền kiểm soát… liệu cuối cùng chúng ta có thể thấy $500 không? 👀💰
Nhưng đừng quá phấn khích — $TAO nổi tiếng với mức biến động cực lớn. Một biến động mạnh có thể xảy ra theo cả hai hướng. ⚠️
📌 Theo dõi đà tăng
📌 Quản lý rủi ro của bạn
📌 Đừng FOMO vào một cú pump
Câu hỏi thực sự là:
Liệu $TAO có đang chuẩn bị cho một cú bứt phá lớn hơn không? 🚀
Mục tiêu $TAO của bạn là gì? 👇
$300, $500, hay thậm chí cao hơn?
#TAO #Bittensor #Crypto #BinanceSquare #Altcoins #CryptoTrading #Trading
106
·
--
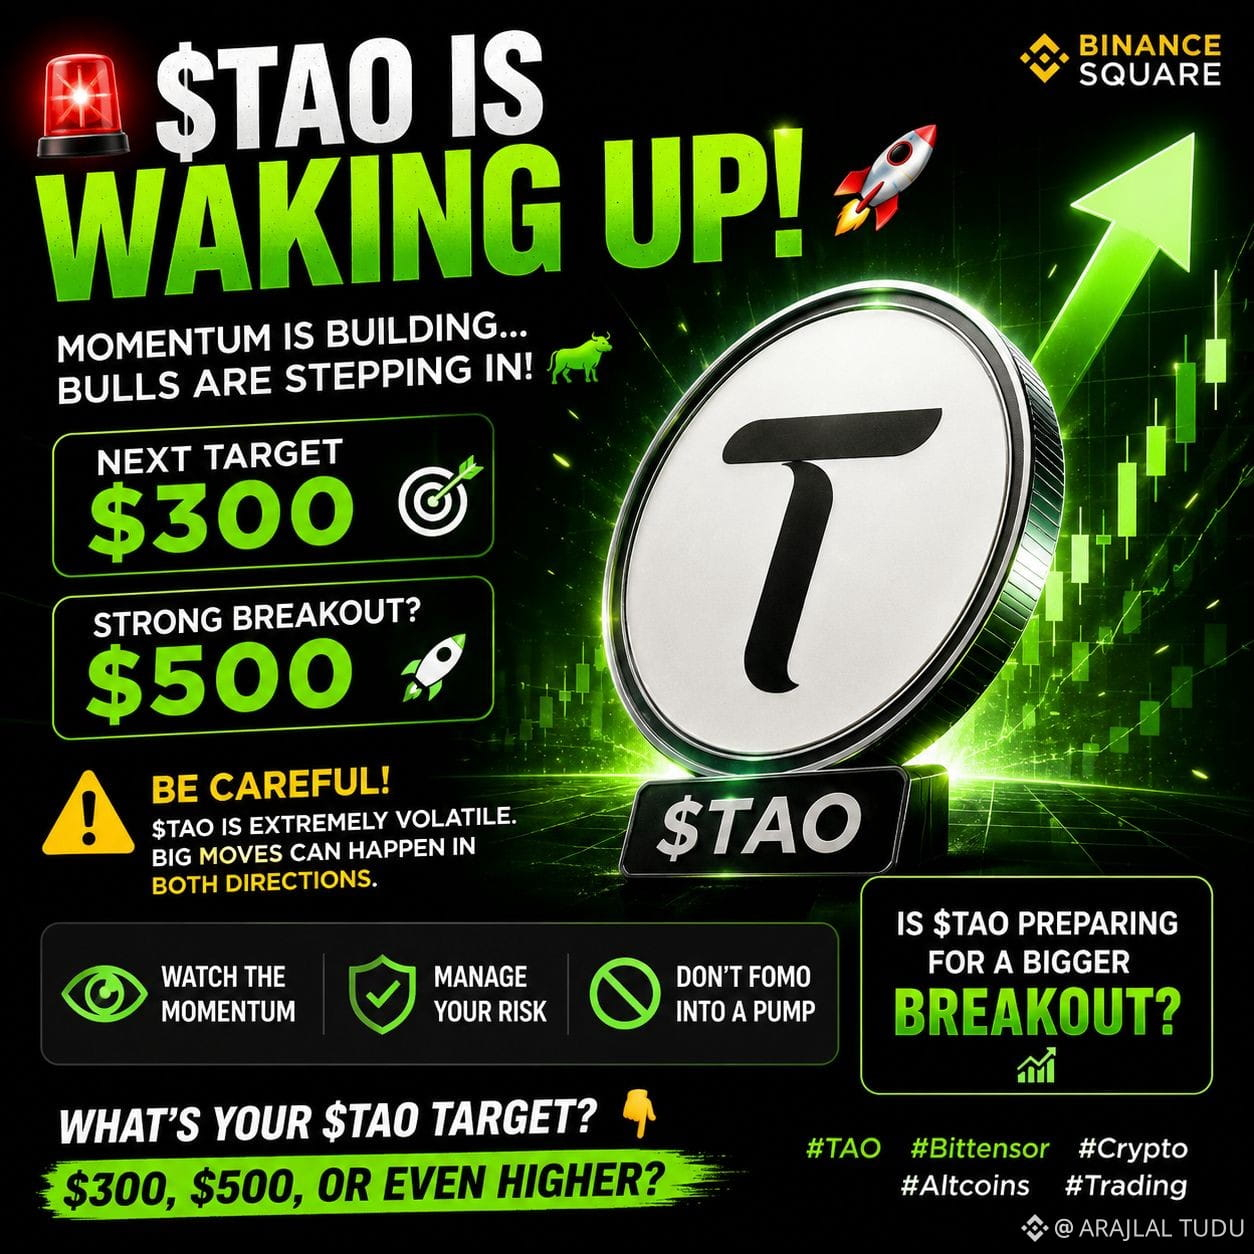
🚨 $TAO ĐANG TỈNH GIẤC! 🔥
$300 có thể là mục tiêu lớn tiếp theo nếu đà tăng tiếp tục. Và nếu $TAO tạo được một cú bứt phá mạnh, $500 không phải là không thể. 🚀
Nhưng hãy nhớ — $TAO biến động rất mạnh, và thị trường crypto có thể di chuyển nhanh theo cả hai hướng. ⚠️
Giao dịch thông minh. Quản lý rủi ro của bạn. Đừng bao giờ FOMO. 📊
Liệu $TAO có đang chuẩn bị cho cú di chuyển lớn tiếp theo? 👀🔥
#TAO #Bittensor #Crypto #Trading #Altcoins #CryptoTrading
#ZECHitsANewAllTimeHigh
🚨 $TAO ĐANG TỈNH GIẤC! 🔥
$300 có thể là mục tiêu lớn tiếp theo nếu đà tăng tiếp tục. Và nếu $TAO tạo được một cú bứt phá mạnh, $500 không phải là không thể. 🚀
Nhưng hãy nhớ — $TAO biến động rất mạnh, và thị trường crypto có thể di chuyển nhanh theo cả hai hướng. ⚠️
Giao dịch thông minh. Quản lý rủi ro của bạn. Đừng bao giờ FOMO. 📊
Liệu $TAO có đang chuẩn bị cho cú di chuyển lớn tiếp theo? 👀🔥
#TAO #Bittensor #Crypto #Trading #Altcoins #CryptoTrading
#ZECHitsANewAllTimeHigh
$300 có thể là mục tiêu lớn tiếp theo nếu đà tăng tiếp tục. Và nếu $TAO tạo được một cú bứt phá mạnh, $500 không phải là không thể. 🚀
Nhưng hãy nhớ — $TAO biến động rất mạnh, và thị trường crypto có thể di chuyển nhanh theo cả hai hướng. ⚠️
Giao dịch thông minh. Quản lý rủi ro của bạn. Đừng bao giờ FOMO. 📊
Liệu $TAO có đang chuẩn bị cho cú di chuyển lớn tiếp theo? 👀🔥
#TAO #Bittensor #Crypto #Trading #Altcoins #CryptoTrading
#ZECHitsANewAllTimeHigh
276
·
--
Xem bản dịch
#USAugustAvgHourlyEarningsRise3.1% This trade highlights a classic high-leverage trap: trading against a strong macro trend without a clear setup.
Key Observations
Metric / ParameterValueDetails & TakeawaysAsset / PairETHUSDT PerpEthereum USDT Perpetual ContractLeverage31xVery high leverage; leaves virtually no room for market noise or small pullbacks.DirectionShort (S)Sold at 2,458.30 and bought back to close (B) at 2,456.81.Realized PNL-$0.08 (-1.22%)Position closed in a loss despite closing at a lower price than entry.
Critical Issues with this Setup
Fading a Strong Uptrend:
Look at the line chart on the left of the entry point: ETH experienced an aggressive, steep upward rally.
Taking a Short position right after a sharp vertical spike is "catching a falling knife" in reverse (fading momentum). Unless there was a strong resistance level on higher timeframes, shorting strong momentum usually leads to getting stopped out.
Negative PNL Despite Price Drop:
Entry price was 2,458.30 and close price was 2,456.81 (a ~$1.50 drop in price).
Ordinarily, a short trade would profit from a price drop. However, the realized PNL is negative (-$0.08) because high leverage (31x) combined with exchange trading fees and funding rates completely ate the tiny gain.
Risk Management with 31x Leverage:
At 31x leverage, a ~3.2% move against your position results in a 100% loss (liquidation).
Notice how price continued moving upward right after entry before dropping. That drawdown likely triggered fear or a tight stop-loss.
Key Takeaways for Future Trades
Trade with the Trend: Avoid shorting strong upward candles unless a clear higher-timeframe breakdown or reversal pattern forms.
Account for Fees on High Leverage: High leverage inflates position size, which dramatically increases trading fees relative to your margin. Small price moves often won't cover taker fees.
Lower the Leverage: Reducing leverage (e.g., 3x–5x) gives trades room to breathe and reduces emotional decision-making caused by steep drawdowns.
#USAugustAvgHourlyEarningsRise3.1% This trade highlights a classic high-leverage trap: trading against a strong macro trend without a clear setup.
Key Observations
Metric / ParameterValueDetails & TakeawaysAsset / PairETHUSDT PerpEthereum USDT Perpetual ContractLeverage31xVery high leverage; leaves virtually no room for market noise or small pullbacks.DirectionShort (S)Sold at 2,458.30 and bought back to close (B) at 2,456.81.Realized PNL-$0.08 (-1.22%)Position closed in a loss despite closing at a lower price than entry.
Critical Issues with this Setup
Fading a Strong Uptrend:
Look at the line chart on the left of the entry point: ETH experienced an aggressive, steep upward rally.
Taking a Short position right after a sharp vertical spike is "catching a falling knife" in reverse (fading momentum). Unless there was a strong resistance level on higher timeframes, shorting strong momentum usually leads to getting stopped out.
Negative PNL Despite Price Drop:
Entry price was 2,458.30 and close price was 2,456.81 (a ~$1.50 drop in price).
Ordinarily, a short trade would profit from a price drop. However, the realized PNL is negative (-$0.08) because high leverage (31x) combined with exchange trading fees and funding rates completely ate the tiny gain.
Risk Management with 31x Leverage:
At 31x leverage, a ~3.2% move against your position results in a 100% loss (liquidation).
Notice how price continued moving upward right after entry before dropping. That drawdown likely triggered fear or a tight stop-loss.
Key Takeaways for Future Trades
Trade with the Trend: Avoid shorting strong upward candles unless a clear higher-timeframe breakdown or reversal pattern forms.
Account for Fees on High Leverage: High leverage inflates position size, which dramatically increases trading fees relative to your margin. Small price moves often won't cover taker fees.
Lower the Leverage: Reducing leverage (e.g., 3x–5x) gives trades room to breathe and reduces emotional decision-making caused by steep drawdowns.
Key Observations
Metric / ParameterValueDetails & TakeawaysAsset / PairETHUSDT PerpEthereum USDT Perpetual ContractLeverage31xVery high leverage; leaves virtually no room for market noise or small pullbacks.DirectionShort (S)Sold at 2,458.30 and bought back to close (B) at 2,456.81.Realized PNL-$0.08 (-1.22%)Position closed in a loss despite closing at a lower price than entry.
Critical Issues with this Setup
Fading a Strong Uptrend:
Look at the line chart on the left of the entry point: ETH experienced an aggressive, steep upward rally.
Taking a Short position right after a sharp vertical spike is "catching a falling knife" in reverse (fading momentum). Unless there was a strong resistance level on higher timeframes, shorting strong momentum usually leads to getting stopped out.
Negative PNL Despite Price Drop:
Entry price was 2,458.30 and close price was 2,456.81 (a ~$1.50 drop in price).
Ordinarily, a short trade would profit from a price drop. However, the realized PNL is negative (-$0.08) because high leverage (31x) combined with exchange trading fees and funding rates completely ate the tiny gain.
Risk Management with 31x Leverage:
At 31x leverage, a ~3.2% move against your position results in a 100% loss (liquidation).
Notice how price continued moving upward right after entry before dropping. That drawdown likely triggered fear or a tight stop-loss.
Key Takeaways for Future Trades
Trade with the Trend: Avoid shorting strong upward candles unless a clear higher-timeframe breakdown or reversal pattern forms.
Account for Fees on High Leverage: High leverage inflates position size, which dramatically increases trading fees relative to your margin. Small price moves often won't cover taker fees.
Lower the Leverage: Reducing leverage (e.g., 3x–5x) gives trades room to breathe and reduces emotional decision-making caused by steep drawdowns.
90
·
--
Xem bản dịch
This trade caught a minor loss of -$0.40 (-6.36%), primarily due to high leverage rather than a large price movement in Ethereum.
Trade Breakdown
Pair: ETHUSDT Perpetual
Direction: Long (Buy "B")
Leverage: 31X
Entry Price: $2,449.07
Close Price: $2,446.49
Price Movement: The price dropped by only $2.58 (~0.105%), but at 31x leverage, that tiny drop amplified into a 6.36% loss on your margin position.
Key Observations
Leverage Sensitivity: High leverage (31x) leaves almost zero room for normal market noise or minor pullbacks. Even a fraction of a percent fluctuation moves your PNL significantly.
Timing / Entry: Looking at the chart visual, the buy order ('B') was placed near a local low, but after a small bounce, the market didn't make a sustained higher high before rolling back down to the close point ('S').
Risk Management: The overall loss in absolute value ($0.40) is very low, meaning position sizing was small and risk was well controlled in dollar terms, even if the leverage was high.
This trade caught a minor loss of -$0.40 (-6.36%), primarily due to high leverage rather than a large price movement in Ethereum.
Trade Breakdown
Pair: ETHUSDT Perpetual
Direction: Long (Buy "B")
Leverage: 31X
Entry Price: $2,449.07
Close Price: $2,446.49
Price Movement: The price dropped by only $2.58 (~0.105%), but at 31x leverage, that tiny drop amplified into a 6.36% loss on your margin position.
Key Observations
Leverage Sensitivity: High leverage (31x) leaves almost zero room for normal market noise or minor pullbacks. Even a fraction of a percent fluctuation moves your PNL significantly.
Timing / Entry: Looking at the chart visual, the buy order ('B') was placed near a local low, but after a small bounce, the market didn't make a sustained higher high before rolling back down to the close point ('S').
Risk Management: The overall loss in absolute value ($0.40) is very low, meaning position sizing was small and risk was well controlled in dollar terms, even if the leverage was high.
Trade Breakdown
Pair: ETHUSDT Perpetual
Direction: Long (Buy "B")
Leverage: 31X
Entry Price: $2,449.07
Close Price: $2,446.49
Price Movement: The price dropped by only $2.58 (~0.105%), but at 31x leverage, that tiny drop amplified into a 6.36% loss on your margin position.
Key Observations
Leverage Sensitivity: High leverage (31x) leaves almost zero room for normal market noise or minor pullbacks. Even a fraction of a percent fluctuation moves your PNL significantly.
Timing / Entry: Looking at the chart visual, the buy order ('B') was placed near a local low, but after a small bounce, the market didn't make a sustained higher high before rolling back down to the close point ('S').
Risk Management: The overall loss in absolute value ($0.40) is very low, meaning position sizing was small and risk was well controlled in dollar terms, even if the leverage was high.
95
Đăng nhập để khám phá thêm nội dung
Tham gia cùng người dùng tiền mã hóa toàn cầu trên Binance Square
⚡️ Nhận thông tin mới nhất và hữu ích về tiền mã hóa.
💬 Được tin cậy bởi sàn giao dịch tiền mã hóa lớn nhất thế giới.
👍 Khám phá những thông tin chuyên sâu thực tế từ những nhà sáng tạo đã xác minh.
Email / Số điện thoại
Chủ đề thịnh hành
TheoDõiFOMC
74,088 lượt xem
491 đang thảo luận
Yếu tố tác động mạnh đồng Coi lúc này : Fed cứng rắn + lợi suất tăng + ETF BTC đảo chiều.
Chủ tịch Fed Kevin Warsh phát tín hiệu khá “diều hâu”, cho rằng nếu lạm phát không tiến nhanh về mục tiêu 2%, Fed có thể phải tăng lãi suất.
Sau chuỗi 9 phiên hút vốn, ETF Bitcoin giao ngay của Mỹ ghi nhận khoảng 201,8 triệu USD rút ròng.
Hơi khác Pi đang tương đối ổn định hơn BTC, hiện là kỳ vọng vào Protocol 27/Mainnet upgrade, đang tạo lực đỡ tâm lý cho giá. hiện tại thanh khoản PI vẫn khá thấp $BTC #45NgayTuDoTaiChinh #TheoDõiFOMC #TinFed $BNB $ETH
B7E
·0 lượt thích
·293 lượt xem
TinFed
65,533 lượt xem
292 đang thảo luận
45NgayTuDoTaiChinh
895,033 lượt xem
3,033 đang thảo luận