

CryptoTraders.com
466 Bài đăng

CryptoTraders.com
Báo cáo
Chặn người dùng
Home of Top Analysts, Elite Trade Alerts, Cutting-Edge Algorithms, and Powerful Scanners — all built to give you the edge in any market. Join & Activate your 14-day free trial now to see the results yourself!
0 Đang theo dõi
4 Người theo dõi
5 Đã thích
Bài đăng
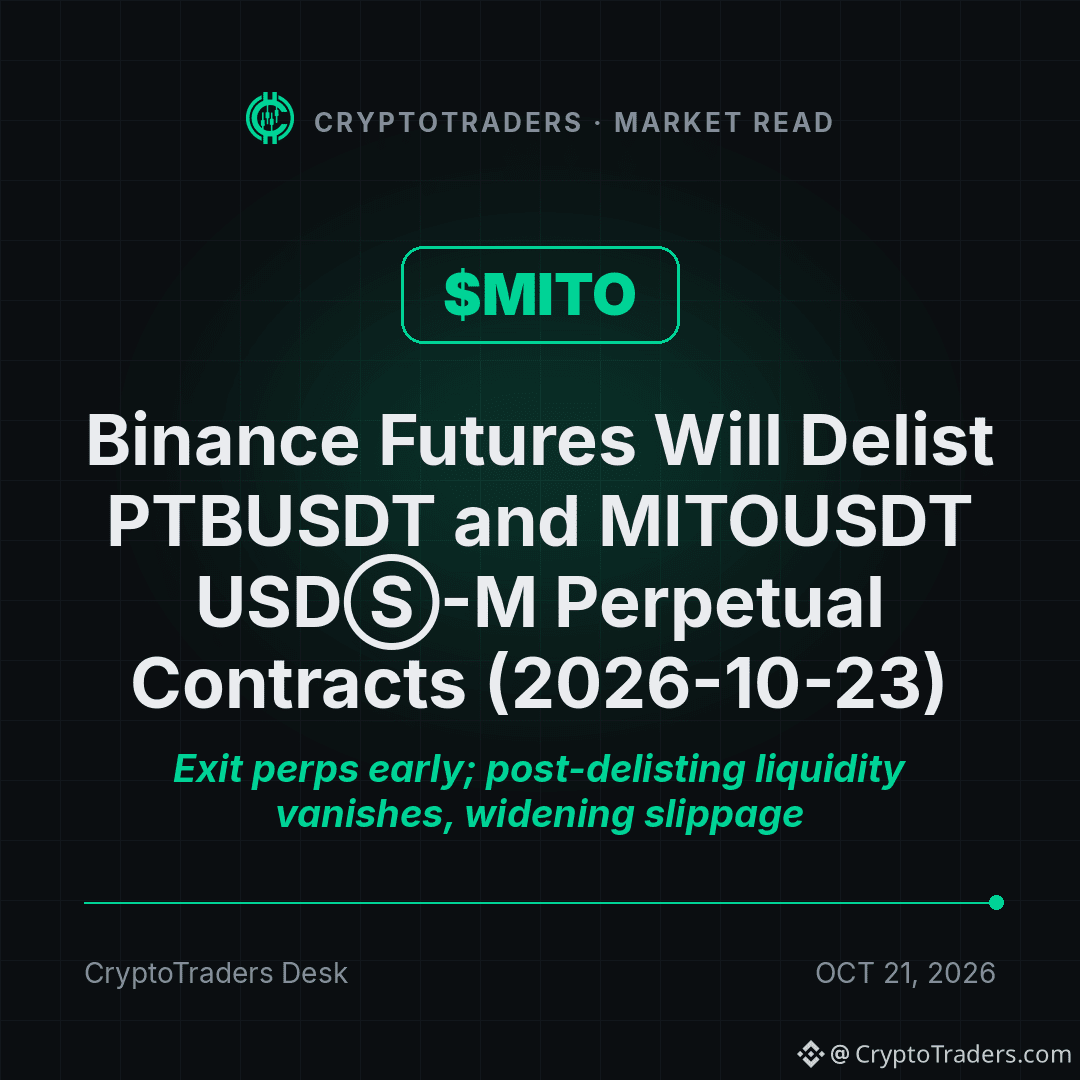
Binance ấn định ngày 23 tháng 10 năm 2026 để hủy niêm yết hợp đồng vĩnh cửu MITOUSDT, và $MITO giảm 15.1% trong ngày 📉 Điểm nổi bật: ▪ Binance Futures sẽ hủy niêm yết các hợp đồng vĩnh cửu PTBUSDT và MITOUSDT USDⓈ-M vào ngày 23 tháng 10 năm 2026. ▪ Thông báo đề cập đến cả hai hợp đồng trong cùng một thông báo. ▪ Không thể tải trang thông báo, vì vậy các chi tiết về thanh toán và thời gian cụ thể vẫn chưa được xác minh. ▪ MITO đang giao dịch ở mức 0.01109, giảm 15.1% trong 24 giờ qua. Nhận định của tôi 🔴 Việc mất một hợp đồng vĩnh cửu trên Binance đồng nghĩa với việc mất một kênh thanh khoản để phòng hộ và sử dụng đòn bẩy, trong khi thông báo được đưa ra lúc giá vốn đã yếu. 🟡 Tác động được dự đoán trong ngắn hạn: thanh khoản hợp đồng vĩnh cửu và việc điều chỉnh vị thế trước khi hủy niêm yết; tác động đến thị trường giao ngay có thể sẽ hạn chế, trừ khi các hợp đồng này chiếm tỷ trọng đáng kể trong hoạt động giao dịch. 🟡 Do không thể tải trang thông báo, cơ chế thanh toán vẫn chưa được xác nhận. Việc hủy niêm yết hợp đồng vĩnh cửu có làm thay đổi quan điểm của bạn về một token, hay chỉ là việc sắp xếp lại hoạt động của sàn? Hầu hết các ngày tôi đều đăng những nhận định kiểu này trong nhóm, và tiểu sử của tôi cho biết cách tìm nhóm. #Mùa Altcoin# #Nhận định Vĩ mô#
Binance ấn định ngày 23 tháng 10 năm 2026 để hủy niêm yết hợp đồng vĩnh cửu MITOUSDT, và $MITO giảm 15.1% trong ngày 📉 Điểm nổi bật: ▪ Binance Futures sẽ hủy niêm yết các hợp đồng vĩnh cửu PTBUSDT và MITOUSDT USDⓈ-M vào ngày 23 tháng 10 năm 2026. ▪ Thông báo đề cập đến cả hai hợp đồng trong cùng một thông báo. ▪ Không thể tải trang thông báo, vì vậy các chi tiết về thanh toán và thời gian cụ thể vẫn chưa được xác minh. ▪ MITO đang giao dịch ở mức 0.01109, giảm 15.1% trong 24 giờ qua. Nhận định của tôi 🔴 Việc mất một hợp đồng vĩnh cửu trên Binance đồng nghĩa với việc mất một kênh thanh khoản để phòng hộ và sử dụng đòn bẩy, trong khi thông báo được đưa ra lúc giá vốn đã yếu. 🟡 Tác động được dự đoán trong ngắn hạn: thanh khoản hợp đồng vĩnh cửu và việc điều chỉnh vị thế trước khi hủy niêm yết; tác động đến thị trường giao ngay có thể sẽ hạn chế, trừ khi các hợp đồng này chiếm tỷ trọng đáng kể trong hoạt động giao dịch. 🟡 Do không thể tải trang thông báo, cơ chế thanh toán vẫn chưa được xác nhận. Việc hủy niêm yết hợp đồng vĩnh cửu có làm thay đổi quan điểm của bạn về một token, hay chỉ là việc sắp xếp lại hoạt động của sàn? Hầu hết các ngày tôi đều đăng những nhận định kiểu này trong nhóm, và tiểu sử của tôi cho biết cách tìm nhóm. #Mùa Altcoin# #Nhận định Vĩ mô#
2
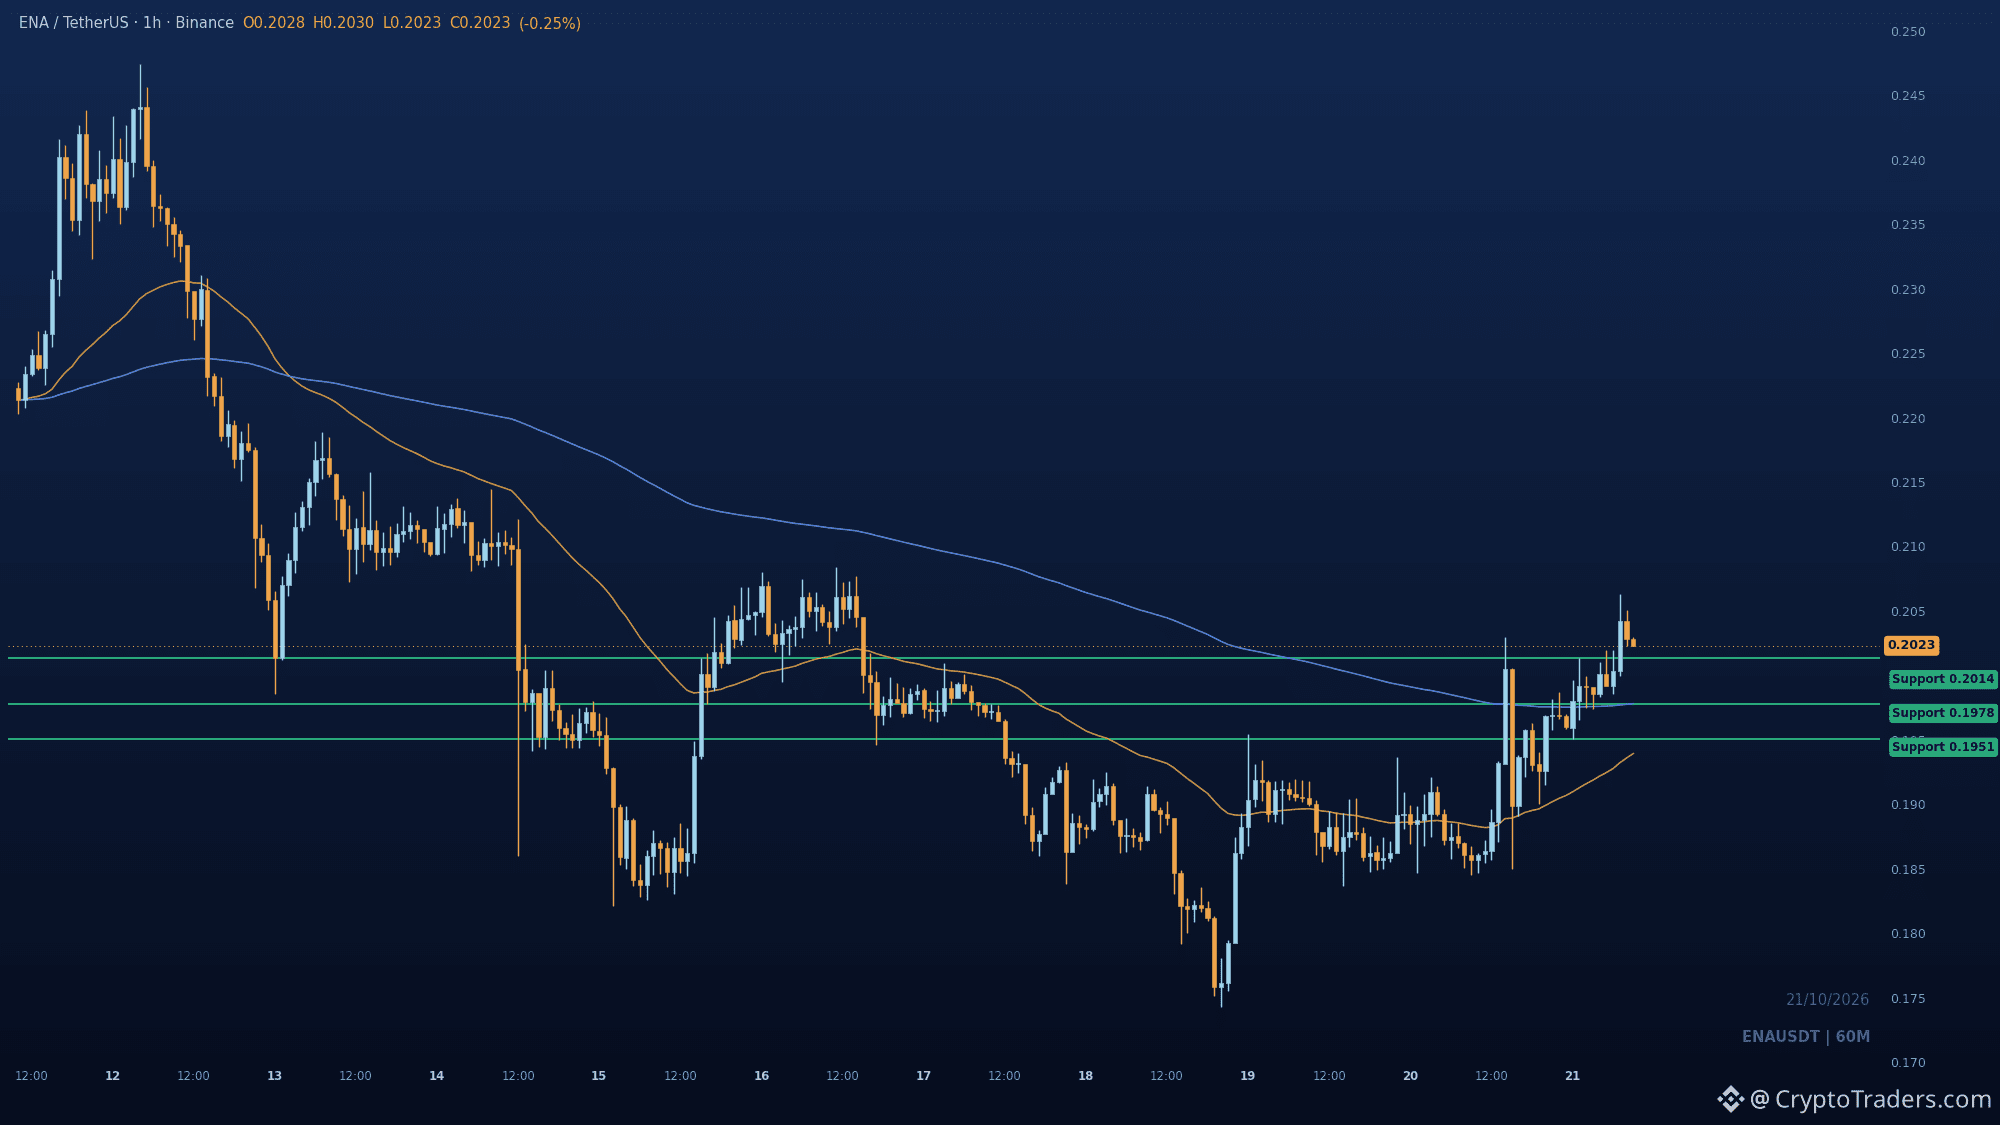
Đám đông đang xem cú bật tăng của $ENA là một cú nảy mèo chết, nhưng biểu đồ 1 giờ đã cho thấy tín hiệu phá vỡ cấu trúc theo hướng tăng trên mức 0.20136. Giá vẫn đang ở vùng chiết khấu trong biên độ, nên đà tăng còn dư địa trước khi trở nên quá đông người tham gia. Giá đã lấy lại cả hai đường EMA. EMA 200 tại 0.1978 là mốc tham chiếu cho nhịp điều chỉnh nếu giá mất mức 0.20136. Thấp hơn nữa, 0.19509 là ngưỡng khiến nhận định tăng giá không còn hiệu lực. Bạn nghĩ còn bao nhiêu giờ nữa thì giá sẽ kiểm tra lại mức 0.20136? Mỗi sáng, cả nhóm đều cùng phân tích những biểu đồ như thế này. #Mùa Altcoin#
Đám đông đang xem cú bật tăng của $ENA là một cú nảy mèo chết, nhưng biểu đồ 1 giờ đã cho thấy tín hiệu phá vỡ cấu trúc theo hướng tăng trên mức 0.20136. Giá vẫn đang ở vùng chiết khấu trong biên độ, nên đà tăng còn dư địa trước khi trở nên quá đông người tham gia. Giá đã lấy lại cả hai đường EMA. EMA 200 tại 0.1978 là mốc tham chiếu cho nhịp điều chỉnh nếu giá mất mức 0.20136. Thấp hơn nữa, 0.19509 là ngưỡng khiến nhận định tăng giá không còn hiệu lực. Bạn nghĩ còn bao nhiêu giờ nữa thì giá sẽ kiểm tra lại mức 0.20136? Mỗi sáng, cả nhóm đều cùng phân tích những biểu đồ như thế này. #Mùa Altcoin#
25
Xem bản dịch
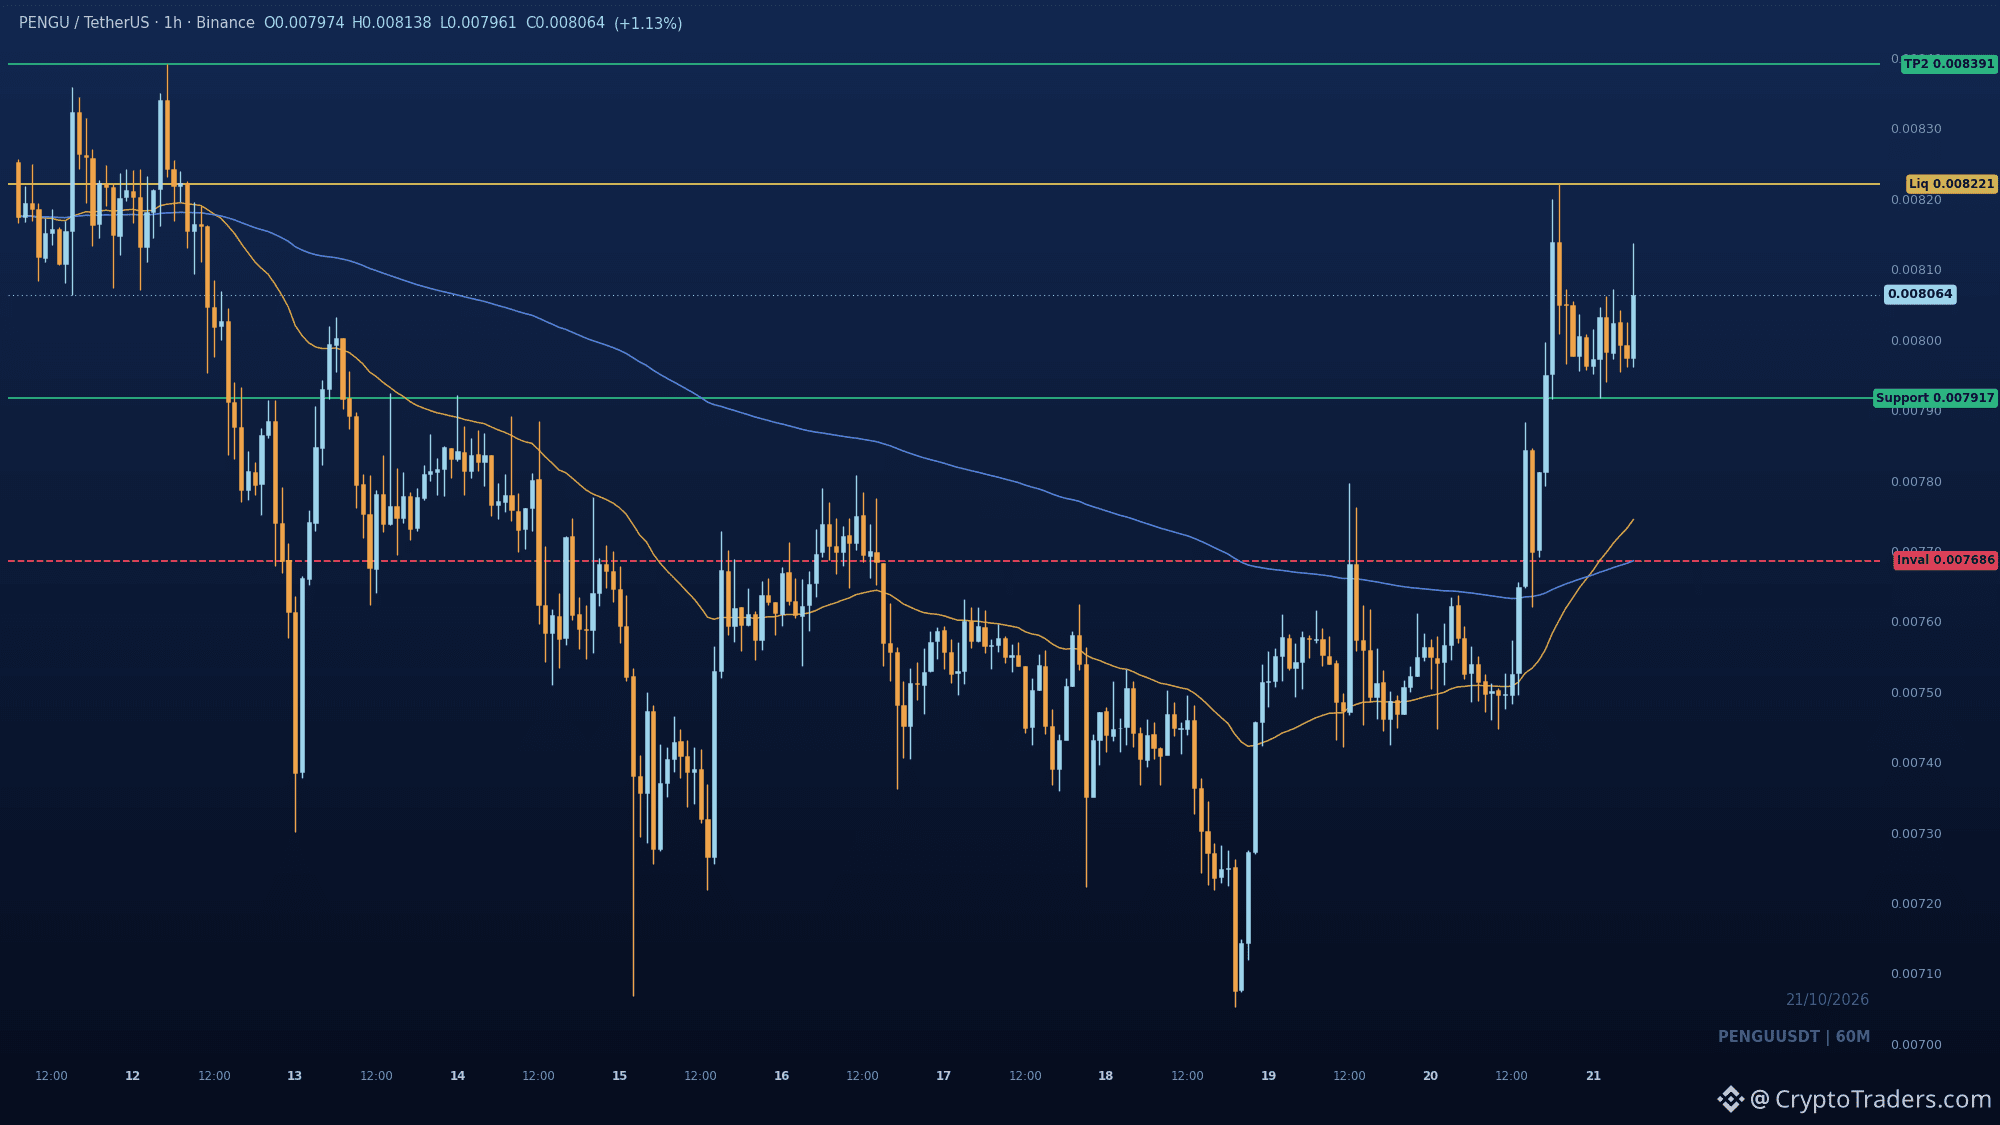
$PENGU is stuck between the 0.007917 pullback shelf and the 0.008221 buy-side pool, and whichever side pays first sets the next leg. The 1h chart flipped from downtrend to a bullish CHoCH/BOS after sweeping the range lows, and both EMAs sit reclaimed under price. That 0.007917 swing low is the tell: if bids show up there, the market is still paying up for dips and 0.008221 then 0.008391 come into play. If that shelf fails, the buyers who paid the breakout stop paying, and 0.00768614 is where the shift gets confirmed. Are you watching the retest or the breakout retry? More reads like this land daily in the group, bio has the way in. #Altcoin Season#
$PENGU is stuck between the 0.007917 pullback shelf and the 0.008221 buy-side pool, and whichever side pays first sets the next leg. The 1h chart flipped from downtrend to a bullish CHoCH/BOS after sweeping the range lows, and both EMAs sit reclaimed under price. That 0.007917 swing low is the tell: if bids show up there, the market is still paying up for dips and 0.008221 then 0.008391 come into play. If that shelf fails, the buyers who paid the breakout stop paying, and 0.00768614 is where the shift gets confirmed. Are you watching the retest or the breakout retry? More reads like this land daily in the group, bio has the way in. #Altcoin Season#
29
Xem bản dịch
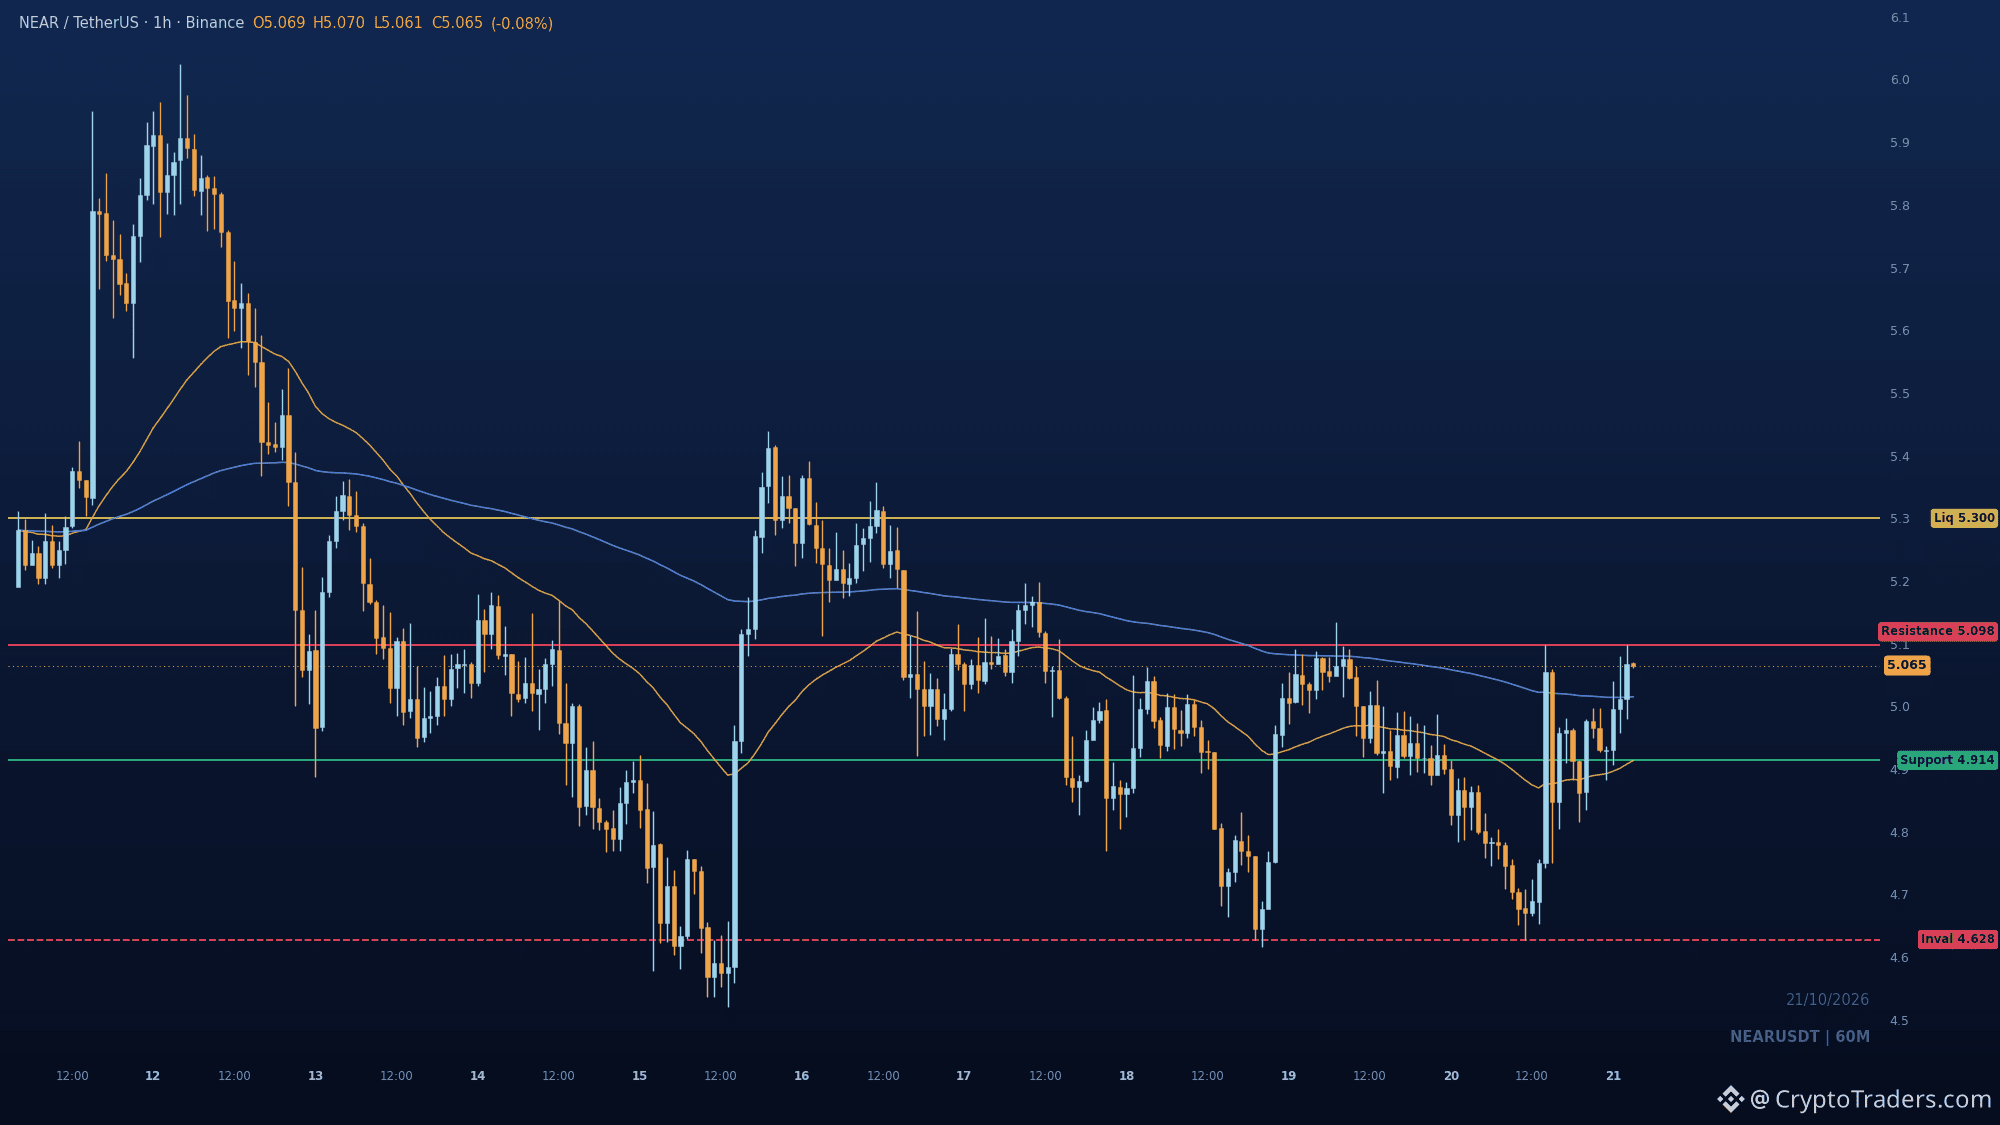
5.098 is the number that matters on $NEAR right now. Price swept 4.63, reclaimed both EMAs, and has climbed into the range discount at 5.07. That swing high is the gate: a hold above it puts 5.3 in view, the prior rebound highs. Losing the 4.914 fast EMA turns this into another rotation, with 4.628 as the line that breaks the bounce. Where do you think NEAR tops out if 5.098 gives way? More reads like this land daily in the group, bio has the details. #Altcoin Season#
5.098 is the number that matters on $NEAR right now. Price swept 4.63, reclaimed both EMAs, and has climbed into the range discount at 5.07. That swing high is the gate: a hold above it puts 5.3 in view, the prior rebound highs. Losing the 4.914 fast EMA turns this into another rotation, with 4.628 as the line that breaks the bounce. Where do you think NEAR tops out if 5.098 gives way? More reads like this land daily in the group, bio has the details. #Altcoin Season#
41
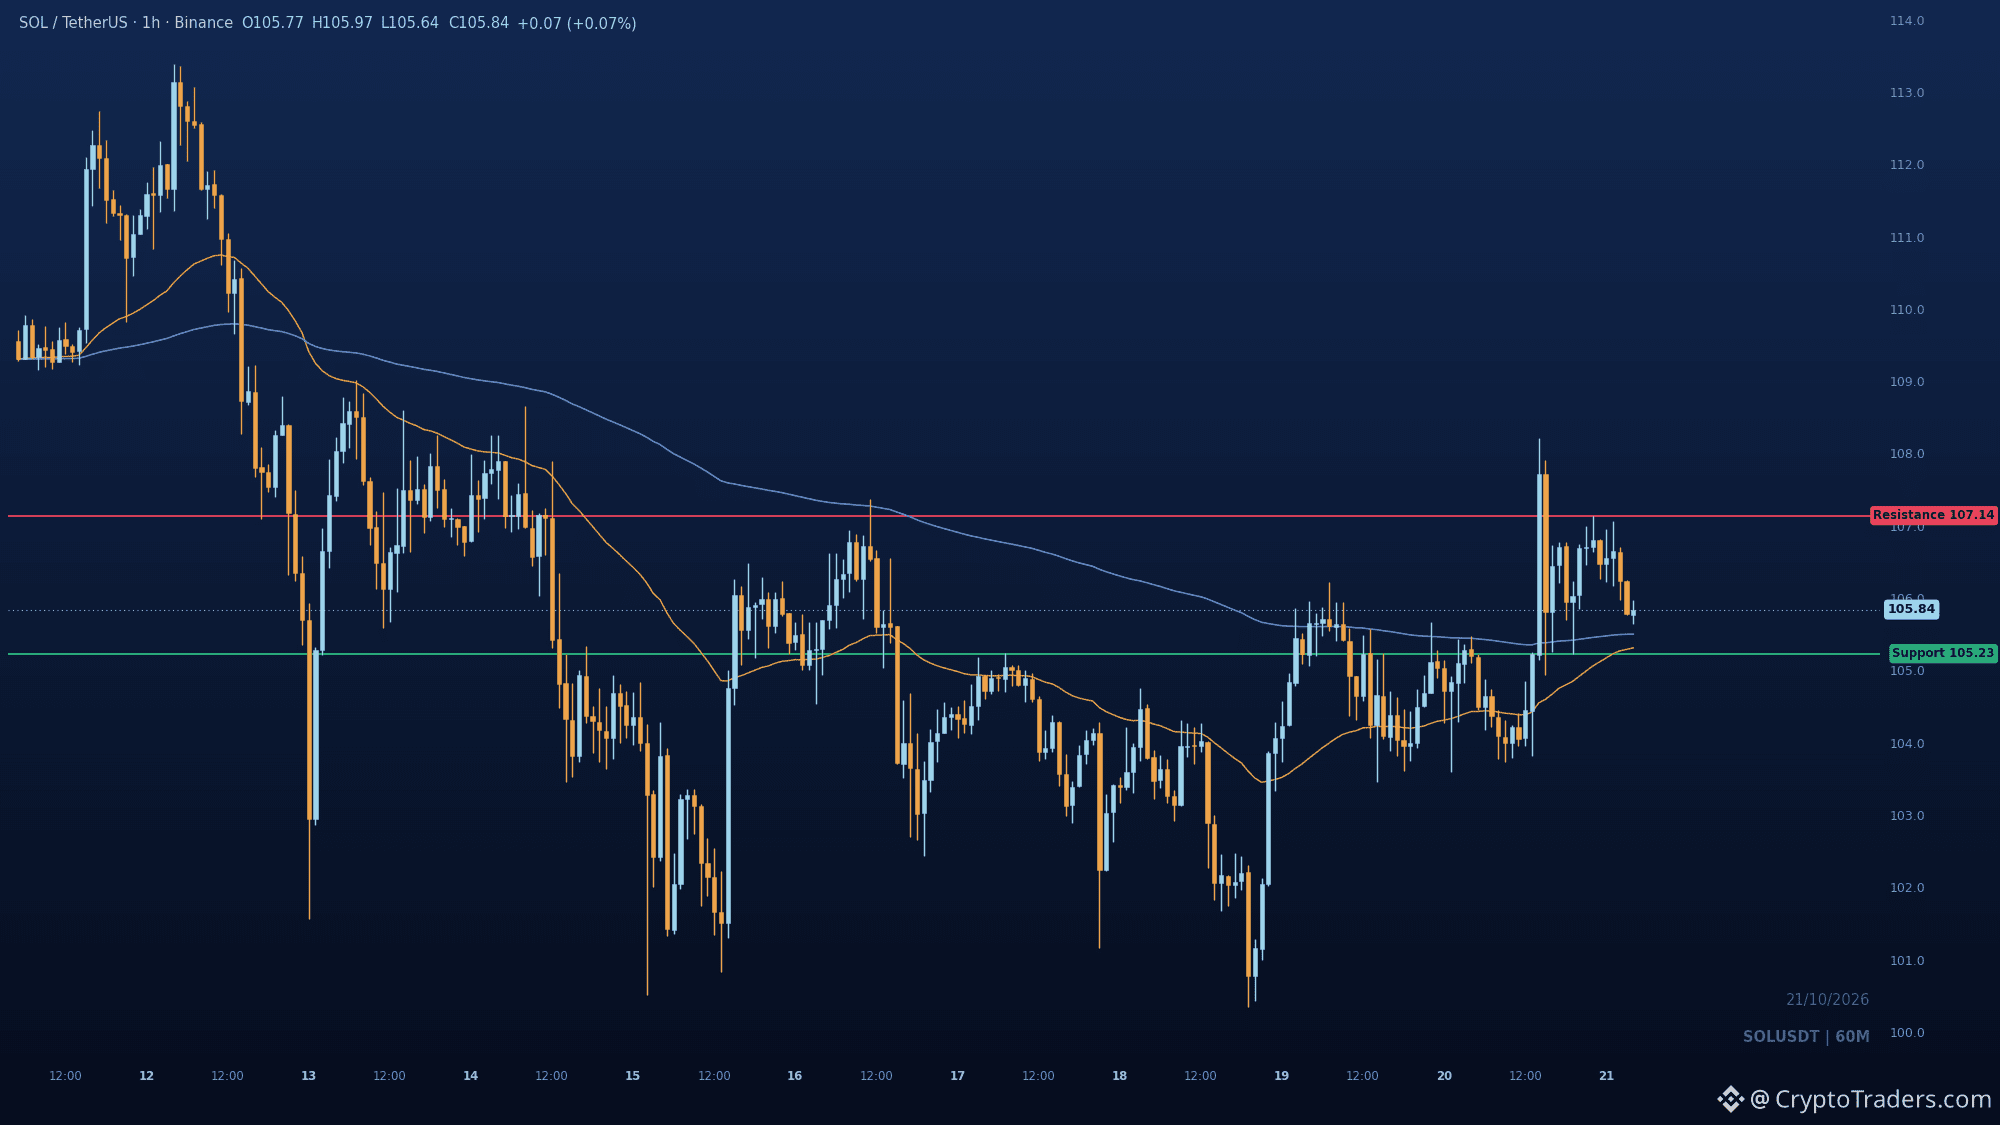
$SOL đang giao dịch quanh mức 105.91, tăng 0,7% trong ngày; mức giá này quan trọng hơn quy mô biến động. Giá đã phục hồi từ đáy nhưng vẫn nằm ở nửa dưới của biên độ, và biểu đồ khung giờ sẽ quyết định liệu đà tăng tiếp diễn hay suy yếu. Sự chú ý đang đến từ hai phía. Dòng vốn ETF và những bàn luận từ các tổ chức dẫn đầu các chủ đề được nhắc đến trên Crypto Twitter trong 24 giờ qua với 26 lượt, theo sát là funding và đòn bẩy. Vì vậy, hoạt động định vị đang tác động đến thị trường nhiều không kém giao dịch giao ngay vào lúc này. Về yếu tố cơ bản, Loan đã ra mắt trên Solana cùng Pyth, bổ sung các pool WIF, PUMP và SOL. Bitcoin vẫn khá trầm lắng: các mức Q4 của Glassnode vẫn được giữ vững, còn vùng 87K đến 87.8K vẫn cho thấy thị trường đang tích lũy trong ngắn hạn. Biểu đồ: tín hiệu trên khung giờ ở trạng thái trung lập. Phe bán đã đẩy giá xuống trong nhịp giảm gần nhất, phe mua giành lại phần nào vùng giá đã mất từ đáy và đẩy lên mức đỉnh dao động gần đây, rồi giá điều chỉnh về phía các đường trung bình động. Mốc quan trọng là 105.23, đáy dao động nơi lực mua có thể quay trở lại. Phía trên là 107.14, đỉnh dao động và vùng thanh khoản tăng giá hiển nhiên. Thời điểm cũng quan trọng không kém các con số. Giữ được trên 105.23 sẽ tạo điều kiện để giá kiểm tra lại 107.14; xét cách nhịp hồi phục hình thành, quá trình này có vẻ cần một hoặc hai phiên giao dịch hơn là một cú tăng vọt trong ngày. Nếu mất 105.23, tín hiệu chuyển biến tích cực trong ngắn hạn sẽ mất hiệu lực, và thị trường sẽ quay lại cấu trúc giảm rộng hơn. Cần theo dõi: liệu 105.23 có trụ vững khi nến giờ đóng cửa hay không, giá có vượt và duy trì trên 107.14 hay chỉ tạo râu nến, và liệu các số liệu dòng vốn ETF có tiếp tục đưa lực mua từ tổ chức vào cuộc thảo luận hay không. Bạn nghĩ SOL sẽ chạm 107.14 trước khi quay lại kiểm tra các mức đáy chứ? Mỗi ngày, nhóm đều có thêm các biểu đồ và phân tích như thế này; bạn có thể tìm cách tham gia trong phần tiểu sử của tôi. #Mùa Altcoin# #Nhận định vĩ mô#
$SOL đang giao dịch quanh mức 105.91, tăng 0,7% trong ngày; mức giá này quan trọng hơn quy mô biến động. Giá đã phục hồi từ đáy nhưng vẫn nằm ở nửa dưới của biên độ, và biểu đồ khung giờ sẽ quyết định liệu đà tăng tiếp diễn hay suy yếu. Sự chú ý đang đến từ hai phía. Dòng vốn ETF và những bàn luận từ các tổ chức dẫn đầu các chủ đề được nhắc đến trên Crypto Twitter trong 24 giờ qua với 26 lượt, theo sát là funding và đòn bẩy. Vì vậy, hoạt động định vị đang tác động đến thị trường nhiều không kém giao dịch giao ngay vào lúc này. Về yếu tố cơ bản, Loan đã ra mắt trên Solana cùng Pyth, bổ sung các pool WIF, PUMP và SOL. Bitcoin vẫn khá trầm lắng: các mức Q4 của Glassnode vẫn được giữ vững, còn vùng 87K đến 87.8K vẫn cho thấy thị trường đang tích lũy trong ngắn hạn. Biểu đồ: tín hiệu trên khung giờ ở trạng thái trung lập. Phe bán đã đẩy giá xuống trong nhịp giảm gần nhất, phe mua giành lại phần nào vùng giá đã mất từ đáy và đẩy lên mức đỉnh dao động gần đây, rồi giá điều chỉnh về phía các đường trung bình động. Mốc quan trọng là 105.23, đáy dao động nơi lực mua có thể quay trở lại. Phía trên là 107.14, đỉnh dao động và vùng thanh khoản tăng giá hiển nhiên. Thời điểm cũng quan trọng không kém các con số. Giữ được trên 105.23 sẽ tạo điều kiện để giá kiểm tra lại 107.14; xét cách nhịp hồi phục hình thành, quá trình này có vẻ cần một hoặc hai phiên giao dịch hơn là một cú tăng vọt trong ngày. Nếu mất 105.23, tín hiệu chuyển biến tích cực trong ngắn hạn sẽ mất hiệu lực, và thị trường sẽ quay lại cấu trúc giảm rộng hơn. Cần theo dõi: liệu 105.23 có trụ vững khi nến giờ đóng cửa hay không, giá có vượt và duy trì trên 107.14 hay chỉ tạo râu nến, và liệu các số liệu dòng vốn ETF có tiếp tục đưa lực mua từ tổ chức vào cuộc thảo luận hay không. Bạn nghĩ SOL sẽ chạm 107.14 trước khi quay lại kiểm tra các mức đáy chứ? Mỗi ngày, nhóm đều có thêm các biểu đồ và phân tích như thế này; bạn có thể tìm cách tham gia trong phần tiểu sử của tôi. #Mùa Altcoin# #Nhận định vĩ mô#
57
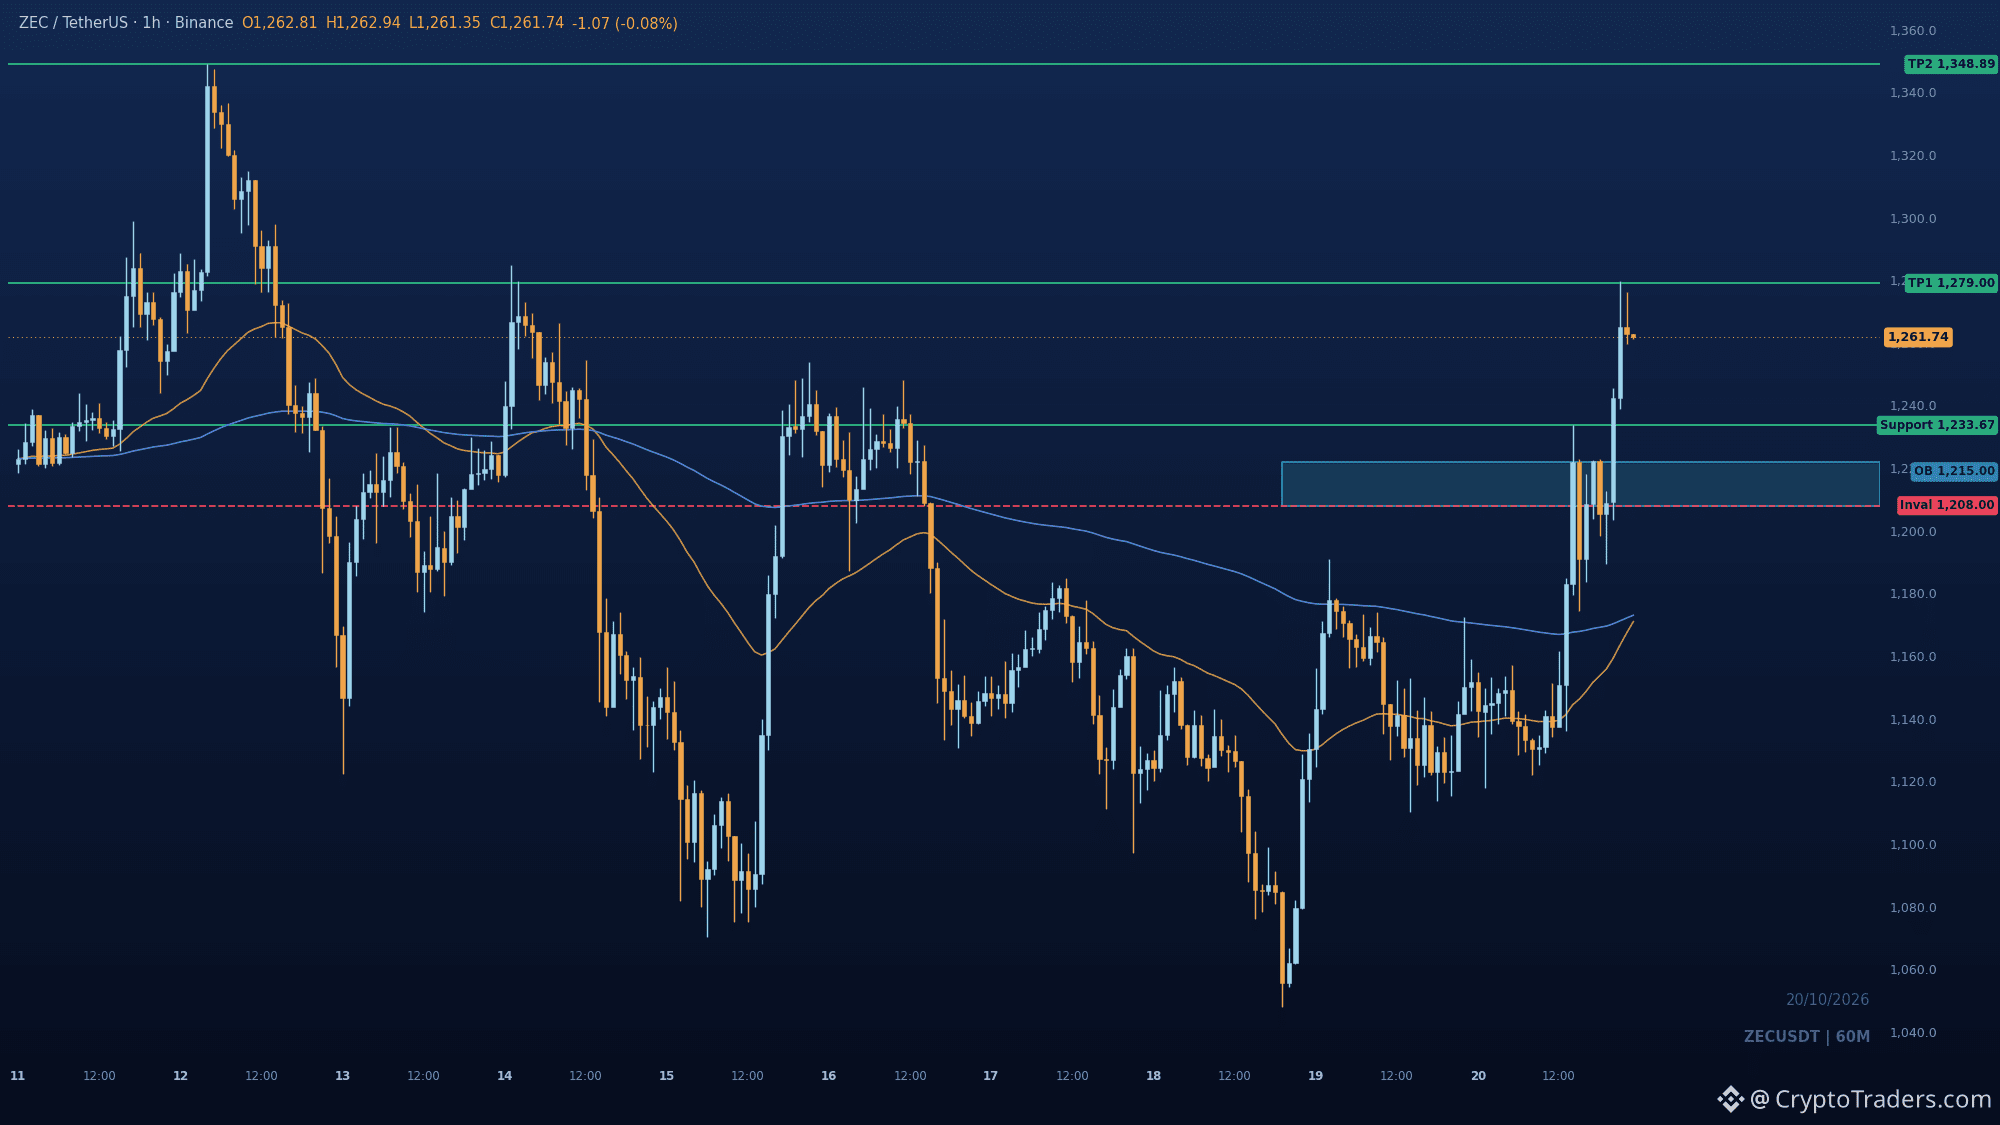
Liệu $ZEC có thể giữ vững mốc 1233.67 giờ đây đã trở thành hỗ trợ thay vì kháng cự? BOS vượt qua 1233.67 đi kèm động lượng mạnh sau cú quét gần 1048, và giá vẫn đang giao dịch ở vùng cao của biên độ. Vùng điều chỉnh là 1233.67, phía sau là khối lệnh tăng giá nằm trong khoảng 1208 đến 1222. Bảo vệ được vùng đáy này thì mục tiêu 1279 vẫn khả thi, tiếp theo là đỉnh trước đó tại 1348.89. Nếu mất mốc 1208, nhận định sẽ đảo chiều: phe bán giành quyền kiểm soát và cú phá vỡ trở thành bẫy. Bạn đang theo dõi nhịp kiểm tra lại hay chờ giá chạm 1279 trước? Mỗi ngày nhóm đều có thêm những phân tích như thế này, xem tiểu sử để biết cách tham gia. #Mùa Altcoin#
Liệu $ZEC có thể giữ vững mốc 1233.67 giờ đây đã trở thành hỗ trợ thay vì kháng cự? BOS vượt qua 1233.67 đi kèm động lượng mạnh sau cú quét gần 1048, và giá vẫn đang giao dịch ở vùng cao của biên độ. Vùng điều chỉnh là 1233.67, phía sau là khối lệnh tăng giá nằm trong khoảng 1208 đến 1222. Bảo vệ được vùng đáy này thì mục tiêu 1279 vẫn khả thi, tiếp theo là đỉnh trước đó tại 1348.89. Nếu mất mốc 1208, nhận định sẽ đảo chiều: phe bán giành quyền kiểm soát và cú phá vỡ trở thành bẫy. Bạn đang theo dõi nhịp kiểm tra lại hay chờ giá chạm 1279 trước? Mỗi ngày nhóm đều có thêm những phân tích như thế này, xem tiểu sử để biết cách tham gia. #Mùa Altcoin#
55
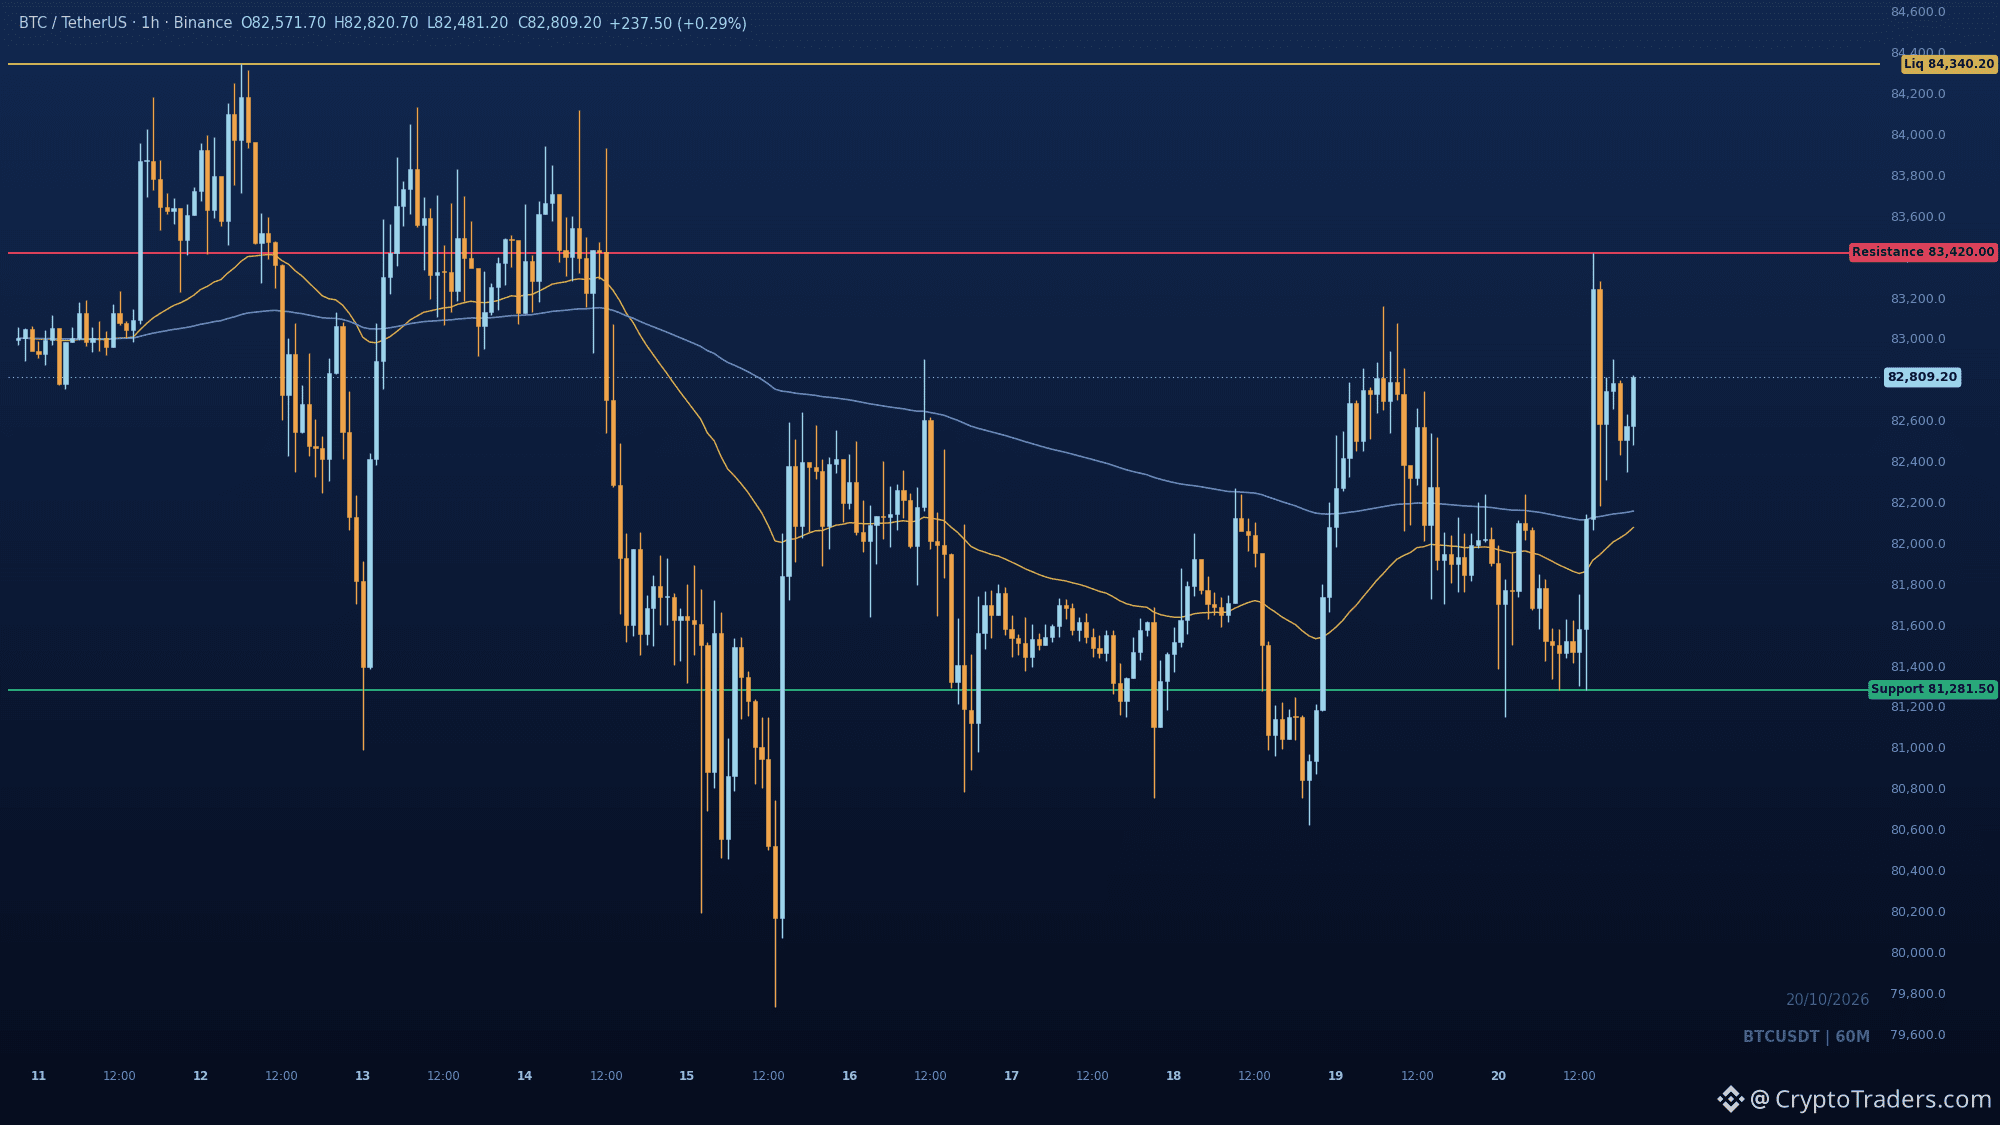
Strategy đang âm thầm chuyển vốn khỏi việc mua $BTC sang cổ phiếu ưu đãi của chính mình 📉 1⃣ Mua lại thay vì tích lũy: Strategy đã chi 193,1 triệu để mua lại cổ phiếu ưu đãi STRC trong giai đoạn 12–18 tháng 10, trong khi chỉ mua 267 BTC với giá 22,1 triệu. Chi phí vốn và việc quản lý nợ phải trả hiện đang hút nhiều vốn hơn so với việc tích lũy mới. 2⃣ Dòng tiền ETF phân hóa: Các ETF Bitcoin giao ngay tại Mỹ ghi nhận dòng vốn ròng đổ vào 526,7 triệu vào ngày 19 tháng 10, dẫn đầu là IBIT của BlackRock, nhưng tổng dòng tiền từ ngày 5–19 tháng 10 vẫn ở mức âm 380,6 triệu. Một phiên giao dịch mạnh không thể đảo ngược dòng vốn rút ra kéo dài hai tuần, và việc tạo lập chứng chỉ quỹ không phải lúc nào cũng đồng nghĩa với lực mua giao ngay mới. 3⃣ Giá vẫn trụ vững: BTC đang ở mức 82.847, tăng 0,9% trong ngày, dù công ty nắm giữ nhiều Bitcoin nhất đang giảm tốc độ mua vào và dòng tiền ETF vẫn âm trong suốt hai tuần qua. Câu chuyện về nhu cầu yếu hơn những gì con số dòng vốn đổ vào được công bố cho thấy, nhưng giá vẫn chưa phản ánh điều đó. Ở đây, tín hiệu nào quan trọng hơn: số liệu ETF trong một ngày hay dòng vốn rút ra tích lũy trong hai tuần? Mỗi ngày cộng đồng đều có thêm những bài phân tích như thế này; xem phần tiểu sử của tôi để biết cách tham gia. #Phân tích giá BTC# #Dự đoán giá Bitcoin: Bước tiếp theo của Bitcoin là gì?# #Góc nhìn vĩ mô#
Strategy đang âm thầm chuyển vốn khỏi việc mua $BTC sang cổ phiếu ưu đãi của chính mình 📉 1⃣ Mua lại thay vì tích lũy: Strategy đã chi 193,1 triệu để mua lại cổ phiếu ưu đãi STRC trong giai đoạn 12–18 tháng 10, trong khi chỉ mua 267 BTC với giá 22,1 triệu. Chi phí vốn và việc quản lý nợ phải trả hiện đang hút nhiều vốn hơn so với việc tích lũy mới. 2⃣ Dòng tiền ETF phân hóa: Các ETF Bitcoin giao ngay tại Mỹ ghi nhận dòng vốn ròng đổ vào 526,7 triệu vào ngày 19 tháng 10, dẫn đầu là IBIT của BlackRock, nhưng tổng dòng tiền từ ngày 5–19 tháng 10 vẫn ở mức âm 380,6 triệu. Một phiên giao dịch mạnh không thể đảo ngược dòng vốn rút ra kéo dài hai tuần, và việc tạo lập chứng chỉ quỹ không phải lúc nào cũng đồng nghĩa với lực mua giao ngay mới. 3⃣ Giá vẫn trụ vững: BTC đang ở mức 82.847, tăng 0,9% trong ngày, dù công ty nắm giữ nhiều Bitcoin nhất đang giảm tốc độ mua vào và dòng tiền ETF vẫn âm trong suốt hai tuần qua. Câu chuyện về nhu cầu yếu hơn những gì con số dòng vốn đổ vào được công bố cho thấy, nhưng giá vẫn chưa phản ánh điều đó. Ở đây, tín hiệu nào quan trọng hơn: số liệu ETF trong một ngày hay dòng vốn rút ra tích lũy trong hai tuần? Mỗi ngày cộng đồng đều có thêm những bài phân tích như thế này; xem phần tiểu sử của tôi để biết cách tham gia. #Phân tích giá BTC# #Dự đoán giá Bitcoin: Bước tiếp theo của Bitcoin là gì?# #Góc nhìn vĩ mô#
5
Xem bản dịch
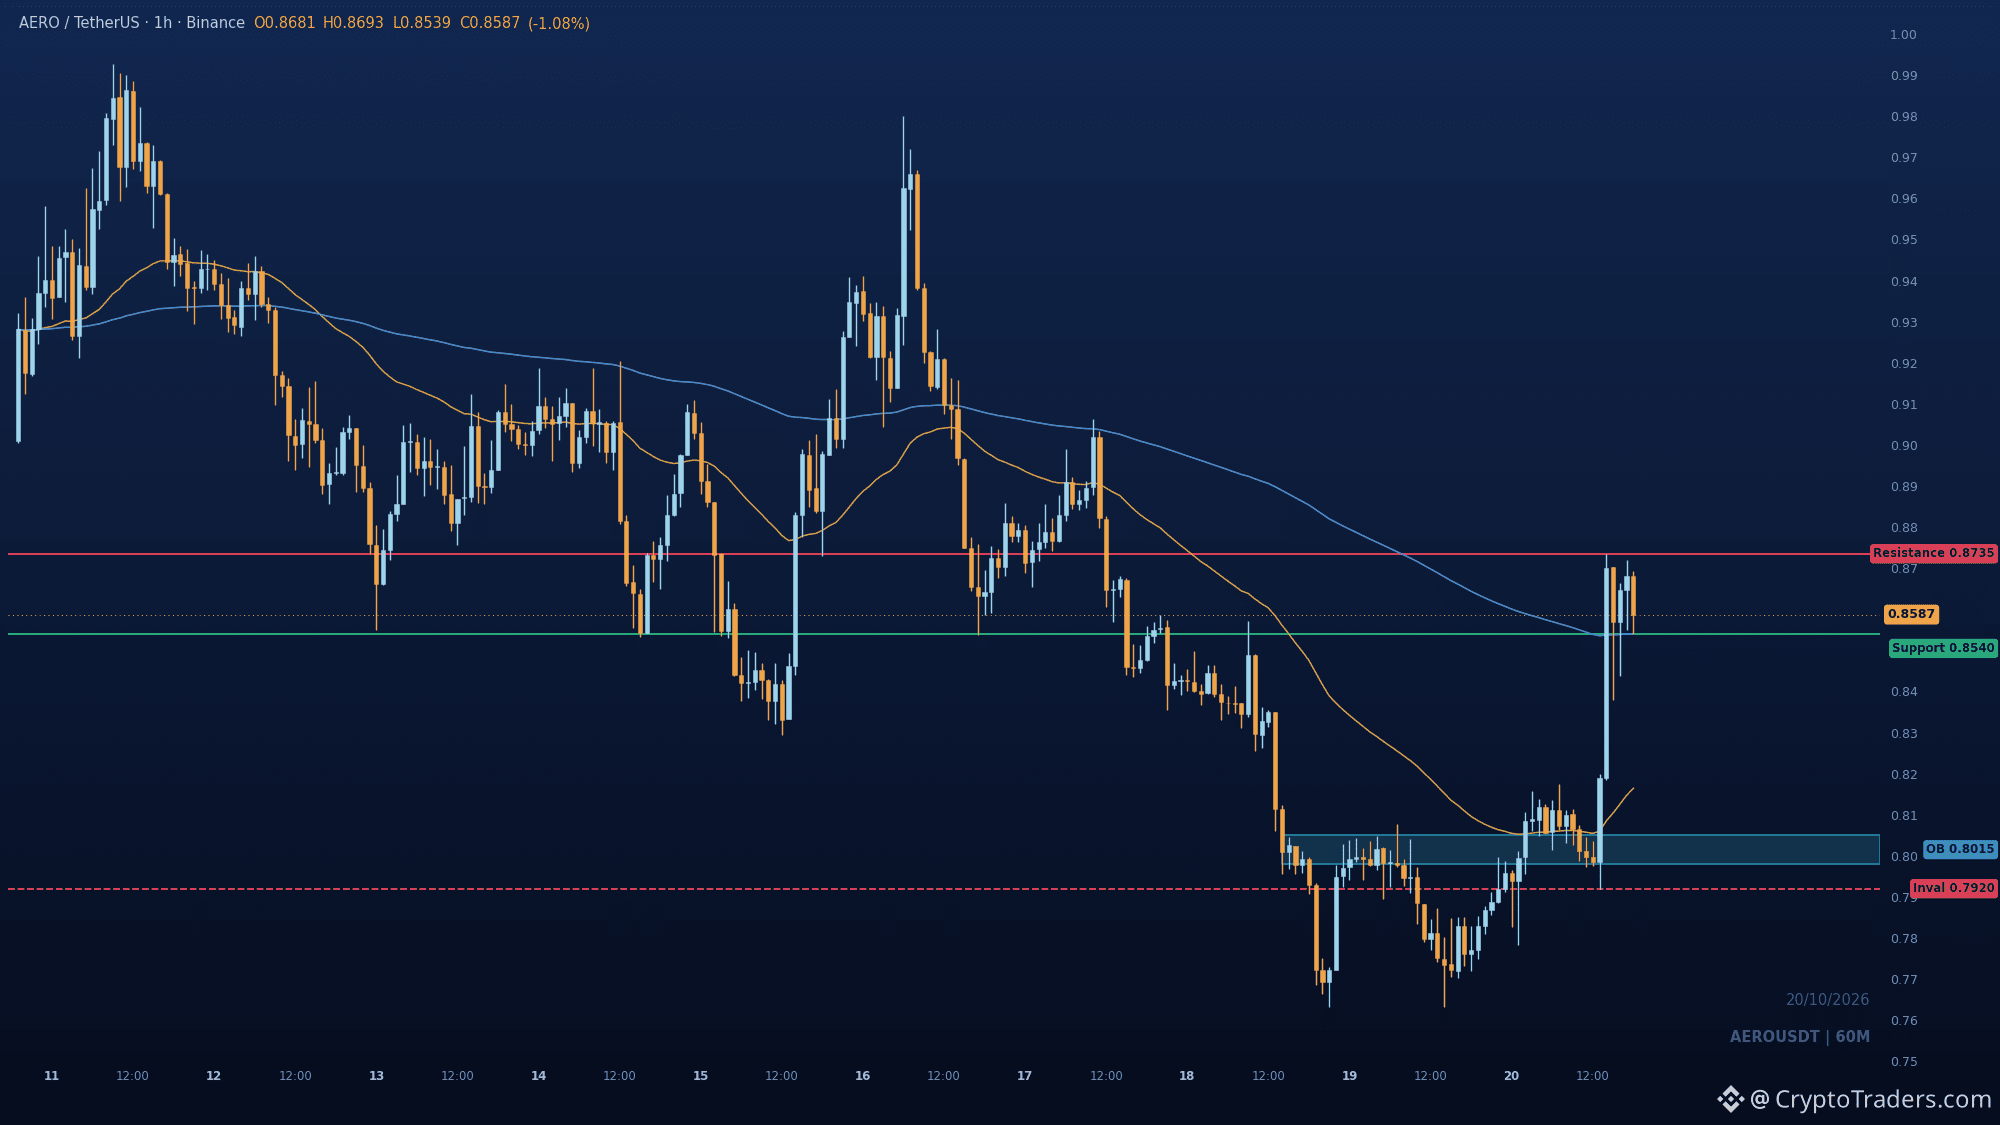
$AERO is caught between the 0.8735 swing high and the 0.854 slow EMA, and the market has to choose which one gives first. That 0.8735 level already rejected price once this window, so a second test is the real tell. After the sweep at 0.7633, buyers rallied back above the fast EMA and stalled just under that high. A pullback into 0.854 to 0.816 that holds would set up the retest; losing 0.792 breaks the bullish CHoCH. Which side of 0.8735 do you think gives first? More reads like this land daily in the group, details in my bio. #Altcoin Season#
$AERO is caught between the 0.8735 swing high and the 0.854 slow EMA, and the market has to choose which one gives first. That 0.8735 level already rejected price once this window, so a second test is the real tell. After the sweep at 0.7633, buyers rallied back above the fast EMA and stalled just under that high. A pullback into 0.854 to 0.816 that holds would set up the retest; losing 0.792 breaks the bullish CHoCH. Which side of 0.8735 do you think gives first? More reads like this land daily in the group, details in my bio. #Altcoin Season#
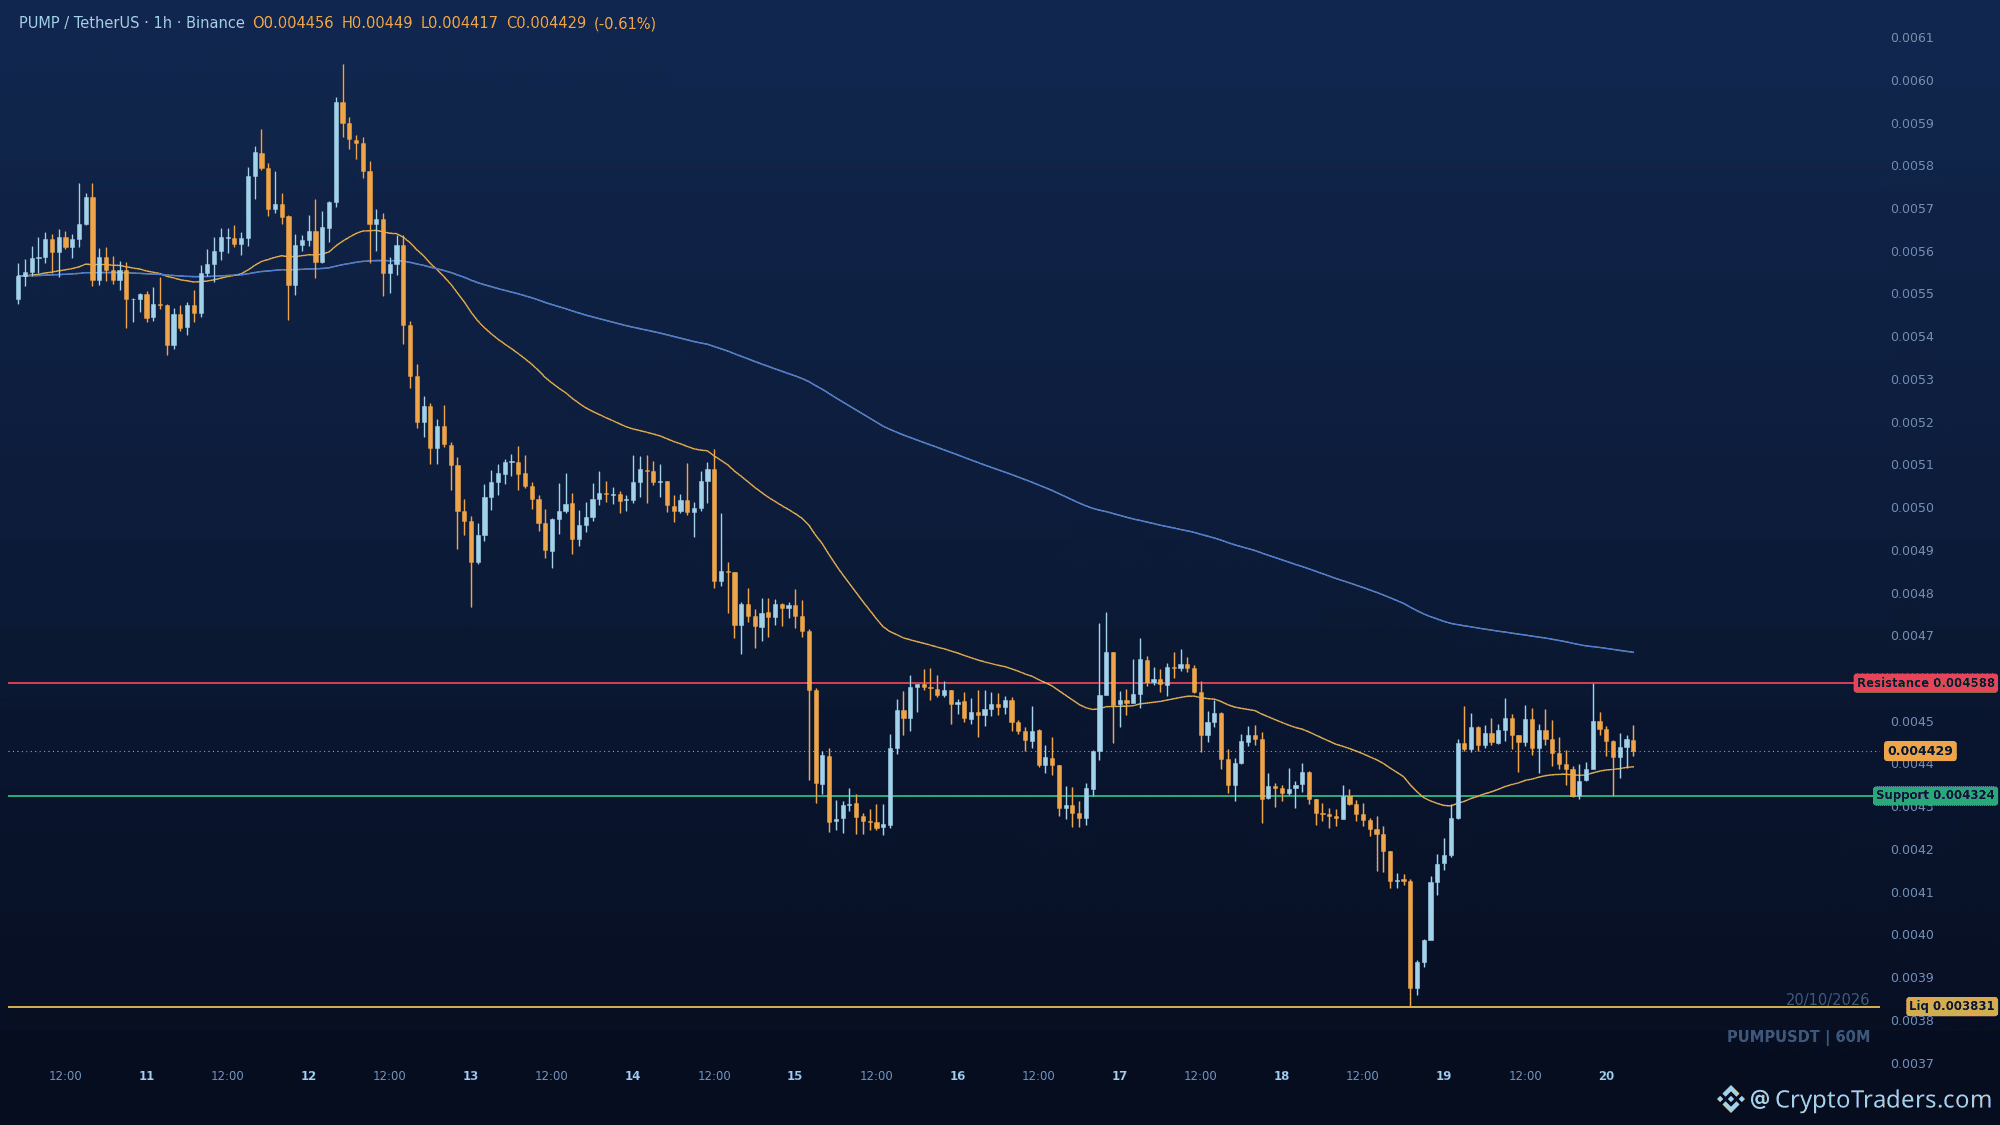
$PUMP đã quét đáy vùng giá rồi bật lên, nhưng đỉnh chỉ mới hình thành vài giờ trước vẫn chưa bị chạm tới — đó mới là điều bất thường ở đây. Biểu đồ 1 giờ liên tục tạo các đỉnh thấp dần, giá nằm dưới đường EMA 200, và nhịp hồi này đã chững lại khá xa dưới mức 0.004588. Đỉnh dao động tại 0.004588 là mốc then chốt. Lấy lại mốc này thì chuỗi đỉnh thấp dần cuối cùng cũng bị phá vỡ; bị từ chối tại đó thì phe bán nhiều khả năng sẽ nhắm lại mức 0.004324. Nếu mất 0.004324, đáy đã bị quét tại 0.003831 sẽ trở lại thành vùng thanh khoản phía bán tiếp theo. Bạn nghĩ nhịp hồi này còn kéo dài bao lâu trước khi hụt hơi? Mỗi ngày trong nhóm đều có thêm những kèo tương tự, xem tiểu sử để biết cách tham gia. #Mùa Altcoin#
$PUMP đã quét đáy vùng giá rồi bật lên, nhưng đỉnh chỉ mới hình thành vài giờ trước vẫn chưa bị chạm tới — đó mới là điều bất thường ở đây. Biểu đồ 1 giờ liên tục tạo các đỉnh thấp dần, giá nằm dưới đường EMA 200, và nhịp hồi này đã chững lại khá xa dưới mức 0.004588. Đỉnh dao động tại 0.004588 là mốc then chốt. Lấy lại mốc này thì chuỗi đỉnh thấp dần cuối cùng cũng bị phá vỡ; bị từ chối tại đó thì phe bán nhiều khả năng sẽ nhắm lại mức 0.004324. Nếu mất 0.004324, đáy đã bị quét tại 0.003831 sẽ trở lại thành vùng thanh khoản phía bán tiếp theo. Bạn nghĩ nhịp hồi này còn kéo dài bao lâu trước khi hụt hơi? Mỗi ngày trong nhóm đều có thêm những kèo tương tự, xem tiểu sử để biết cách tham gia. #Mùa Altcoin#
29
Xem bản dịch
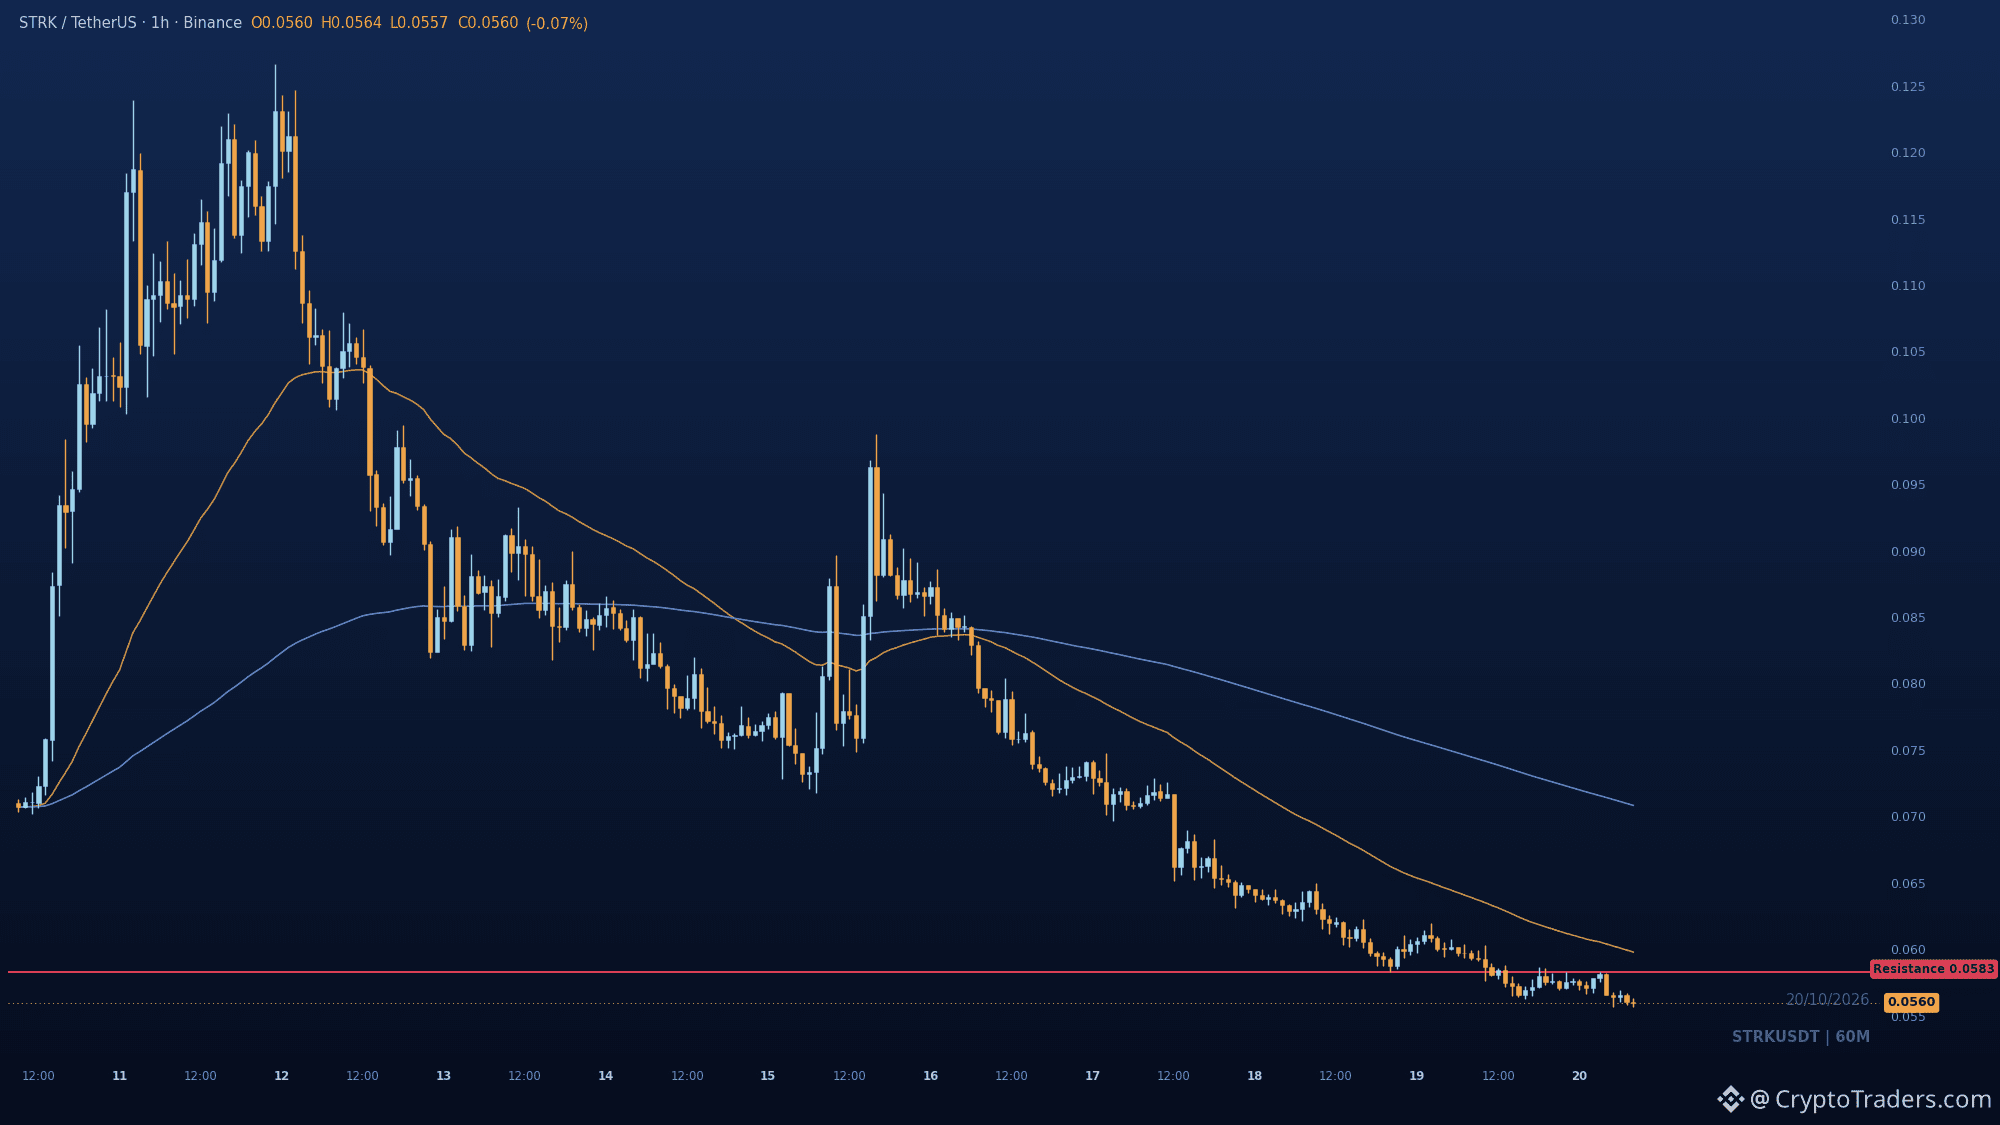
$STRK sits at a standoff between the 0.05568 window low and the 0.0583 swing high, and the market has to pick a side. Every bounce this session has stalled under both EMAs, printing another lower high. Losing 0.05568 puts price in discovery with no shelf beneath it, which is where holders feel the most pain. Reclaiming 0.0583 is the only thing that voids the bearish read. Anyone still long here, what is your line in the sand? We break down setups like this with the community each morning, details in the profile. #Altcoin Season#
$STRK sits at a standoff between the 0.05568 window low and the 0.0583 swing high, and the market has to pick a side. Every bounce this session has stalled under both EMAs, printing another lower high. Losing 0.05568 puts price in discovery with no shelf beneath it, which is where holders feel the most pain. Reclaiming 0.0583 is the only thing that voids the bearish read. Anyone still long here, what is your line in the sand? We break down setups like this with the community each morning, details in the profile. #Altcoin Season#
25
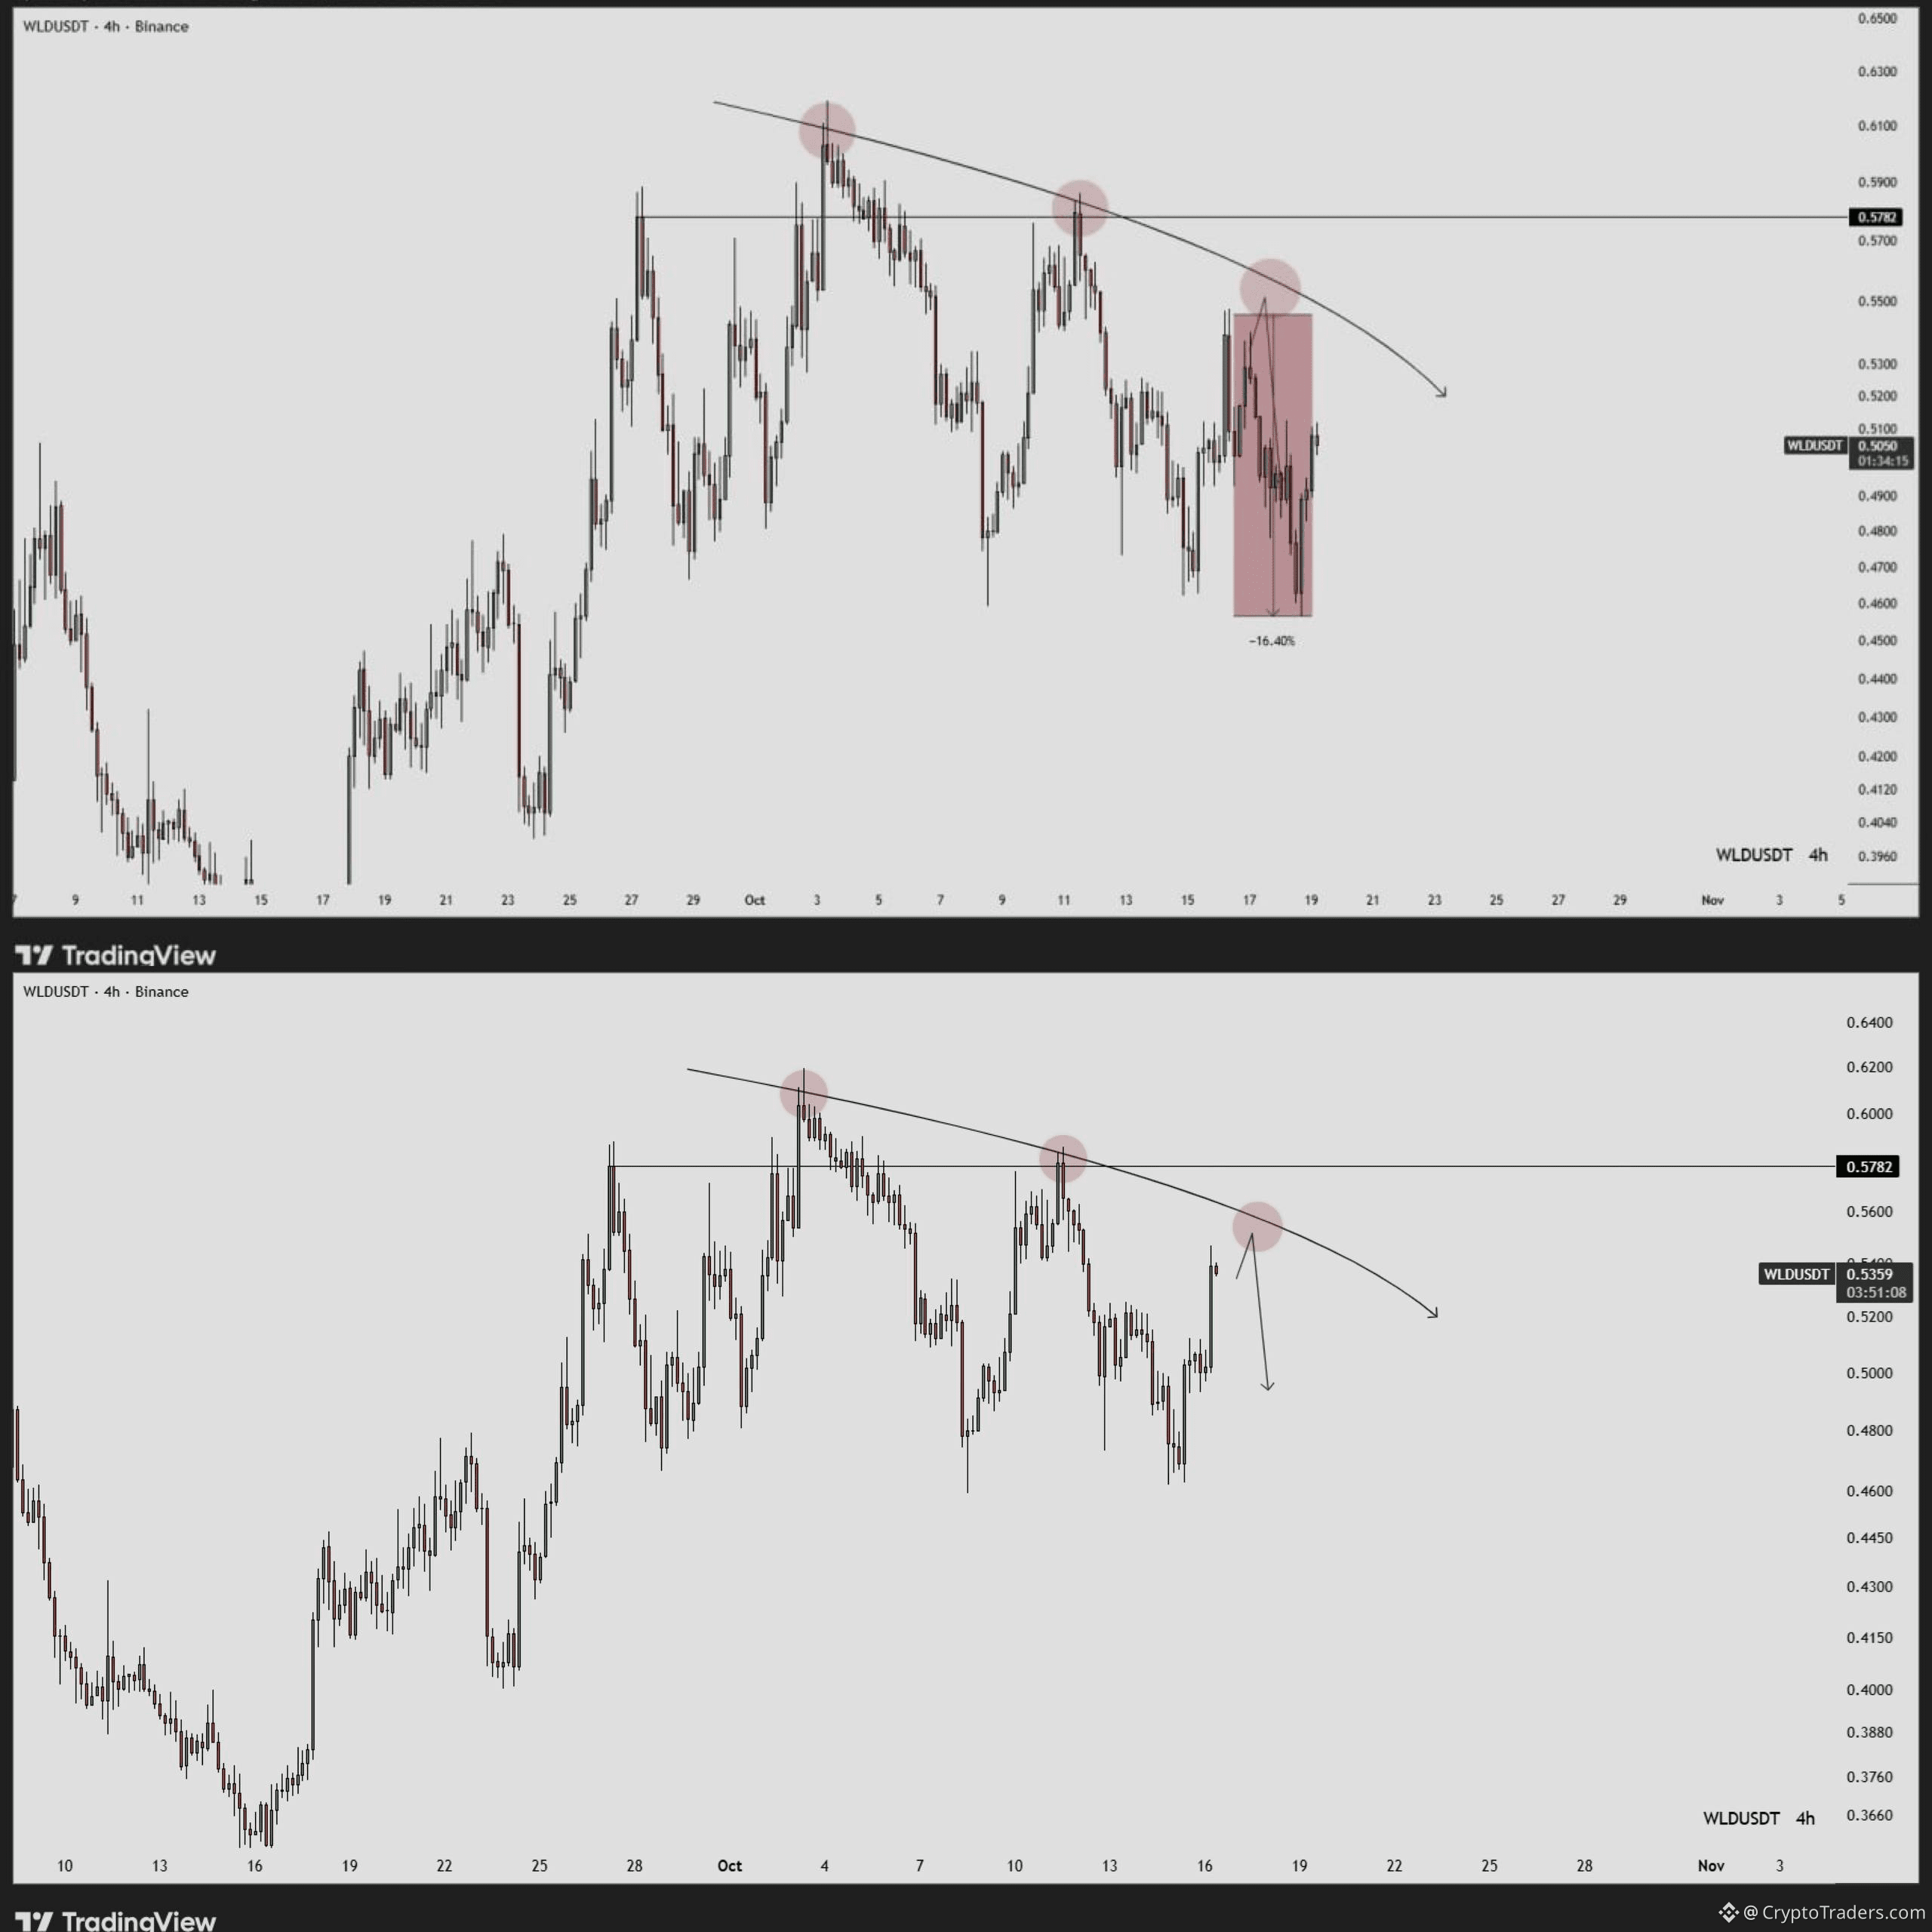
$WLD hoặc vượt đường xu hướng giảm và vùng hỗ trợ 0.5782, hoặc quay đầu từ đây như biểu đồ dự báo và đợt giảm 16.4% lại diễn ra. Khung 4H vẫn nằm dưới đường xu hướng đó, nên phe bán vẫn chiếm ưu thế cho đến khi giá đóng cửa phía trên. 0.5782 là ranh giới quyết định: lấy lại mốc này một cách dứt khoát sẽ đảo chiều cấu trúc, còn bị từ chối tại đó thì xu hướng giảm vẫn còn nguyên. Cho đến lúc ấy, nhịp bật tăng +9.5% chỉ là cú kiểm tra lại trong bối cảnh giảm giá, chứ không phải đổi xu hướng. Tín hiệu giảm giá bị vô hiệu nếu giá đóng cửa dứt khoát trên 0.5782. Bạn nghĩ nhịp bật này còn đủ đà vượt 0.5782 không, hay lại là một cú bị từ chối nữa? Mỗi ngày nhóm đều đăng thêm những biểu đồ như thế này; xem bio để biết cách tham gia. #MùaAltcoin#
$WLD hoặc vượt đường xu hướng giảm và vùng hỗ trợ 0.5782, hoặc quay đầu từ đây như biểu đồ dự báo và đợt giảm 16.4% lại diễn ra. Khung 4H vẫn nằm dưới đường xu hướng đó, nên phe bán vẫn chiếm ưu thế cho đến khi giá đóng cửa phía trên. 0.5782 là ranh giới quyết định: lấy lại mốc này một cách dứt khoát sẽ đảo chiều cấu trúc, còn bị từ chối tại đó thì xu hướng giảm vẫn còn nguyên. Cho đến lúc ấy, nhịp bật tăng +9.5% chỉ là cú kiểm tra lại trong bối cảnh giảm giá, chứ không phải đổi xu hướng. Tín hiệu giảm giá bị vô hiệu nếu giá đóng cửa dứt khoát trên 0.5782. Bạn nghĩ nhịp bật này còn đủ đà vượt 0.5782 không, hay lại là một cú bị từ chối nữa? Mỗi ngày nhóm đều đăng thêm những biểu đồ như thế này; xem bio để biết cách tham gia. #MùaAltcoin#
41
Xem bản dịch
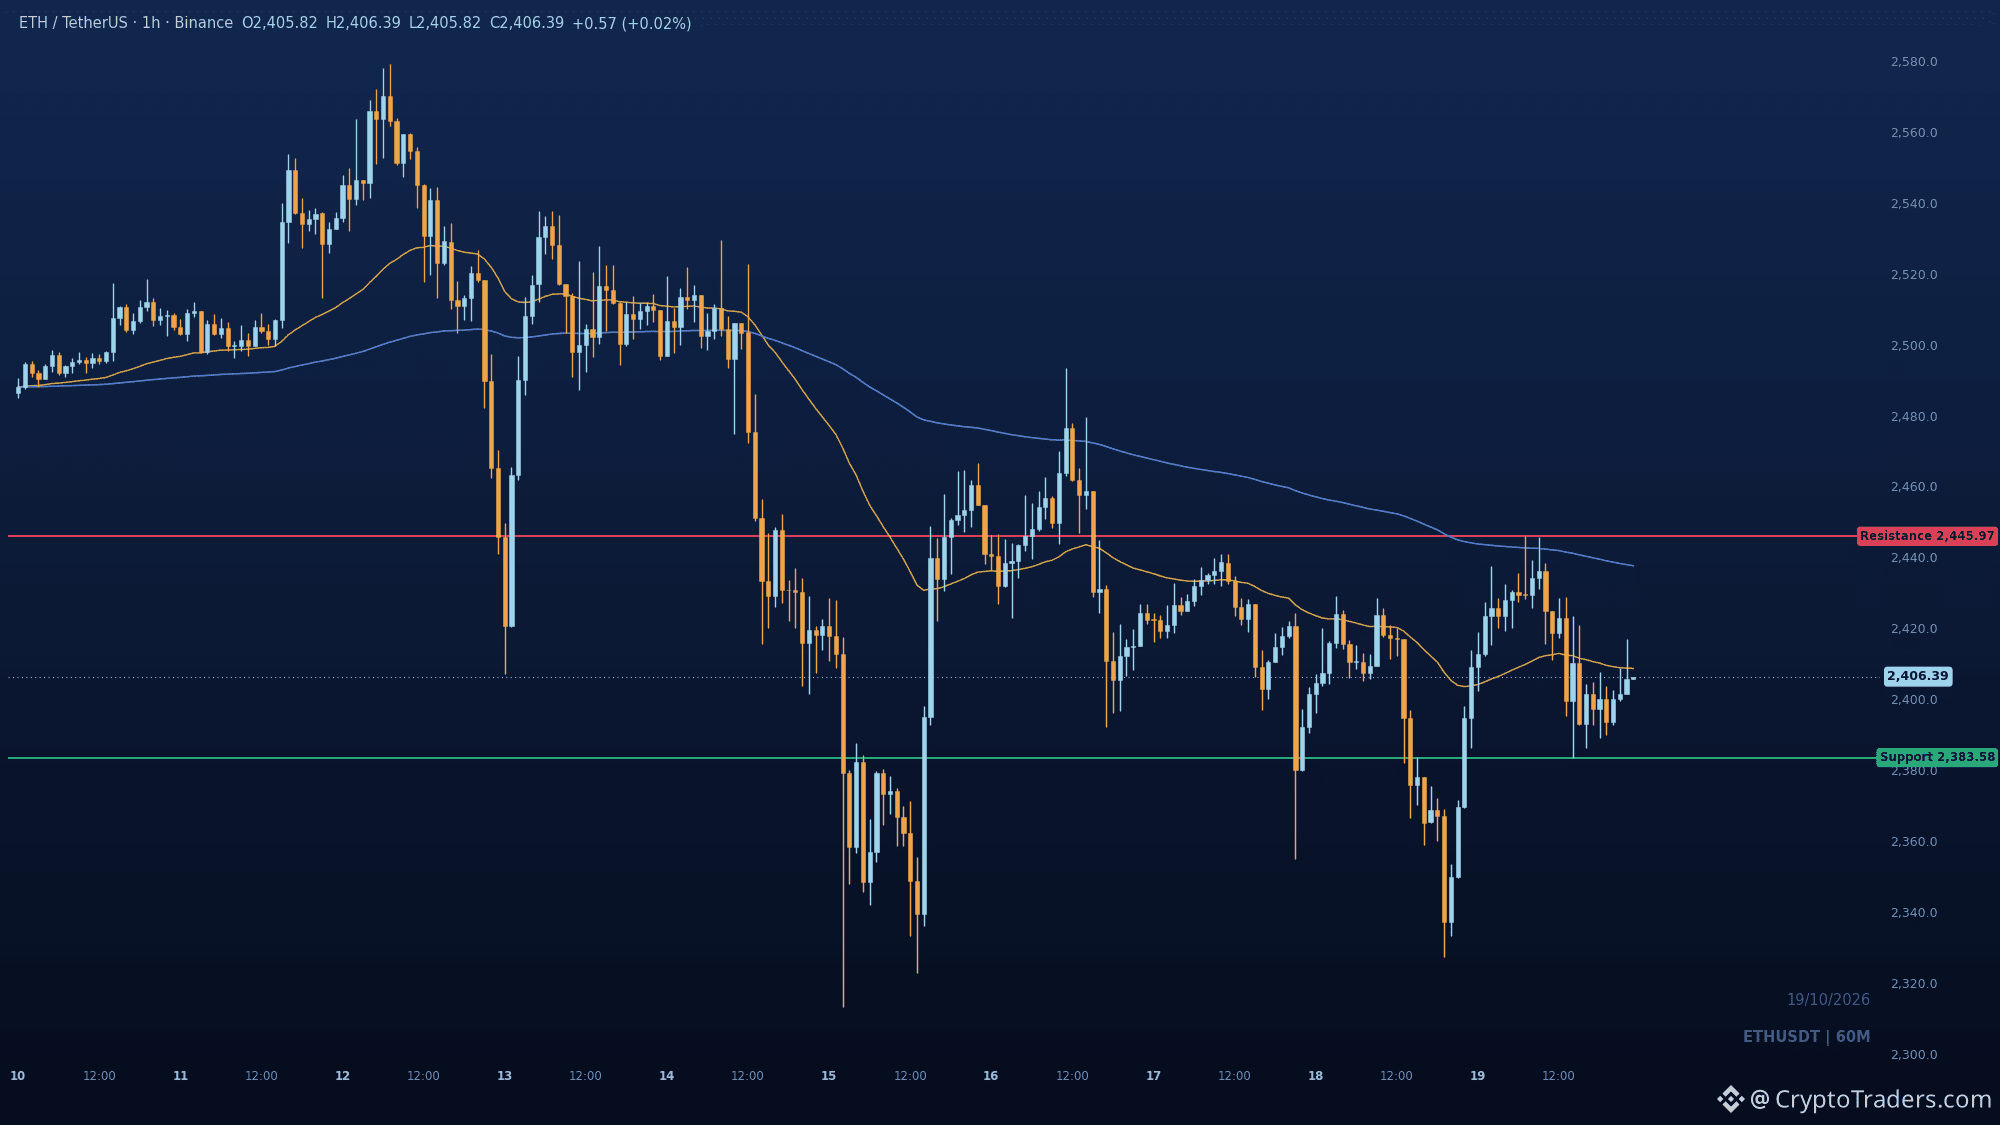
$ETH is pinned between the 2408.70 fast EMA it just tagged and the 2383.58 swing low buyers keep defending, and that standoff resolves soon. The bounce off 2383.58 was real but price still trades under both EMAs and in discount. Sellers have a clean spot to work with at 2408.70; a rejection there sends it back at the swing low. Reclaiming 2445.97 is what flips this from a dead-cat bounce into something with legs. Where do you think ETH closes the day, above 2445 or back under 2383? More chart reads like this land daily in the group, bio has the way in. #Altcoin Season#
$ETH is pinned between the 2408.70 fast EMA it just tagged and the 2383.58 swing low buyers keep defending, and that standoff resolves soon. The bounce off 2383.58 was real but price still trades under both EMAs and in discount. Sellers have a clean spot to work with at 2408.70; a rejection there sends it back at the swing low. Reclaiming 2445.97 is what flips this from a dead-cat bounce into something with legs. Where do you think ETH closes the day, above 2445 or back under 2383? More chart reads like this land daily in the group, bio has the way in. #Altcoin Season#
64
Xem bản dịch
Bitcoin ETFs lost 614.7 million while $BTC still added 1.4 percent, and that gap tells the real story 📊 1⃣ **Flows favor BTC over ETH** US spot Ether ETFs bled 924.5 million from October 1 to 16, more than wiping out their 825.3 million September intake, with redemptions in 11 of 12 sessions. Bitcoin funds shed 614.7 million yet kept most of September's 2.65 billion, so institutional demand is cooling unevenly and BTC is holding the stronger hand. 2⃣ **Custody risk moves to hardware** A Ledger Nano X bought from a German retailer was reportedly found with an implant that can read and transmit recovery words during setup, and the genuine-device check may not catch it. That is a supply-chain problem for self-custody confidence, not a price story yet. 3⃣ **Liquidity gaps hide in staking pools** Papertrade paid out 2.12 million to stakers, but house funds after open profits sat at 4.22 million against a 4.91 million LP balance. No shortfall is reported, though payouts could queue if winning traders pull more USDC than is on hand. Price resilience is real, but the flow split and custody headlines say conviction is narrower than the green candle suggests. Which matters more for the next leg, ETF flows or self-custody trust? A fuller chart set like this lands in the group every day, and my bio shows the way. #BTC Price Analysis# #Bitcoin Price Prediction: What is Bitcoins next move?# #Macro Insights#
Bitcoin ETFs lost 614.7 million while $BTC still added 1.4 percent, and that gap tells the real story 📊 1⃣ **Flows favor BTC over ETH** US spot Ether ETFs bled 924.5 million from October 1 to 16, more than wiping out their 825.3 million September intake, with redemptions in 11 of 12 sessions. Bitcoin funds shed 614.7 million yet kept most of September's 2.65 billion, so institutional demand is cooling unevenly and BTC is holding the stronger hand. 2⃣ **Custody risk moves to hardware** A Ledger Nano X bought from a German retailer was reportedly found with an implant that can read and transmit recovery words during setup, and the genuine-device check may not catch it. That is a supply-chain problem for self-custody confidence, not a price story yet. 3⃣ **Liquidity gaps hide in staking pools** Papertrade paid out 2.12 million to stakers, but house funds after open profits sat at 4.22 million against a 4.91 million LP balance. No shortfall is reported, though payouts could queue if winning traders pull more USDC than is on hand. Price resilience is real, but the flow split and custody headlines say conviction is narrower than the green candle suggests. Which matters more for the next leg, ETF flows or self-custody trust? A fuller chart set like this lands in the group every day, and my bio shows the way. #BTC Price Analysis# #Bitcoin Price Prediction: What is Bitcoins next move?# #Macro Insights#
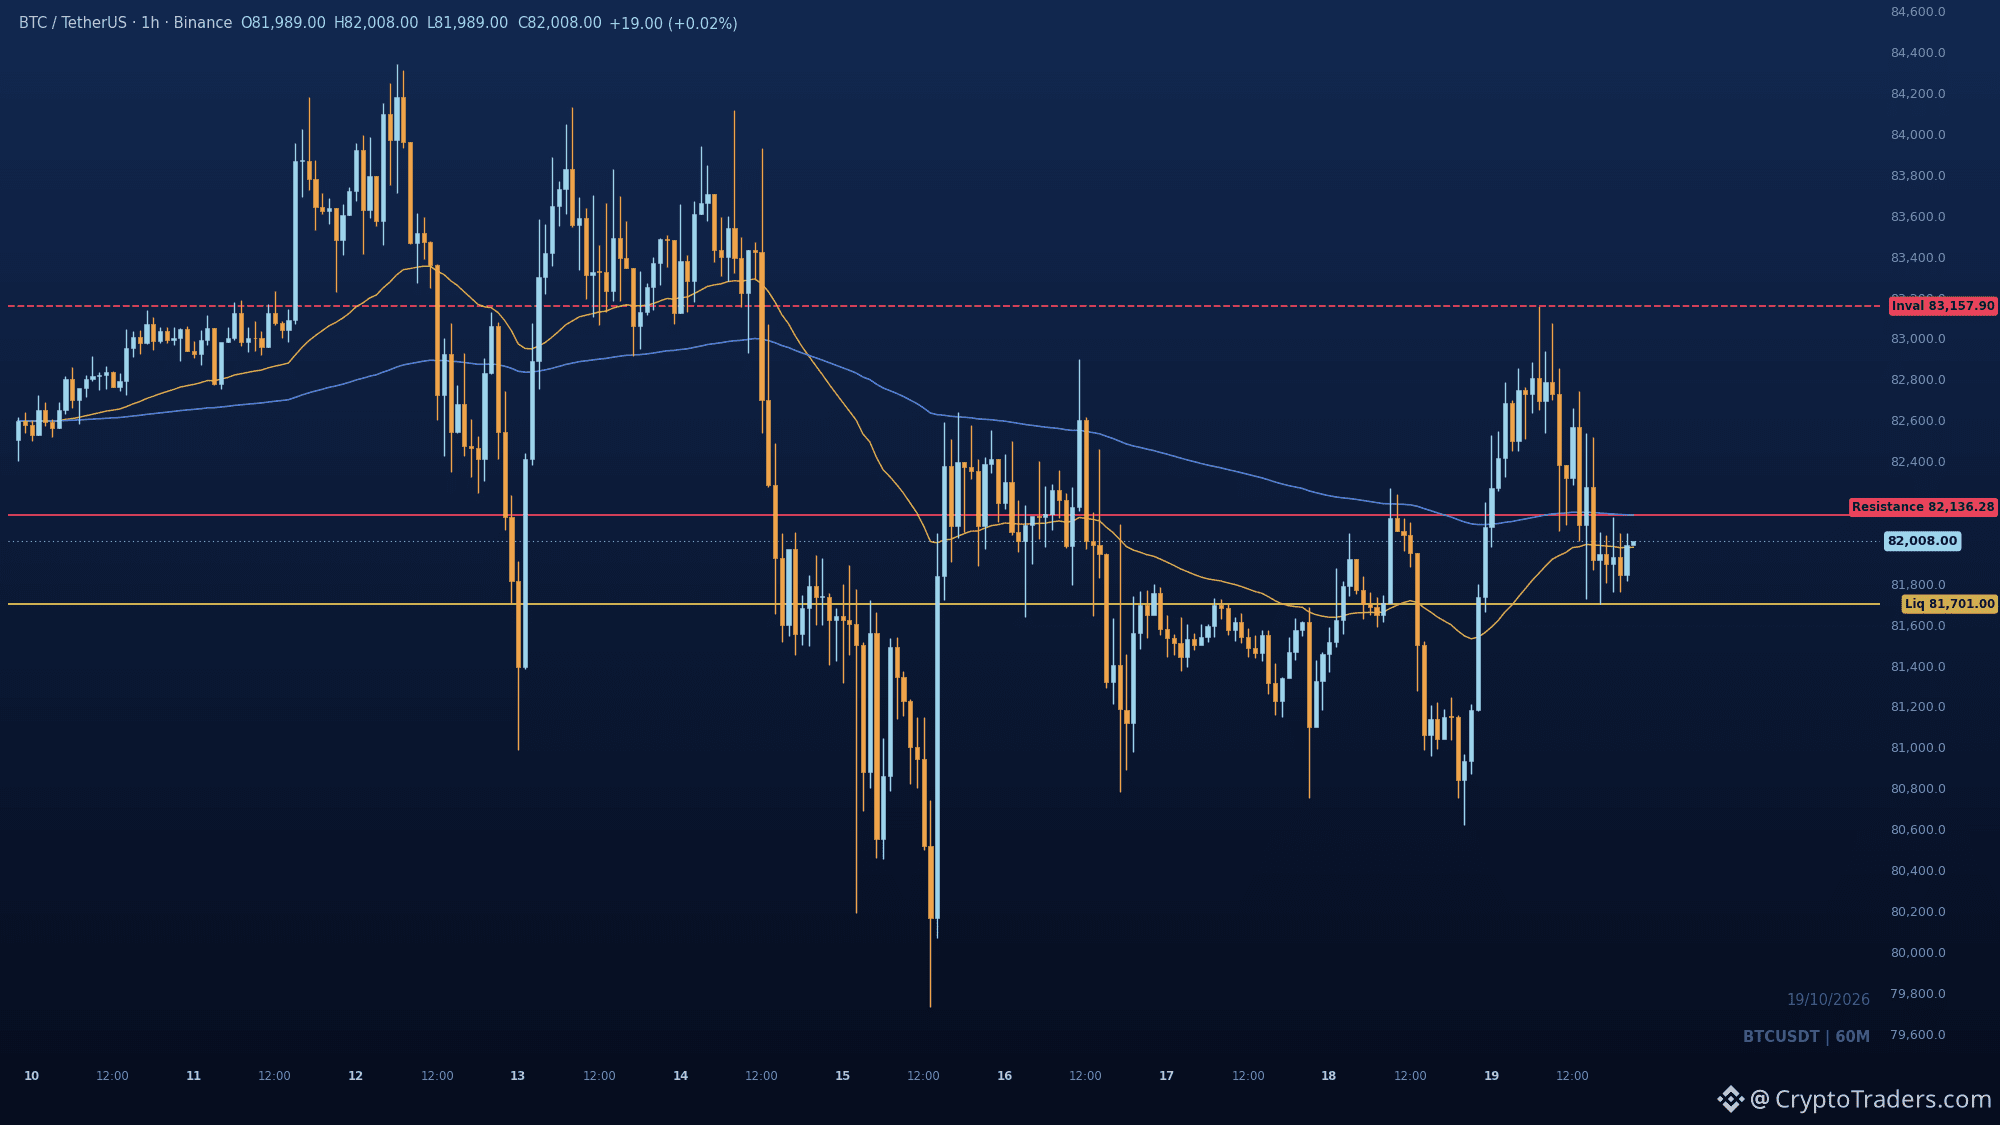
74
Xem bản dịch
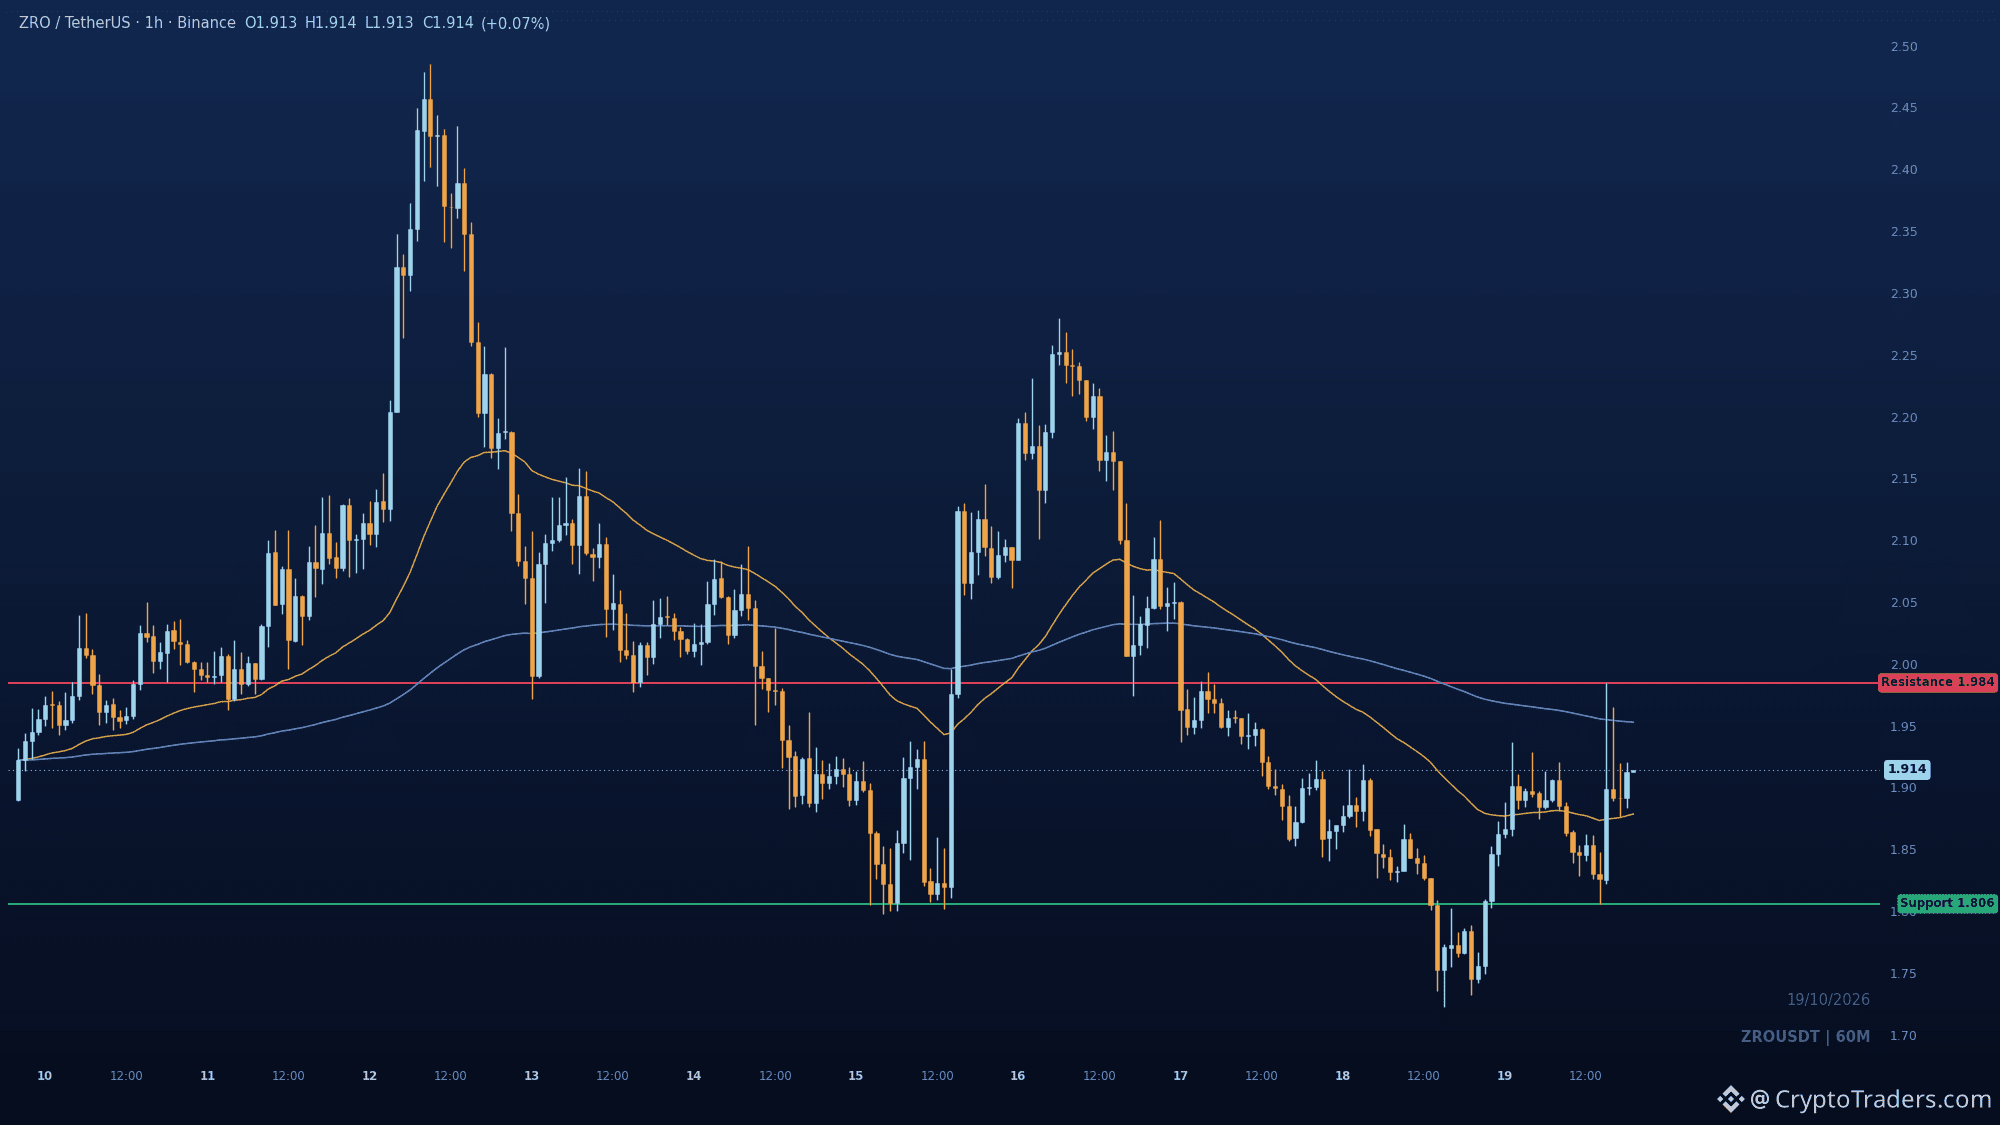
$ZRO swept lows at 1.74, reclaimed short-term structure, and is now up 7.2% on the day, but the rebound is pressed right into overhead supply. The 1h shows a bullish CHoCH off the discount, with the broader trend still bearish and price in the lower half of the range. Key support sits at 1.8058, the recent swing low. Holding above it keeps the bounce alive. Upside target is 1.9845, the recent swing high where buy-side liquidity rests. Rejection there favors renewed downside. Which comes first for you, a push into 1.9845 or a slide back under 1.8058? More reads like this land daily in the group, link in bio. #Altcoin Season#
$ZRO swept lows at 1.74, reclaimed short-term structure, and is now up 7.2% on the day, but the rebound is pressed right into overhead supply. The 1h shows a bullish CHoCH off the discount, with the broader trend still bearish and price in the lower half of the range. Key support sits at 1.8058, the recent swing low. Holding above it keeps the bounce alive. Upside target is 1.9845, the recent swing high where buy-side liquidity rests. Rejection there favors renewed downside. Which comes first for you, a push into 1.9845 or a slide back under 1.8058? More reads like this land daily in the group, link in bio. #Altcoin Season#
29
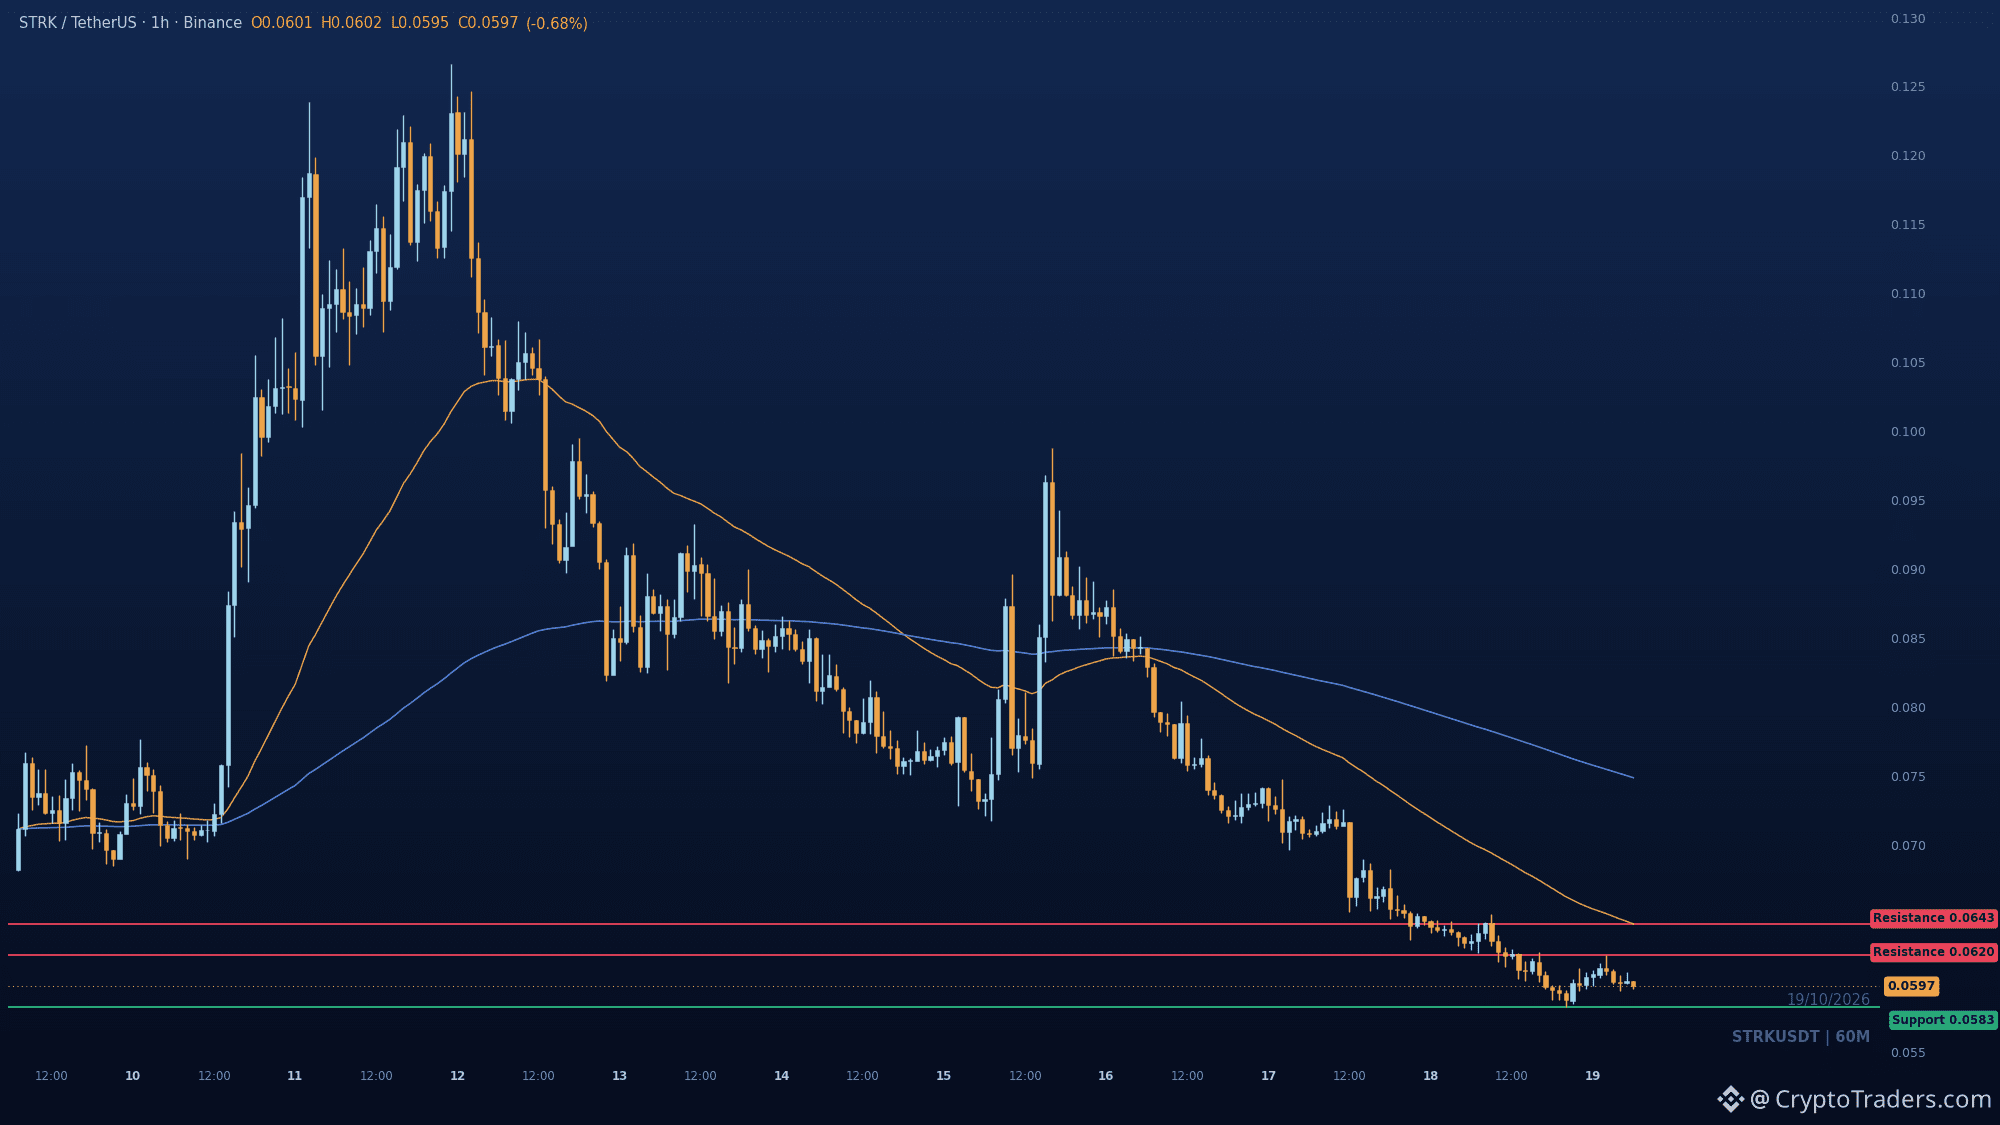
$STRK đã giảm xuống 0.05827 và đang trụ ngay tại đó, giảm 5.3% trong ngày. Cấu trúc khung 1 giờ liên tục tạo đáy thấp hơn, còn giá vẫn bị ghìm dưới cả hai đường EMA, nên vùng giá đang giao dịch ở mức chiết khấu. Nếu bật lên từ đây, giá có thể gặp kháng cự đầu tiên tại 0.06199, còn 0.06426671 mới là ngưỡng then chốt. Nếu nến 1 giờ tiếp theo đóng cửa dưới 0.05827, bên dưới gần như không có gì để đỡ giá. Bạn nghĩ vùng hỗ trợ 0.05827 sẽ trụ được bao lâu trước khi bị phá vỡ? Mỗi ngày trong nhóm đều có thêm nhiều phân tích tương tự, xem bio để biết cách tham gia. #Mùa Altcoin#
$STRK đã giảm xuống 0.05827 và đang trụ ngay tại đó, giảm 5.3% trong ngày. Cấu trúc khung 1 giờ liên tục tạo đáy thấp hơn, còn giá vẫn bị ghìm dưới cả hai đường EMA, nên vùng giá đang giao dịch ở mức chiết khấu. Nếu bật lên từ đây, giá có thể gặp kháng cự đầu tiên tại 0.06199, còn 0.06426671 mới là ngưỡng then chốt. Nếu nến 1 giờ tiếp theo đóng cửa dưới 0.05827, bên dưới gần như không có gì để đỡ giá. Bạn nghĩ vùng hỗ trợ 0.05827 sẽ trụ được bao lâu trước khi bị phá vỡ? Mỗi ngày trong nhóm đều có thêm nhiều phân tích tương tự, xem bio để biết cách tham gia. #Mùa Altcoin#
43
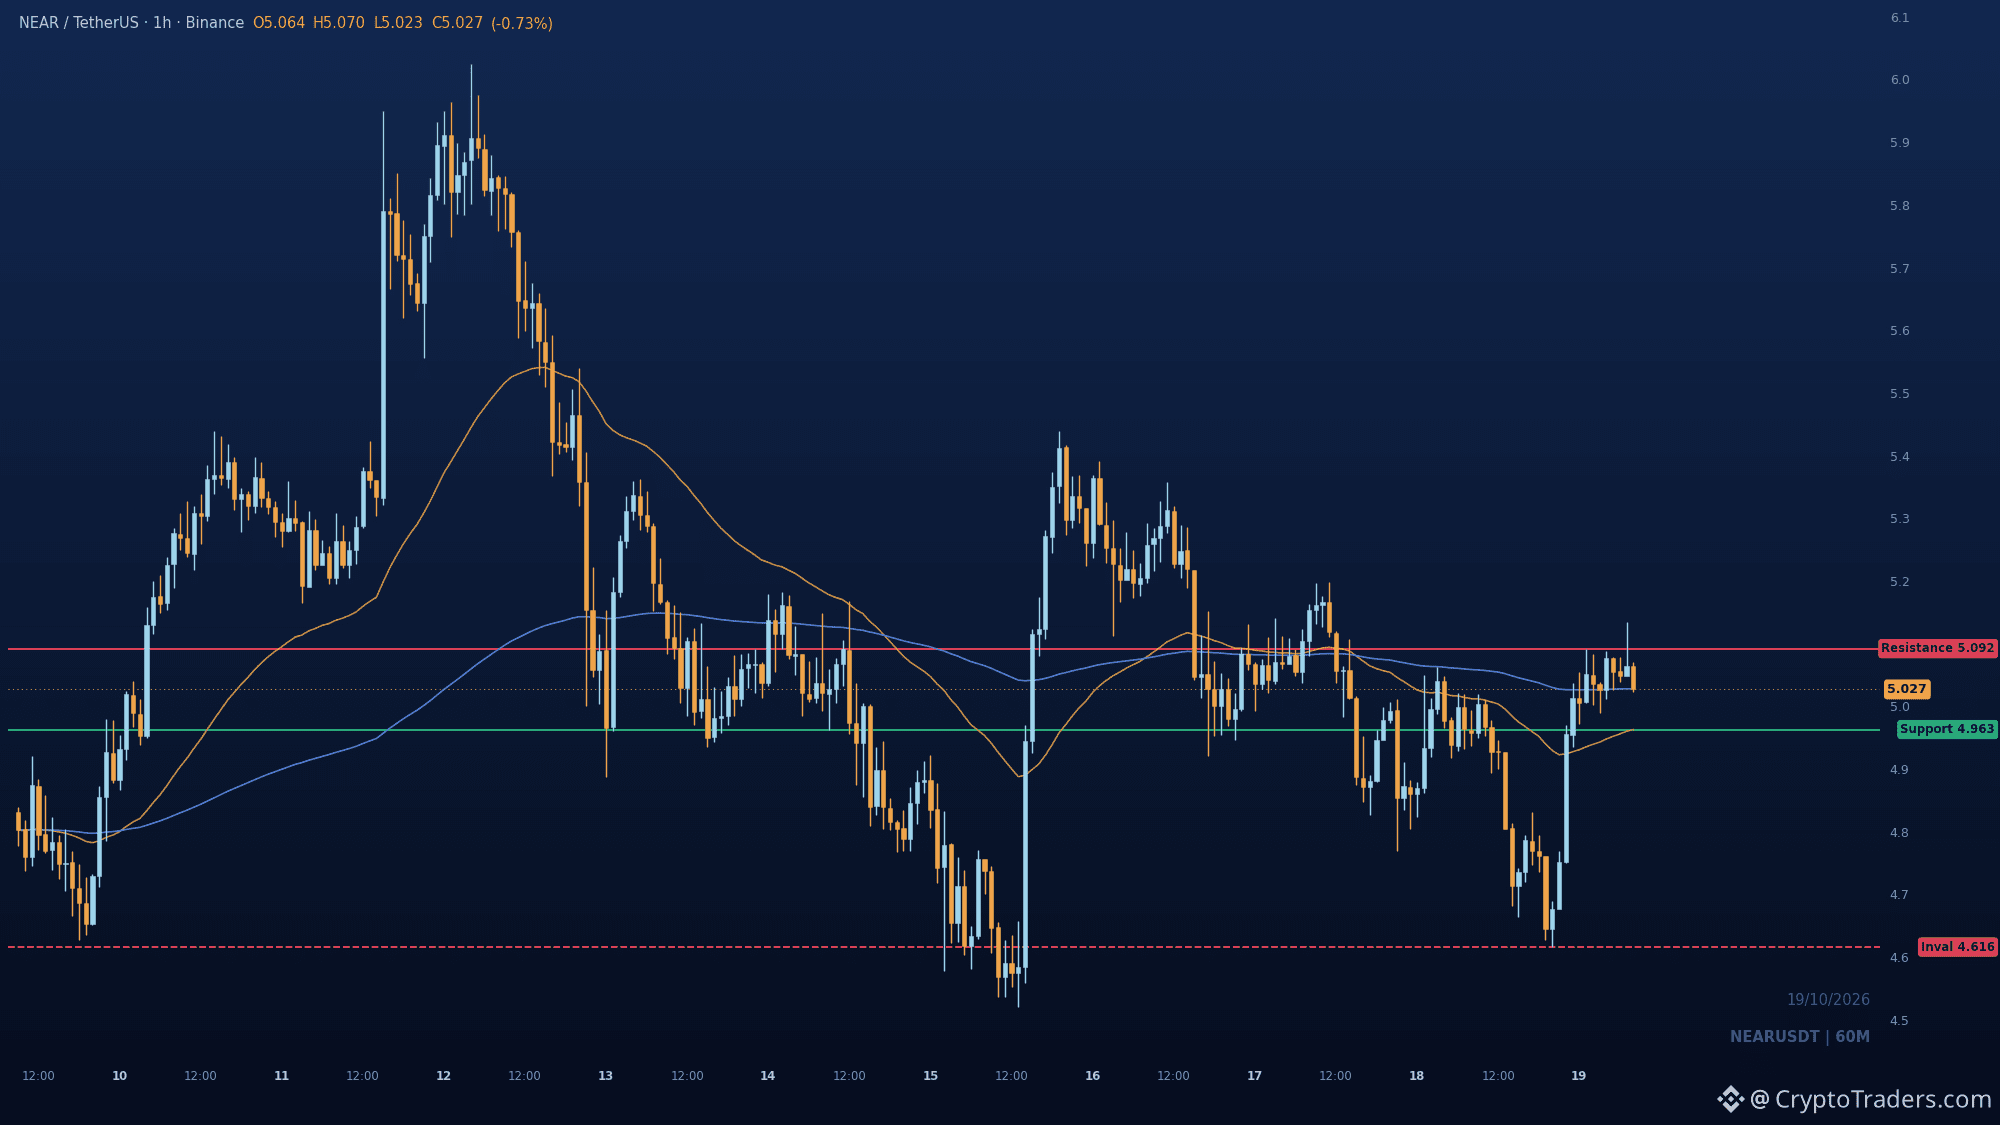
5.092. Đó là ngưỡng mà $NEAR cần vượt qua, và giá đã áp sát ngưỡng này trong vài giờ qua. Biểu đồ 1h cho thấy một cú quét thanh khoản phía bán xuống 4.616, sau đó giá nhanh chóng lấy lại EMA ngắn hạn tại 4.963. Giá đang tích lũy trong vùng chiết khấu, ngay dưới đỉnh dao động 5.092, nơi có thanh khoản phía mua. Giữ được 4.963 thì khả năng cao giá sẽ kiểm tra lại 5.092 trong vài cây nến tới. Nếu mất mốc này, 4.616 sẽ lại nằm trong tầm ngắm. Bạn nghĩ giai đoạn tích lũy này sẽ kéo dài bao lâu trước khi giá chọn hướng đi? Mỗi sáng, cộng đồng đều có những phân tích mới như thế này, ghé qua trang cá nhân để xem thêm nhé. #Mùa Altcoin#
5.092. Đó là ngưỡng mà $NEAR cần vượt qua, và giá đã áp sát ngưỡng này trong vài giờ qua. Biểu đồ 1h cho thấy một cú quét thanh khoản phía bán xuống 4.616, sau đó giá nhanh chóng lấy lại EMA ngắn hạn tại 4.963. Giá đang tích lũy trong vùng chiết khấu, ngay dưới đỉnh dao động 5.092, nơi có thanh khoản phía mua. Giữ được 4.963 thì khả năng cao giá sẽ kiểm tra lại 5.092 trong vài cây nến tới. Nếu mất mốc này, 4.616 sẽ lại nằm trong tầm ngắm. Bạn nghĩ giai đoạn tích lũy này sẽ kéo dài bao lâu trước khi giá chọn hướng đi? Mỗi sáng, cộng đồng đều có những phân tích mới như thế này, ghé qua trang cá nhân để xem thêm nhé. #Mùa Altcoin#
50
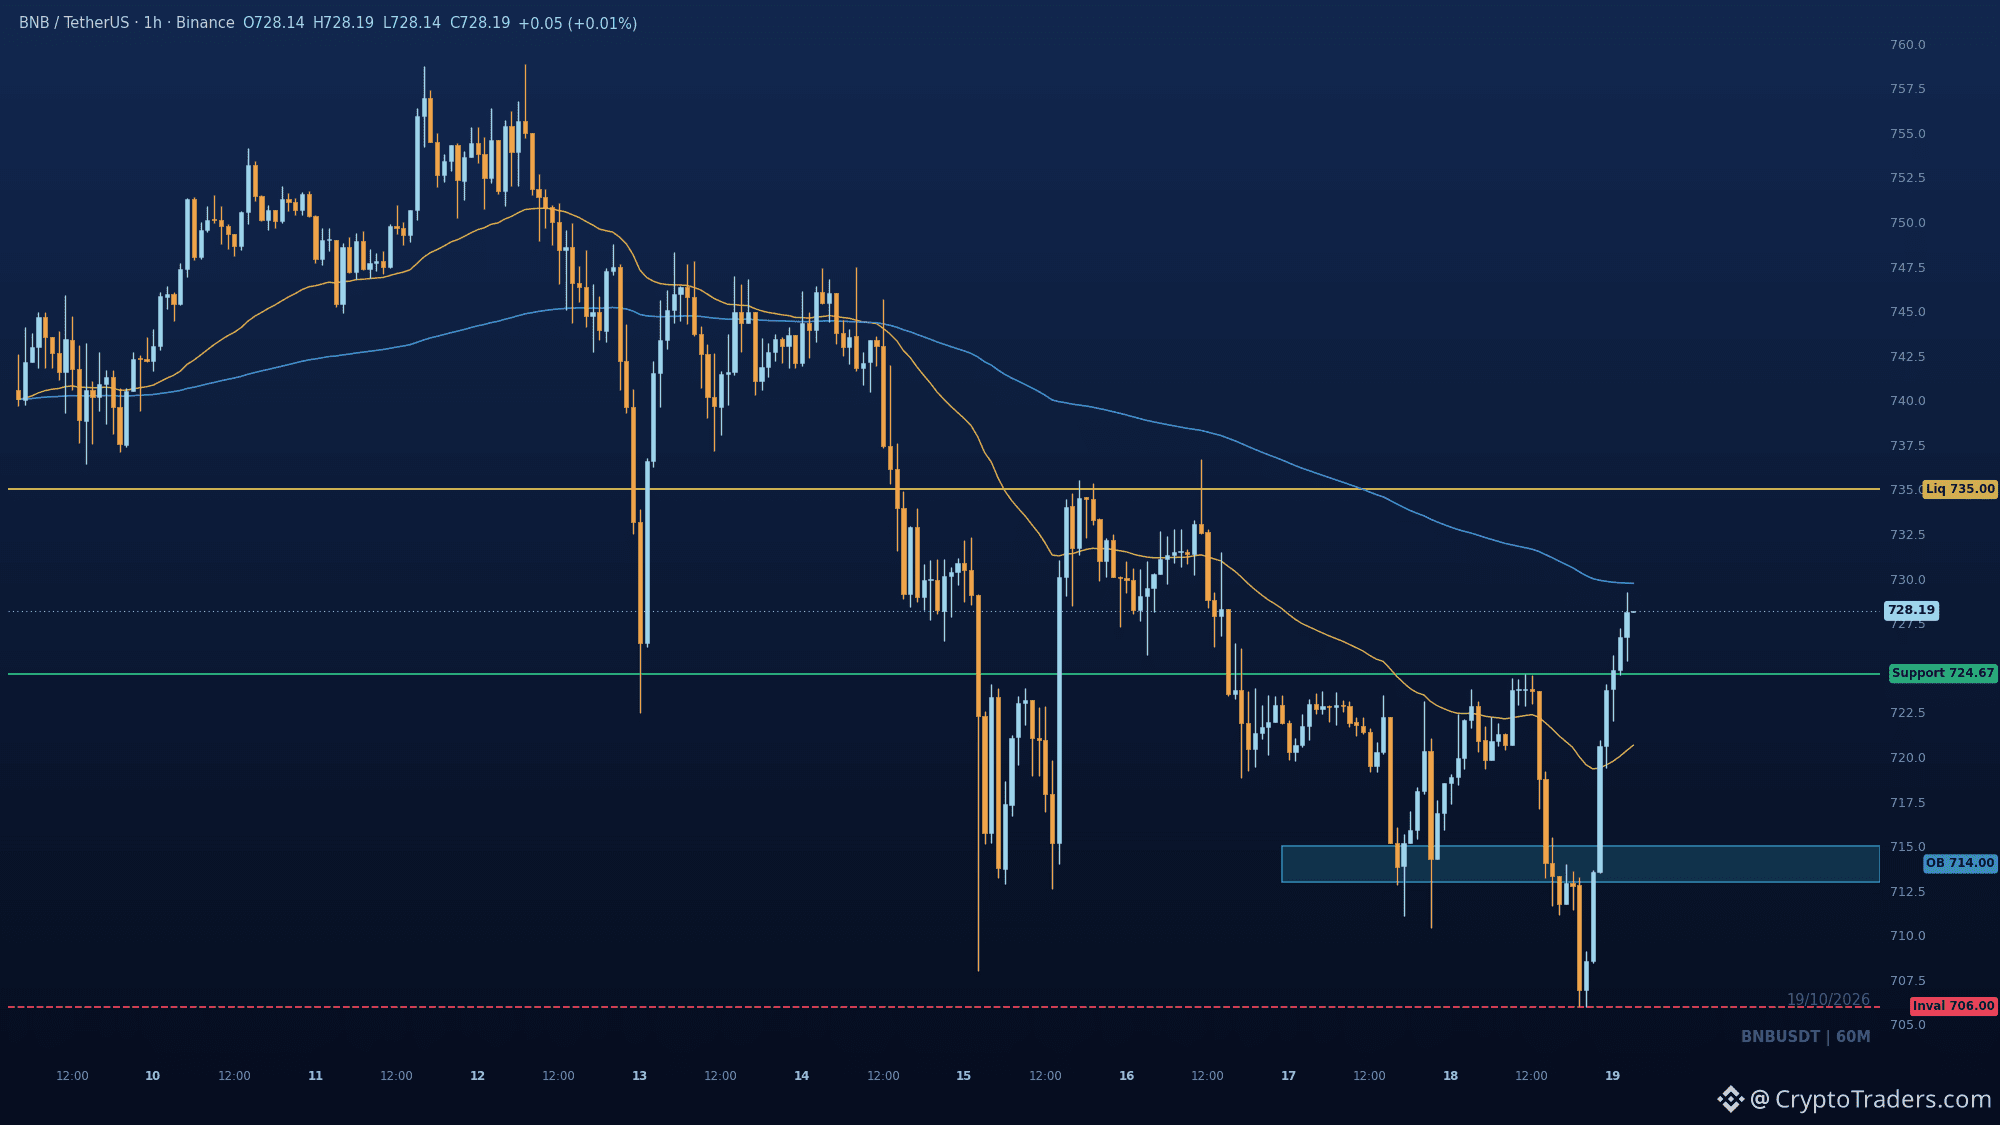
BNB giữ vững mốc giành lại 724.67 trong khi vụ khai thác lỗ hổng Cysic làm giảm niềm tin vào BSC $BNB đang giao dịch quanh mức 727.75, tăng 0.8 phần trăm trong ngày, và biểu đồ một giờ cho thấy nhiều điều hơn những gì con số tiêu đề gợi ra. Cú quét xuống 706.00 đã bị đảo ngược và đỉnh dao động trước đó tại 724.67 đã được giành lại, đánh dấu sự thay đổi cấu trúc theo hướng tăng giá trên khung thời gian này. Bối cảnh trái chiều. Các công cụ theo dõi on-chain phát hiện việc phát hành trái phép 10 triệu CYS trên BNB Smart Chain vào ngày 17 tháng 10, và Cysic đã đình chỉ cầu nối xuyên chuỗi để ứng phó. Khoảng 2.8 triệu CYS vẫn nằm trong địa chỉ nhận sau khi địa chỉ này bị đưa vào danh sách đen; tác động về giá trị đô la vẫn đang được xem xét, còn dự án cho biết mainnet và tài sản do người dùng nắm giữ không bị ảnh hưởng. Thiệt hại đã được khoanh vùng, nhưng sự việc gây áp lực lên niềm tin đối với hạ tầng BNB Chain hơn là với bản thân BNB. Yếu tố hỗ trợ là sự chú ý: BNB xuất hiện trên truyền hình quốc gia Việt Nam bên cạnh BTC và ETH là kiểu đưa tin thu hút sự quan tâm của nhà đầu tư nhỏ lẻ. Biểu đồ: sau khi quét đáy 706.00, giá đang nằm ở nửa chiết khấu của biên độ giao dịch. Đỉnh dao động tại 724.67 vừa được giành lại là mức quan trọng, và ngay bên dưới, một vùng lệnh hẹp ở 713 đến 715 đánh dấu nền giá khởi đầu cho nhịp hồi. Tôi kỳ vọng nhịp kiểm tra lại 724.67 sẽ được bảo vệ, sau đó giá tiến lên 735.00, nơi đỉnh nhịp hồi trước đó tập trung thanh khoản phía mua. Nếu mất 724.67, sự chuyển dịch này sẽ suy yếu; một phiên đóng cửa trở lại dưới 706.00 sẽ vô hiệu hóa nó. Cần theo dõi: liệu 724.67 có trụ vững khi được kiểm tra lại hay không, liệu vùng nền 713 đến 715 có bị chạm mà không phá xuống thấp hơn hay không, và mọi động thái của 2.8 triệu CYS còn lại trong địa chỉ bị đưa vào danh sách đen. Điều gì sẽ xảy ra trước: giá kiểm tra lại 724.67 hay tăng lên vùng thanh khoản 735.00? Tôi đăng các phân tích biểu đồ như thế này hằng ngày trong nhóm, bạn có thể tìm thấy thông tin trong phần tiểu sử. #Mùa Altcoin# #Góc nhìn vĩ mô#
BNB giữ vững mốc giành lại 724.67 trong khi vụ khai thác lỗ hổng Cysic làm giảm niềm tin vào BSC $BNB đang giao dịch quanh mức 727.75, tăng 0.8 phần trăm trong ngày, và biểu đồ một giờ cho thấy nhiều điều hơn những gì con số tiêu đề gợi ra. Cú quét xuống 706.00 đã bị đảo ngược và đỉnh dao động trước đó tại 724.67 đã được giành lại, đánh dấu sự thay đổi cấu trúc theo hướng tăng giá trên khung thời gian này. Bối cảnh trái chiều. Các công cụ theo dõi on-chain phát hiện việc phát hành trái phép 10 triệu CYS trên BNB Smart Chain vào ngày 17 tháng 10, và Cysic đã đình chỉ cầu nối xuyên chuỗi để ứng phó. Khoảng 2.8 triệu CYS vẫn nằm trong địa chỉ nhận sau khi địa chỉ này bị đưa vào danh sách đen; tác động về giá trị đô la vẫn đang được xem xét, còn dự án cho biết mainnet và tài sản do người dùng nắm giữ không bị ảnh hưởng. Thiệt hại đã được khoanh vùng, nhưng sự việc gây áp lực lên niềm tin đối với hạ tầng BNB Chain hơn là với bản thân BNB. Yếu tố hỗ trợ là sự chú ý: BNB xuất hiện trên truyền hình quốc gia Việt Nam bên cạnh BTC và ETH là kiểu đưa tin thu hút sự quan tâm của nhà đầu tư nhỏ lẻ. Biểu đồ: sau khi quét đáy 706.00, giá đang nằm ở nửa chiết khấu của biên độ giao dịch. Đỉnh dao động tại 724.67 vừa được giành lại là mức quan trọng, và ngay bên dưới, một vùng lệnh hẹp ở 713 đến 715 đánh dấu nền giá khởi đầu cho nhịp hồi. Tôi kỳ vọng nhịp kiểm tra lại 724.67 sẽ được bảo vệ, sau đó giá tiến lên 735.00, nơi đỉnh nhịp hồi trước đó tập trung thanh khoản phía mua. Nếu mất 724.67, sự chuyển dịch này sẽ suy yếu; một phiên đóng cửa trở lại dưới 706.00 sẽ vô hiệu hóa nó. Cần theo dõi: liệu 724.67 có trụ vững khi được kiểm tra lại hay không, liệu vùng nền 713 đến 715 có bị chạm mà không phá xuống thấp hơn hay không, và mọi động thái của 2.8 triệu CYS còn lại trong địa chỉ bị đưa vào danh sách đen. Điều gì sẽ xảy ra trước: giá kiểm tra lại 724.67 hay tăng lên vùng thanh khoản 735.00? Tôi đăng các phân tích biểu đồ như thế này hằng ngày trong nhóm, bạn có thể tìm thấy thông tin trong phần tiểu sử. #Mùa Altcoin# #Góc nhìn vĩ mô#
72
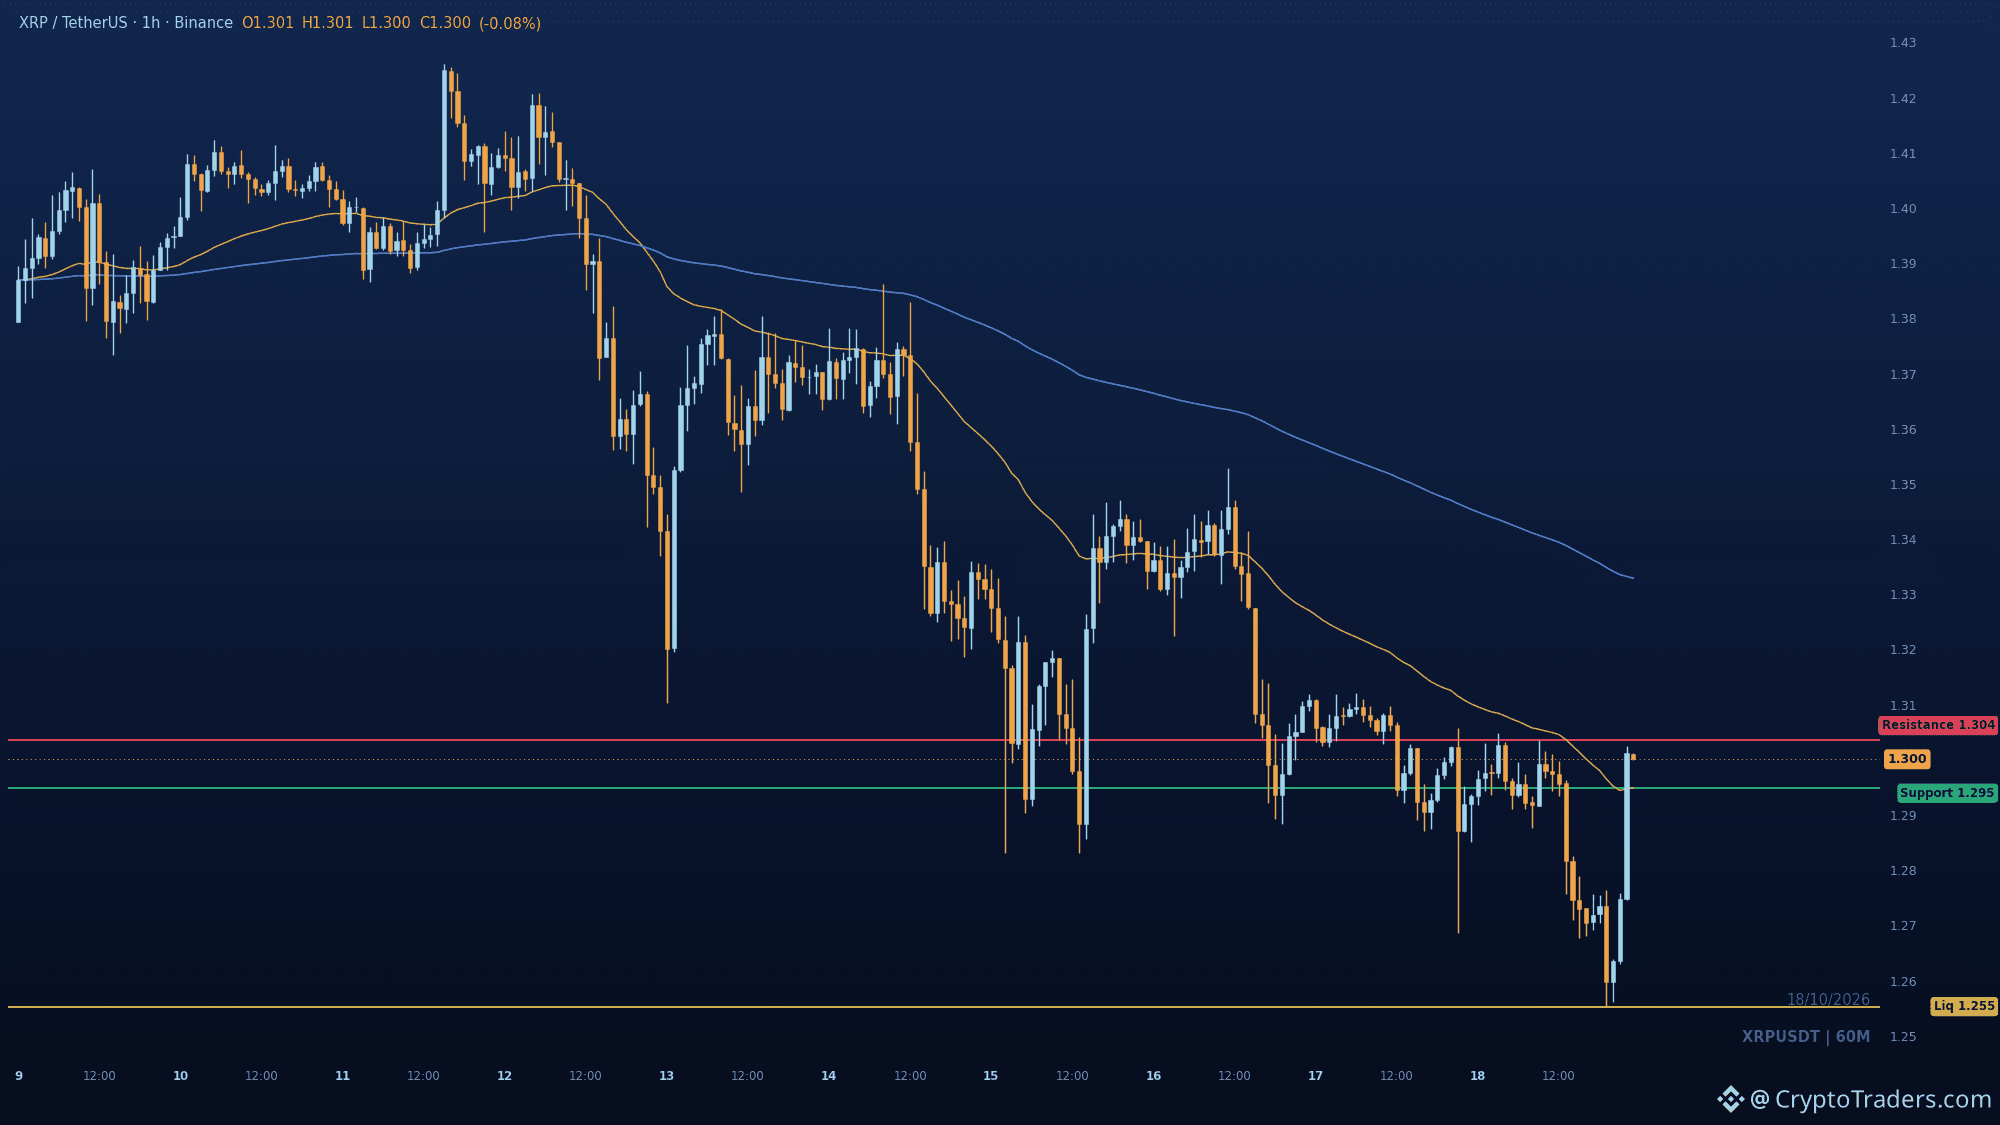
Hoặc $XRP giữ được mốc 1.2949 và dần phục hồi về phía 1.3036, hoặc ngưỡng hỗ trợ đó bị phá vỡ và mốc 1.2553 lại trở thành mục tiêu. Đà bật lên từ đáy vừa quét qua là có thật, nhưng đường EMA 200 đang dốc xuống vẫn đè nặng lên giá, và vùng giá vẫn nằm trong vùng chiết khấu. 1.2949 là EMA nhanh, vì vậy hãy chú ý phản ứng của giá khi lần đầu điều chỉnh về mốc này. Nếu đóng cửa trên 1.3036, nhận định về đà tiếp diễn giảm giá sẽ suy yếu, và đỉnh dao động gần đây sẽ lại được chú ý. Nếu không giữ được 1.2949, 1.2553 vẫn là mục tiêu cấu trúc phía dưới. Bạn nghĩ giá sẽ kiểm tra phía nào của mốc 1.2949 trước? Mỗi ngày nhóm đều chia sẻ thêm những phân tích như thế này, và bạn có thể tìm cách tham gia trong phần tiểu sử của tôi. #Mùa Altcoin#
Hoặc $XRP giữ được mốc 1.2949 và dần phục hồi về phía 1.3036, hoặc ngưỡng hỗ trợ đó bị phá vỡ và mốc 1.2553 lại trở thành mục tiêu. Đà bật lên từ đáy vừa quét qua là có thật, nhưng đường EMA 200 đang dốc xuống vẫn đè nặng lên giá, và vùng giá vẫn nằm trong vùng chiết khấu. 1.2949 là EMA nhanh, vì vậy hãy chú ý phản ứng của giá khi lần đầu điều chỉnh về mốc này. Nếu đóng cửa trên 1.3036, nhận định về đà tiếp diễn giảm giá sẽ suy yếu, và đỉnh dao động gần đây sẽ lại được chú ý. Nếu không giữ được 1.2949, 1.2553 vẫn là mục tiêu cấu trúc phía dưới. Bạn nghĩ giá sẽ kiểm tra phía nào của mốc 1.2949 trước? Mỗi ngày nhóm đều chia sẻ thêm những phân tích như thế này, và bạn có thể tìm cách tham gia trong phần tiểu sử của tôi. #Mùa Altcoin#
Hoặc $XRP giữ được mốc 1.2949 và dần hồi lên 1.3036, hoặc vùng đỡ đó bị phá vỡ và mốc 1.2553 lại trở thành mục tiêu. Nhịp bật lên từ đáy vừa bị quét là có thật, nhưng đường EMA 200 đang đi xuống vẫn đè nặng lên giá, còn vùng giá vẫn nằm trong vùng chiết khấu. 1.2949 là đường EMA nhanh, vì vậy hãy chú ý phản ứng của giá trong nhịp điều chỉnh đầu tiên về vùng này. Một phiên đóng cửa trên 1.3036 sẽ làm suy yếu nhận định giá tiếp tục giảm và đưa đỉnh dao động gần đây trở lại tâm điểm. Nếu không giữ được 1.2949, 1.2553 vẫn là mục tiêu cấu trúc ở phía dưới. Bạn nghĩ giá sẽ kiểm tra phía nào của mốc 1.2949 trước? Mỗi ngày, nhóm đều có thêm những bài phân tích như thế này; bạn có thể xem cách tham gia trong phần tiểu sử của tôi. #Mùa Altcoin#
Hoặc $XRP giữ được mốc 1.2949 và dần hồi lên 1.3036, hoặc vùng đỡ đó bị phá vỡ và mốc 1.2553 lại trở thành mục tiêu. Nhịp bật lên từ đáy vừa bị quét là có thật, nhưng đường EMA 200 đang đi xuống vẫn đè nặng lên giá, còn vùng giá vẫn nằm trong vùng chiết khấu. 1.2949 là đường EMA nhanh, vì vậy hãy chú ý phản ứng của giá trong nhịp điều chỉnh đầu tiên về vùng này. Một phiên đóng cửa trên 1.3036 sẽ làm suy yếu nhận định giá tiếp tục giảm và đưa đỉnh dao động gần đây trở lại tâm điểm. Nếu không giữ được 1.2949, 1.2553 vẫn là mục tiêu cấu trúc ở phía dưới. Bạn nghĩ giá sẽ kiểm tra phía nào của mốc 1.2949 trước? Mỗi ngày, nhóm đều có thêm những bài phân tích như thế này; bạn có thể xem cách tham gia trong phần tiểu sử của tôi. #Mùa Altcoin#
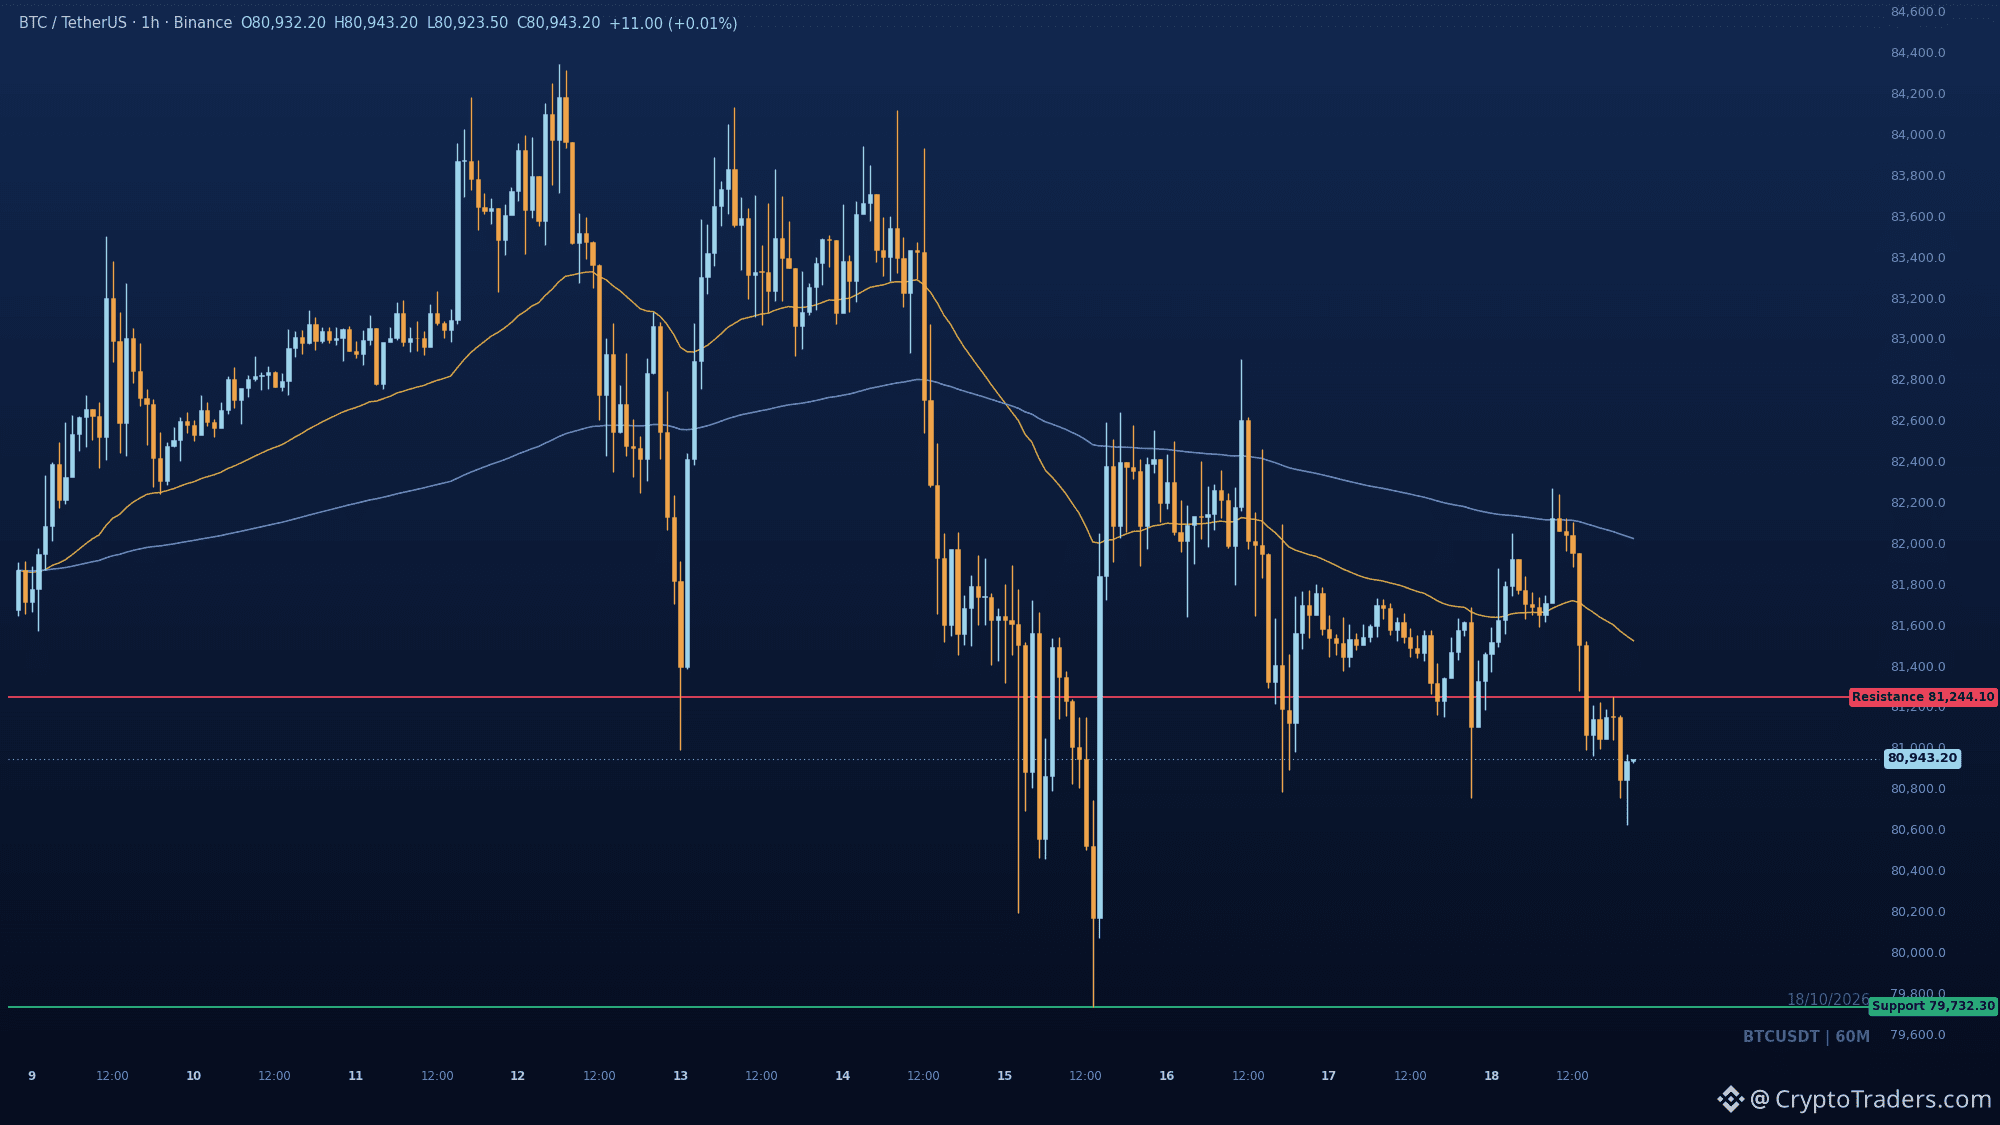
Niềm tin vào ví phần cứng bị lung lay trong khi các quỹ ETF $BTC vẫn giữ được phần lớn dòng tiền tháng 9 🔐 1⃣ Cảnh báo về chuỗi cung ứng: Một chiếc Ledger Nano X mua từ nhà bán lẻ ở Đức được cho là đã bị phát hiện cài thiết bị có thể đọc và truyền cụm từ khôi phục trong quá trình thiết lập. Công cụ kiểm tra thiết bị chính hãng của Ledger có thể không phát hiện được kiểu sửa đổi này, còn các trang lừa đảo đã bắt chước quy trình cập nhật của Ledger để đánh cắp cụm từ hạt giống. 2⃣ Nhu cầu ETH rạn nứt: Các quỹ ETF Ether giao ngay tại Mỹ ghi nhận dòng tiền rút ra 924,5 triệu từ ngày 1 đến ngày 16 tháng 10, xóa sạch hơn cả mức dòng tiền vào 825,3 triệu của tháng 9, với dòng tiền rút ra trong 11 trên 12 phiên. Các quỹ ETF Bitcoin mất 614,7 triệu nhưng vẫn giữ được phần lớn dòng tiền vào 2,65 tỷ của tháng 9. 3⃣ Đòn bẩy xoay vòng: Bản beta Yolo chưa được kiểm toán của Jupiter ghi nhận hơn 1 tỷ giá trị mở và đóng vị thế đòn bẩy trong chưa đầy 24 giờ trên SOL, BTC và ETH. Đây là tổng giá trị giao dịch, không phải vốn, và các khoản chi trả đến từ một quỹ chung duy nhất của nền tảng. Rủi ro lưu ký và sự phân hóa của các quỹ ETF đang kéo theo hai hướng trái ngược, còn diễn biến thị trường đang nghiêng về thận trọng ở mức 80.967. Lúc này, điều gì quan trọng hơn với bạn: an toàn khi tự lưu ký hay dòng tiền từ các tổ chức? Mỗi ngày nhóm đều đăng thêm các phân tích như thế này, và bạn có thể xem cách tham gia trong phần tiểu sử của tôi. #Phân tích giá BTC# #Dự đoán giá Bitcoin: Bước đi tiếp theo của Bitcoin là gì?# #Góc nhìn vĩ mô#
Niềm tin vào ví phần cứng bị lung lay trong khi các quỹ ETF $BTC vẫn giữ được phần lớn dòng tiền tháng 9 🔐 1⃣ Cảnh báo về chuỗi cung ứng: Một chiếc Ledger Nano X mua từ nhà bán lẻ ở Đức được cho là đã bị phát hiện cài thiết bị có thể đọc và truyền cụm từ khôi phục trong quá trình thiết lập. Công cụ kiểm tra thiết bị chính hãng của Ledger có thể không phát hiện được kiểu sửa đổi này, còn các trang lừa đảo đã bắt chước quy trình cập nhật của Ledger để đánh cắp cụm từ hạt giống. 2⃣ Nhu cầu ETH rạn nứt: Các quỹ ETF Ether giao ngay tại Mỹ ghi nhận dòng tiền rút ra 924,5 triệu từ ngày 1 đến ngày 16 tháng 10, xóa sạch hơn cả mức dòng tiền vào 825,3 triệu của tháng 9, với dòng tiền rút ra trong 11 trên 12 phiên. Các quỹ ETF Bitcoin mất 614,7 triệu nhưng vẫn giữ được phần lớn dòng tiền vào 2,65 tỷ của tháng 9. 3⃣ Đòn bẩy xoay vòng: Bản beta Yolo chưa được kiểm toán của Jupiter ghi nhận hơn 1 tỷ giá trị mở và đóng vị thế đòn bẩy trong chưa đầy 24 giờ trên SOL, BTC và ETH. Đây là tổng giá trị giao dịch, không phải vốn, và các khoản chi trả đến từ một quỹ chung duy nhất của nền tảng. Rủi ro lưu ký và sự phân hóa của các quỹ ETF đang kéo theo hai hướng trái ngược, còn diễn biến thị trường đang nghiêng về thận trọng ở mức 80.967. Lúc này, điều gì quan trọng hơn với bạn: an toàn khi tự lưu ký hay dòng tiền từ các tổ chức? Mỗi ngày nhóm đều đăng thêm các phân tích như thế này, và bạn có thể xem cách tham gia trong phần tiểu sử của tôi. #Phân tích giá BTC# #Dự đoán giá Bitcoin: Bước đi tiếp theo của Bitcoin là gì?# #Góc nhìn vĩ mô#
Đăng nhập để khám phá thêm nội dung
Tham gia cùng người dùng tiền mã hóa toàn cầu trên Binance Square
⚡️ Nhận thông tin mới nhất và hữu ích về tiền mã hóa.
💬 Được tin cậy bởi sàn giao dịch tiền mã hóa lớn nhất thế giới.
👍 Khám phá những thông tin chuyên sâu thực tế từ những nhà sáng tạo đã xác minh.
Email / Số điện thoại
Chủ đề thịnh hành
BinancePick
3M lượt xem
152,171 đang thảo luận
Tham gia #MùaBáoCáoKếtQuảKinhDoanh: Dự đoán kết quả kinh doanh trên Binance Pick, chia sẻ quan điểm trên Binance Square!
Binance Square Official
·409 lượt thích
·342.6k lượt xem
EarningsSeason
5.3M lượt xem
25,852 đang thảo luận
TinFed
350,192 lượt xem
945 đang thảo luận