

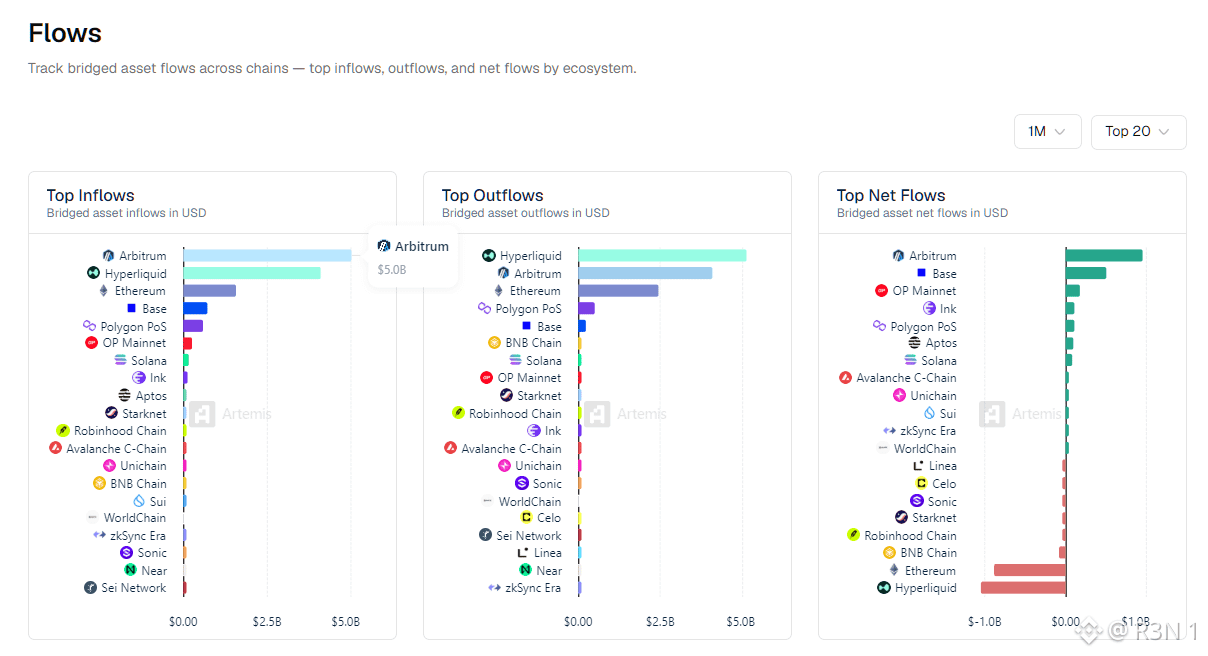
A lot of money moved through the bridges this month, and Hyperliquid was the biggest net loser. Artemis’s one-month bridged flows chart tracks assets moving across chains. Arbitrum had the largest inflows at about $5.0B, with Hyperliquid next at roughly $4.1B and Ethereum at about $1.5B. On outflows, Hyperliquid led at about $5.1B, followed by Arbitrum near $4.1B and Ethereum near $2.4B. Net flows tell the clearer story. Arbitrum came out on top at roughly +$0.95B, followed by Base at about +$0.5B and OP Mainnet at around +$0.2B. The biggest net losers were Hyperliquid at about -$1.0B and Ethereum at about -$0.9B. Notice that Hyperliquid’s net outflow is close to Arbitrum’s net inflow. That’s my inference, not something the chart proves, but a large share of Hyperliquid’s activity flows through Arbitrum, so it looks like money leaving the perp exchange and landing nearby. Both have huge gross numbers because traders move funds in and out constantly. What it could mean: Hyperliquid has had heavy trading, including stock perps drawing volume close to Bitcoin’s. Yet more money left than arrived. It could be winners cashing out, losers leaving, or traders cutting risk after a month of liquidations. The chart can’t say which. Ethereum’s net outflow of around $0.9B fits the same mood. Money is shifting between networks and probably out of risk, with Base and OP picking up some of it. The feeling is cautious. It’s the kind of chart that shows people quietly pulling back, even while headlines focus on volume. The risk is a longer exit if fear stays high. The supportive case is that bridged flows are noisy and can reverse quickly. Big volume doesn’t always mean big conviction. The bridges show where the money actually went. #BTC Price Analysis# $HYPE #Meme Alpha# $ARB
Tham gia cùng người dùng tiền mã hóa toàn cầu trên Binance Square
⚡️ Nhận thông tin mới nhất và hữu ích về tiền mã hóa.
💬 Được tin cậy bởi sàn giao dịch tiền mã hóa lớn nhất thế giới.
👍 Khám phá những thông tin chuyên sâu thực tế từ những nhà sáng tạo đã xác minh.
Email / Số điện thoại