

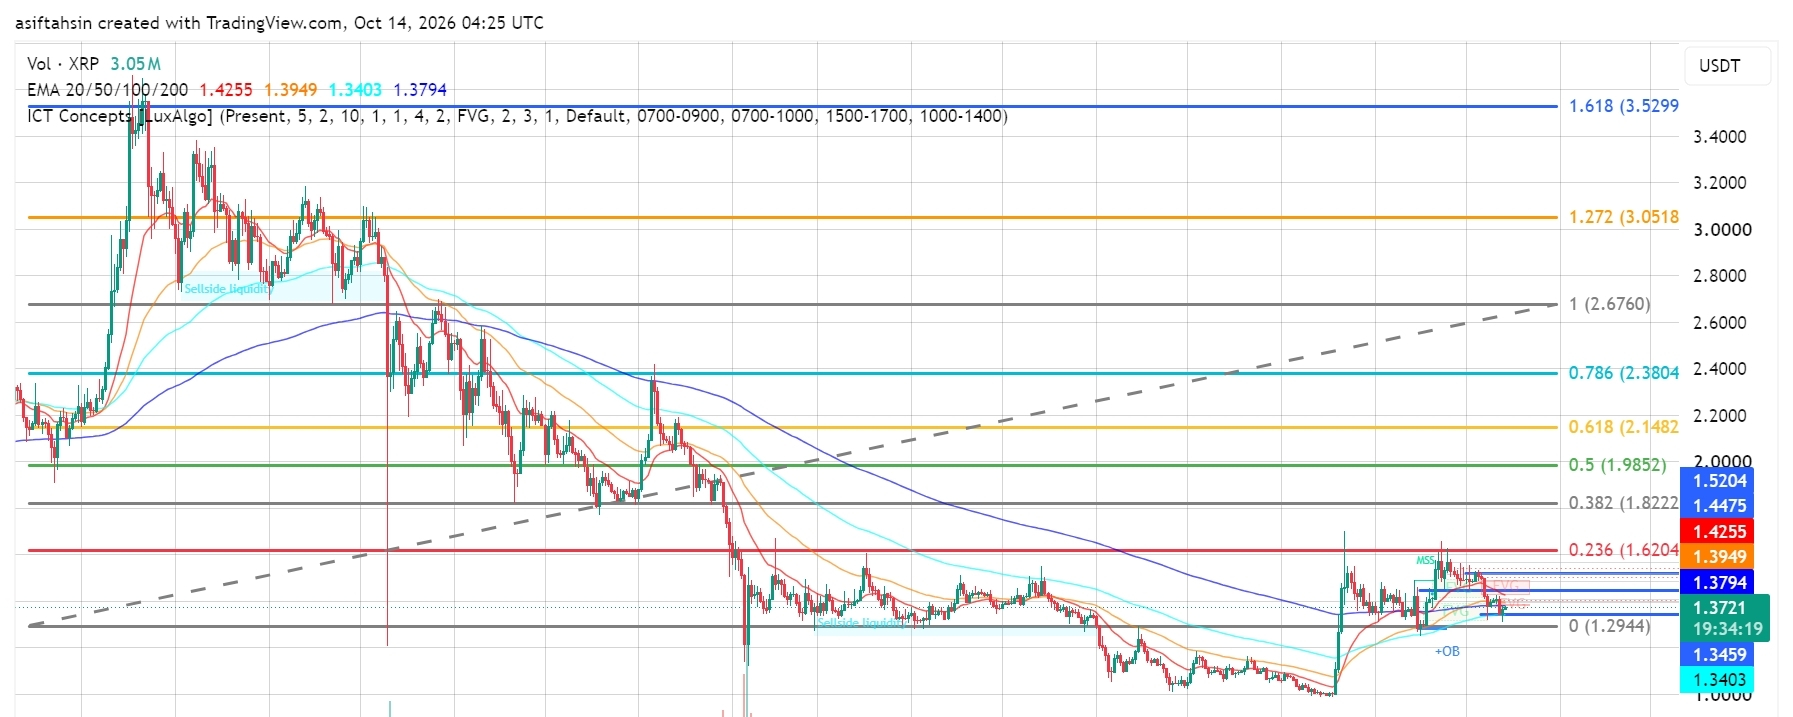

XRP is currently trading around $1.3731, holding above the $1.2944–$1.3459 support region after a sharp recovery from the August low near $1.00.
However, the recovery is facing resistance after XRP failed to sustain its move toward the $1.50 area. Price is now trading below the 20, 50 and 200 EMAs, while the $1.3794–$1.4256 region remains an important resistance zone.
The broader chart still shows a potential recovery structure, but buyers need to reclaim the major moving averages and break above nearby resistance to strengthen the bullish case.
📈 EMA Structure
20 EMA: $1.4256
50 EMA: $1.3949
100 EMA: $1.3404
200 EMA: $1.3794
XRP is trading below the 20 EMA, 50 EMA and 200 EMA, indicating that short-term momentum remains under pressure.
The 20 EMA is also below the 50 EMA, while the 100 EMA near $1.3404 provides an important nearby support reference.
The $1.3794–$1.4256 region is a key recovery zone. Reclaiming this area would improve the short-term structure, while losing the $1.3404 EMA could expose XRP to another test of lower support.
📐 Fibonacci Levels
0: $1.2944
0.236: $1.6204
0.382: $1.8222
0.5: $1.9852
0.618: $2.1482
0.786: $2.3804
1.0: $2.6760
1.272: $3.0518
1.618: $3.5299
XRP is currently holding above the base Fibonacci level at $1.2944, but remains well below the 0.236 Fibonacci resistance at $1.6204.
The immediate challenge is to reclaim the EMA cluster around $1.3794–$1.4256 before attempting a larger recovery.
A sustained move above $1.6204 would represent a more meaningful improvement in the broader structure and bring the higher Fibonacci levels into focus.
🟢 Bullish Scenario
Immediate resistance is around $1.3794, followed by the $1.3949–$1.4256 EMA zone.
A clean breakout and sustained move above $1.4256 could open the path toward:
🎯 $1.4475–$1.5204
🎯 $1.6204
🎯 $1.8222
🎯 $1.9852
🎯 $2.1482
The first step for buyers is to reclaim the EMA cluster and hold it as support.
A sustained breakout above $1.5204 would strengthen the recovery, while a move through $1.6204 could signal a larger bullish expansion toward the $1.82 region.
🔴 Pullback Scenario
Key support levels:
$1.3794 — 200 EMA
$1.3459 — Nearby chart support
$1.3404 — 100 EMA
$1.2944 — Major Fibonacci support
$1.25–$1.27 — Potential lower support zone if the base breaks
The $1.3404–$1.3459 region is particularly important for the current structure.
Holding above this area could allow XRP to consolidate and attempt another recovery. A sustained break below it would weaken the setup and put the $1.2944 support level into focus.
If XRP loses $1.2944 decisively, downside pressure could increase and the market may seek lower support before another recovery attempt develops.
🧠 Market Structure & Liquidity
Liquidity Sweep → Base Formation → Sharp Recovery → Resistance Test → Pullback → Consolidation → Breakout or Breakdown
XRP experienced an extended decline from its previous highs before forming a base near the $1.00 region in August.
The subsequent sharp rebound pushed price back above several short-term levels, but the move toward $1.50 failed to develop into a sustained breakout.
The current consolidation around $1.34–$1.43 is the key decision area.
A reclaim of the EMA cluster could help XRP build a sequence of higher lows and challenge the $1.4475–$1.5204 resistance zone. Conversely, a breakdown below $1.3404 could lead to a liquidity test around $1.2944.
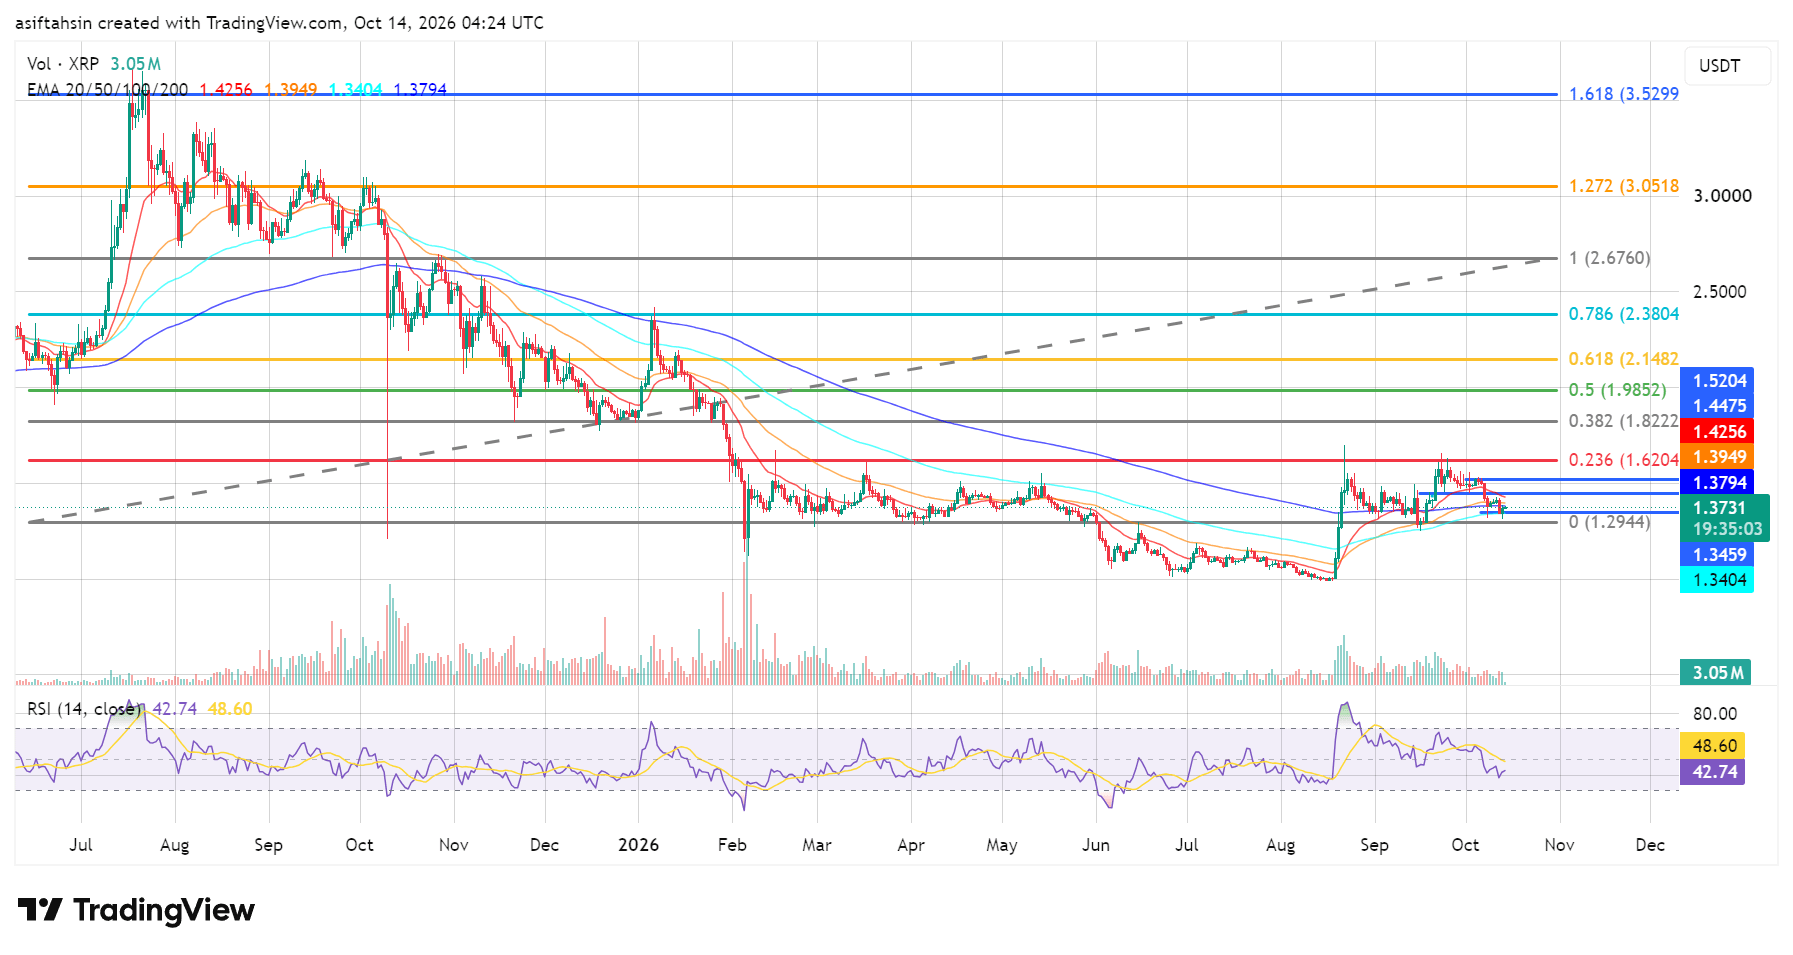
📊 RSI Momentum
RSI: 42.74
RSI MA: 48.60
RSI is below the 50 midpoint and below its moving average, indicating that momentum currently favors sellers.
The RSI is not yet in deeply oversold territory, so further downside remains possible if support breaks.
A recovery above 50, alongside a price reclaim of $1.3949–$1.4256, would provide stronger evidence that buyers are regaining control.
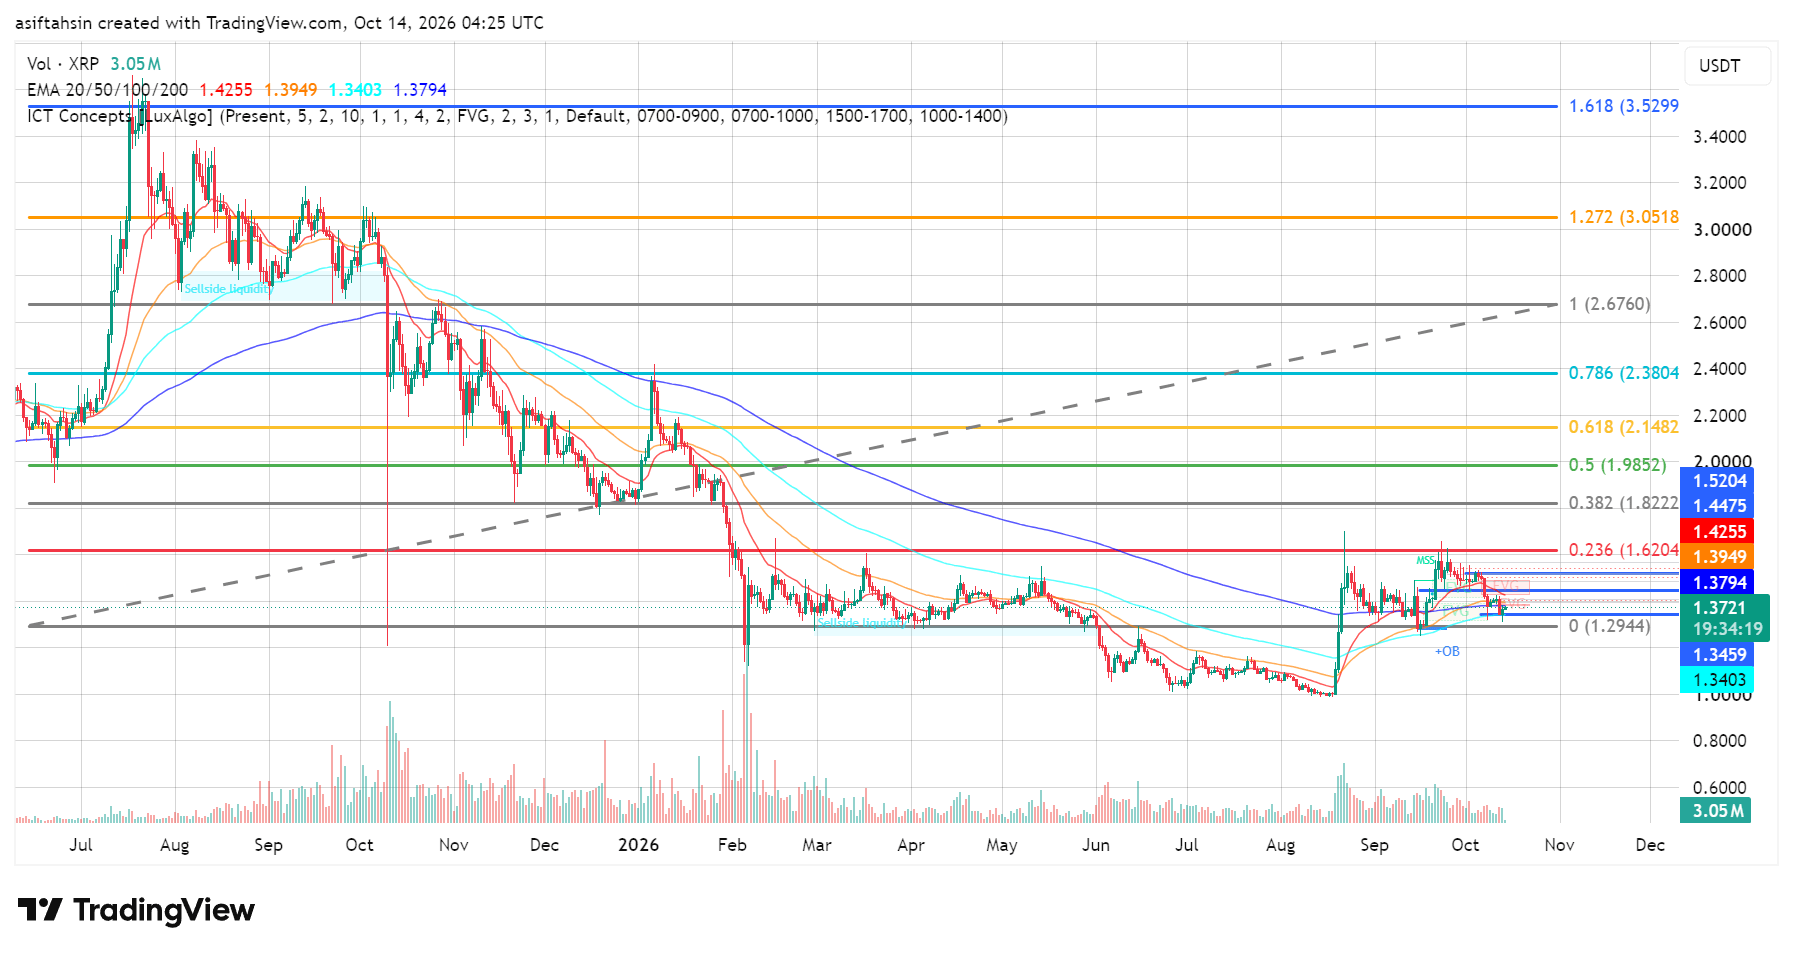
🎯 Key Levels
Resistance:
$1.3794 → $1.3949 → $1.4256 → $1.4475–$1.5204 → $1.6204 → $1.8222
Support:
$1.3459 → $1.3404 → $1.2944
Major EMA Levels:
20 EMA: $1.4256
50 EMA: $1.3949
100 EMA: $1.3404
200 EMA: $1.3794
📌 Final Outlook
XRP's recovery attempt remains under pressure while price trades below the $1.3794–$1.4256 EMA resistance zone.
The immediate battle is between the $1.3404–$1.3459 support region and the EMA cluster overhead.
A sustained reclaim of $1.4256 could open the path toward $1.4475–$1.5204, with $1.6204 as the next major Fibonacci resistance.
On the downside, losing $1.3404 could expose the $1.2944 support level and weaken the broader recovery attempt.
Bias: Neutral to cautiously bearish below $1.4256. Reclaiming the EMA cluster could strengthen recovery momentum, while a breakdown below $1.2944 would increase downside risk.
