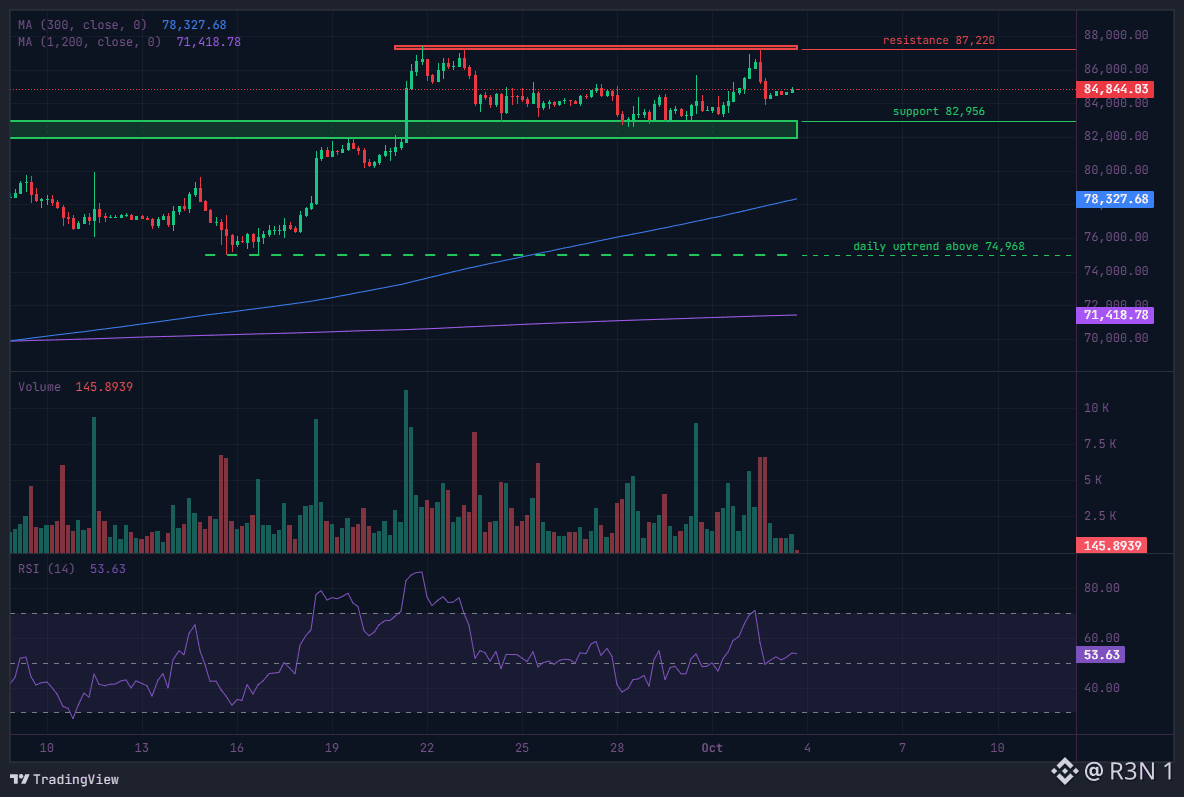
BTC's 18 day move from $74,968 to $87,396 wasn't carried on steadily rising volume, it was carried on bursts, specific candles where real participation showed up, surrounded by quieter stretches in between. That distinction matters more than the headline percentage gain. The 20 candle average volume on the 4 hour chart sits 31.88% above the prior 20 candle average, genuine expansion, but concentrated rather than uniform. The clearest upside burst was 11,227.96 BTC on September 22 as price closed at 84,887, followed by another 8,699 BTC as price extended toward 85,927, a rally with real conviction behind it, not just price drifting up on thin books. Worth noting honestly, volume showed up on the sell side too. 8,305.86 BTC printed September 25 as price pulled back to 83,996, and two separate clusters, 6,577 and 6,586 $BTC , appeared during the rejection from the 87,220 resistance zone on October 2. Genuine two way trading near the highs, not a clean one directional accumulation story. The most recent data points matter most. The last finished 4 hour candle closed at 84,867 on just 1,228 BTC, well below the recent average, participation fading after that resistance rejection. Structurally, price sits above 82,956 support and below 87,220 resistance, daily uptrend still intact above 74,968, while the 4 hour chart has gone flat. My honest read: fading volume right after a rejection from resistance is a reasonable signal to watch, not ignore, it suggests the market's catching its breath rather than mounting an immediate second attempt. The structure still favors higher over lower as long as that daily uptrend holds, but the volume pattern argues for patience over urgency right here. What I'm watching: whether volume reaccelerates on the next approach toward $87,220, or whether this low participation stretch extends and price just grinds sideways instead. #BTC Price Analysis# #BNBChain#


Đăng

--
Tuyên bố miễn trừ trách nhiệm: Nội dung bao gồm cả quan điểm của bên thứ ba, không phải lời khuyên. Có thể sử dụng nội dung do Binance Ai đưa ra nhưng không được đảm bảo. Xem Điều khoản & Điều kiện.