
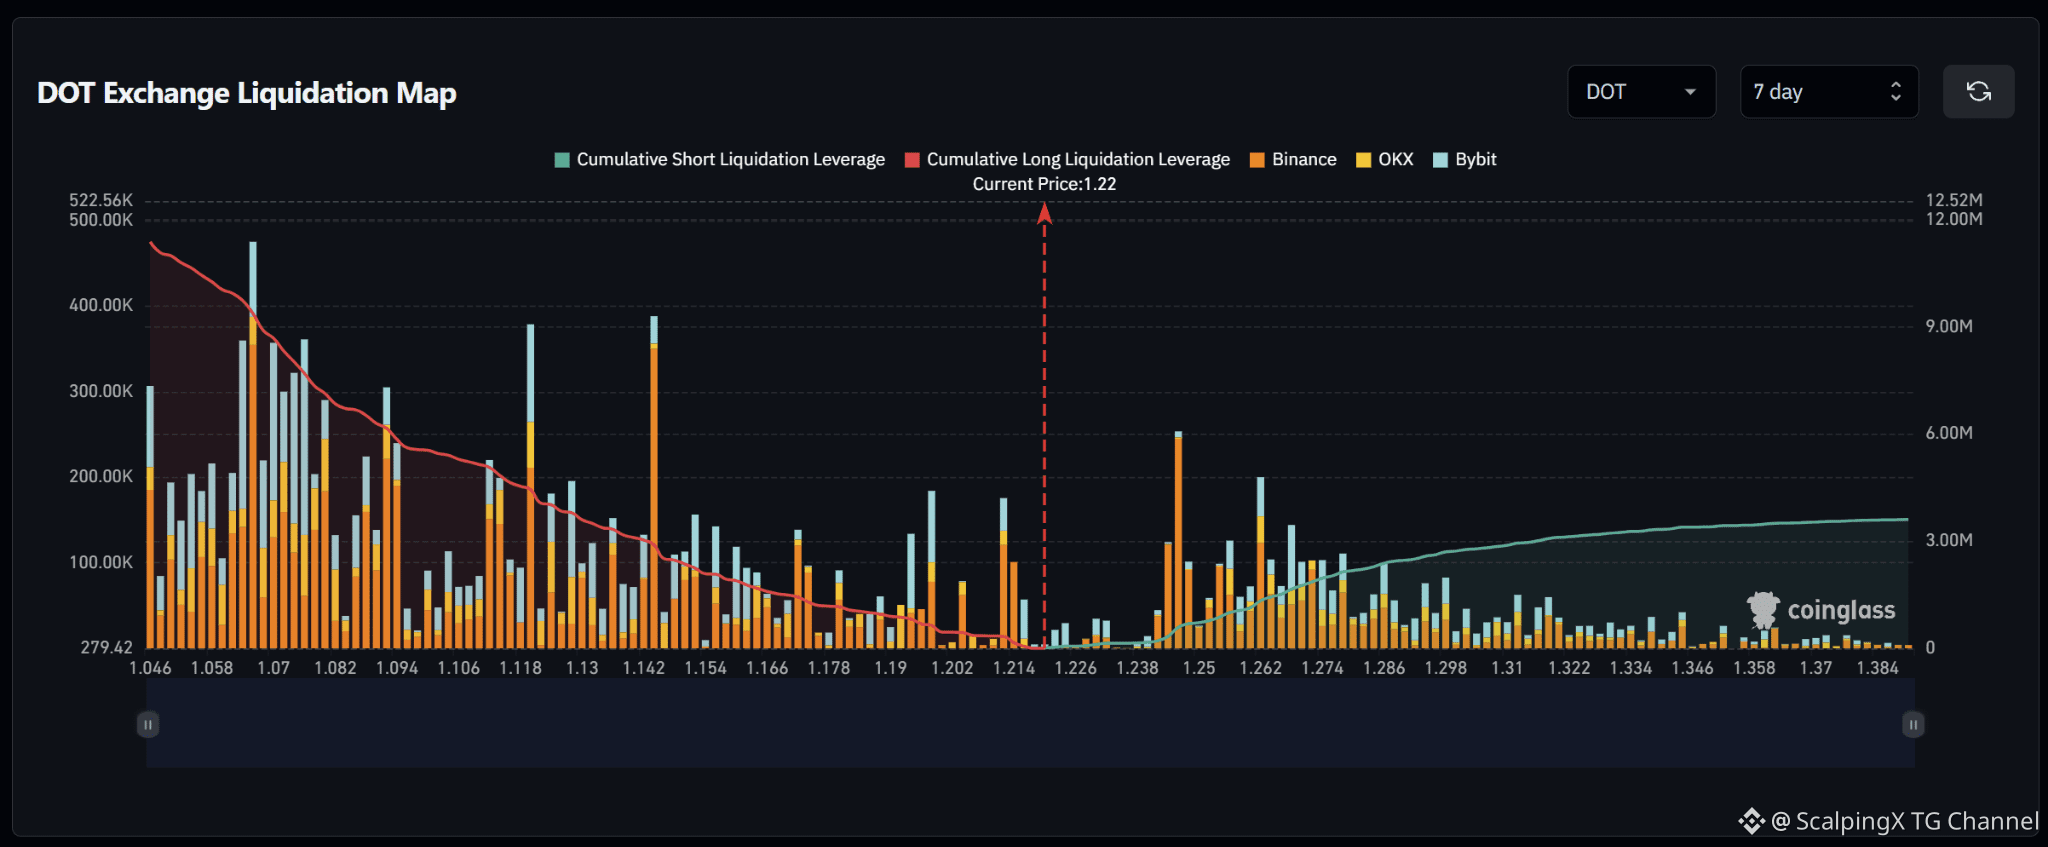
$DOT – Liquidation Map (7 Days) – Current Price 1.22 🔎 The 7-day liquidation map shows roughly 11.5–12 million USD in long liquidations below the current price, far exceeding approximately 3 million USD in short liquidations above. The liquidity structure therefore strongly favors the downside, with nearly four times more cumulative liquidity below the market. 📉 Below the market, long-liquidation liquidity is concentrated heavily across 1.06–1.15. The strongest cluster sits around 1.066–1.070 with a bar near 0.48 million USD; the 1.118–1.120 and 1.142–1.144 areas also contain bars around 0.38–0.39 million USD. Losing 1.214 would shift attention toward 1.202–1.190 and then 1.178–1.166. 📈 Above the market, short-liquidation liquidity is much thinner. The most notable cluster sits around 1.248–1.250 with a bar near 0.25 million USD, while 1.262 and 1.274 hold additional pockets around 0.10–0.20 million USD. Above 1.30, liquidity density gradually declines. 🧭 The broader setup clearly favors the downside because long-liquidation exposure below dominates. Losing 1.214 would increase the probability of a sweep toward 1.202–1.190, followed by 1.178–1.166. Breaking above 1.238 would instead expose 1.248–1.262 before attention shifts toward 1.274.


Đăng
Tuyên bố miễn trừ trách nhiệm: Nội dung bao gồm cả quan điểm của bên thứ ba, không phải lời khuyên. Có thể sử dụng nội dung do Binance Ai đưa ra nhưng không được đảm bảo. Xem Điều khoản & Điều kiện.