
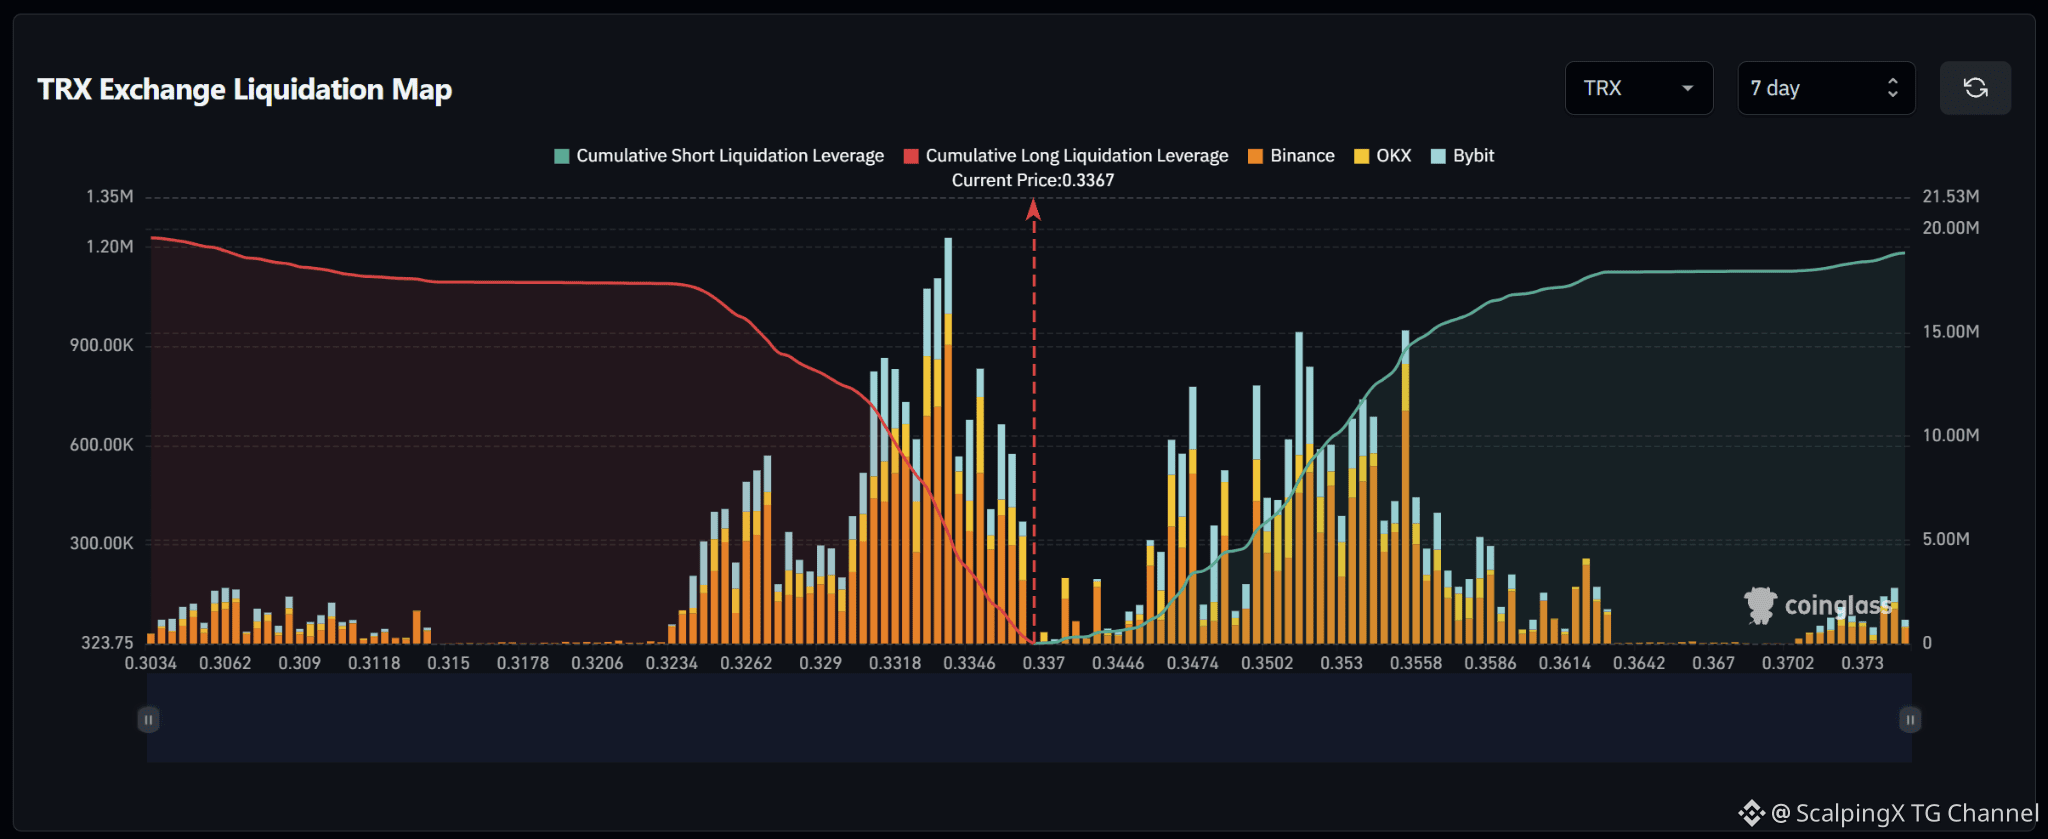
$TRX – Liquidation Map (7 Days) – Current Price 0.3367 🔎 The 7-day liquidation map shows a relatively balanced structure, with both long liquidations below and short liquidations above sitting around 19–20 million USD. Long-liquidation exposure is only slightly larger, giving the map a very mild downside tilt rather than a strong directional imbalance. 📉 Below the market, long-liquidation liquidity is concentrated heavily across 0.326–0.335. The strongest cluster sits around 0.333–0.334 with a bar above 1.2 million USD, while 0.331–0.333 also contains several bars around 0.8–1.1 million USD. Losing 0.331 would shift attention toward 0.329–0.326. 📈 Above the market, short-liquidation liquidity is concentrated mainly across 0.347–0.356. Notable clusters appear around 0.351–0.353 and 0.355–0.356, with several bars near 0.7–0.95 million USD. Liquidity becomes noticeably thinner above 0.359. 🧭 The overall structure is close to balanced. Losing 0.331 would increase the probability of a sweep toward 0.329–0.326. Breaking above 0.347 would instead expose 0.351–0.356 before price enters a thinner liquidity zone.


Đăng
Tuyên bố miễn trừ trách nhiệm: Nội dung bao gồm cả quan điểm của bên thứ ba, không phải lời khuyên. Có thể sử dụng nội dung do Binance Ai đưa ra nhưng không được đảm bảo. Xem Điều khoản & Điều kiện.