

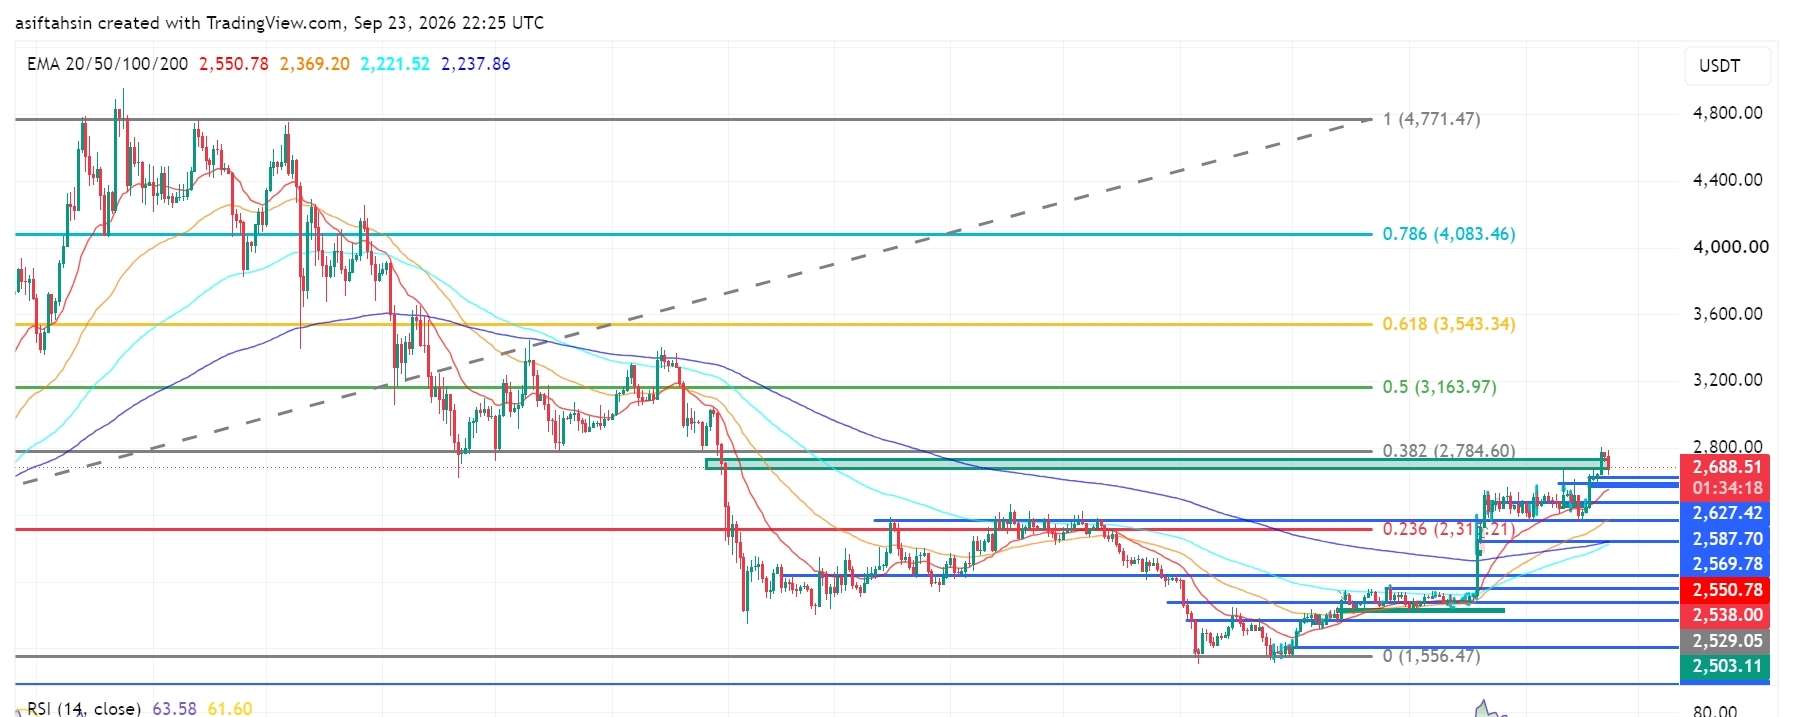

ETH is currently trading around $2,688.51, holding above the $2,627–$2,650 region after the recent breakout from the $2,500–$2,600 consolidation area.
The broader structure has improved significantly, with ETH reclaiming the $2,600–$2,670 zone and now approaching the major $2,784.60 Fibonacci resistance. A sustained breakout above this level would put the higher Fibonacci levels back into focus.
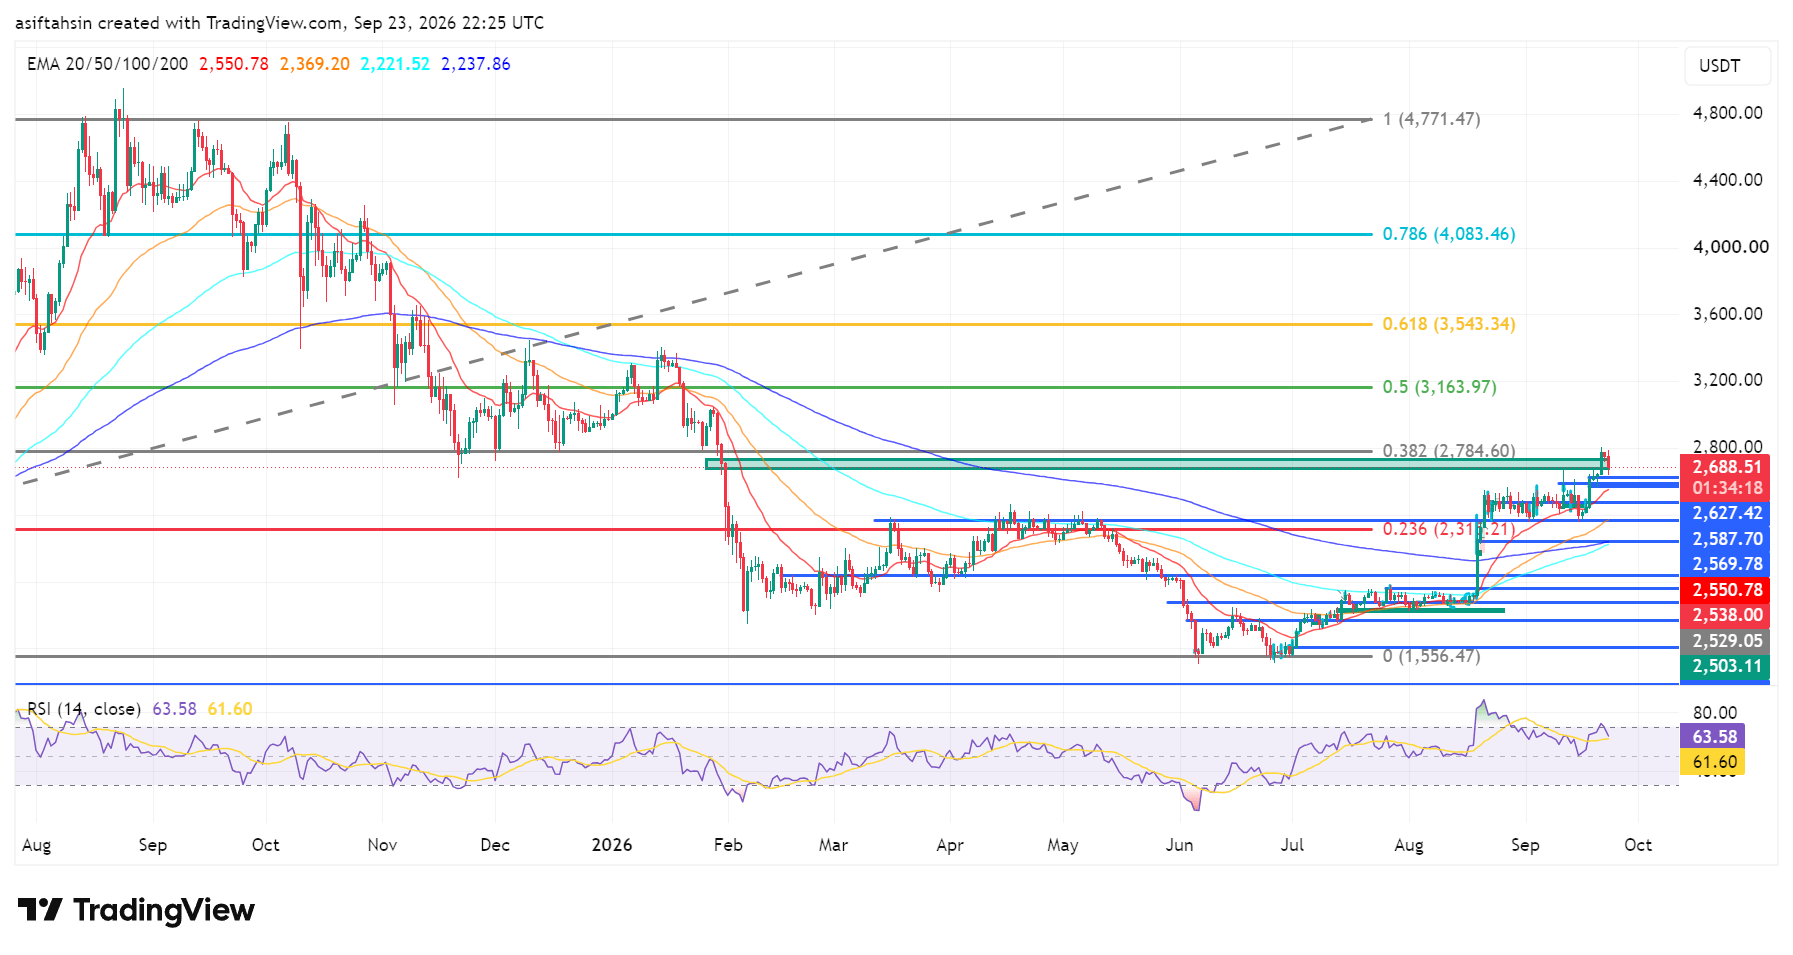
📈 EMA Structure
20 EMA: $2,550.78
50 EMA: $2,369.20
100 EMA: $2,221.52
200 EMA: $2,237.86
ETH is trading well above all four major EMAs.
The 20 EMA remains above the 50 EMA, while the longer-term EMAs are positioned significantly lower. This shows a strong recovery structure with improving short- and medium-term momentum.
The $2,538–$2,551 area is now an important EMA support zone.
📐 Fibonacci Levels
0.236: $2,315.21
0.382: $2,784.60
0.5: $3,163.97
0.618: $3,543.34
0.786: $4,083.46
1.0: $4,771.47
ETH is currently trading above the 0.236 Fibonacci level and approaching the 0.382 level at $2,784.60.
A clean breakout and sustained close above $2,784.60 would shift attention toward $3,163.97.
🟢 Bullish Scenario
Immediate resistance is around:
$2,688 → $2,700 → $2,784.60
A confirmed breakout above $2,784.60 could open the path toward:
$3,163.97 → $3,543.34 → $4,083.46 → $4,771.47
The $3,163.97 level is the next major Fibonacci objective. If ETH can reclaim $2,784.60 and successfully retest it as support, the continuation structure would become stronger.
🔴 Pullback Scenario
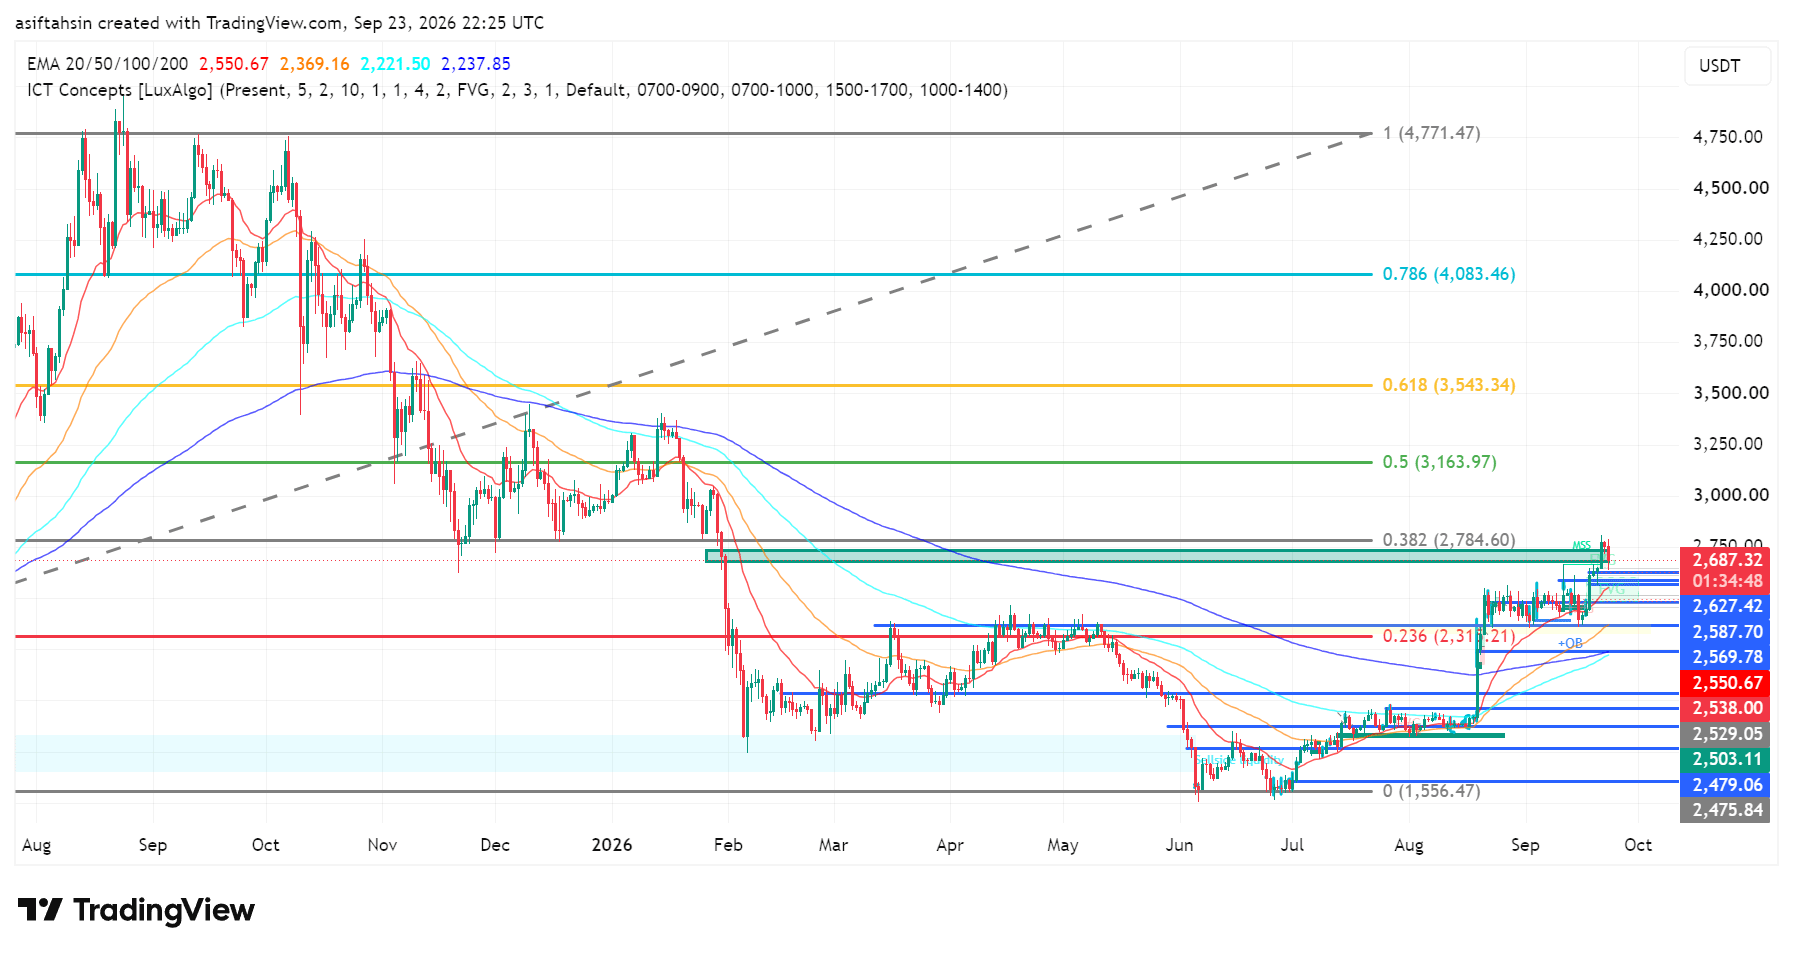
Key support levels:
$2,687.32
$2,627.42
$2,587.70
$2,569.78
$2,550.78
$2,538.00
$2,529.05
$2,503.11
$2,479.06
$2,475.84
The $2,570–$2,630 zone is particularly important for a healthy retest.
Holding this region would keep the current breakout structure constructive. A deeper move toward $2,538–$2,551 could still represent a normal pullback into EMA support.
A sustained move below $2,500 would weaken the current recovery structure.
🧠 Market Structure & Liquidity
Liquidity Sweep → Accumulation → Higher Lows → Breakout → Expansion → Retest → Consolidation → Continuation
ETH has transitioned from the major decline into a clear recovery structure.
The recent move above the $2,600–$2,670 region created a new expansion phase, and price is now testing the upper boundary near $2,784.60.
📊 RSI Momentum
RSI: 63.58
RSI MA: 61.60
RSI remains above 60 and above its moving average, showing positive momentum without currently being in an extreme overbought zone.
This leaves room for further upside momentum if ETH can break and hold above $2,784.60.
🎯 Key Levels
Resistance:
$2,688 → $2,700 → $2,784.60 → $3,163.97 → $3,543.34 → $4,083.46
Support:
$2,627.42 → $2,587.70 → $2,569.78 → $2,550.78 → $2,538.00 → $2,529.05 → $2,503.11 → $2,479.06
Major EMA Support:
$2,550.78 / $2,369.20 / $2,237.86 / $2,221.52
📌 Final Outlook
ETH has strengthened considerably after reclaiming the $2,600–$2,670 region and is now trading near $2,688, directly below the major $2,784.60 Fibonacci resistance.
The key battle is now $2,700–$2,784.60.
A sustained breakout above $2,784.60 could open the path toward $3,163.97, followed by $3,543.34 and $4,083.46.
On the downside, $2,570–$2,630 is the first major retest zone, while $2,538–$2,551 remains important EMA support.
Bias: Recovery structure remains strong above $2,500. Sustained above $2,784.60 could open the path toward $3,163.97, with $3,543.34 as the next major Fibonacci level.
